hydrological controls on the tropospheric ozone greenhouse ... · – increase of global t and...
TRANSCRIPT

Hydrological controls on the tropospheric ozone greenhouse gas effect
Le (Elva) Kuai1, Kevin W. Bowman2, Helen Worden3, Robert L. Herman2, Susan S. Kulawik4
1
NASASounderScienceTeamMeeting13-16September,2016|Greenbelt
1. JIFRESSE/UCLA;2. JPL/Caltech;3. NCAR;4. BAERInstitute/NASAAmes;

2
Largeuncertaintiesintroposphericozoneradiative forcing
08:32 2
WallingtonTJetal.PNAS2010;107:E178-E179
IPCCAR5
• Theestimatedradiative forcing(RF)oftroposphericO3 rangewidelyfrom+0.2to+0.6Wm-2.
• Thisrangeiscomputedusingvarietiesofchemical-climatemodels.• 97%oftheO3 longwaveRFisduetotheozoneabsorptioninthe9.6 μmband[Rothman
etal.,1987].

3
InstantaneousRadiative Kernels(IRK):
ObjectivesandMotivations
• Attribute the TOA band flux change/bias due to dominant physical quantities.
ΔFTOA =∂FTOA∂O3
ΔO3 +∂FTOA∂Tsur
ΔTsur +∂FTOA∂Tatm
ΔTatm +∂FTOA∂H2O
ΔH2O +∂FTOA∂τ cloud
Δτ cloud + rs
9.6μmbandfluxchange
O3 Surfacetemperature
Atmos.temperature
Watervapor
Cloud residual
IRKO3(z) =
∂FTOA(q)∂O3(z)
CO2
H2O, N2O O3
AURATES(TroposphericEmissionSpectrometer)
L1BOzoneBandflux

4
InstantaneousRadiative Kernels(IRK):
ObjectivesandMotivations• Attribute the TOA flux change due to
dominant physical quantities.
• Understand the dependence of O3 IRK variation on H2O, temperature, and clouds.
IRKO3(z) =
∂FTOA(q)∂O3(z)
ΔFTOA =∂FTOA∂O3
ΔO3 +∂FTOA∂Tsur
ΔTsur +∂FTOA∂Tatm
ΔTatm +∂FTOA∂H2O
ΔH2O +∂FTOA∂τ cloud
Δτ cloud + rs
9.6μmbandfluxchange
O3 Surfacetemperature
Atmos.temperature
Watervapor
Cloud residual
HydrologicalCycleTroposphericO3GHGeffect

ΔFTOA =∂FTOA∂O3
ΔO3 +∂FTOA∂Tsur
ΔTsur +∂FTOA∂Tatm
ΔTatm +∂FTOA∂H2O
ΔH2O +∂FTOA∂τ cloud
Δτ cloud + rs
9.6μmbandfluxchange
O3 Surfacetemperature
Atmos.temperature
Watervapor
Cloud residual
5
InstantaneousRadiative Kernels(IRK):
ObjectivesandMotivations
IRKO3(z) =
∂FTOA(q)∂O3(z)
• Attribute the TOA flux change due to dominant physical quantities.
• Understand the dependence of O3 IRK variation on H2O, temperature, and clouds.
RH = ew (H2O,P)e*w (T,P)
HydrologicalCycleTroposphericO3GHGeffect
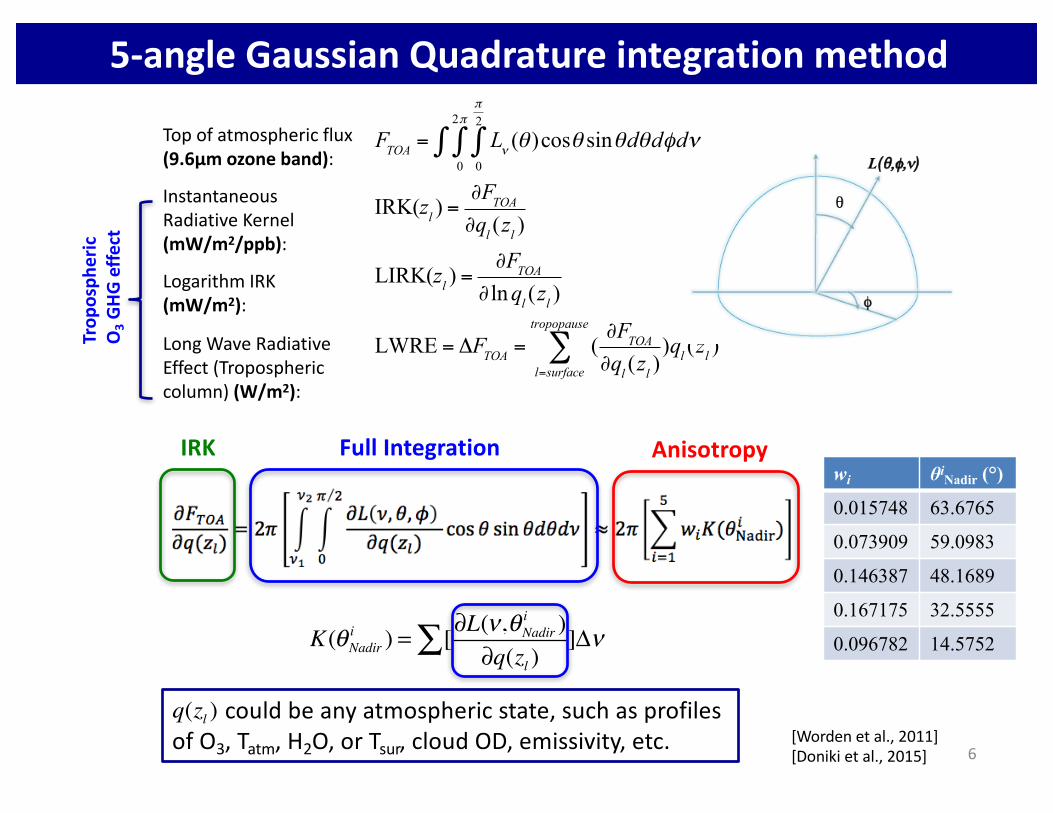
5-angleGaussianQuadratureintegrationmethod
FTOA = Lν0
π2
∫0
2π
∫∫ (θ )cosθ sinθdθdφdν
IRK(zl ) =∂FTOA∂ql (zl )
LIRK(zl ) =∂FTOA
∂lnql (zl )
LWRE = ΔFTOA = (∂FTOA∂ql (zl )
)qll=surface
tropopause
∑ (zl )
Topofatmosphericflux(9.6μmozoneband):
InstantaneousRadiative Kernel(mW/m2/ppb):
LogarithmIRK(mW/m2):
LongWaveRadiativeEffect(Troposphericcolumn)(W/m2):
FullIntegration AnisotropyIRKwi θiNadir (°)
0.015748 63.6765
0.073909 59.0983
0.146387 48.1689
0.167175 32.5555
0.096782 14.5752K(θNadiri ) = [∂L(ν,θNadir
i )∂q(zl )
]Δν∑
couldbeanyatmosphericstate,suchasprofilesofO3,Tatm,H2O,orTsur,cloudOD,emissivity,etc. [Wordenetal.,2011]
[Doniki etal.,2015] 6
Trop
osph
eric
O3GH
Geffect
q(zl )

TroposphericozoneGHGeffect
• TwosecondarystrongfluxsensitivityinLIRKisnearsubtropicalmidanduppertroposphereinbothhemispheres.
• HighestLWREoverMiddleEast duringborealsummer(>1Wm-2).
• SubtropicalmaximumandtropicallowinLWRE.
7
2006
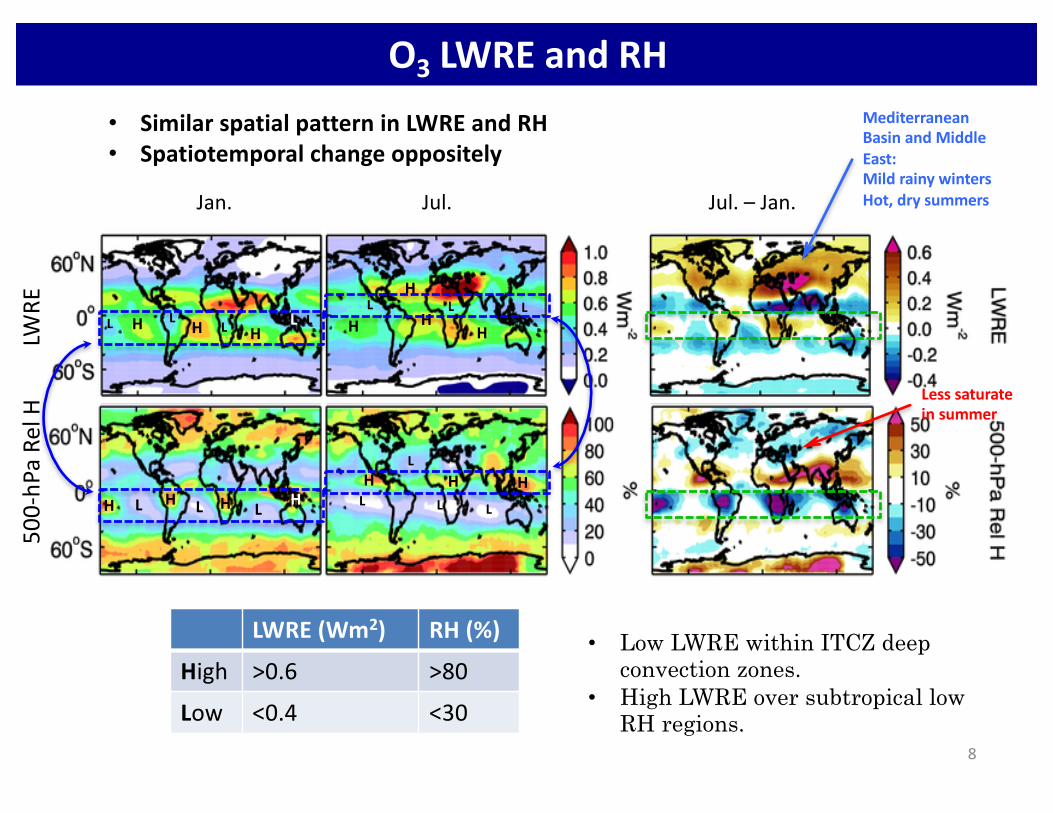
O3 LWREandRH
L L L
MediterraneanBasinandMiddleEast:MildrainywintersHot,drysummers
L L L
8
H H H
L
• SimilarspatialpatterninLWREandRH• Spatiotemporalchangeoppositely
LWRE(Wm2) RH(%)
High >0.6 >80
Low <0.4 <30
• Low LWRE within ITCZ deep convection zones.
• High LWRE over subtropical low RH regions.
H H HH
500-hP
aRe
lHLW
RE
L LL L
HLH H H H
H
H
Jan. Jul. Jul.– Jan.
L L L
Lesssaturateinsummer

O3 LWREandRH
L L L
MediterraneanBasinandMiddleEast:MildrainywintersHot,drysummers
L L L
9
H H H
L
Higherwateramountinsummer
H H H
• SimilarspatialpatterninLWREandRH• Spatiotemporalchangeoppositely
H2Ocol50
0-hP
aRe
lHLW
RE
L LL L
HLH H H H H
H
Jan. Jul. Jul.– Jan.
L L L
Lesssaturateinsummer

O3 LWRE,TroposphericO3 column,&Tsur
L
10
Jan. Jul. Jul.– Jan.
• Australia highLWREinJan.isduetohigherTsur becauselargethermalcontrastamplifythesensitivity.• MiddleEastLWREmaximumalsorelevanttosummerO3 enhancement(Lietal.,2001;Liuetal.,2009)and
highTsur.• AfricasavannahighLWREinJan.isrelatedtobiomassburningandO3 enhancement.• CongobasinhighLWREinJul.isduetoO3 enhancement.
T sur
O3TR
OPcolumnLW
RE

S.Tropicsbelt(0°~25°S)(January)
11
In January, at central Pacific, Amazon, Congo basin, and Indonesia, deepconvection zones correspond to low ozone flux sensitivity.
The Walker circulation is the primary driver for the deep convection zones attropical central Pacific.
Longitude– altitudeview
L
RH LWRE
• ITCZinS.Tropics |Jan.• ITCZinN.Tropics |Jul.
CentralPacific
Amazon Congobasin
Indonesia
LLL

N.Tropicsbelt(0°~5°N)(July)
E.TropicalPacific
SoutheastAsia
12
L
Africasavanna
Longitude– altitudeview
RH
High RH at E. Tropical Pacific and moderate high RH at Africa savanna areanother two places corresponding to low LIRK.
In July, Asian monsoon is the primary driver to bring deep convection andheavy precipitation to India and southeast Asia, where LIRK are found low.
• ITCZinS.Tropics |Jan.• ITCZinN.Tropics |Jul.
HLL
LWRE
H HH L

Latitude– altitudeview
• Similar anti-correlation between RH and Ozone LIRK.
• Two mid tropospheric maximum in Ozone LIRK correspond to thesubtropical arid regions where the tropopause tends to sink and thedownwelling of Hadley cell dominants.
13

14
TroposphericO3 GHGeffect
H2O& Cloud
Tsur andTatm
Atmosphericopacity
Thermalcontrast
RelativeHumidity(RH)
TroposphericO3
MiddleEast(Jul.)
• C.TropicalPacific,Amazonbasin,Congobasin,Indonesia(Jan.)
• E.TropicalPacific,Savanna,SoutheastAsia(Jul.)
Australia(Jan.)
Savanna(Jan.)Congobasin(Jul.)
StrongGHGeffectRHlow
WeakGHGeffectRHhigh
H2O,cloud,T,O3 signaturesonO3 GHGeffect
High
Low
Attenuate
Strengthen

Conclusions• The tropospheric O3 GHG effect is low in tropics but maximized in
subtropics in both hemisphere.• RH is a useful quantity to help identify the primary driver, the large-
scale circulation, that determine H2O, temperature and clouddistribution. It also helps to understand the hydrological control on thetropospheric O3 GHG effect.
• Tropics:– H2O and clouds cause the low O3 GHG effect.– The primary drivers are walker circulation and Asia summer
monsoon for the deep convection.• Subtropics:
– Surface temperature and O3 enhancement contribute to high O3GHG effect.
– The primary drivers are the descent of tropopause height anddownwelling of Hadley cell.
– The maximum O3 GHG effect are found at Middle East during itshot dry summer (>1 W/m2). Ozone enhancement and high Tsur overdry desert with clear sky.
15

• Hadley cell expansion (Seidel and Randel, 2007)– The width expanding; poleward shift of the downward branch– A shift in the ITCZ farther away from the equator due to the response
to CO2 forcing (Held, 2000; Kang and Lu, 2012; Lu et al., 2007)– Increase of global T and pole-to-equator T gradient (Frierson et al.,
2007)
• Inhabitability of Middle East due to global warming (Pal et al., 2016)– Additional O3 radiative forcing to this region
• The Asia monsoon strengthen (Li et al., 2010; Singh et al., 2014)– Another positive feedback to the Middle East O3 GHG effect
16
Future outlook
Kuai etal.2016submittedtoELEMENTA

17
Thankyou!

18
IASI-TESLWREcomparisons
• IASI=TES ±0.5 ° lat/lon• <6hourtimedifference,2011.07.15

CloudeffectonozoneIRK
19
Wordenetal.,2011:Fig.3
• Clouds significantly reduce the TOA flux sensitivity to O3 in the lowertroposphere compared to the clear sky kernels (Soden et al., 2008).
• Tropical clouds also greatly reduce the mid tropospheric maximum in O3IRK and contribute to tropical low LWRE.
Shrinktoathinnerlayershiftedupwards

ITCZshiftfromsouthofequator tonorthofequatorfromJanuary toJuly.
• InsideITCZbelt:Ø DeepconvectionØ Wet,rainyseason,and
cloudysky• OutsideITCZbelt:
Ø SubsidenceregionØ Aridandclearsky
• January:deepconvectionzoneatcentralPacific,Amazon,S.Africa(Congobasin),andIndonesia.
• July: deepconvectionzoneoccurnorthofequatoratE.TropicalPacific,AfricaSavanna,southeastAsia.
January July
20
TheInterTropicalConvergenceZone(ITCZ)inRHTO
A flu
x
5
00-h
Pa R
H
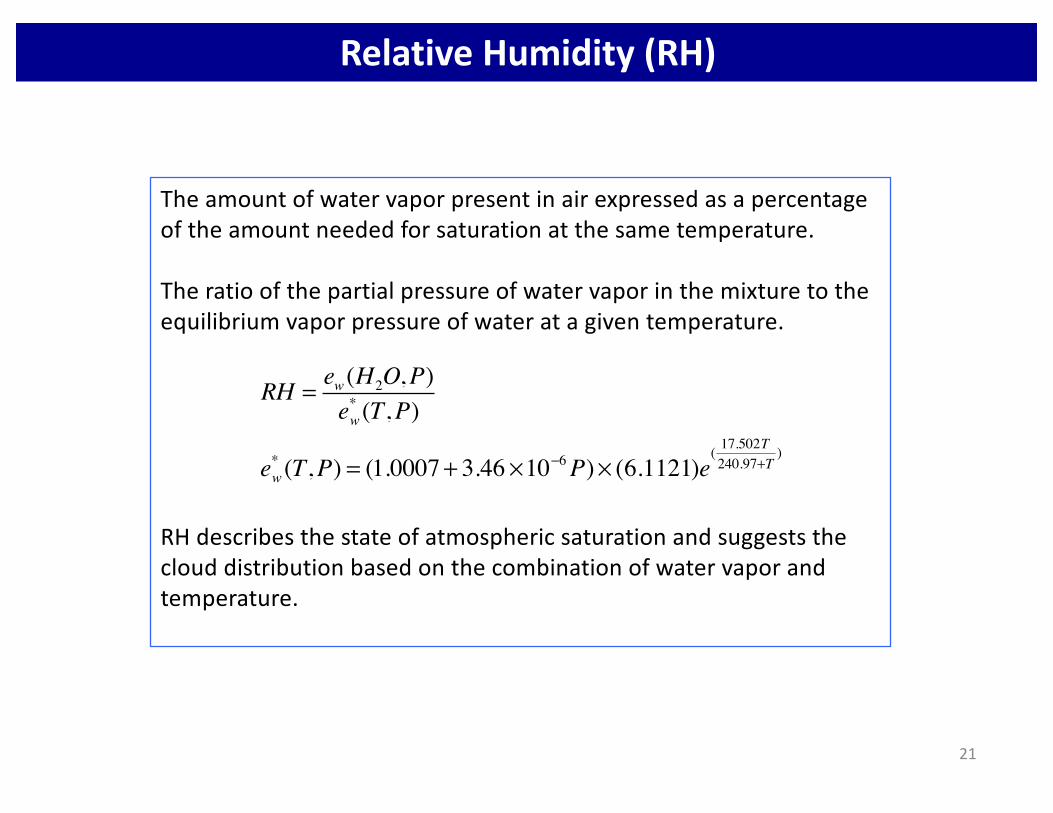
RelativeHumidity(RH)
Theamountofwatervaporpresentinairexpressedasapercentageoftheamountneededforsaturationatthesametemperature.
Theratioofthepartialpressureofwatervaporinthemixturetotheequilibriumvaporpressureofwateratagiventemperature.
RHdescribesthestateofatmosphericsaturationandsuggeststheclouddistributionbasedonthecombinationofwatervaporandtemperature.
RH = ew (H2O,P)e*w (T,P)
e*w (T,P) = (1.0007+ 3.46 ×10⁻⁶P)× (6.1121)e
( 17.502T240.97+T
)
21