hydrological data for the bosque river watershed
TRANSCRIPT

Hydrological Data for the BosqueRiver Watershed
January through December 1998
Jeff Stroebel
TR0001
October 2000
Texas Institute for Applied Environmental ResearchTarleton State University • Box T0410 • Tarleton Station •Stephenville, Texas 76402V254.968.9567• F254.968.9568 • [email protected]
Hydrological Data for the Bosque River Watershed
Acknowledgement
Studies conducted in the Bosque River watershed for the project period (January through December 1998) include a U. S. Environmental Protection Agency (EPA) Clean Water Act Section 319 project directed by the Texas State Soil and Water Conservation Board (TSSWCB) and the Lake Waco-Bosque River Initiative funded by the U. S. Department of Agriculture Natural Resources Conservation Service.
S.04.01
2

Hydrological Data for the Bosque River Watershed
Abstract
The intent of this report is to document the installation and operation of hydrological data collection sites and to provide the hydrological data stored on diskette in digital format. This report provides hydrological data from January 1, 1998 through December 31, 1998.
3

Hydrological Data for the Bosque River Watershed
4

Contents
Chapter 1 Introduction. . . . . . . . . . . . . . . . . . . . . . . . . . . . . . . . . . . . . . . . . . . . . . . . . . . . . . . . . 11
Chapter 2 Automated Sampling Site Locations in the Bosque River Watershed. . . . . . . 13Sampling Sites . . . . . . . . . . . . . . . . . . . . . . . . . . . . . . . . . . . . . . . . . . . . . . . . . . . . . . . . . . . . . . . . . . . 13
Goose Branch (sites GB020, GB025 and GB040). . . . . . . . . . . . . . . . . . . . . . . . . . . . . . . . . . . . 13Green Creek (site GC100) . . . . . . . . . . . . . . . . . . . . . . . . . . . . . . . . . . . . . . . . . . . . . . . . . . . . . . 13Hog Creek (site HC060). . . . . . . . . . . . . . . . . . . . . . . . . . . . . . . . . . . . . . . . . . . . . . . . . . . . . . . . 13Indian Creek (site IC020). . . . . . . . . . . . . . . . . . . . . . . . . . . . . . . . . . . . . . . . . . . . . . . . . . . . . . . 13Meridian Creek (site MC055) . . . . . . . . . . . . . . . . . . . . . . . . . . . . . . . . . . . . . . . . . . . . . . . . . . . 14Methodist Branch (site MB040) . . . . . . . . . . . . . . . . . . . . . . . . . . . . . . . . . . . . . . . . . . . . . . . . . 14Middle Bosque River (site MB060) . . . . . . . . . . . . . . . . . . . . . . . . . . . . . . . . . . . . . . . . . . . . . . 14Neils Creek (site NC060) . . . . . . . . . . . . . . . . . . . . . . . . . . . . . . . . . . . . . . . . . . . . . . . . . . . . . . . 14North Bosque River above Stephenville (site BO020). . . . . . . . . . . . . . . . . . . . . . . . . . . . . . . 14North Bosque River below Stephenville Wastewater Treatment Plant (site BO040) . . . . . 14North Bosque River at Hico (site BO070) . . . . . . . . . . . . . . . . . . . . . . . . . . . . . . . . . . . . . . . . . 15North Bosque River at Clifton (site BO090) . . . . . . . . . . . . . . . . . . . . . . . . . . . . . . . . . . . . . . . 15North Bosque River at Valley Mills (site BO100). . . . . . . . . . . . . . . . . . . . . . . . . . . . . . . . . . . 15North Fork (sites NF005, NF009, and NF020) . . . . . . . . . . . . . . . . . . . . . . . . . . . . . . . . . . . . . 15Sims Creek (site SC020) . . . . . . . . . . . . . . . . . . . . . . . . . . . . . . . . . . . . . . . . . . . . . . . . . . . . . . . . 15South Bosque River (site SB050). . . . . . . . . . . . . . . . . . . . . . . . . . . . . . . . . . . . . . . . . . . . . . . . . 15South Fork (sites SF020 and SF050) . . . . . . . . . . . . . . . . . . . . . . . . . . . . . . . . . . . . . . . . . . . . . . 15Spring Creek (site SP020) . . . . . . . . . . . . . . . . . . . . . . . . . . . . . . . . . . . . . . . . . . . . . . . . . . . . . . 16Tonk Creek (TC020) . . . . . . . . . . . . . . . . . . . . . . . . . . . . . . . . . . . . . . . . . . . . . . . . . . . . . . . . . . . 16Wasp Creek (WC020). . . . . . . . . . . . . . . . . . . . . . . . . . . . . . . . . . . . . . . . . . . . . . . . . . . . . . . . . . 16
Chapter 3 Monitoring Equipment . . . . . . . . . . . . . . . . . . . . . . . . . . . . . . . . . . . . . . . . . . . . . . . 19
Chapter 4 Site Installation and Maintenance . . . . . . . . . . . . . . . . . . . . . . . . . . . . . . . . . . . . . 21
Chapter 5 Data Collection and Analysis. . . . . . . . . . . . . . . . . . . . . . . . . . . . . . . . . . . . . . . . . . 23
References . . . . . . . . . . . . . . . . . . . . . . . . . . . . . . . . . . . . . . . . . . . . . . . . . . . . . . . . . . . . . . . . . . . . 25
Appendix A Average Daily Flow Tables . . . . . . . . . . . . . . . . . . . . . . . . . . . . . . . . . . . . . . . . 27
Appendix B Average Daily Flow Figures . . . . . . . . . . . . . . . . . . . . . . . . . . . . . . . . . . . . . . . . 51
5

Hydrological Data for the Bosque River Watershed
6

Tables
Table 1 Sampling Site Locations and Operation Dates . . . . . . . . . . . . . . . . . . . . . . . . . . . . . . . . . . . . . . . . 21
Table A–1 GB020 Average Daily Flow . . . . . . . . . . . . . . . . . . . . . . . . . . . . . . . . . . . . . . . . . . . . . . . . . . . . 28Table A–2 GB040 Average Daily Flow . . . . . . . . . . . . . . . . . . . . . . . . . . . . . . . . . . . . . . . . . . . . . . . . . . . . 29Table A–3 NF005 Average Daily Flow . . . . . . . . . . . . . . . . . . . . . . . . . . . . . . . . . . . . . . . . . . . . . . . . . . . . 30Table A–4 NF009 Average Daily Flow . . . . . . . . . . . . . . . . . . . . . . . . . . . . . . . . . . . . . . . . . . . . . . . . . . . . 31Table A–5 NF020 Average Daily Flow . . . . . . . . . . . . . . . . . . . . . . . . . . . . . . . . . . . . . . . . . . . . . . . . . . . . 32Table A–6 SF020 Average Daily Flow . . . . . . . . . . . . . . . . . . . . . . . . . . . . . . . . . . . . . . . . . . . . . . . . . . . . 33
Table A–7 SF050 Average Daily Flow . . . . . . . . . . . . . . . . . . . . . . . . . . . . . . . . . . . . . . . . . . . . . . . . . . . . 34Table A–8 BO020 Average Daily Flow . . . . . . . . . . . . . . . . . . . . . . . . . . . . . . . . . . . . . . . . . . . . . . . . . . . . 35Table A–9 MB040 Average Daily Flow . . . . . . . . . . . . . . . . . . . . . . . . . . . . . . . . . . . . . . . . . . . . . . . . . . . . 36Table A–10 BO040 Average Daily Flow . . . . . . . . . . . . . . . . . . . . . . . . . . . . . . . . . . . . . . . . . . . . . . . . . . . 37Table A–11 IC020 Average Daily Flow . . . . . . . . . . . . . . . . . . . . . . . . . . . . . . . . . . . . . . . . . . . . . . . . . . . . 38Table A–12 SC020 Average Daily Flow . . . . . . . . . . . . . . . . . . . . . . . . . . . . . . . . . . . . . . . . . . . . . . . . . . . 39Table A–13 GC100 Average Daily Flow . . . . . . . . . . . . . . . . . . . . . . . . . . . . . . . . . . . . . . . . . . . . . . . . . . . 40Table A–14 SP020 Average Daily Flow . . . . . . . . . . . . . . . . . . . . . . . . . . . . . . . . . . . . . . . . . . . . . . . . . . . 41Table A–15 BO070 Average Daily Flow . . . . . . . . . . . . . . . . . . . . . . . . . . . . . . . . . . . . . . . . . . . . . . . . . . . 42Table A–16 BO090 Average Daily Flow . . . . . . . . . . . . . . . . . . . . . . . . . . . . . . . . . . . . . . . . . . . . . . . . . . . 43Table A–17 NC060 Average Daily Flow . . . . . . . . . . . . . . . . . . . . . . . . . . . . . . . . . . . . . . . . . . . . . . . . . . . 44Table A–18 BO100 Average Daily Flow . . . . . . . . . . . . . . . . . . . . . . . . . . . . . . . . . . . . . . . . . . . . . . . . . . . 45Table A–19 HCO60 Average Daily Flow . . . . . . . . . . . . . . . . . . . . . . . . . . . . . . . . . . . . . . . . . . . . . . . . . . 46Table A–20 MB060 Average Daily Flow . . . . . . . . . . . . . . . . . . . . . . . . . . . . . . . . . . . . . . . . . . . . . . . . . . . 47Table A–21 TC020 Average Daily Flow . . . . . . . . . . . . . . . . . . . . . . . . . . . . . . . . . . . . . . . . . . . . . . . . . . . 48Table A–22 WC020 Average Daily Flow . . . . . . . . . . . . . . . . . . . . . . . . . . . . . . . . . . . . . . . . . . . . . . . . . . 49Table A–23 SB050 Average Daily Flow . . . . . . . . . . . . . . . . . . . . . . . . . . . . . . . . . . . . . . . . . . . . . . . . . . . 50
7

Hydrological Data for the Bosque River Watershed
8

Figures
Figure 1 Bosque River Watershed . . . . . . . . . . . . . . . . . . . . . . . . . . . . . . . . . . . . . . . . . . . . . . . . . . . . . . . . 11Figure 2 Bosque River Watershed Sampling Sites Located Above Hico . . . . . . . . . . . . . . . . . . . . . . . . 17Figure 3 Bosque River Watershed Sampling Sites Located Below Hico . . . . . . . . . . . . . . . . . . . . . . . . 18Figure B–1 GB020 Average Daily Flow . . . . . . . . . . . . . . . . . . . . . . . . . . . . . . . . . . . . . . . . . . . . . . . . . . . . 52Figure B–2 GB040 Average Daily Flow . . . . . . . . . . . . . . . . . . . . . . . . . . . . . . . . . . . . . . . . . . . . . . . . . . . . 53Figure B–3 NF005 Average Daily Flow. . . . . . . . . . . . . . . . . . . . . . . . . . . . . . . . . . . . . . . . . . . . . . . . . . . . 54Figure B–4 NF009 Average Daily Flow. . . . . . . . . . . . . . . . . . . . . . . . . . . . . . . . . . . . . . . . . . . . . . . . . . . . 55
Figure B–5 NF020 Average Daily Flow. . . . . . . . . . . . . . . . . . . . . . . . . . . . . . . . . . . . . . . . . . . . . . . . . . . . 56Figure B–6 SF020 Average Daily Flow . . . . . . . . . . . . . . . . . . . . . . . . . . . . . . . . . . . . . . . . . . . . . . . . . . . . 57Figure B–7 SF050 Average Daily Flow . . . . . . . . . . . . . . . . . . . . . . . . . . . . . . . . . . . . . . . . . . . . . . . . . . . . 58Figure B–8 BO020 Average Daily Flow. . . . . . . . . . . . . . . . . . . . . . . . . . . . . . . . . . . . . . . . . . . . . . . . . . . . 59Figure B–9 MB040 Average Daily Flow . . . . . . . . . . . . . . . . . . . . . . . . . . . . . . . . . . . . . . . . . . . . . . . . . . . 60Figure B–10 BO040 Average Daily Flow. . . . . . . . . . . . . . . . . . . . . . . . . . . . . . . . . . . . . . . . . . . . . . . . . . . 61Figure B–11 IC020 Average Daily Flow . . . . . . . . . . . . . . . . . . . . . . . . . . . . . . . . . . . . . . . . . . . . . . . . . . . 62Figure B–12 SC020 Average Daily Flow . . . . . . . . . . . . . . . . . . . . . . . . . . . . . . . . . . . . . . . . . . . . . . . . . . . 63Figure B–13 GC100 Average Daily Flow. . . . . . . . . . . . . . . . . . . . . . . . . . . . . . . . . . . . . . . . . . . . . . . . . . . 64Figure B–14 SP020 Average Daily Flow . . . . . . . . . . . . . . . . . . . . . . . . . . . . . . . . . . . . . . . . . . . . . . . . . . . 65Figure B–15 BO070 Average Daily Flow. . . . . . . . . . . . . . . . . . . . . . . . . . . . . . . . . . . . . . . . . . . . . . . . . . . 66Figure B–16 BO090 Average Daily Flow. . . . . . . . . . . . . . . . . . . . . . . . . . . . . . . . . . . . . . . . . . . . . . . . . . . 67Figure B–17 NC060 Average Daily Flow . . . . . . . . . . . . . . . . . . . . . . . . . . . . . . . . . . . . . . . . . . . . . . . . . . 68Figure B–18 BO100 Average Daily Flow. . . . . . . . . . . . . . . . . . . . . . . . . . . . . . . . . . . . . . . . . . . . . . . . . . . 69Figure B–19 HC060 Average Daily Flow . . . . . . . . . . . . . . . . . . . . . . . . . . . . . . . . . . . . . . . . . . . . . . . . . . 70Figure B–20 MB060 Average Daily Flow . . . . . . . . . . . . . . . . . . . . . . . . . . . . . . . . . . . . . . . . . . . . . . . . . . 71Figure B–21 TC020 Average Daily Flow . . . . . . . . . . . . . . . . . . . . . . . . . . . . . . . . . . . . . . . . . . . . . . . . . . . 72Figure B–22 WC020 Average Daily Flow . . . . . . . . . . . . . . . . . . . . . . . . . . . . . . . . . . . . . . . . . . . . . . . . . . 73Figure B–23 SB050 Average Daily Flow . . . . . . . . . . . . . . . . . . . . . . . . . . . . . . . . . . . . . . . . . . . . . . . . . . . 74
9

Hydrological Data for the Bosque River Watershed
10

CHAPTER 1
Introduction
Since summer 1990, the Texas Institute for Applied Environmental Research (TIAER) at Tarleton State University, Stephenville, Texas has been conducting studies of environmental impacts on surface water quality as a result of nonpoint source runoff. The studies have focused on the Upper North Bosque River (UNBR) watershed in Erath and northern Hamilton counties, Texas. Additional studies initiated by TIAER since 1996 have necessitated expansion of automated sampling sites to include the entire Bosque River (or Lake Waco) watershed (Figure 1).
Figure 1 Bosque River Watershed
The Bosque River watershed encompasses 1,660 square miles in north central Texas, all draining into Lake Waco. Lake Waco provides flood control and supplies drinking water for approximately 140,000 people. Major tributaries within the Bosque River watershed include the North Bosque River, Hog Creek, Middle Bosque River, and South Bosque River. The North Bosque River basin comprises about 74 percent of the total drainage area. Statewide attention has focused on the Bosque River watershed largely as the result of the prominent dairy industry in the northern portion of the watershed. The state nonpoint source (NPS) pollution assessment conducted in 1990 identified the North Bosque River as a "known" problem watershed as the result of the dairy waste (TWC & TSSWCB, 1991). While most attention has focused on the North Bosque River, elevated nitrogen levels associated with NPS from agricultural operations are indicated as "the most serious threat to maintaining stream water quality" in the Middle and South Bosque Rivers (TNRCC, 1996).
11

Hydrological Data for the Bosque River Watershed
12

CHAPTER 2
Automated Sampling SiteLocations in the Bosque River
Watershed
Sampling SitesThe locations of sampling sites within the Bosque River watershed are indicated in Figures 2 and 3. Site names are intended to describe the station at which the monitoring equipment is located. All sampling sites are labeled using a five-character alphanumeric code. The first two letters specify the tributary or river, on which the site is located, while the last three digits indicate the relative location of the site. Lower numeric values indicate sites nearer the headwaters, while large numeric values indicate sites further downstream. The location and brief description of each of the sampling locations in the Bosque River watershed are provided below.
Goose Branch (sites GB020, GB025 and GB040)These automated sampling sites are located in the Goose Branch microwatershed of the South Fork of the North Bosque River, northwest of Stephenville, Texas. GB020 is located near County Road (CR) 297, while GB025 and GB040 are located on private property away from public roads. GB025 and GB040 are located on the two tributaries of Goose Branch, both of which flow into the same Public Law 566 (PL566) reservoir.
Green Creek (site GC100)GC100 is an automated sampling site located on Green Creek near CR 266 in Clairette, Texas, just upstream of the confluence with the North Bosque River.
Hog Creek (site HC060)HC060 is an automated sampling site located on Hog Creek at the crossing of Farm-to-Market (FM) Road 185 near United States Geological Survey (USGS) station 0895400, about six miles east of Crawford, Texas. This site is approximately 10 miles upstream of Lake Waco.
Indian Creek (site IC020)IC020 is an automated sampling site located near U.S. Highway 281 on Indian Creek, which flows into the upper North Bosque River between Stephenville and Hico. Automated
13

Hydrological Data for the Bosque River Watershed
sampling was discontinued on March 3, 1998. Sampling is now limited to routine biweekly sampling and rainfall data collection.
Meridian Creek (site MC055)MC055 is an automated sampling site located on Meridian Creek near State Highway 6 just upstream from the confluence of Meridian Creek with the North Bosque River. Automated sampling stopped on March 16, 1998 when high water level and floating debris destroyed the sampling location.
Methodist Branch (site MB040)MB040 is an automated sampling site located on Methodist Branch within the city of Stephenville, just above the city park. The drainage area above this site is entirely urban and includes most of the downtown section of Stephenville. MB040 is located in a concrete, rectangular channel and is generally dry between storm events.
Middle Bosque River (site MB060)MB060 is an automated sampling site located on the Middle Bosque River, east of Crawford, Texas, at the crossing of FM Road 185, approximately 12 miles upstream from Lake Waco.
Neils Creek (site NC060)NC060 is an automated sampling site located on Neils Creek at State Highway 6 just above the confluence of Neils Creek with the North Bosque River, between Clifton and Valley Mills.
North Bosque River above Stephenville (site BO020)BO020 is an automated sampling site located on the North Bosque River, at the crossing of State Highway 8 on the northeast boundary of Stephenville. The automated sampling site is located just below the confluence of the North and South Forks which form the North Bosque River.
North Bosque River below Stephenville Wastewater Treatment Plant (site BO040)
BO040 is an automated sampling site located on the North Bosque River approximately one quarter mile below the wastewater treatment plant (WWTP), which is the only site located immediately below a municipal WWTP discharge. The site is located at the crossing of CR 454, about five miles below site BO020.
14

Chapter 2 Automated Sampling Site Locations in the Bosque River Watershed
North Bosque River at Hico (site BO070)BO070 is an automated sampling site located near USGS station 08094800 on the North Bosque River at the crossing of U.S. Highway 281 in Hico, Texas. BO070 is located approximately 21 miles downstream of site BO040.
North Bosque River at Clifton (site BO090)BO090 is an automated sampling site located near USGS station 08095000 on the North Bosque River at the crossing of FM Road 219, about one half mile northeast of Clifton, Texas. BO090 is approximately 45 miles downstream of site BO070 and above the city of Clifton WWTP discharge.
North Bosque River at Valley Mills (site BO100)BO100 is an automated sampling site located south of the USGS station 08095200 on the North Bosque River near the crossing of FM Road 56 northeast of Valley Mills. This site is located approximately 12 miles downstream of site BO090 and about 28 miles upstream from the mouth of the North Bosque River at Lake Waco. The discharge for the Valley Mills WWTP is located downstream of site BO100.
North Fork (sites NF005, NF009, and NF020)These three automated sampling sites are located in the North Fork subwatershed. The North Fork joins the South Fork in northern Stephenville to form the North Bosque River. Sites NF009 and NF020 are located on separate tributaries flowing into a PL-566 reservoir. Site NF020 is located on the Scarborough Creek tributary at CR423. NF005 is located upstream of site NF020. Site NF009 is located on an unnamed tributary near CR423. The NF009 automated sampler was off-line from March 25, 1998 to June 12, 1998 due to a temporary cutback in automated storm sampling.
Sims Creek (site SC020)SC020 is an automated sampling site located near U.S. Highway 281 on Sims Creek, which discharges into the upper North Bosque just south of the Indian Creek confluence. Automated storm sampling at SC020 was discontinued on March 3, 1998.
South Bosque River (site SB050)SB050 is an automated sampling site located on private property on Church Road, about three quarter mile south of U.S. Highway 84. The city of McGregor is located approximately 10 miles above site SB050.
South Fork (sites SF020 and SF050) The South Fork originates northeast of Stephenville and joins the North Fork in the northern part of the city, forming the North Bosque River. Site SF020 is an automated sampling site
15

Hydrological Data for the Bosque River Watershed
located on an unnamed branch of the South Fork on private property. SF050 is an automated sampling site located on the Wood Hollow Branch of the South Fork near CR 416.
Spring Creek (site SP020)SP020 is an automated sampling site located near CR 271 on Spring Creek, which flows into a PL-566 reservoir before discharging into the North Bosque River above Hico. Automated sampling was discontinued on March 3, 1998. Sampling is now limited to routine grab-sampling, stage levels data collection, and rain data collection.
Tonk Creek (TC020)TC020 is an automated sampling site located on Tonk Creek at the crossing of FM Road 938 about eight miles above the confluence of Tonk Creek with the Middle Bosque River.
Wasp Creek (WC020)WC020 is an automated sampling site located on Wasp Creek at the crossing of FM Road 938 about seven miles above the confluence of Wasp Creek with the Middle Bosque River.
16

Chapter 2 Automated Sampling Site Locations in the Bosque River Watershed
Figure 2 Bosque River Watershed Sampling Sites Located Above Hico
17

Hydrological Data for the Bosque River Watershed
Figure 3 Bosque River Watershed Sampling Sites Located Below Hico
18

CHAPTER 3
Monitoring Equipment
Each automated sampling site consists of an ISCO 3230 or 4230 bubbler-type flow meter and an ISCO 3700 automatic sampler. Both instruments are enclosed in a sheet metal shelter and powered by a 12-volt deep cycle marine battery, which is charged by a MSX5 Solar Panel.
The ISCO flow meters operate by measuring the pressure required to force an air bubble through a one-eighth inch polypropylene tube (bubbler line) and recording this pressure as water level. The flow meters are programmed to record the water level (stage), sample history, and rainfall data in memory partitions. In addition to reading and recording data, the flow meter initiates sample retrieval of the ISCO 3700 automatic sampler.
The ISCO automated samplers are programmed to collect samples once an electronic signal is received from the flowmeter. Depending on the size of the watershed, different sampling schemes are programmed to represent the hydrograph for a particular storm event. The sampler records the time and date of the samples for the coinciding storm event, but does not have a memory partition to record multiple storm events.
Flow measurements are collected from each automated sampling location with one of the following velocity measuring equipment: a Global Water Flow Probe, a "AA" current meter, or a pygmy current meter. The amount of flow in a stream determines which piece of equipment is used. Flow measurements are gathered at the same location and referenced to the same benchmark. Cross sections of the stream are surveyed periodically throughout the year. Using these surveys and the flow measurements, rating curves are developed for each sampling location.
19

Hydrological Data for the Bosque River Watershed
20

CHAPTER 4
Site Installation and Maintenance
Sites were selected to investigate effects of agricultural nonpoint source pollution and identify areas from which pollution originates. Criteria for stream site selection included accessibility, freedom from excessive erosion, homogenous stream bed and side slope, and a straight reach of at least 50 feet.
General locations of all automated sampling locations are indicated in Figure 2 and 3. Latitude and longitude, as determined using Trimble Navigation Global Positioning System (GPS) equipment, and installation and termination dates of each site are listed in Table 1. As studies are completed and new studies initiated, automated monitoring sites have been and will be abandoned or relocated. Although these changes have resulted in moving sampling locations, efforts have been and will continue to be made to maintain comprehensive hydrologic data collection in the North Bosque River watershed.
Table 1 Sampling Site Locations and Operation Dates
Site ID Latitude Longitude Beginning Date Ending Date
Goose Branch Watershed
GB 020 32× 13' 59.049”N 98× 21' 15.684”W May 1995 NAGB 025 32× 13' 52.919”N 98× 20' 38.217”W May 1997 NAGB 040 32× 14' 20.939”N 98× 20' 30.101”W February 1997 NA
Upper Bosque River Watershed
NF 005 32× 17' 35.475”N 98× 18' 06.455”W November 1993 NANF 009 32× 18' 39.259”N 98× 17' 37.314”W November 1994 NANF 020 32× 18' 12.264”N 98× 17' 17.363”W July 1992 NASF 020 32× 17' 03.670”N 98× 21' 35.521”W November 1992 NASF 050 32× 16' 23.047”N 98× 20' 23.593”W January 1995 NABO 020 32× 14' 06.539”N 98× 12' 15.373”W February 1997 NAMB 040 32× 13' 01.745”N 98× 12' 12.067”W July 1993 NABO 040 32× 11' 34.734”N 98× 11' 03.293”W August 1993 NAIC 020 32× 08' 42.255”N 98× 08' 37.812”W September 1993 March 1998SC 020 32× 07' 54.048”N 98× 07' 51.628”W January 1995 March 1998GC 100 32× 02' 12.232”N 98× 07' 34.512”W October 1992 NASP 020 32× 00' 09.062”N 98× 06' 03.207”W September 1993 August 1998BO 070 31× 58' 37.519”N 98× 02' 07.154”W September 1992 NA
Lower Bosque River Watershed
MC 055 31× 48' 28.167”N 97× 37' 53.641”W September 1997 March 1998BO 090 31× 47' 09.228”N 97× 34' 04.193”W October 1995 NANC 060 31× 41' 35.856”N 97× 32' 07.740”W October 1995 NABO 100 31× 40' 06.895”N 97× 27' 52.386”W March 1996 NAHC 060 31× 33' 19.592”N 97× 21' 24.221”W September 1995 NAMB 060 31× 32' 20.047”N 97× 24' 48.674”W October 1995 NATC 020 31× 29' 38.057”N 97× 30' 13.614”W October 1995 NAWC 020 31× 27' 50.432”N 97× 28' 48.032”W October 1995 NASB 050 31× 28' 25.744”N 97× 16' 51.498”W July 1997 NA
21
Hydrological Data for the Bosque River Watershed
In January 1998, TIAER was operating 25 automated sampling stations throughout the Bosque River watershed. For record keeping purposes, the Bosque River watershed is broken into three watersheds: the Goose Branch (GB) watershed, the Upper North Bosque River (UNBR) watershed, and the Lower Bosque River (LBR) watershed. Currently, there are three stream sampling sites in the Goose Branch watershed, eleven stream sampling sites in the UNBR watershed and nine stream sampling sites in the LBR watershed. Of the eleven sites in the UNBR, one site, SP020, monitors only the stream level and is not equipped to collect water samples.
Throughout the year, four sites were discontinued. Site MC055, of the LBR watershed, was discontinued in March, after floodwaters completely destroyed the sampling location. Sites NF009, IC020, and SC020, of the UNBR watershed, were all discontinued in March, in an effort to reduce the number of sampling locations in the Bosque River watershed. However, after reevaluating the sampling locations, site NF009 was reinstalled at the same location in June.
Site GB040 had a problem with the internal air pump of the flow meter. When the problem was encountered, the stored data was unrecoverable from the memory partition. As a result, there is a gap in the data from the 28th of January to the 31st of January. Under normal operating procedures, the data gap could be corrected. However, a rain event occurred in this time frame making it impossible to accurately predict the corresponding hydrograph.
Scheduled maintenance of the sampling sites is performed at least once a week. All necessary adjustments to the flowmeter or sampler are performed during scheduled maintenance. In addition to weekly maintenance, a more in depth maintenance occurs at least three times a year which includes surveying cross-sections, acid washing the suction line, calibrating the sampler to insure proper sampling volumes, calibrating the flow meter to insure proper depth measurements, and checking battery water levels. Data are retrieved biweekly from all sites using laptop computers and returned to TIAER for storage and analysis on a UNIX workstation network.
22

CHAPTER 5
Data Collection and Analysis
Stream level data, sample history and rainfall intensity are gathered and stored in the memory partitions of the flow meter at each sampling location. Stream level data are recorded at five-minute intervals. Sample history and rainfall intensity are recorded at fifteen-minute intervals. The data are retrieved biweekly from all sites using a laptop computer and stored in a UNIX database for verification and analysis.
Flow measurements are collected at each site in the watershed when water levels permit. Since some of the sites are located on intermittent streams, water levels periodically reach zero. When flow measurements are collected, corresponding flow meter depths are also collected and input into an Excel spreadsheet for development of a rating curve. Flow measurements are collected perpendicular to stream flow in increments not exceeding ten percent of the total flow. Depth measurements are taken at each reading while the velocity is measured. Using the formula Q=AV, where Q represents the flow, A represents the area and V represents the velocity, flow is calculated for a given flowmeter depth. When sufficient flow measurements have been collected, a rating curve is developed. Future flow measurements are added to the rating curve to further delineate the actual curve. At some sites, it is difficult to collect flow measurements due to the rapid rise and fall of the stream level.
Cross sections of the streams are surveyed periodically throughout the year to monitor elevation of the bubbler and area of the stream. Upon any significant change in the area, a new rating curve is developed using new collected flow measurements. If there is a change in elevation of the bubbler, collected data are adjusted accordingly.
Rating curves have been developed for all of the sampling sites except GB025, MC055, BO090 and BO100. Field personnel have been unable for collect enough flow measurements to develop accurate rating curves for GB025 and MC055. To combat this problem, weirs and flumes have been installed at some sites located on smaller watersheds. Using the dimensions of the weirs and flumes, rating curves have been developed using hydrologic equations. For sites BO090 and BO100, TIAER utilizes rating curves developed by the USGS, which also monitors the stream at these locations.
Flow values collected for the year of 1998 for selected sampling sites in the Bosque River watershed are shown in Appendix A and B. Appendix A indicates the actual flow values collected in table format while Appendix B graphically depicts these values.
23

Hydrological Data for the Bosque River Watershed
24

References
Pearson, C. and A. McFarland. 2000. Livestock and the Environment: Semiannual Water Quality Report for the Bosque River Watershed, June 1, 1997 through June 30, 1999. Texas Institute for Ap-plied Environmental Research, Tarleton State University, Stephenville, Texas.
TNRCC, Texas Natural Resource Conservation Commission. 1996. The State of Texas Water Quality Inventory. 13th Edition, 1996: TNRCC, Austin, Texas. SFR-50,12/96.
TWC, Texas Water Commission, and TSSWCB, Texas State Soil and Water Conservation Board. 1991. 1990 Update to the Nonpoint Source Water Pollution Assessment Report of the State of Texas. TWC, Austin, Texas.
25

Hydrological Data for the Bosque River Watershed
26

APPENDIX A
Average Daily Flow Tables
The tables contained in this appendix indicate the flow values for selected sampling sites in the Bosque River watershed for the year of 1998. The flow values are based upon the water level data and velocity measurements collected by TIAER employees. These values in no way should be used as actual flow calculations. Two sites, GB025 and MC055, do not have developed rating curves and therefore are not included in this section.
27

Hydrological Data for the Bosque River Watershed
Table A–1 GB020 Average Daily Flow
Daily Mean Values (cubic feet per second)
Day Jan Feb Mar Apr May Jun Jul Aug Sep Oct Nov Dec1 0.00 0.02 0.02 0.03 0.03 0.00 0.00 0.00 0.00 0.00 0.00 0.002 0.00 0.01 0.01 0.03 0.03 0.00 0.00 0.00 0.00 0.00 0.00 0.003 0.00 0.00 0.01 0.03 0.02 0.00 0.00 0.00 0.00 0.00 0.00 0.004 0.00 0.00 0.00 0.03 0.02 0.00 0.00 0.00 0.00 0.00 0.00 0.005 0.00 0.00 0.00 0.03 0.01 0.00 0.00 0.00 0.00 0.00 0.00 0.00
6 0.04 0.00 0.00 0.03 0.00 0.00 0.00 0.00 0.00 0.00 0.00 0.007 0.04 0.00 0.02 0.03 0.00 0.00 0.00 0.00 0.00 0.00 0.00 0.008 0.02 0.00 0.03 0.03 0.00 0.00 0.00 0.00 0.00 0.00 0.00 0.009 0.00 0.00 0.03 0.03 0.00 0.00 0.00 0.00 0.00 0.00 0.00 0.00
10 0.00 0.00 0.03 0.03 0.00 0.04 0.00 0.00 0.00 0.00 0.00 0.00
11 0.00 0.00 0.02 0.03 0.00 0.75 0.00 0.00 0.00 0.00 0.00 0.0012 0.00 0.00 0.02 0.03 0.00 0.02 0.00 0.00 0.00 0.00 0.05 0.0013 0.00 0.00 0.03 0.03 0.00 0.01 0.00 0.00 0.00 0.00 0.84 0.0014 0.00 0.00 0.03 0.03 0.00 0.00 0.00 0.00 0.00 0.00 0.00 0.0015 0.00 0.00 12.69 0.03 0.00 0.00 0.00 0.00 0.00 0.00 0.00 0.00
16 0.00 0.00 27.73 0.03 0.00 0.00 0.00 0.00 0.00 0.00 0.00 0.0017 0.00 0.00 0.06 0.03 0.00 0.00 0.00 0.00 0.00 0.00 0.00 0.0018 0.00 0.00 0.03 0.03 0.00 0.00 0.00 0.00 0.00 0.00 0.00 0.0019 0.00 0.00 0.03 0.03 0.00 0.00 0.00 0.00 0.00 0.00 0.00 0.0020 0.00 0.00 0.03 0.03 0.00 0.00 0.00 0.00 0.00 0.00 0.00 0.00
21 0.00 1.84 0.03 0.03 0.00 0.00 0.00 0.00 0.00 0.00 0.00 0.0022 0.00 0.21 0.03 0.03 0.00 0.00 0.00 0.00 0.00 0.00 0.00 0.0023 0.00 0.02 0.03 0.03 0.00 0.00 0.00 0.00 0.00 0.00 0.00 0.0024 0.00 0.02 0.03 0.03 0.00 0.00 0.00 0.00 0.00 0.00 0.00 0.0025 0.00 0.06 0.03 0.03 0.00 0.00 0.00 0.00 0.00 0.00 0.00 0.00
26 0.00 0.03 0.03 0.03 0.10 0.00 0.00 0.00 0.00 0.00 0.00 0.0027 0.00 0.03 0.03 0.03 0.63 0.00 0.00 0.00 0.00 0.00 0.00 0.0028 0.00 0.02 0.03 0.03 0.02 0.00 0.00 0.00 0.00 0.00 0.00 0.0029 0.00 0.03 0.03 0.01 0.00 0.00 0.00 0.00 0.00 0.00 0.0030 0.00 0.10 0.03 0.00 0.00 0.00 0.00 0.00 0.00 0.00 0.0031 1.25 0.03 0.00 0.00 0.00 0.00 0.00
TOTAL 1.34 2.25 41.22 0.90 0.86 0.82 0.00 0.00 0.00 0.00 0.89 0.00MEAN 0.04 0.08 1.33 0.03 0.03 0.03 0.00 0.00 0.00 0.00 0.03 0.00MAX 1.25 1.84 27.73 0.03 0.63 0.75 0.00 0.00 0.00 0.00 0.84 0.00MIN 0.00 0.00 0.00 0.03 0.00 0.00 0.00 0.00 0.00 0.00 0.00 0.00
Table A–2 GB040 Average Daily Flow
Daily Mean Values (cubic feet per second)
Day Jan Feb Mar Apr May Jun Jul Aug Sep Oct Nov Dec1 0.25 0.23 0.25 0.28 0.27 0.17 0.16 0.00 0.00 0.00 0.03 0.002 0.25 0.22 0.23 0.28 0.27 0.17 0.15 0.00 0.00 0.00 0.00 0.003 0.25 0.21 0.24 0.28 0.26 0.17 0.11 0.00 0.00 0.00 0.00 0.004 0.26 0.21 0.19 0.29 0.27 0.17 0.11 0.00 0.00 0.00 0.00 0.005 0.27 0.22 0.19 0.29 0.27 0.16 0.12 0.00 0.00 0.00 0.00 0.00
6 0.31 0.22 0.20 0.29 0.26 0.17 0.10 0.00 0.00 0.00 0.00 0.007 0.32 0.23 0.23 0.29 0.26 0.14 0.07 0.00 0.00 0.00 0.00 0.008 0.28 0.23 0.23 0.29 0.27 0.14 0.04 0.00 0.00 0.00 0.00 0.009 0.27 0.24 0.23 0.29 0.29 0.13 0.02 0.00 0.00 0.00 0.00 0.00
10 0.26 0.25 0.23 0.29 0.28 0.17 0.00 0.00 0.00 0.00 0.00 0.00
11 0.27 0.25 0.23 0.29 0.28 0.25 0.00 0.00 0.00 0.00 0.00 0.0012 0.27 0.27 0.23 0.30 0.28 0.14 0.00 0.00 0.00 0.00 0.07 0.0013 0.27 0.26 0.24 0.30 0.28 0.13 0.00 0.00 0.00 0.00 0.26 0.0014 0.28 0.26 0.25 0.30 0.29 0.13 0.00 0.00 0.00 0.00 0.11 0.0015 0.29 0.26 11.96 0.30 0.29 0.14 0.00 0.00 0.00 0.00 0.06 0.00
16 0.29 0.27 94.02 0.29 0.29 0.14 0.00 0.00 0.00 0.00 0.01 0.00
28

Appendix A Average Daily Flow Tables
17 0.29 0.26 0.75 0.29 0.29 0.14 0.00 0.00 0.00 0.00 0.00 0.0018 0.29 0.26 0.35 0.29 0.28 0.14 0.00 0.00 0.00 0.00 0.00 0.0019 0.28 0.26 0.33 0.28 0.26 0.14 0.00 0.00 0.00 0.00 0.00 0.0020 0.27 0.25 0.33 0.28 0.26 0.13 0.00 0.00 0.00 0.00 0.00 0.00
21 0.28 2.46 0.33 0.28 0.26 0.13 0.00 0.00 0.00 0.00 0.00 0.0022 0.27 0.33 0.32 0.28 0.27 0.12 0.00 0.00 0.00 0.00 0.00 0.0023 0.27 0.17 0.32 0.28 0.27 0.12 0.00 0.00 0.00 0.00 0.00 0.0024 0.27 0.18 0.32 0.28 0.27 0.12 0.00 0.00 0.00 0.00 0.00 0.0025 0.27 0.19 0.32 0.28 0.27 0.12 0.00 0.00 0.00 0.00 0.00 0.00
26 0.26 0.20 0.31 0.28 0.57 0.12 0.00 0.00 0.00 0.00 0.00 0.0027 0.26 0.19 0.32 0.27 1.04 0.12 0.00 0.00 0.00 0.00 0.00 0.0028 0.23 0.21 0.33 0.27 0.17 0.11 0.00 0.00 0.00 0.00 0.00 0.0029 0.00 0.33 0.27 0.16 0.13 0.00 0.00 0.00 0.00 0.00 0.0030 0.00 0.35 0.27 0.16 0.15 0.00 0.00 0.00 0.00 0.00 0.0031 0.08 0.29 0.16 0.00 0.00 0.00 0.00
TOTAL 7.70 8.78 114.46 8.55 9.09 4.29 0.87 0.00 0.00 0.00 0.54 0.00MEAN 0.25 0.31 3.69 0.29 0.29 0.14 0.03 0.00 0.00 0.00 0.02 0.00MAX 0.32 2.46 94.02 0.30 1.04 0.25 0.16 0.00 0.00 0.00 0.26 0.00MIN 0.00 0.17 0.19 0.27 0.16 0.11 0.00 0.00 0.00 0.00 0.00 0.00
Table A–3 NF005 Average Daily Flow
Daily Mean Values (cubic feet per second)
Day Jan Feb Mar Apr May Jun Jul Aug Sep Oct Nov Dec1 0.16 1.16 0.31 0.33 0.28 0.00 0.00 0.00 0.00 0.00 0.02 0.002 0.16 0.66 0.30 0.31 0.27 0.00 0.00 0.00 0.00 0.00 0.00 0.003 0.18 0.51 0.29 0.29 0.25 0.00 0.00 0.00 0.00 0.00 0.00 0.004 0.29 0.44 0.31 0.30 0.24 0.00 0.00 0.00 0.00 0.00 0.00 0.005 0.32 0.42 0.32 0.31 0.23 0.00 0.00 0.00 0.00 0.00 0.00 0.00
6 1.28 0.43 0.37 0.31 0.17 0.00 0.00 0.00 0.00 0.00 0.00 0.007 1.97 0.40 0.74 0.33 0.10 0.00 0.00 0.00 0.00 0.00 0.00 0.008 1.27 0.40 0.99 0.33 0.07 0.00 0.00 0.00 0.00 0.00 0.00 0.009 0.76 0.38 0.54 0.28 0.22 0.00 0.00 0.00 0.00 0.00 0.00 0.00
10 0.49 0.35 0.39 0.28 0.12 0.00 0.00 0.00 0.00 0.00 0.00 0.00
11 0.47 0.33 0.36 0.29 0.00 0.28 0.00 0.00 0.00 0.00 0.00 0.0012 0.71 0.43 0.34 0.29 0.00 0.01 0.00 0.00 0.01 0.00 0.02 0.0013 0.11 0.84 0.35 0.28 0.00 0.02 0.00 0.00 0.00 0.00 0.34 0.0014 0.29 0.59 0.39 0.27 0.00 0.00 0.00 0.00 0.00 0.00 0.00 0.0015 0.35 0.49 7.74 0.27 0.00 0.00 0.00 0.00 0.00 0.00 0.00 0.00
16 0.34 0.72 77.49 0.26 0.00 0.00 0.00 0.00 0.00 0.00 0.00 0.0017 0.31 0.65 0.98 0.28 0.00 0.00 0.00 0.01 0.00 0.00 0.00 0.0018 0.30 0.57 0.84 0.31 0.00 0.00 0.00 0.00 0.00 0.00 0.00 0.0019 0.29 0.71 0.71 0.32 0.00 0.00 0.00 0.00 0.00 0.00 0.00 0.0020 0.30 0.61 0.51 0.33 0.00 0.00 0.00 0.00 0.00 0.00 0.00 0.00
21 0.32 3.55 0.47 0.32 0.00 0.00 0.00 0.00 0.00 0.00 0.00 0.0022 0.39 3.12 0.42 0.28 0.00 0.00 0.00 0.00 0.00 0.00 0.00 0.0023 0.36 0.90 0.38 0.29 0.00 0.00 0.00 0.00 0.00 0.00 0.00 0.0024 0.34 0.56 0.35 0.32 0.00 0.00 0.00 0.00 0.00 0.00 0.00 0.0025 0.33 0.54 0.34 0.29 0.00 0.00 0.00 0.00 0.00 0.00 0.00 0.00
26 0.33 0.78 0.34 0.30 0.11 0.00 0.00 0.00 0.00 0.00 0.00 0.0027 0.33 0.44 0.34 0.31 2.03 0.00 0.00 0.00 0.00 0.00 0.00 0.0028 0.32 0.34 0.32 0.31 0.18 0.00 0.00 0.00 0.00 0.00 0.00 0.0029 0.32 0.33 0.32 0.04 0.00 0.00 0.00 0.00 0.00 0.00 0.0030 0.33 0.36 0.32 0.00 0.00 0.00 0.00 0.00 0.00 0.00 0.0031 4.17 0.41 0.00 0.00 0.00 0.00 0.00
TOTAL 17.88 21.32 98.31 9.02 4.30 0.31 0.00 0.01 0.04 0.03 0.41 0.03MEAN 0.58 0.76 3.17 0.30 0.14 0.01 0.00 0.00 0.00 0.00 0.01 0.00MAX 4.17 3.55 77.49 0.33 2.03 0.28 0.00 0.01 0.01 0.00 0.34 0.00MIN 0.11 0.33 0.29 0.26 0.00 0.00 0.00 0.00 0.00 0.00 0.00 0.00
Table A–2 GB040 Average Daily Flow
29

Hydrological Data for the Bosque River Watershed
Table A–4 NF009 Average Daily Flow
Daily Mean Values (cubic feet per second)
Day Jan Feb Mar Apr May Jun Jul Aug Sep Oct Nov Dec1 0.05 0.055 0.05 0.05 0.108 0.109 0.11 0.526 0.1172 0.05 0.05 0.05 0.05 0.109 0.109 0.109 0.12 0.1163 0.05 0.05 0.05 0.05 0.11 0.11 0.11 0.12 0.124 0.05 0.05 0.05 0.05 0.11 0.11 0.11 0.12 0.125 0.05 0.05 0.05 0.05 0.11 0.11 0.11 0.12 0.12
6 0.32 0.05 0.05 0.05 0.11 0.11 0.11 0.12 0.117 0.28 0.05 0.05 0.05 0.11 0.11 0.11 0.12 0.118 0.05 0.05 0.05 0.05 0.11 0.11 0.11 0.12 0.129 0.05 0.05 0.05 0.05 0.11 0.11 0.11 0.12 0.12
10 0.05 0.05 0.05 0.08 0.11 0.11 0.11 0.12 0.11
11 0.05 0.05 0.05 0.11 0.11 0.11 0.11 0.12 0.1112 0.05 0.05 0.05 0.55 0.11 0.11 0.11 0.11 1.59 0.1113 0.05 0.05 0.05 1.22 0.11 0.11 0.11 0.11 5.78 0.1214 0.05 0.05 0.05 1.08 0.11 0.11 0.11 0.11 0.78 0.1115 0.05 0.05 11.91 0.95 0.11 0.11 0.11 0.11 0.12 0.12
16 0.05 0.05 69.18 0.88 0.11 0.11 0.11 0.12 0.12 0.1217 0.05 0.05 0.90 0.75 0.11 0.11 0.11 0.12 0.12 0.1218 0.05 0.05 0.08 0.28 0.11 0.11 0.11 0.12 0.12 0.1119 0.05 0.05 0.05 0.05 0.11 0.11 0.11 0.12 0.12 0.1120 0.05 0.05 0.05 0.05 0.11 0.11 0.11 0.12 0.12 0.11
21 0.05 4.44 0.05 0.05 0.11 0.11 0.11 0.12 0.12 0.1122 0.05 1.45 0.05 0.05 0.11 0.11 0.11 0.12 0.12 0.1123 0.05 0.05 0.05 0.05 0.11 0.11 0.11 0.12 0.12 0.1124 0.05 0.05 0.05 0.05 0.11 0.11 0.11 0.12 0.12 0.1125 0.05 0.05 0.02 0.05 0.11 0.11 0.11 0.12 0.12 0.11
26 0.05 0.05 0.05 0.05 0.11 0.11 0.11 0.12 0.12 0.1127 0.05 0.05 0.05 0.05 0.11 0.11 0.11 0.12 0.12 0.1128 0.05 0.05 0.05 0.05 0.11 0.11 0.11 0.12 0.12 0.1129 0.05 0.05 0.05 0.11 0.11 0.11 0.12 0.12 0.1130 0.05 0.05 0.05 0.11 0.11 0.11 0.12 0.12 0.1131 2.15 0.11 0.11 0.12 0.11
TOTAL 4.14 7.19 83.34 6.31 2.79 3.38 3.27 3.55 11.76 3.53MEAN 0.13 0.26 2.78 0.33 0.09 0.11 0.11 0.11 0.39 0.11MAX 2.15 4.44 69.18 1.22 0.11 0.11 0.11 0.12 5.78 0.12MIN 0.05 0.05 0.02 0.05 0.05 0.11 0.11 0.11 0.12 0.11
30

Appendix A Average Daily Flow Tables
Table A–5 NF020 Average Daily Flow
Daily Mean Values (cubic feet per second)
Day Jan Feb Mar Apr May Jun Jul Aug Sep Oct Nov Dec1 0.67 1.90 1.35 2.33 1.77 0.00 0.00 0.00 0.00 0.00 0.60 0.002 0.68 1.34 1.35 2.27 1.66 0.00 0.00 0.00 0.00 0.00 0.00 0.003 0.71 1.20 1.34 2.18 1.36 0.00 0.00 0.00 0.00 0.00 0.00 0.024 0.79 1.12 1.39 2.17 1.29 0.00 0.00 0.00 0.00 0.00 0.00 0.015 0.92 1.10 1.40 2.19 1.12 0.00 0.00 0.00 0.00 0.00 0.00 0.00
6 1.63 1.08 1.48 2.19 0.92 0.00 0.00 0.00 0.00 0.00 0.00 0.007 2.37 1.06 1.86 2.17 0.88 0.00 0.00 0.00 0.00 0.00 0.00 0.008 1.82 1.05 2.23 2.16 0.90 0.00 0.00 0.00 0.00 0.00 0.00 0.009 1.34 1.05 1.78 2.13 0.93 0.00 0.00 0.00 0.00 0.00 0.00 0.00
10 1.03 1.05 1.59 2.11 0.88 0.00 0.00 0.00 0.00 0.00 0.00 0.00
11 0.98 1.03 1.56 2.10 0.73 0.47 0.00 0.00 0.00 0.00 0.00 0.0012 0.97 1.12 1.55 2.15 0.55 0.02 0.00 0.00 0.00 0.00 0.77 0.0013 0.93 1.44 1.58 2.11 0.53 0.00 0.00 0.00 0.00 0.00 2.68 0.0014 0.91 1.32 1.65 2.09 0.50 0.00 0.00 0.00 0.00 0.00 0.05 0.0015 0.90 1.23 14.99 2.10 0.38 0.00 0.00 0.00 0.00 0.00 0.00 0.00
16 0.89 1.33 190.76 2.00 0.08 0.00 0.00 0.00 0.00 0.00 0.00 0.0017 0.88 1.28 11.99 1.96 0.00 0.00 0.00 0.00 0.00 0.00 0.00 0.0018 0.87 1.13 2.96 2.01 0.00 0.00 0.00 0.00 0.00 0.00 0.00 0.0019 0.86 1.20 2.72 1.92 0.00 0.00 0.00 0.00 0.00 0.00 0.00 0.0020 0.88 1.17 2.61 1.95 0.00 0.00 0.00 0.00 0.00 0.00 0.00 0.00
21 0.96 6.90 2.54 2.00 0.00 0.00 0.00 0.00 0.00 0.00 0.00 0.0022 0.99 7.83 2.47 1.99 0.00 0.00 0.00 0.00 0.00 0.00 0.00 0.0023 1.01 1.79 2.42 1.95 0.00 0.00 0.00 0.00 0.00 0.00 0.00 0.0024 0.99 1.48 2.37 1.95 0.00 0.00 0.00 0.00 0.00 0.00 0.00 0.0025 0.99 1.44 2.33 1.87 0.00 0.00 0.00 0.00 0.00 0.00 0.00 0.00
26 0.98 1.75 2.31 1.87 1.14 0.00 0.00 0.00 0.00 0.00 0.00 0.0027 0.98 1.45 2.32 1.83 9.47 0.00 0.00 0.00 0.00 0.00 0.00 0.0028 0.97 1.37 2.28 1.85 0.99 0.00 0.00 0.00 0.00 0.00 0.00 0.0029 0.97 2.29 1.85 0.53 0.00 0.00 0.00 0.00 0.00 0.00 0.0030 0.96 2.39 1.78 0.34 0.00 0.00 0.00 0.00 0.00 0.00 0.0031 7.11 2.43 0.05 0.00 0.00 0.00 0.00
TOTAL 37.92 48.20 274.28 61.24 26.98 0.49 0.00 0.00 0.00 0.00 4.09 0.03MEAN 1.22 1.72 8.85 2.04 0.87 0.02 0.00 0.00 0.00 0.00 0.14 0.00MAX 7.11 7.83 190.76 2.33 9.47 0.47 0.00 0.00 0.00 0.00 2.68 0.02MIN 0.67 1.03 1.34 1.78 0.00 0.00 0.00 0.00 0.00 0.00 0.00 0.00
Table A–6 SF020 Average Daily Flow
Daily Mean Values (cubic feet per second)
Day Jan Feb Mar Apr May Jun Jul Aug Sep Oct Nov Dec1 0 0.84 1.171 1.329 0.729 0 0 0 0 0 0 02 0 0.54 1.127 1.185 0.703 0 0 0 0 0 0 03 0.00 0.36 1.13 1.11 0.69 0.00 0.00 0.00 0.00 0.00 0.00 0.004 0.00 0.21 1.20 1.05 0.71 0.00 0.00 0.00 0.00 0.00 0.00 0.005 0.00 0.34 1.21 1.07 0.70 0.00 0.00 0.00 0.00 0.00 0.00 0.00
6 0.00 0.33 1.28 1.09 0.68 0.00 0.00 0.00 0.00 0.00 0.00 0.007 0.49 0.37 4.24 1.10 0.66 0.00 0.00 0.00 0.00 0.00 0.00 0.008 0.72 0.41 2.12 0.98 0.67 0.00 0.00 0.00 0.00 0.00 0.00 0.009 0.45 0.41 1.57 0.93 0.63 0.00 0.00 0.00 0.00 0.00 0.00 0.00
10 0.01 0.41 1.41 0.89 0.60 0.01 0.00 0.00 0.00 0.00 0.00 0.00
11 0.00 0.39 1.38 0.87 0.57 0.29 0.00 0.00 0.00 0.00 0.00 0.0012 0.00 0.46 1.34 0.86 0.42 0.00 0.00 0.00 0.00 0.00 0.01 0.0013 0.00 0.56 1.36 0.86 0.29 0.00 0.00 0.00 0.00 0.00 0.05 0.0014 0.00 0.59 1.08 0.86 0.28 0.00 0.00 0.00 0.00 0.00 0.00 0.0015 0.00 0.52 6.66 0.83 0.13 0.00 0.00 0.00 0.00 0.00 0.00 0.00
16 0.00 0.67 107.94 0.81 0.00 0.00 0.00 0.00 0.00 0.00 0.00 0.00
31

Hydrological Data for the Bosque River Watershed
17 0.00 0.68 2.52 0.74 0.00 0.00 0.00 0.00 0.00 0.00 0.00 0.0018 0.00 0.54 1.94 0.72 0.00 0.00 0.00 0.00 0.00 0.00 0.00 0.0019 0.00 0.62 2.53 0.72 0.00 0.00 0.00 0.00 0.00 0.00 0.00 0.0020 0.00 0.59 1.80 0.73 0.00 0.00 0.00 0.00 0.00 0.00 0.00 0.00
21 0.00 3.92 1.65 0.73 0.00 0.00 0.00 0.00 0.00 0.00 0.00 0.0022 0.00 2.77 1.53 0.73 0.00 0.00 0.00 0.00 0.00 0.00 0.00 0.0023 0.00 1.60 1.51 0.72 0.00 0.00 0.00 0.00 0.00 0.00 0.00 0.0024 0.00 1.44 1.44 0.71 0.00 0.00 0.00 0.00 0.00 0.00 0.00 0.0025 0.00 1.37 1.40 0.70 0.00 0.00 0.00 0.00 0.00 0.00 0.00 0.00
26 0.00 1.43 1.35 0.72 0.21 0.00 0.00 0.00 0.00 0.00 0.00 0.0027 0.00 1.29 1.33 0.74 1.72 0.00 0.00 0.00 0.00 0.00 0.00 0.0028 0.00 1.21 1.28 0.72 0.50 0.00 0.00 0.00 0.00 0.00 0.00 0.0029 0.00 1.25 0.73 0.00 0.00 0.00 0.00 0.00 0.00 0.00 0.0030 0.00 1.39 0.73 0.00 0.00 0.00 0.00 0.00 0.00 0.00 0.0031 1.09 1.63 0.00 0.00 0.00 0.00 0.00
TOTAL 2.76 24.86 160.75 25.96 10.88 0.30 0.00 0.00 0.00 0.00 0.06 0.00MEAN 0.09 0.89 5.19 0.87 0.35 0.01 0.00 0.00 0.00 0.00 0.00 0.00MAX 1.09 3.92 107.94 1.33 1.72 0.29 0.00 0.00 0.00 0.00 0.05 0.00MIN 0.00 0.21 1.08 0.70 0.00 0.00 0.00 0.00 0.00 0.00 0.00 0.00
Table A–7 SF050 Average Daily Flow
Daily Mean Values (cubic feet per second)
Day Jan Feb Mar Apr May Jun Jul Aug Sep Oct Nov Dec1 0.00 1.36 0.99 1.74 0.48 0.00 0.00 0.00 0.00 0.00 0.00 0.002 0.00 1.12 0.98 1.73 0.08 0.00 0.00 0.00 0.00 0.00 0.00 0.003 0.00 1.04 0.95 1.71 0.00 0.00 0.00 0.00 0.00 0.00 0.00 0.004 0.00 1.02 0.96 1.70 0.00 0.00 0.00 0.00 0.00 0.00 0.00 0.005 0.00 1.03 0.92 1.72 0.00 0.00 0.00 0.00 0.00 0.00 0.00 0.00
6 0.94 1.02 1.01 1.81 0.00 0.00 0.00 0.00 0.00 0.00 0.00 0.007 1.51 0.98 1.57 1.83 0.00 0.00 0.00 0.00 0.00 0.00 0.00 0.008 1.28 0.97 1.53 1.51 0.00 0.00 0.00 0.00 0.00 0.00 0.00 0.009 1.10 0.95 1.15 1.32 0.00 0.00 0.00 0.00 0.00 0.00 0.00 0.00
10 1.01 0.92 1.07 1.23 0.00 0.00 0.00 0.00 0.00 0.00 0.00 0.00
11 1.01 0.88 1.08 1.17 0.00 0.30 0.00 0.00 0.00 0.00 0.00 0.0012 1.02 0.97 1.06 1.14 0.00 1.01 0.00 0.00 0.00 0.00 0.00 0.0013 0.93 1.20 1.11 1.08 0.00 0.22 0.00 0.00 0.00 0.00 0.00 0.0014 0.94 1.05 1.17 1.04 0.00 0.00 0.00 0.00 0.00 0.00 0.00 0.0015 0.94 1.06 3.50 1.01 0.00 0.00 0.00 0.00 0.00 0.00 0.00 0.00
16 0.94 1.28 20.86 0.93 0.00 0.00 0.00 0.00 0.00 0.00 0.00 0.0017 0.89 1.13 4.44 0.82 0.00 0.00 0.00 0.00 0.00 0.00 0.00 0.0018 0.90 1.08 3.08 0.85 0.00 0.00 0.00 0.00 0.00 0.00 0.00 0.0019 0.88 1.18 2.47 0.89 0.00 0.00 0.00 0.00 0.00 0.00 0.00 0.0020 0.93 1.10 2.16 0.91 0.00 0.00 0.00 0.00 0.00 0.00 0.00 0.00
21 0.96 3.94 2.08 0.86 0.00 0.00 0.00 0.00 0.00 0.00 0.00 0.0022 0.96 3.35 2.00 0.77 0.00 0.00 0.00 0.00 0.00 0.00 0.00 0.0023 0.92 1.38 1.91 0.72 0.00 0.00 0.00 0.00 0.00 0.00 0.00 0.0024 0.92 1.19 1.80 0.70 0.00 0.00 0.00 0.00 0.00 0.00 0.00 0.0025 0.95 1.18 1.75 0.59 0.00 0.00 0.00 0.00 0.00 0.00 0.00 0.00
26 0.97 1.28 1.75 0.55 0.22 0.00 0.00 0.00 0.00 0.00 0.00 0.0027 0.92 1.08 1.82 0.81 4.35 0.00 0.00 0.00 0.00 0.00 0.00 0.0028 0.87 1.01 1.80 0.71 0.34 0.00 0.00 0.00 0.00 0.00 0.00 0.0029 0.86 1.77 0.65 0.00 0.00 0.00 0.00 0.00 0.00 0.00 0.0030 0.87 1.83 0.63 0.00 0.00 0.00 0.00 0.00 0.00 0.00 0.0031 3.03 1.96 0.00 0.00 0.00 0.00 0.00
TOTAL 27.44 35.74 72.52 33.09 5.46 1.53 0.00 0.00 0.00 0.00 0.00 0.00MEAN 0.89 1.28 2.34 1.10 0.18 0.05 0.00 0.00 0.00 0.00 0.00 0.00MAX 3.03 3.94 20.86 1.83 4.35 1.01 0.00 0.00 0.00 0.00 0.00 0.00MIN 0.00 0.88 0.92 0.55 0.00 0.00 0.00 0.00 0.00 0.00 0.00 0.00
Table A–6 SF020 Average Daily Flow
32

Appendix A Average Daily Flow Tables
Table A–8 BO020 Average Daily Flow
Daily Mean Values (cubic feet per second)
Day Jan Feb Mar Apr May Jun Jul Aug Sep Oct Nov Dec1 5.12 27.40 8.62 11.58 7.35 2.45 0.00 0.00 0.00 0.00 10.19 0.412 5.23 13.88 7.86 10.66 7.10 1.84 0.00 0.00 0.00 0.00 0.44 0.433 5.26 10.11 7.23 10.01 6.86 1.53 0.00 0.00 0.00 0.00 0.03 3.184 487.35 8.56 7.39 9.90 6.19 1.97 0.00 0.00 0.00 0.00 0.00 5.335 215.02 7.79 7.60 9.33 6.54 3.43 0.00 0.00 0.00 0.00 0.00 0.59
6 96.19 7.35 8.38 9.09 6.58 1.26 0.00 0.00 0.00 0.46 0.00 0.327 85.96 6.77 13.95 8.82 6.34 1.14 0.00 0.00 0.00 0.00 0.00 0.278 42.38 6.44 17.42 8.44 6.54 1.16 0.00 0.00 0.00 0.00 0.00 0.299 19.24 6.56 14.64 8.21 6.63 1.11 0.00 0.00 0.00 0.00 0.00 0.38
10 13.05 6.46 11.31 7.95 6.71 4.29 0.00 0.00 0.00 0.00 0.00 4.40
11 11.18 6.53 9.72 7.84 7.00 20.29 0.00 0.00 0.00 0.00 0.00 2.4512 10.49 6.81 8.64 7.92 7.15 5.23 0.25 0.00 0.67 0.00 8.55 4.1713 9.64 7.47 8.66 8.36 7.29 2.86 3.99 0.23 0.00 0.00 42.87 0.9514 9.10 7.29 8.99 8.45 7.69 1.94 0.18 0.00 0.00 0.00 2.67 0.5615 8.66 6.99 20.36 8.47 6.49 1.42 0.01 0.00 0.00 0.00 0.67 0.51
16 8.49 8.29 1855.26 8.02 6.52 1.15 0.00 0.00 17.22 0.00 0.35 0.6517 8.41 8.12 690.38 7.65 6.37 0.88 0.00 0.00 0.77 0.43 0.23 0.6918 8.19 7.57 473.55 7.54 6.26 0.65 0.00 0.00 0.04 0.03 0.21 2.6719 8.00 7.46 264.44 7.34 5.94 0.49 0.00 0.00 0.00 0.00 0.21 2.3120 8.54 7.23 180.76 7.50 5.82 0.35 0.00 0.00 0.00 1.90 0.19 0.80
21 8.31 31.11 96.29 8.01 4.79 0.22 0.00 0.00 0.00 0.98 0.20 0.6922 8.42 105.52 32.68 6.91 4.29 0.18 0.00 0.00 0.00 0.13 0.22 0.5923 8.67 30.74 22.68 6.94 4.60 0.11 0.00 0.00 0.00 0.00 0.23 0.7224 8.85 17.73 18.03 7.15 3.95 0.12 0.00 0.00 0.00 0.00 0.25 0.7725 8.83 14.23 15.66 7.03 4.25 0.08 0.00 0.00 0.00 0.00 0.31 0.75
26 8.67 32.44 14.39 7.30 12.24 0.07 0.00 0.00 0.00 0.00 0.32 0.7927 8.73 17.12 13.76 7.56 280.20 0.08 0.00 0.00 0.00 0.00 0.39 0.8828 8.81 11.08 12.24 7.44 20.96 0.02 0.00 0.00 0.00 0.00 0.48 0.8929 8.46 11.85 7.31 8.78 0.00 0.00 0.00 0.00 0.00 0.61 0.9630 8.55 11.59 7.60 4.96 0.00 0.00 0.00 0.00 0.00 0.69 0.9431 26.37 12.95 3.47 0.00 0.00 0.00 0.99
TOTAL 1178.17 435.03 3887.29 246.33 485.87 56.31 4.44 0.23 18.68 3.94 70.29 40.33MEAN 38.01 15.54 125.40 8.21 15.67 1.88 0.14 0.01 0.62 0.13 2.34 1.30MAX 487.35 105.52 1855.26 11.58 280.20 20.29 3.99 0.23 17.22 1.90 42.87 5.33MIN 5.12 6.44 7.23 6.91 3.47 0.00 0.00 0.00 0.00 0.00 0.00 0.27
Table A–9 MB040 Average Daily Flow
Daily Mean Values (cubic feet per second)
Day Jan Feb Mar Apr May Jun Jul Aug Sep Oct Nov Dec1 0.00 0.00 0.00 0.00 0.00 0.00 0.00 0.00 0.00 0.00 8.54 0.002 0.00 0.00 0.00 0.00 0.00 0.00 0.00 0.00 0.00 0.00 0.00 0.003 0.16 0.00 0.01 0.00 0.00 0.00 0.00 0.00 0.00 0.00 0.00 5.074 5.63 0.02 0.00 0.00 0.00 2.54 0.00 0.00 0.00 0.00 0.00 0.005 0.04 0.00 0.00 0.00 0.00 0.13 0.00 0.00 0.00 0.59 0.00 0.00
6 0.39 0.00 0.22 0.00 0.00 0.00 0.00 0.23 0.00 0.49 0.00 0.037 0.11 0.00 2.02 0.00 0.00 0.00 0.00 0.00 0.00 0.00 0.00 0.008 0.19 0.00 0.00 0.00 0.00 0.00 0.00 0.00 0.00 0.00 0.00 0.009 0.00 0.00 0.00 0.00 0.00 0.00 0.00 0.00 0.00 0.00 0.00 0.00
10 0.00 0.00 0.00 0.00 0.42 0.90 0.00 0.00 0.00 0.00 0.00 0.95
11 0.02 0.00 0.00 0.00 0.00 0.47 0.00 0.51 0.69 0.00 0.00 0.4612 0.00 0.22 0.00 0.03 0.00 0.00 6.22 0.00 1.26 0.00 15.49 0.1713 0.00 0.00 0.00 0.00 0.00 0.00 0.55 0.20 0.00 0.00 7.81 0.0014 0.00 0.00 0.01 0.00 0.00 0.00 0.00 0.01 0.00 0.00 0.00 0.0015 0.00 0.00 6.31 0.00 0.00 0.00 0.00 0.00 0.00 0.00 0.00 0.00
16 0.00 0.17 29.50 0.00 0.00 0.00 0.00 0.00 16.38 0.00 0.00 0.00
33

Hydrological Data for the Bosque River Watershed
17 0.00 0.00 0.00 0.00 0.00 0.00 0.00 0.05 0.30 1.14 0.00 0.0018 0.00 0.12 0.00 0.00 0.00 0.00 0.00 0.00 0.00 0.00 0.00 1.0519 0.00 0.00 0.00 0.00 0.00 0.00 0.00 0.00 0.00 0.00 0.00 0.0020 0.00 0.00 0.00 1.31 0.00 0.00 0.00 0.00 0.00 1.08 0.00 0.00
21 0.00 4.27 0.00 0.03 0.00 0.00 0.00 0.00 0.00 0.01 0.00 0.0022 0.00 0.00 0.00 0.00 0.00 0.00 0.00 0.00 0.00 0.00 0.00 3.9723 0.00 0.00 0.00 0.00 0.00 0.00 0.00 0.00 0.00 0.00 0.00 0.0024 0.00 0.00 0.00 0.00 0.00 0.00 0.00 0.00 0.00 0.00 0.00 0.0025 0.00 1.50 0.00 0.00 0.01 0.00 0.00 0.00 0.00 0.00 0.00 0.00
26 0.00 0.00 0.00 0.00 28.59 0.00 0.00 0.00 0.00 0.00 0.00 0.0027 0.00 0.00 0.00 0.00 3.77 0.00 0.00 0.00 0.00 0.00 0.00 0.0028 0.00 0.00 0.00 0.00 0.00 0.00 0.00 0.00 0.01 0.00 0.00 0.0029 0.00 0.00 0.00 0.00 0.00 0.00 0.00 0.00 0.00 0.07 0.0030 0.00 0.00 0.00 0.00 0.00 0.00 0.00 0.05 0.00 0.00 0.0031 0.40 0.00 0.00 0.00 0.00 0.00 0.00
TOTAL 6.94 6.30 38.07 1.37 32.79 4.04 6.77 1.00 18.70 3.31 31.91 11.70MEAN 0.22 0.22 1.23 0.05 1.06 0.13 0.22 0.03 0.62 0.11 1.06 0.38MAX 5.63 4.27 29.50 1.31 28.59 2.54 6.22 0.51 16.38 1.14 15.49 5.07MIN 0.00 0.00 0.00 0.00 0.00 0.00 0.00 0.00 0.00 0.00 0.00 0.00
Table A–10 BO040 Average Daily Flow
Daily Mean Values (cubic feet per second)
Day Jan Feb Mar Apr May Jun Jul Aug Sep Oct Nov Dec1 3.08 38.88 10.82 14.34 5.76 4.20 2.67 4.39 5.94 2.22 55.68 32.162 3.29 18.88 9.15 12.73 5.41 3.35 2.95 4.58 5.41 2.50 5.95 30.943 3.47 9.80 8.53 12.13 5.20 3.00 2.98 5.21 5.45 2.40 12.93 50.484 292.50 9.62 8.23 10.83 5.48 8.87 2.80 5.23 5.56 2.59 55.14 72.025 435.43 7.50 8.36 9.84 5.26 7.45 2.92 5.44 5.27 3.15 52.53 26.30
6 182.51 7.06 10.10 9.82 4.71 3.03 3.62 5.82 5.34 6.93 51.11 18.987 154.98 6.55 30.45 9.71 4.28 2.33 3.51 4.51 5.57 2.08 47.31 16.218 71.89 6.00 33.97 9.33 4.24 2.63 3.48 3.74 5.53 2.44 48.69 14.329 30.18 5.94 24.61 8.98 3.71 2.62 3.55 4.12 5.47 2.46 52.20 15.33
10 18.58 5.71 16.82 8.73 4.64 11.81 3.95 5.18 5.42 2.35 53.13 36.28
11 13.95 5.62 12.62 8.39 3.22 59.74 3.69 6.59 7.13 2.55 54.12 36.5512 11.36 7.32 10.13 8.31 3.46 9.75 3.63 3.29 11.33 3.24 148.71 50.9813 9.47 6.64 9.59 8.40 3.43 4.75 26.68 3.66 1.92 4.21 374.94 28.1814 8.79 6.14 9.21 7.99 3.52 3.07 2.59 3.94 2.18 3.75 42.20 19.9115 8.22 6.14 25.76 8.04 3.40 2.65 1.85 3.48 2.23 4.08 14.96 16.83
16 7.85 8.48 1793.58 7.89 3.02 2.46 2.00 3.83 127.82 4.28 10.80 16.0217 7.17 7.32 697.60 7.31 3.12 2.30 2.32 4.95 15.90 4.72 12.08 13.8818 7.05 7.86 580.55 7.24 3.29 2.30 2.40 5.02 3.95 4.94 13.33 23.7919 6.79 7.46 365.26 7.12 3.25 2.77 2.56 5.00 2.45 3.51 15.27 28.6120 6.82 6.73 252.74 8.76 3.56 2.21 3.18 5.66 2.25 5.95 19.31 18.19
21 6.41 43.73 147.23 9.63 3.71 1.60 3.10 6.10 2.67 6.71 20.97 18.5322 6.35 199.83 50.12 6.60 4.49 2.26 3.04 5.70 3.08 4.10 20.24 15.8523 6.40 51.06 35.57 6.54 4.06 2.35 4.42 6.04 2.85 3.60 21.82 17.0524 6.20 28.01 28.79 6.51 4.57 2.36 4.26 6.38 3.10 3.22 25.92 16.3025 6.07 46.17 24.83 6.23 5.39 2.42 4.38 6.35 3.01 3.21 26.91 14.52
26 6.18 56.68 22.04 6.13 18.29 2.44 4.23 6.40 2.89 3.67 28.03 14.7127 6.00 29.57 19.70 6.40 504.22 2.19 4.54 6.44 2.92 3.96 27.86 14.5128 5.96 17.09 16.89 6.07 50.03 2.25 3.58 6.64 3.13 4.13 26.85 15.0529 5.71 15.30 5.88 15.13 2.66 4.07 6.10 3.08 4.28 27.69 15.3630 5.52 14.82 5.72 7.20 2.75 4.54 5.90 2.11 4.28 31.64 15.4931 18.82 15.46 5.00 4.95 6.35 4.12 15.56
TOTAL 1362.97 657.77 4308.85 251.59 704.03 164.55 128.43 162.03 260.96 115.63 1398.30 738.88MEAN 43.97 23.49 139.00 8.39 22.71 5.49 4.14 5.23 8.70 3.73 46.61 23.83MAX 435.43 199.83 1793.58 14.34 504.22 59.74 26.68 6.64 127.82 6.93 374.94 72.02MIN 3.08 5.62 8.23 5.72 3.02 1.60 1.85 3.29 1.92 2.08 5.95 13.88
Table A–9 MB040 Average Daily Flow
34
Appendix A Average Daily Flow Tables
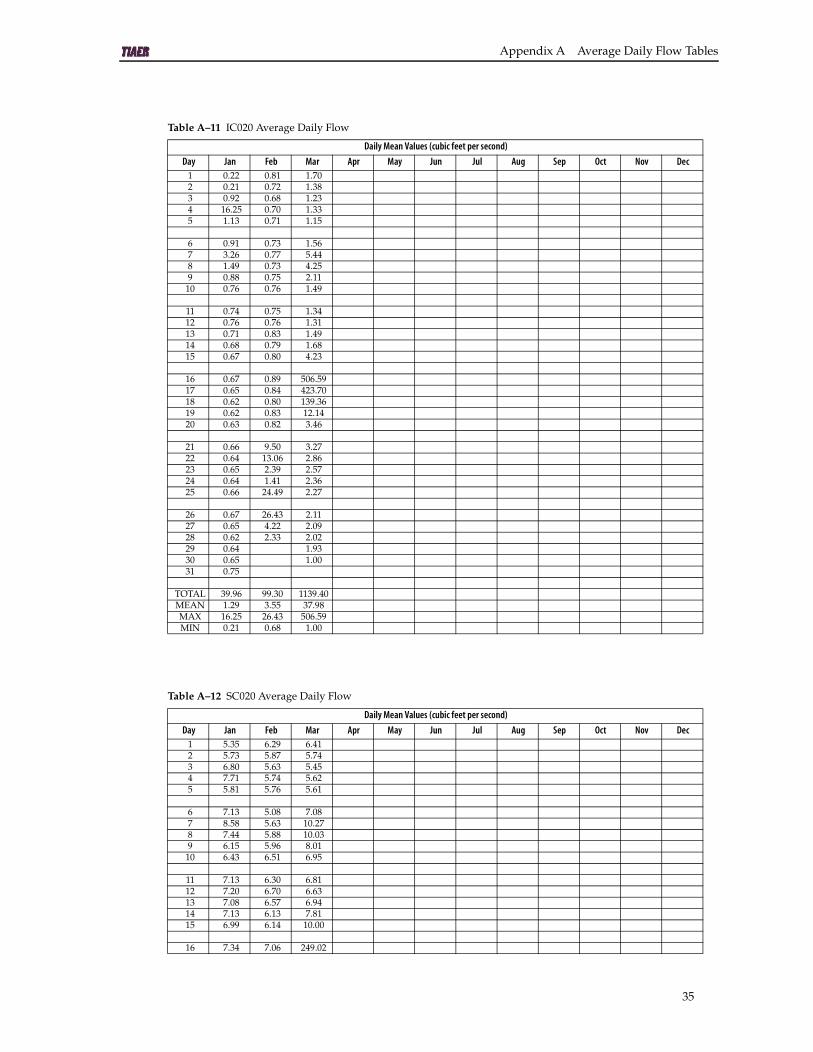
Table A–11 IC020 Average Daily Flow
Daily Mean Values (cubic feet per second)
Day Jan Feb Mar Apr May Jun Jul Aug Sep Oct Nov Dec1 0.22 0.81 1.702 0.21 0.72 1.383 0.92 0.68 1.234 16.25 0.70 1.335 1.13 0.71 1.15
6 0.91 0.73 1.567 3.26 0.77 5.448 1.49 0.73 4.259 0.88 0.75 2.11
10 0.76 0.76 1.49
11 0.74 0.75 1.3412 0.76 0.76 1.3113 0.71 0.83 1.4914 0.68 0.79 1.6815 0.67 0.80 4.23
16 0.67 0.89 506.5917 0.65 0.84 423.7018 0.62 0.80 139.3619 0.62 0.83 12.1420 0.63 0.82 3.46
21 0.66 9.50 3.2722 0.64 13.06 2.8623 0.65 2.39 2.5724 0.64 1.41 2.3625 0.66 24.49 2.27
26 0.67 26.43 2.1127 0.65 4.22 2.0928 0.62 2.33 2.0229 0.64 1.9330 0.65 1.0031 0.75
TOTAL 39.96 99.30 1139.40MEAN 1.29 3.55 37.98MAX 16.25 26.43 506.59MIN 0.21 0.68 1.00
Table A–12 SC020 Average Daily Flow
Daily Mean Values (cubic feet per second)
Day Jan Feb Mar Apr May Jun Jul Aug Sep Oct Nov Dec1 5.35 6.29 6.412 5.73 5.87 5.743 6.80 5.63 5.454 7.71 5.74 5.625 5.81 5.76 5.61
6 7.13 5.08 7.087 8.58 5.63 10.278 7.44 5.88 10.039 6.15 5.96 8.01
10 6.43 6.51 6.95
11 7.13 6.30 6.8112 7.20 6.70 6.6313 7.08 6.57 6.9414 7.13 6.13 7.8115 6.99 6.14 10.00
16 7.34 7.06 249.02
35

Hydrological Data for the Bosque River Watershed
17 6.26 6.30 18.7118 6.19 6.16 12.7719 6.45 6.67 11.2820 6.92 6.40 10.72
21 6.86 11.86 10.4422 8.67 14.20 10.0623 8.68 8.20 10.3624 8.24 7.31 10.5425 8.07 11.55 10.51
26 6.53 16.77 9.9627 6.82 9.03 8.6228 6.89 7.60 8.5929 6.61 8.9030 6.59 4.7631 7.47
TOTAL 217.24 209.29 504.60MEAN 7.01 7.47 16.82MAX 8.68 16.77 249.02MIN 5.35 5.08 4.76
Table A–13 GC100 Average Daily Flow
Daily Mean Values (cubic feet per second)
Day Jan Feb Mar Apr May Jun Jul Aug Sep Oct Nov Dec1 6.69 26.17 39.54 35.02 9.99 8.35 0.00 0.00 0.00 0.00 0.00 0.002 6.41 19.19 35.47 36.68 9.79 6.22 0.00 0.00 0.00 0.00 0.00 0.003 6.56 12.89 32.08 38.89 9.54 4.63 0.00 0.00 0.00 0.00 0.00 0.004 21.01 10.11 29.51 37.34 9.25 3.53 0.00 0.00 0.00 0.00 0.00 0.005 250.24 9.30 26.78 35.15 8.46 3.11 0.00 0.00 0.00 0.00 0.00 0.00
6 96.86 8.59 71.65 28.65 7.51 2.86 0.00 0.00 0.00 0.00 0.00 0.007 108.34 8.03 92.38 27.42 7.05 2.54 0.00 0.00 0.00 0.00 0.00 0.008 69.75 7.78 141.72 26.32 6.80 2.13 0.00 0.00 0.00 0.00 0.00 0.009 57.59 7.38 72.57 24.19 6.38 1.68 0.00 0.00 0.00 0.00 0.00 0.00
10 46.42 7.23 44.61 22.95 6.23 2.59 0.00 0.00 0.00 0.00 0.00 0.00
11 36.96 7.33 38.90 22.48 6.17 16.66 0.00 0.00 0.00 0.00 0.00 0.0012 31.65 7.51 35.99 20.74 5.84 20.76 0.00 0.00 0.00 0.00 0.00 0.0013 24.30 8.79 34.16 19.36 5.78 9.98 0.00 0.00 0.00 0.00 283.72 0.0014 14.80 8.97 33.66 17.32 5.94 7.00 0.00 0.00 0.00 0.00 38.00 0.0015 11.27 8.81 39.50 16.72 5.45 4.11 0.00 0.00 0.00 0.00 20.84 0.00
16 9.78 9.19 1587.44 15.90 4.92 2.76 0.00 0.00 0.00 0.00 13.91 0.0017 9.22 10.81 407.85 15.40 4.74 1.78 0.00 0.00 0.00 0.00 9.76 0.0018 9.04 9.84 356.34 14.96 4.71 1.50 0.00 0.00 0.00 0.00 6.26 0.0019 8.19 10.11 320.24 14.58 4.16 1.45 0.00 0.00 0.00 0.00 2.76 0.0020 8.27 9.39 287.92 14.23 3.87 0.96 0.00 0.00 0.00 0.00 1.69 0.00
21 8.79 57.82 276.51 14.59 3.85 0.58 0.00 0.00 0.00 0.00 0.36 0.0022 8.43 206.10 260.67 14.18 3.58 0.20 0.00 0.00 0.00 0.00 0.00 0.0023 7.82 78.24 218.25 13.54 3.24 0.00 0.00 0.00 0.00 0.00 0.00 0.0024 7.68 41.20 179.35 13.06 3.17 0.00 0.00 0.00 0.00 0.00 0.00 0.0025 7.74 145.72 134.77 12.46 3.59 0.00 0.00 0.00 0.00 0.00 0.00 0.00
26 7.69 296.09 100.03 12.01 13.15 0.00 0.00 0.00 0.00 0.00 0.00 0.0027 6.89 99.26 82.79 11.45 232.40 0.00 0.00 0.00 0.00 0.00 0.00 0.0028 6.76 54.01 66.24 10.96 44.36 0.00 0.00 0.00 0.00 0.00 0.00 0.0029 6.79 44.50 10.35 23.86 0.00 0.00 0.00 0.00 0.00 0.00 0.0030 6.87 40.63 10.16 15.76 0.00 0.00 0.00 0.00 0.00 0.00 0.0031 7.37 38.13 11.16 0.00 0.00 0.00 0.00
TOTAL 916.14 1185.86 5170.15 607.04 490.70 105.36 0.00 0.00 0.00 0.00 377.30 0.00MEAN 29.55 42.35 166.78 20.23 15.83 3.51 0.00 0.00 0.00 0.00 12.58 0.00MAX 250.24 296.09 1587.44 38.89 232.40 20.76 0.00 0.00 0.00 0.00 283.72 0.00MIN 6.41 7.23 26.78 10.16 3.17 0.00 0.00 0.00 0.00 0.00 0.00 0.00
Table A–12 SC020 Average Daily Flow
36

Appendix A Average Daily Flow Tables
Table A–14 SP020 Average Daily Flow
Daily Mean Values (cubic feet per second)
Day Jan Feb Mar Apr May Jun Jul Aug Sep Oct Nov Dec1 0.35 8.90 7.53 2.43 1.01 0.19 0.00 0.002 0.47 8.69 6.62 2.22 0.88 0.00 0.00 0.003 0.55 8.55 5.91 2.10 0.79 0.00 0.00 0.004 0.78 8.52 5.43 2.06 0.76 0.00 0.02 0.005 0.69 8.58 5.44 1.99 0.71 0.00 0.00 0.00
6 1.15 8.50 7.26 1.95 0.65 0.00 0.00 0.007 3.08 8.55 8.60 1.90 0.66 0.00 0.00 0.008 3.71 8.48 7.87 2.20 0.74 0.00 0.00 0.009 3.58 8.52 6.73 1.85 0.96 0.00 0.00 0.00
10 3.30 8.53 7.87 1.75 1.06 0.00 0.00 0.00
11 4.28 8.61 7.76 1.70 0.88 0.02 0.00 0.0012 5.54 9.16 7.58 1.66 0.62 0.00 0.00 0.0013 5.13 10.17 7.59 1.60 0.50 0.00 0.00 0.0014 5.93 9.84 8.25 1.57 0.66 0.00 0.00 0.0115 6.71 9.97 12.00 1.55 0.65 0.00 0.00 0.00
16 6.86 10.59 319.09 1.48 0.35 0.00 0.00 0.0017 7.12 11.01 15.43 1.45 0.28 0.00 0.00 0.0018 7.03 11.01 6.53 1.42 0.22 0.00 0.00 0.0019 7.13 12.26 5.00 1.38 0.12 0.00 0.00 0.0020 7.25 12.16 4.18 1.38 0.13 0.00 0.00 0.00
21 7.80 22.86 3.85 1.46 0.18 0.00 0.00 0.0022 8.54 28.54 3.49 1.39 0.23 0.00 0.00 0.0023 8.34 14.55 3.16 1.31 0.23 0.00 0.00 0.0024 8.34 12.41 2.85 1.19 0.22 0.00 0.00 0.0025 8.36 38.89 2.64 1.07 0.26 0.00 0.00 0.00
26 8.14 44.74 2.46 1.33 0.60 0.00 0.00 0.0027 8.20 11.91 2.40 1.62 1.01 0.00 0.00 0.0028 8.04 8.74 2.31 1.33 0.52 0.00 0.00 0.0029 8.07 2.29 1.20 0.50 0.00 0.00 0.0030 8.21 3.75 1.12 0.50 0.00 0.00 0.0031 8.52 3.62 0.35 0.00 0.00
TOTAL 171.18 373.23 495.49 48.64 17.22 0.22 0.02 0.01MEAN 5.52 13.33 15.98 1.62 0.56 0.01 0.00 0.00MAX 8.54 44.74 319.09 2.43 1.06 0.19 0.02 0.01MIN 0.35 8.48 2.29 1.07 0.12 0.00 0.00 0.00
Table A–15 BO070 Average Daily Flow
Daily Mean Values (cubic feet per second)
Day Jan Feb Mar Apr May Jun Jul Aug Sep Oct Nov Dec1 71.29 145.04 235.19 210.07 110.35 99.29 67.68 43.56 32.70 41.62 75.60 61.532 72.99 146.78 210.89 202.71 109.48 91.06 70.01 40.94 35.20 45.82 120.10 62.103 74.50 121.94 194.41 203.85 107.31 85.40 71.65 39.32 33.91 46.19 73.52 64.444 123.10 107.58 187.00 194.14 103.56 82.12 76.26 41.83 30.26 45.87 61.49 88.575 924.19 103.02 174.91 188.70 103.77 95.45 75.62 43.58 27.19 44.88 53.97 97.15
6 343.30 96.10 207.77 176.41 101.91 94.61 76.51 44.35 21.56 53.43 49.24 76.817 351.92 92.99 256.92 170.99 98.38 84.49 77.57 51.27 18.01 47.77 47.15 68.388 277.52 94.09 337.04 170.72 96.46 80.05 75.34 47.30 15.65 56.63 48.87 62.189 221.23 92.17 262.90 160.39 94.40 77.00 73.48 42.40 15.03 50.36 48.81 59.16
10 189.15 89.86 227.40 153.96 94.53 79.65 73.41 39.70 13.82 46.38 49.24 66.00
11 166.39 87.92 211.67 150.47 95.43 157.43 70.87 38.98 13.40 44.21 45.88 70.1912 155.21 90.58 196.24 148.25 95.05 175.92 71.16 36.83 25.98 44.68 49.13 83.7513 136.85 97.81 191.68 144.94 94.02 116.30 69.48 45.74 36.98 44.70 811.22 91.7814 121.28 98.06 192.78 142.65 92.82 97.29 91.81 46.72 53.38 43.38 230.11 75.3415 111.72 96.31 217.80 142.15 92.41 87.08 79.03 55.43 52.93 42.94 136.67 67.56
16 105.08 99.98 5614.34 135.54 90.51 82.32 73.34 58.21 85.25 44.01 106.01 63.24
37

Hydrological Data for the Bosque River Watershed
17 99.75 103.99 2375.80 130.06 92.09 78.48 70.31 54.88 179.28 49.06 91.23 61.5318 97.01 106.91 1982.33 129.12 92.60 75.94 68.56 54.55 82.81 55.72 80.58 60.8819 92.34 107.53 1519.26 127.73 92.84 74.81 65.31 47.53 63.96 53.96 75.14 61.9420 92.06 107.59 1059.89 127.14 92.33 74.16 66.06 42.91 54.36 61.07 70.62 71.84
21 94.01 123.58 812.20 129.34 93.27 74.47 64.66 44.57 50.98 60.35 68.32 68.2922 90.76 665.24 548.49 126.79 92.69 72.58 64.14 48.87 48.76 57.90 65.79 60.9023 87.66 319.98 430.50 123.10 93.02 70.35 61.27 49.13 45.96 64.68 66.01 59.2924 86.75 240.94 353.79 121.98 92.92 67.58 57.00 44.30 45.77 60.08 65.21 57.7925 86.89 314.48 305.98 119.19 90.96 69.56 55.89 34.16 45.59 54.81 65.27 57.88
26 86.49 1151.47 276.26 121.09 119.50 71.07 52.52 33.59 45.95 51.02 64.86 57.4327 83.91 394.52 258.14 118.12 913.39 69.68 52.88 34.05 44.94 48.51 66.33 57.8428 84.13 280.83 242.04 113.87 294.44 68.96 49.17 31.15 45.05 46.88 66.18 56.3729 83.11 224.65 111.59 172.80 68.31 53.65 25.17 44.47 47.32 66.00 57.3630 83.80 222.77 110.81 132.54 66.64 50.26 24.01 43.44 47.19 65.73 56.8831 87.08 232.80 112.63 45.10 20.70 47.06 57.90
TOTAL 4781.45 5577.28 19763.82 4405.88 4158.38 2588.03 2069.99 1305.71 1352.59 1548.46 2984.26 2062.26MEAN 154.24 199.19 637.54 146.86 134.14 86.27 66.77 42.12 45.09 49.95 99.48 66.52MAX 924.19 1151.47 5614.34 210.07 913.39 175.92 91.81 58.21 179.28 64.68 811.22 97.15MIN 71.29 87.92 174.91 110.81 90.51 66.64 45.10 20.70 13.40 41.62 45.88 56.37
Table A–16 BO090 Average Daily Flow
Daily Mean Values (cubic feet per second)
Day Jan Feb Mar Apr May Jun Jul Aug Sep Oct Nov Dec1 63.76 131.59 495.07 421.61 119.25 80.74 19.23 6.04 5.28 11.00 15.85 27.282 64.09 132.02 384.55 360.94 111.84 71.04 19.04 5.65 5.29 9.99 15.90 32.563 63.97 146.31 330.15 335.60 106.45 63.53 18.98 5.28 5.46 9.91 20.38 30.044 92.61 124.03 302.24 317.43 100.13 58.37 19.40 5.51 5.43 9.39 27.11 70.155 345.65 113.21 284.30 298.32 98.85 61.24 22.77 7.60 5.08 9.91 32.30 45.46
6 672.02 105.89 260.98 291.15 95.88 55.30 21.23 8.70 4.93 15.07 24.79 43.237 996.21 102.32 421.91 285.62 91.59 52.02 19.77 8.07 4.69 9.98 21.97 44.478 578.25 98.04 547.12 269.70 85.42 58.10 21.23 7.92 4.64 11.36 19.23 50.139 341.47 94.69 522.01 254.08 80.98 55.05 20.61 9.44 4.53 13.98 17.72 36.47
10 244.93 96.85 380.58 236.45 76.26 53.87 18.26 8.31 4.97 23.82 18.35 523.86
11 204.29 99.10 319.96 220.83 71.19 59.53 17.22 8.00 5.30 20.03 17.01 365.6912 184.97 99.73 283.02 212.27 70.86 58.24 15.47 9.89 7.25 13.24 16.77 164.9713 165.04 121.57 268.61 205.60 69.36 98.16 15.54 9.53 8.59 14.01 166.50 101.2714 148.63 132.92 269.58 193.28 70.63 84.50 15.38 10.84 8.39 6.21 701.37 72.8815 139.19 121.85 384.08 184.51 70.36 64.93 14.90 11.11 9.26 0.89 188.00 63.93
16 128.92 116.43 50196.16 174.14 66.55 53.77 12.41 10.96 48.74 0.77 98.18 60.3917 120.38 116.12 8242.73 163.45 64.79 46.87 12.90 9.99 66.32 1.96 68.00 51.5818 115.18 117.66 3606.05 154.98 62.18 42.80 19.14 10.24 26.14 8.75 53.46 49.0319 110.14 136.29 2742.41 150.05 61.15 41.07 16.41 10.29 36.65 15.78 43.35 56.4320 109.32 131.37 1932.67 147.50 59.65 39.04 18.59 8.21 39.87 25.10 35.33 49.99
21 108.47 142.42 1496.71 163.95 58.73 36.79 15.35 8.22 19.51 27.68 30.08 47.3122 105.45 2455.06 1177.34 153.99 57.38 34.61 13.69 8.24 15.32 23.13 27.58 42.5823 106.02 991.87 920.60 144.16 56.55 32.46 12.03 8.07 27.14 19.86 25.47 41.7224 107.11 531.99 764.70 131.99 53.97 30.51 11.32 7.80 21.30 17.91 23.30 42.9125 107.11 378.09 655.64 129.94 53.15 28.53 10.96 7.40 15.06 16.86 21.85 42.02
26 79.23 3819.64 565.04 129.95 56.08 28.67 9.52 7.07 12.77 13.34 20.36 41.0827 94.60 1314.03 496.64 174.06 89.69 27.03 4.46 6.42 11.59 12.92 20.01 40.7228 94.51 729.87 447.43 158.07 706.95 24.36 0.81 5.77 11.12 12.21 19.85 39.8629 92.07 412.03 139.71 236.62 23.55 3.20 5.28 10.70 11.65 19.36 38.4830 89.55 399.53 125.84 135.64 22.87 7.76 5.36 11.29 12.02 23.82 37.1631 101.15 457.35 99.43 6.81 5.94 11.60 36.18
TOTAL 5974.27 12700.95 79967.18 6329.16 3237.51 1487.55 454.39 247.14 462.57 410.33 1833.23 2389.83MEAN 192.72 453.61 2579.59 210.97 104.44 49.58 14.66 7.97 15.42 13.24 61.11 77.09MAX 996.21 3819.64 50196.16 421.61 706.95 98.16 22.77 11.11 66.32 27.68 701.37 523.86MIN 63.76 94.69 260.98 125.84 53.15 22.87 0.81 5.28 4.53 0.77 15.85 27.28
Table A–15 BO070 Average Daily Flow
38

Appendix A Average Daily Flow Tables
Table A–17 NC060 Average Daily Flow
Daily Mean Values (cubic feet per second)
Day Jan Feb Mar Apr May Jun Jul Aug Sep Oct Nov Dec1 20.62 38.71 42.03 119.53 53.40 23.70 14.49 0.00 0.00 0.00 26.29 31.062 20.69 27.67 39.59 110.88 51.87 22.81 13.02 0.00 0.00 0.00 33.20 27.423 20.82 25.48 36.72 106.79 50.09 21.82 12.33 0.00 0.00 0.00 30.50 28.914 60.45 24.68 36.73 102.40 48.72 22.00 14.41 0.00 0.00 0.00 27.62 483.325 51.90 24.93 35.07 99.75 47.76 28.86 21.75 0.00 0.00 0.00 26.45 35.34
6 54.96 24.44 32.20 96.27 46.06 26.73 17.06 0.00 0.00 27.61 25.70 26.317 360.54 24.12 41.18 94.50 43.37 24.87 14.92 0.00 0.00 19.12 25.89 25.148 78.18 24.19 42.81 96.43 40.69 23.93 12.54 0.00 0.00 7.50 25.92 33.989 48.35 23.94 33.35 89.77 39.02 23.28 10.83 0.00 0.00 2.47 26.42 25.38
10 39.45 25.83 29.27 85.87 36.65 22.92 9.30 0.00 0.00 0.04 28.67 953.59
11 35.86 25.70 28.85 83.30 35.26 26.23 7.03 0.00 0.00 0.00 29.91 180.7312 34.62 25.00 28.18 81.28 33.67 26.40 5.63 0.00 0.00 0.00 28.86 73.0513 30.63 29.11 28.20 78.11 33.02 24.35 3.28 0.00 0.00 0.00 41.40 44.6814 29.43 26.85 30.44 74.65 33.54 22.27 1.99 0.00 0.00 0.00 43.84 34.2215 28.41 26.04 74.24 73.38 32.74 22.81 0.79 0.00 0.00 0.00 43.34 28.65
16 27.90 26.38 16747.30 70.80 29.96 22.70 0.06 0.00 453.94 0.00 33.73 27.3317 26.68 26.03 3905.59 68.57 28.81 21.21 7.49 0.00 51.95 8.40 30.80 26.4618 26.52 26.32 315.19 67.56 28.24 20.27 11.41 0.00 28.48 32.82 29.76 27.7319 25.82 45.20 243.00 65.94 27.37 21.73 6.60 0.00 25.23 21.11 29.03 29.8220 26.04 30.47 195.18 64.69 26.60 28.94 2.69 0.00 19.11 52.34 28.43 26.77
21 26.04 132.67 172.87 73.54 26.17 25.55 0.00 0.00 12.88 42.68 28.05 26.3222 25.75 570.42 161.24 67.36 25.78 21.88 0.00 0.00 8.73 28.52 28.30 24.7923 26.21 79.45 148.53 62.10 25.27 20.79 0.00 0.00 5.62 26.32 28.79 24.7224 25.55 53.00 143.43 60.41 25.18 19.81 0.00 0.00 9.72 25.00 29.08 24.6825 25.21 48.14 139.20 58.86 26.45 18.83 0.00 0.00 5.91 24.11 29.57 24.52
26 24.76 132.79 134.65 58.90 28.66 18.20 0.00 0.00 2.77 23.93 29.14 24.4027 24.24 57.74 131.46 66.57 34.32 17.36 0.00 0.00 1.03 23.49 29.90 24.2128 24.09 46.78 128.51 59.90 31.92 16.40 0.00 0.00 0.00 23.23 30.04 23.3329 23.89 125.85 56.94 27.79 15.91 0.00 0.00 0.00 22.55 28.98 23.0230 23.55 135.30 54.53 26.06 15.43 0.00 0.00 0.00 21.82 48.90 22.4031 36.51 161.28 24.77 0.00 0.00 22.08 22.19
TOTAL 1333.66 1672.05 23547.41 2349.60 1069.21 667.96 187.61 0.00 625.37 455.14 926.50 2434.46MEAN 43.02 59.72 759.59 78.32 34.49 22.27 6.05 0.00 20.85 14.68 30.88 78.53MAX 360.54 570.42 16747.30 119.53 53.40 28.94 21.75 0.00 453.94 52.34 48.90 953.59MIN 20.62 23.94 28.18 54.53 24.77 15.43 0.00 0.00 0.00 0.00 25.70 22.19
Table A–18 BO100 Average Daily Flow
Daily Mean Values (cubic feet per second)
Day Jan Feb Mar Apr May Jun Jul Aug Sep Oct Nov Dec1 98.42 161.35 626.52 603.25 203.05 123.86 34.57 16.31 15.01 13.20 25.59 40.362 97.21 146.68 511.44 540.86 193.79 107.40 33.83 15.79 14.20 12.03 29.04 41.663 97.55 153.83 438.20 510.08 186.38 97.57 33.95 15.32 13.71 11.94 30.34 42.534 118.49 138.56 397.23 484.97 174.52 91.90 35.14 15.82 13.64 11.86 32.63 662.805 414.68 124.15 371.03 465.11 171.30 105.20 43.38 21.86 13.54 11.97 42.65 82.39
6 1031.98 115.23 327.55 454.12 167.20 94.42 37.50 26.84 13.10 24.62 39.24 69.687 1744.01 109.50 483.48 446.89 158.97 88.26 35.90 22.62 12.65 16.57 35.48 52.838 821.24 105.56 609.64 434.42 152.48 89.62 36.01 19.47 12.20 12.25 33.03 82.629 498.27 101.65 629.50 411.39 146.78 89.24 36.57 18.41 12.10 12.50 31.30 59.29
10 361.30 108.44 480.60 394.92 140.54 84.87 34.79 19.62 11.79 15.04 31.63 1360.99
11 285.81 111.78 399.24 378.42 136.31 97.28 31.74 19.39 14.74 18.97 30.50 842.7512 247.60 109.61 348.44 360.66 133.29 94.93 30.88 21.81 20.97 16.46 29.24 406.7613 207.93 139.01 323.59 347.28 133.58 114.67 29.92 22.69 18.78 13.76 44.23 227.0914 184.40 151.28 319.11 330.24 133.78 127.38 30.33 23.94 17.26 13.02 849.09 149.1115 171.09 144.94 491.12 316.29 134.04 100.45 29.39 23.57 17.40 10.80 331.20 119.67
16 156.25 139.61 36602.54 302.19 126.11 87.05 28.89 22.25 448.69 8.22 146.26 108.42
39

Hydrological Data for the Bosque River Watershed
17 143.48 137.18 23897.65 287.56 121.01 78.52 29.84 21.31 159.84 11.48 91.02 95.1718 135.33 138.41 5159.05 272.21 118.91 73.81 31.40 21.34 55.45 22.28 68.76 92.4619 124.59 180.73 4130.38 264.93 115.02 71.69 32.96 21.47 35.22 15.30 55.78 110.2920 121.04 164.90 2978.13 258.60 113.09 68.78 30.80 20.70 52.17 43.47 46.75 94.62
21 123.51 183.42 2179.69 286.03 111.69 66.64 31.41 18.04 40.98 46.01 40.26 88.2722 118.24 3567.42 1676.33 271.29 109.44 64.63 27.24 18.18 24.44 30.51 37.45 77.6623 116.90 1348.90 1239.81 252.61 106.92 62.67 24.89 19.29 25.38 22.53 36.04 73.8624 111.37 691.89 986.36 234.66 105.04 60.86 23.62 18.82 39.03 20.05 34.69 76.3825 108.54 522.17 835.99 226.19 102.82 59.03 22.67 17.78 27.07 17.90 33.63 74.91
26 105.73 4387.56 747.66 223.59 105.85 58.70 21.68 16.68 23.26 16.76 31.93 73.4427 101.74 1696.40 688.81 281.00 114.86 57.91 20.16 16.11 21.69 15.69 31.95 73.2728 99.90 833.09 642.73 259.98 622.59 56.01 15.74 15.58 19.31 15.31 32.13 70.2029 96.94 608.19 244.26 326.51 54.28 11.81 16.82 18.96 21.88 31.83 67.5830 94.00 591.27 217.89 194.47 53.73 12.44 17.05 18.40 20.81 48.93 64.6331 107.14 668.88 148.79 17.01 14.92 20.52 62.61
TOTAL 8244.65 15913.24 90390.14 10361.91 5009.12 2481.37 896.45 599.78 1230.96 563.70 2382.57 5544.28MEAN 265.96 568.33 2915.81 345.40 161.58 82.71 28.92 19.35 41.03 18.18 79.42 178.85MAX 1744.01 4387.56 36602.54 603.25 622.59 127.38 43.38 26.84 448.69 46.01 849.09 1360.99MIN 94.00 101.65 319.11 217.89 102.82 53.73 11.81 14.92 11.79 8.22 25.59 40.36
Table A–19 HCO60 Average Daily Flow
Daily Mean Values (cubic feet per second)
Day Jan Feb Mar Apr May Jun Jul Aug Sep Oct Nov Dec1 40.73 45.65 82.25 61.64 13.18 0.00 0.00 0.00 0.03 0.00 23.85 45.222 43.88 48.29 68.24 50.53 11.92 0.01 0.01 0.00 0.03 0.00 19.32 41.063 42.59 41.57 59.37 44.79 11.08 0.01 0.00 0.00 0.03 0.00 19.12 37.914 85.26 37.07 55.45 40.57 10.53 0.01 0.01 0.00 0.02 0.00 20.95 216.505 294.13 34.82 51.47 39.04 9.96 0.00 0.01 0.00 0.02 0.01 20.50 213.50
6 643.34 32.86 47.83 38.11 9.37 0.00 0.01 0.00 0.02 2.56 20.19 147.637 724.43 31.26 47.79 37.12 8.67 0.01 0.01 0.00 0.01 0.00 20.49 104.168 414.23 30.12 52.95 36.93 7.97 0.01 0.00 0.00 0.01 0.00 20.30 78.749 322.82 29.11 48.95 33.41 7.23 0.00 0.00 0.00 0.02 0.00 20.54 71.02
10 248.96 36.30 44.87 31.89 6.55 0.01 0.00 0.00 0.02 0.00 24.09 343.72
11 190.42 36.26 42.90 31.06 6.29 0.00 0.00 0.00 0.01 0.00 23.22 490.9712 150.55 33.32 41.12 30.07 5.56 0.01 0.00 0.00 0.00 0.00 23.72 375.6413 101.77 35.23 40.41 28.94 5.40 0.00 0.00 0.00 0.00 0.00 35.23 243.5414 78.10 36.56 41.04 27.45 5.41 0.00 0.00 0.00 0.00 0.00 33.03 191.5215 68.58 36.04 50.67 26.41 7.51 0.00 0.01 0.01 0.00 0.01 40.50 157.93
16 60.99 35.56 659.57 25.22 5.75 0.01 0.00 0.00 0.00 0.01 44.03 123.1817 53.23 34.32 541.46 23.44 4.70 0.01 0.00 0.00 0.00 157.76 40.51 92.6618 49.04 34.17 440.51 22.34 4.22 0.01 0.00 0.00 0.00 58.89 37.10 87.7319 44.13 43.66 288.67 21.55 2.87 0.01 0.00 0.00 0.00 30.18 34.45 85.4520 42.62 47.09 208.75 21.08 0.06 0.01 0.00 0.01 0.00 153.31 32.07 73.50
21 40.96 93.90 179.90 25.92 0.01 0.01 0.00 0.00 0.00 54.37 30.26 68.4422 40.63 396.99 142.22 22.46 0.00 0.01 0.00 0.00 0.00 42.79 28.67 61.5223 38.29 256.45 95.87 19.28 0.01 0.01 0.00 0.00 0.00 38.49 27.48 58.0824 36.25 193.98 70.16 18.79 0.01 0.01 0.00 0.01 0.00 32.56 26.62 57.0425 35.48 147.45 60.09 18.31 0.00 0.00 0.00 0.00 0.00 28.67 26.47 55.84
26 34.67 266.69 53.27 17.83 0.00 0.00 0.00 0.00 0.00 24.72 26.25 54.6127 32.71 175.03 48.97 17.24 0.00 0.00 0.00 0.00 0.00 21.99 25.57 54.1028 31.89 121.15 45.53 16.34 0.00 0.00 0.00 0.00 0.00 20.14 25.53 51.8329 30.84 43.30 15.07 0.00 0.00 0.00 0.00 0.00 17.74 25.82 49.6830 30.00 42.30 14.26 0.01 0.01 0.00 0.01 0.00 16.02 48.04 47.4831 31.04 73.36 0.00 0.00 0.02 15.46 46.09
TOTAL 4082.55 2390.93 3769.20 857.07 144.28 0.14 0.13 0.14 0.28 715.72 843.91 3826.30MEAN 131.70 85.39 121.59 28.57 4.65 0.00 0.00 0.00 0.01 23.09 28.13 123.43MAX 724.43 396.99 659.57 61.64 13.18 0.01 0.01 0.02 0.03 157.76 48.04 490.97MIN 30.00 29.11 40.41 14.26 0.00 0.00 0.00 0.00 0.00 0.00 19.12 37.91
Table A–18 BO100 Average Daily Flow
40

Appendix A Average Daily Flow Tables
Table A–20 MB060 Average Daily Flow
Daily Mean Values (cubic feet per second)
Day Jan Feb Mar Apr May Jun Jul Aug Sep Oct Nov Dec1 47.93 148.39 140.83 87.22 9.51 0.06 0.00 0.00 0.00 0.00 57.07 70.622 52.21 90.63 128.17 78.55 6.84 0.02 0.00 0.00 0.00 0.00 58.85 55.533 53.63 78.28 117.68 73.45 4.14 0.00 0.00 0.00 0.00 0.00 43.85 53.224 99.61 72.87 114.18 66.37 3.26 0.00 0.00 0.00 0.00 0.00 39.07 365.115 373.46 72.72 107.27 66.20 3.09 0.02 0.00 0.00 0.00 0.07 36.62 99.41
6 1214.04 69.11 99.33 66.73 2.89 0.00 0.00 0.00 0.00 6.09 33.15 83.687 1749.25 65.00 101.51 63.34 2.65 0.00 0.00 0.00 0.00 0.51 35.58 69.258 452.74 63.03 114.56 62.78 2.43 0.00 0.00 0.00 0.00 0.48 37.44 63.589 200.12 60.66 94.55 58.16 2.27 0.00 0.00 0.00 0.00 0.47 37.53 58.56
10 157.50 81.93 85.28 52.32 1.99 0.00 0.00 0.00 0.00 0.47 41.63 926.23
11 151.80 83.95 81.89 49.25 0.98 0.00 0.00 0.00 0.00 0.46 33.25 411.2112 148.32 69.47 79.72 47.08 0.55 0.00 0.00 0.00 0.00 0.47 28.67 210.3713 131.94 82.43 80.06 46.63 0.52 0.00 0.00 0.00 0.00 0.47 79.39 134.0314 127.70 76.29 82.69 38.37 0.52 0.00 0.00 0.00 0.00 0.46 81.76 116.3215 121.03 73.18 108.12 38.62 0.51 0.00 0.00 0.00 0.00 0.46 93.54 107.83
16 112.27 75.71 2029.49 35.89 0.48 0.00 0.00 0.00 0.00 0.44 79.34 103.3917 103.62 77.65 397.83 31.36 0.45 0.00 0.00 0.00 0.16 333.08 69.46 98.6618 100.93 71.62 222.16 29.26 0.42 0.00 0.00 0.00 0.36 245.69 65.55 101.9619 94.16 113.61 184.43 27.63 0.35 0.00 0.00 0.00 0.13 72.12 60.38 115.7620 93.27 94.71 146.19 25.94 0.30 0.00 0.00 0.00 0.08 450.00 55.77 101.10
21 90.57 194.09 134.59 38.41 0.26 0.00 0.00 0.00 0.05 148.90 52.60 98.4522 88.85 981.89 127.09 30.15 0.22 0.00 0.00 0.00 0.04 99.66 49.31 89.3123 81.55 166.07 119.49 24.47 0.18 0.00 0.00 0.00 0.06 83.16 47.14 86.8824 77.69 139.15 110.74 21.22 0.25 0.00 0.00 0.00 0.17 69.60 45.25 87.6825 76.83 129.74 105.00 18.17 0.19 0.00 0.00 0.00 0.12 62.29 43.57 88.50
26 75.86 579.18 98.20 17.77 0.20 0.00 0.00 0.00 0.11 55.97 39.64 88.4427 69.39 184.28 94.61 19.97 0.32 0.00 0.00 0.00 0.14 52.19 37.79 84.5928 68.38 154.99 90.92 17.11 0.48 0.00 0.00 0.00 0.15 50.49 35.91 77.6529 65.55 87.99 13.32 0.37 0.00 0.00 0.00 0.09 46.91 36.95 74.2530 63.23 84.24 10.63 0.22 0.00 0.00 0.00 0.02 40.89 106.50 67.3431 89.62 122.05 0.13 0.00 0.00 37.40 64.83
TOTAL 6433.02 4150.60 5690.82 1256.35 46.96 0.09 0.00 0.00 1.69 1859.18 1562.55 4253.71MEAN 207.52 148.24 183.57 41.88 1.51 0.00 0.00 0.00 0.06 59.97 52.09 137.22MAX 1749.25 981.89 2029.49 87.22 9.51 0.06 0.00 0.00 0.36 450.00 106.50 926.23MIN 47.93 60.66 79.72 10.63 0.13 0.00 0.00 0.00 0.00 0.00 28.67 53.22
Table A–21 TC020 Average Daily Flow
Daily Mean Values (cubic feet per second)
Day Jan Feb Mar Apr May Jun Jul Aug Sep Oct Nov Dec1 1.83 5.41 5.55 2.98 1.42 0.37 0.00 0.00 0.00 0.46 15.59 3.892 2.36 3.29 5.05 2.95 1.29 0.36 0.00 0.00 0.00 0.48 6.50 3.603 2.46 2.87 4.79 2.75 1.20 0.35 0.00 0.00 0.00 0.50 5.13 3.764 11.30 2.69 5.10 2.63 1.19 0.36 0.00 0.00 0.00 0.50 4.87 4.785 22.72 2.81 4.61 2.69 1.15 0.39 0.00 0.00 0.00 0.64 4.07 3.47
6 155.86 2.44 3.93 2.75 0.99 0.36 0.00 0.00 0.00 7.33 3.95 3.227 125.95 2.35 5.00 2.68 0.92 0.36 0.00 0.00 0.00 1.12 5.29 2.778 21.37 2.34 4.59 2.96 0.92 0.36 0.00 0.00 0.00 0.83 5.22 2.529 13.92 2.28 3.25 2.51 0.62 0.34 0.00 0.00 0.00 0.79 5.73 2.54
10 12.01 13.36 3.05 2.36 0.58 0.34 0.00 0.00 0.00 0.79 7.05 99.27
11 12.86 4.57 3.08 2.31 0.57 0.35 0.00 0.00 0.00 0.80 3.54 25.1912 12.26 3.76 3.03 2.29 0.57 0.33 0.00 0.00 0.00 0.83 3.70 16.0013 8.05 5.66 3.26 2.16 0.55 0.31 0.00 0.00 0.00 0.94 28.97 10.6614 9.14 3.85 4.06 2.10 0.56 0.29 0.00 0.00 0.00 0.98 16.21 9.1315 7.25 3.90 9.08 2.10 0.54 0.28 0.00 0.00 0.00 0.97 13.74 8.02
16 6.30 5.53 150.57 1.94 0.53 0.27 0.00 0.00 0.37 0.97 9.30 7.32
41

Hydrological Data for the Bosque River Watershed
17 4.90 4.51 13.57 1.84 0.52 0.25 0.00 0.00 0.22 318.99 7.37 6.5318 4.85 5.24 10.45 1.86 0.51 0.24 0.00 0.00 0.06 134.43 6.94 11.7919 3.88 9.20 7.50 1.81 0.49 0.22 0.00 0.00 0.28 19.80 6.05 11.3420 4.65 4.47 5.28 1.81 0.48 0.20 0.00 0.00 0.33 191.10 4.81 8.51
21 4.71 55.22 4.88 2.48 0.47 0.18 0.00 0.00 0.34 35.00 4.43 8.5322 4.21 33.09 4.58 2.01 0.46 0.17 0.00 0.00 0.35 17.20 4.27 5.1723 3.57 10.13 4.22 1.95 0.45 0.15 0.00 0.00 0.37 12.65 4.08 5.3924 3.30 7.77 3.69 1.88 0.44 0.12 0.00 0.00 0.40 10.79 3.93 5.7725 3.36 9.11 3.51 1.73 0.44 0.08 0.00 0.00 0.39 9.46 3.74 7.61
26 3.24 53.19 3.33 1.79 0.43 0.04 0.00 0.00 0.40 8.00 3.29 7.5527 2.78 8.62 3.35 1.88 0.47 0.01 0.00 0.00 0.40 7.05 3.33 6.4028 2.85 6.51 3.23 1.77 0.42 0.00 0.00 0.00 0.42 7.35 3.30 5.2329 2.65 3.14 1.61 0.40 0.00 0.00 0.00 0.42 6.31 3.20 4.7230 2.63 3.34 1.55 0.39 0.00 0.00 0.00 0.44 5.33 15.23 4.1231 5.81 3.42 0.37 0.00 0.00 4.98 3.98
TOTAL 483.01 274.15 295.49 66.12 20.34 7.05 0.00 0.00 5.19 807.35 212.81 308.77MEAN 15.58 9.79 9.53 2.20 0.66 0.24 0.00 0.00 0.17 26.04 7.09 9.96MAX 155.86 55.22 150.57 2.98 1.42 0.39 0.00 0.00 0.44 318.99 28.97 99.27MIN 1.83 2.28 3.03 1.55 0.37 0.00 0.00 0.00 0.00 0.46 3.20 2.52
Table A–22 WC020 Average Daily Flow
Daily Mean Values (cubic feet per second)
Day Jan Feb Mar Apr May Jun Jul Aug Sep Oct Nov Dec1 1.19 1.43 1.00 0.81 0.48 0.52 0.02 0.02 0.02 0.64 1.42 0.922 1.36 1.28 0.98 0.81 0.47 0.52 0.02 0.02 0.02 0.62 1.05 0.923 1.28 1.22 0.96 0.80 0.48 0.53 0.02 0.02 0.02 0.62 0.99 0.934 11.21 1.19 0.95 0.79 0.47 0.58 0.02 0.02 0.02 0.59 0.97 0.935 7.14 1.20 0.93 0.79 0.45 0.69 0.12 0.02 0.02 0.80 0.94 0.91
6 70.09 1.13 0.92 0.78 0.44 0.67 0.15 0.02 0.02 23.97 0.93 0.907 34.86 1.09 0.95 0.78 0.44 0.67 0.02 0.02 0.02 1.08 0.98 0.888 5.14 1.08 0.94 0.81 0.42 0.64 0.02 0.02 0.02 1.01 0.96 0.869 2.77 1.06 0.86 0.76 0.42 0.64 0.02 0.02 0.02 0.98 0.96 0.60
10 2.54 1.56 0.84 0.75 0.40 0.65 0.02 0.02 0.02 0.94 0.98 1.02
11 2.57 1.21 0.84 0.73 0.39 0.66 0.02 0.02 0.02 0.91 0.89 1.1412 2.42 1.15 0.84 0.70 0.39 0.62 0.02 0.02 0.02 0.89 0.91 1.9513 2.09 1.21 0.85 0.72 0.41 0.57 0.02 0.02 0.02 0.87 4.71 1.6814 2.19 1.16 0.88 0.70 0.41 0.54 0.02 0.02 0.02 0.85 1.60 1.5815 2.04 1.20 0.95 0.69 0.41 0.53 0.02 0.02 0.02 0.83 1.46 1.52
16 1.92 1.36 24.64 0.69 0.41 0.47 0.02 0.02 0.46 0.81 1.27 1.4617 1.75 1.33 1.25 0.66 0.41 0.38 0.02 0.02 10.54 88.60 1.20 1.4018 1.70 1.30 1.15 0.62 0.40 0.35 0.02 0.02 0.69 39.86 1.15 1.6319 1.57 1.60 1.12 0.58 0.40 0.28 0.02 0.02 0.65 2.79 1.08 1.5020 1.60 1.33 0.98 0.53 0.41 0.21 0.02 0.02 0.64 57.39 0.99 1.42
21 1.61 14.50 0.96 0.60 0.41 0.14 0.02 0.02 0.67 4.24 0.98 1.3922 1.51 9.18 0.94 0.54 0.42 0.10 0.02 0.02 0.67 2.04 0.97 1.2023 1.33 2.51 0.92 0.52 0.42 0.08 0.02 0.02 0.67 1.79 0.96 1.2124 1.27 1.82 0.90 0.48 0.43 0.04 0.02 0.02 0.67 1.64 0.96 1.2125 1.26 1.83 0.86 0.45 0.45 0.02 0.02 0.02 0.66 1.51 0.96 1.31
26 1.26 5.61 0.82 0.51 0.48 0.02 0.02 0.02 0.67 1.39 0.93 1.3027 1.18 1.12 0.86 0.54 0.54 0.02 0.02 0.02 0.68 1.32 0.93 1.2328 1.19 1.04 0.84 0.51 0.49 0.02 0.02 0.02 0.67 1.30 0.92 1.1729 1.17 0.81 0.50 0.50 0.02 0.02 0.02 0.66 1.19 0.90 1.1230 1.18 0.83 0.49 0.50 0.02 0.02 0.02 0.67 1.10 0.98 1.0831 1.48 0.87 0.51 0.02 0.02 1.04 1.08
TOTAL 171.83 62.69 52.39 19.63 13.63 11.14 0.75 0.54 19.92 243.60 34.92 37.44MEAN 5.54 2.24 1.69 0.65 0.44 0.37 0.02 0.02 0.66 7.86 1.16 1.21MAX 70.09 14.50 24.64 0.81 0.54 0.69 0.15 0.02 10.54 88.60 4.71 1.95MIN 1.17 1.04 0.81 0.45 0.39 0.02 0.02 0.02 0.02 0.59 0.89 0.60
Table A–21 TC020 Average Daily Flow
42

Appendix A Average Daily Flow Tables
Table A–23 SB050 Average Daily Flow
Daily Mean Values (cubic feet per second)
Day Jan Feb Mar Apr May Jun Jul Aug Sep Oct Nov Dec1 37.02 28.87 75.35 23.69 0.00 0.00 0.00 0.00 0.00 0.00 66.23 51.972 33.96 20.24 67.98 20.02 0.00 0.00 0.00 0.00 0.00 0.00 60.20 48.293 30.89 15.35 64.42 17.66 0.00 0.00 0.00 0.00 0.00 0.00 51.11 49.694 86.19 12.60 60.83 14.84 0.00 0.00 0.00 0.00 0.00 0.00 49.18 49.445 323.13 13.09 57.25 14.16 0.00 7.61 0.00 0.00 0.00 2.98 47.07 58.09
6 1045.86 9.83 53.67 13.07 0.00 0.07 0.00 0.00 0.00 194.76 45.72 51.547 2170.35 7.57 50.67 12.49 0.00 0.00 0.00 0.00 0.00 50.80 46.30 47.268 319.68 7.08 48.97 20.30 0.00 0.00 0.00 0.00 0.00 41.13 46.31 45.079 161.36 5.84 47.31 11.35 0.00 0.00 0.00 0.00 0.00 37.97 45.99 44.43
10 108.19 158.54 45.66 7.91 0.00 0.00 0.00 0.00 0.00 34.49 47.13 3965.57
11 96.20 55.50 44.01 6.98 0.00 0.00 0.00 0.00 0.00 30.93 44.00 886.5412 89.83 37.14 42.36 5.42 0.00 0.00 0.00 0.00 0.00 28.01 43.24 372.3313 72.61 33.15 40.71 3.95 0.00 0.00 0.00 0.00 0.00 25.44 492.17 195.2914 67.33 27.97 39.04 2.35 0.00 0.00 0.00 0.00 0.00 22.05 183.84 130.9915 59.88 27.29 37.19 1.41 0.00 0.00 0.00 0.00 0.00 22.15 144.97 99.79
16 52.96 28.11 1345.50 0.59 0.00 0.00 0.00 0.00 2.94 18.49 101.96 88.4517 47.65 30.59 152.25 0.00 0.00 0.00 0.00 0.00 22.25 173.64 90.33 76.7818 46.08 27.05 80.17 0.00 0.00 0.00 0.00 0.00 3.99 1448.25 83.17 118.8819 44.93 99.54 70.12 0.00 0.00 0.00 0.00 0.00 0.00 144.47 75.68 133.8520 42.97 55.86 51.57 0.00 0.00 0.00 0.00 0.00 0.00 1749.82 67.54 84.98
21 41.48 267.55 47.15 7.92 0.00 0.00 0.00 0.00 0.00 415.48 62.04 78.8622 39.76 924.55 44.76 0.45 0.00 0.00 0.00 0.00 0.00 180.26 58.63 64.0423 36.37 137.27 42.40 0.00 0.00 0.00 0.00 0.00 0.00 113.66 56.67 58.8424 33.79 96.89 39.78 0.00 0.00 0.00 0.00 0.00 0.00 95.02 53.56 58.1325 30.86 94.62 36.70 0.00 0.00 0.00 0.00 0.00 0.00 85.30 51.31 58.44
26 28.77 682.41 32.83 2.63 0.00 0.00 0.00 0.00 0.00 77.78 49.08 57.6027 23.63 119.40 30.43 17.55 0.00 0.00 0.00 0.00 0.00 69.80 48.16 53.0228 22.32 88.71 27.29 1.72 0.00 0.00 0.00 0.00 0.00 65.98 48.10 48.3229 20.07 23.70 0.00 0.00 0.00 0.00 0.00 0.00 62.31 46.67 46.4830 18.21 24.43 0.00 0.00 0.00 0.00 0.00 0.00 55.81 69.00 43.8431 19.97 34.94 0.00 0.00 0.00 52.13 42.55
TOTAL 5252.29 3112.60 2859.44 206.44 0.00 7.67 0.00 0.00 29.18 5298.91 2375.34 7209.35MEAN 169.43 111.16 92.24 6.88 0.00 0.26 0.00 0.00 0.97 170.93 79.18 232.56MAX 2170.35 924.55 1345.50 23.69 0.00 7.61 0.00 0.00 22.25 1749.82 492.17 3965.57MIN 18.21 5.84 23.70 0.00 0.00 0.00 0.00 0.00 0.00 0.00 43.24 42.55
43

Hydrological Data for the Bosque River Watershed
44

APPENDIX B
Average Daily Flow Figures
The figures contained in this appendix depict the flow values for selected sampling sites in the Bosque River watershed for the year of 1998. The flow values are based upon the water level data and velocity measurements collected by TIAER employees. These values in no way should be used as actual flow calculations. Two sites, GB025 and MC055, do not have developed rating curves and therefore are not included in this section.
51

Hydrological Data for the Bosque River Watershed
Figu
re B
–1G
B02
0 A
vera
ge D
aily
Flo
w
0.10
1.00
10.0
0
100.
00
1/1/
98 1/15
/98 1/29
/98 2/12
/98 2/26
/98 3/12
/98 3/26
/984/
9/98 4/
23/98
5/7/
98 5/21
/986/
4/98 6/
18/98
7/2/
98 7/16
/98 7/30
/98 8/13
/98 8/27
/98 9/10
/98 9/24
/98 10/8/
98 10/22
/98 11/5/
98 11/19
/98 12/3/
98 12/17
/98 12/31
/98Average Daily Flow (cfs)
52

Appendix B Average Daily Flow Figures
Figu
re B
–2G
B04
0 A
vera
ge D
aily
Flo
w
0.10
1.00
10.0
0
100.
00
1/1/
98 1/15
/98 1/29
/98 2/12
/98 2/26
/98 3/12
/98 3/26
/984/
9/98 4/
23/98
5/7/
98 5/21
/986/
4/98 6/
18/98
7/2/
98 7/16
/98 7/30
/98 8/13
/98 8/27
/98 9/10
/98 9/24
/98 10/8/
98 10/22
/98 11/5/
98 11/19
/98 12/3/
98 12/17
/98 12/31
/98Average Daily Flow (cfs)
Da
ta m
issin
g
53

Hydrological Data for the Bosque River Watershed
Figu
re B
–3N
F005
Ave
rage
Dai
ly F
low
0.10
1.00
10.0
0
100.
00
1000
.00
1/1/
98 1/15
/98 1/29
/98 2/12
/98 2/26
/98 3/12
/98 3/26
/984/
9/98 4/
23/98
5/7/
98 5/21
/986/
4/98 6/
18/98
7/2/
98 7/16
/98 7/30
/98 8/13
/98 8/27
/98 9/10
/98 9/24
/98 10/8/
98 10/22
/98 11/5/
98 11/19
/98 12/3/
98 12/17
/98 12/31
/98Average Daily Flow (cfs)
54

Appendix B Average Daily Flow Figures
Figu
re B
–4N
F009
Ave
rage
Dai
ly F
low
0.10
1.00
10.0
0
100.
00
1000
.00
1/1/
98 1/15
/98 1/29
/98 2/12
/98 2/26
/98 3/12
/98 3/26
/984/
9/98 4/
23/98
5/7/
98 5/21
/986/
4/98 6/
18/98
7/2/
98 7/16
/98 7/30
/98 8/13
/98 8/27
/98 9/10
/98 9/24
/98 10/8/
98 10/22
/98 11/5/
98 11/19
/98 12/3/
98 12/17
/98 12/31
/98Average Daily Flow (cfs)
Site
tem
pora
rily
dis
cont
inue
d
55

Hydrological Data for the Bosque River Watershed
Figu
re B
–5N
F020
Ave
rage
Dai
ly F
low
0.10
1.00
10.0
0
100.
00
1000
.00
1/1/
98 1/15
/98 1/29
/98 2/12
/98 2/26
/98 3/12
/98 3/26
/984/
9/98 4/
23/98
5/7/
98 5/21
/986/
4/98 6/
18/98
7/2/
98 7/16
/98 7/30
/98 8/13
/98 8/27
/98 9/10
/98 9/24
/98 10/8/
98 10/22
/98 11/5/
98 11/19
/98 12/3/
98 12/17
/98 12/31
/98Average Daily Flow (cfs)
56

Appendix B Average Daily Flow Figures
Figu
re B
–6SF
020
Ave
rage
Dai
ly F
low
0.10
1.00
10.0
0
100.
00
1000
.00
1/1/
98 1/15
/98 1/29
/98 2/12
/98 2/26
/98 3/12
/98 3/26
/984/
9/98 4/
23/98
5/7/
98 5/21
/986/
4/98 6/
18/98
7/2/
98 7/16
/98 7/30
/98 8/13
/98 8/27
/98 9/10
/98 9/24
/98 10/8/
98 10/22
/98 11/5/
98 11/19
/98 12/3/
98 12/17
/98 12/31
/98Average Daily Flow (cfs)
57

Hydrological Data for the Bosque River Watershed
Figu
re B
–7SF
050
Ave
rage
Dai
ly F
low
0.10
1.00
10.0
0
100.
00
1000
.00
1/1/
98 1/15
/98 1/29
/98 2/12
/98 2/26
/98 3/12
/98 3/26
/984/
9/98 4/
23/98
5/7/
98 5/21
/986/
4/98 6/
18/98
7/2/
98 7/16
/98 7/30
/98 8/13
/98 8/27
/98 9/10
/98 9/24
/98 10/8/
98 10/22
/98 11/5/
98 11/19
/98 12/3/
98 12/17
/98 12/31
/98Average Daily Flow (cfs)
58
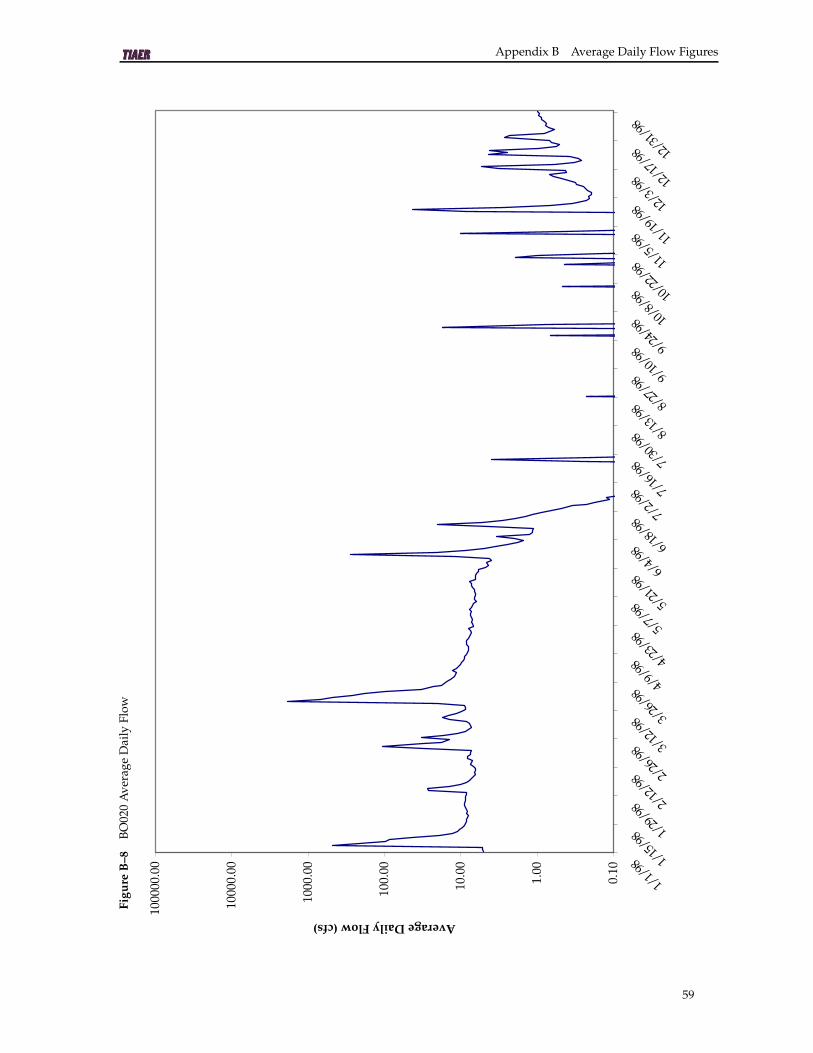
Appendix B Average Daily Flow Figures
Figu
re B
–8B
O02
0 A
vera
ge D
aily
Flo
w
0.10
1.00
10.0
0
100.
00
1000
.00
1000
0.00
1000
00.0
0
1/1/
98 1/15
/98 1/29
/98 2/12
/98 2/26
/98 3/12
/98 3/26
/984/
9/98 4/
23/98
5/7/
98 5/21
/986/
4/98 6/
18/98
7/2/
98 7/16
/98 7/30
/98 8/13
/98 8/27
/98 9/10
/98 9/24
/98 10/8/
98 10/22
/98 11/5/
98 11/19
/98 12/3/
98 12/17
/98 12/31
/98Average Daily Flow (cfs)
59

Hydrological Data for the Bosque River Watershed
Figu
re B
–9M
B040
Ave
rage
Dai
ly F
low
0.10
1.00
10.0
0
100.
00
1000
.00
1/1/
98 1/15
/98 1/29
/98 2/12
/98 2/26
/98 3/12
/98 3/26
/984/
9/98 4/
23/98
5/7/
98 5/21
/986/
4/98 6/
18/98
7/2/
98 7/16
/98 7/30
/98 8/13
/98 8/27
/98 9/10
/98 9/24
/98 10/8/
98 10/22
/98 11/5/
98 11/19
/98 12/3/
98 12/17
/98 12/31
/98Average Daily Flow (cfs)
60

Appendix B Average Daily Flow Figures
Figu
re B
–10
BO
040
Ave
rage
Dai
ly F
low
0.10
1.00
10.0
0
100.
00
1000
.00
1000
0.00
1000
00.0
0
1/1/
98 1/15
/98 1/29
/98 2/12
/98 2/26
/98 3/12
/98 3/26
/984/
9/98 4/
23/98
5/7/
98 5/21
/986/
4/98 6/
18/98
7/2/
98 7/16
/98 7/30
/98 8/13
/98 8/27
/98 9/10
/98 9/24
/98 10/8/
98 10/22
/98 11/5/
98 11/19
/98 12/3/
98 12/17
/98 12/31
/98Average Daily Flow (cfs)
61

Hydrological Data for the Bosque River Watershed
Figu
re B
–11
IC02
0 A
vera
ge D
aily
Flo
w
0.10
1.00
10.0
0
100.
00 1/1/981/15/981/29/982/12/982/26/983/12/983/26/984/9/98
4/23/985/7/98
5/21/986/4/98
6/18/987/2/98
7/16/987/30/988/13/988/27/989/10/989/24/9810/8/98 10/22/9811/5/98 11/19/9812/3/98 12/17/98 12/31/98
Average Daily Flow (cfs)
Site
dis
cont
inu
ed M
arch
30,
199
8
0.10
1.00
10.0
0
100.
00
1000
.00 1/1/98
1/15/981/29/982/12/982/26/983/12/983/26/984/9/98
4/23/985/7/98
5/21/986/4/98
6/18/987/2/98
7/16/987/30/988/13/988/27/989/10/989/24/9810/8/98 10/22/9811/5/98 11/19/9812/3/98 12/17/98 12/31/98
Average Daily Flow (cfs)
Site
dis
cont
inu
ed M
arch
30,
199
8
62

Appendix B Average Daily Flow Figures
Figu
re B
–12
SC02
0 A
vera
ge D
aily
Flo
w
0.10
1.00
10.0
0
100.
00
1000
.00
1/1/
98 1/15
/98 1/29
/98 2/12
/98 2/26
/98 3/12
/98 3/26
/984/
9/98 4/
23/98
5/7/
98 5/21
/986/
4/98 6/
18/98
7/2/
98 7/16
/98 7/30
/98 8/13
/98 8/27
/98 9/10
/98 9/24
/98 10/8/
98 10/22
/98 11/5/
98 11/19
/98 12/3/
98 12/17
/98 12/31
/98Average Daily Values (cfs)
Site
dis
co
ntin
ue
d M
arc
h 3
0,
19
98
63
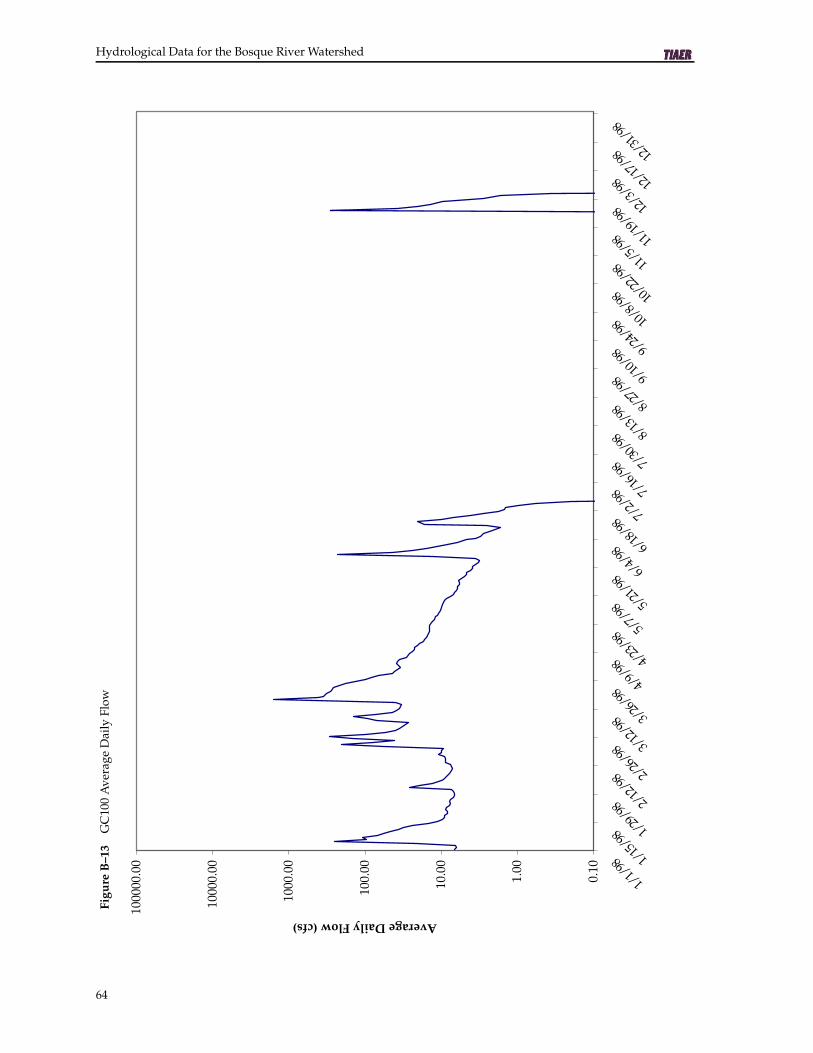
Hydrological Data for the Bosque River Watershed
Figu
re B
–13
GC
100
Ave
rage
Dai
ly F
low
0.10
1.00
10.0
0
100.
00
1000
.00
1000
0.00
1000
00.0
0
1/1/
98 1/15
/98 1/29
/98 2/12
/98 2/26
/98 3/12
/98 3/26
/984/
9/98 4/
23/98
5/7/
98 5/21
/986/
4/98 6/
18/98
7/2/
98 7/16
/98 7/30
/98 8/13
/98 8/27
/98 9/10
/98 9/24
/98 10/8/
98 10/22
/98 11/5/
98 11/19
/98 12/3/
98 12/17
/98 12/31
/98Average Daily Flow (cfs)
64

Appendix B Average Daily Flow Figures
Figu
re B
–14
SP02
0 A
vera
ge D
aily
Flo
w
0.10
1.00
10.0
0
100.
00
1000
.00
1/1/
98 1/15
/98 1/29
/98 2/12
/98 2/26
/98 3/12
/98 3/26
/984/
9/98 4/
23/98
5/7/
98 5/21
/986/
4/98 6/
18/98
7/2/
98 7/16
/98 7/30
/98 8/13
/98 8/27
/98 9/10
/98 9/24
/98 10/8/
98 10/22
/98 11/5/
98 11/19
/98 12/3/
98 12/17
/98 12/31
/98Average Daily Flow (cfs)
Site
dis
cont
inue
d A
ugus
t 31,
199
8
65

Hydrological Data for the Bosque River Watershed
Figu
re B
–15
BO
070
Ave
rage
Dai
ly F
low
0.10
1.00
10.0
0
100.
00
1000
.00
1000
0.00
1000
00.0
0
1/1/
98 1/15
/98 1/29
/98 2/12
/98 2/26
/98 3/12
/98 3/26
/984/
9/98 4/
23/98
5/7/
98 5/21
/986/
4/98 6/
18/98
7/2/
98 7/16
/98 7/30
/98 8/13
/98 8/27
/98 9/10
/98 9/24
/98 10/8/
98 10/22
/98 11/5/
98 11/19
/98 12/3/
98 12/17
/98 12/31
/98Average Daily Flow (cfs)
66

Appendix B Average Daily Flow Figures
Figu
re B
–16
BO
090
Ave
rage
Dai
ly F
low
0.10
1.00
10.0
0
100.
00
1000
.00
1000
0.00
1000
00.0
0
1/1/
98 1/15
/98 1/29
/98 2/12
/98 2/26
/98 3/12
/98 3/26
/984/
9/98 4/
23/98
5/7/
98 5/21
/986/
4/98 6/
18/98
7/2/
98 7/16
/98 7/30
/98 8/13
/98 8/27
/98 9/10
/98 9/24
/98 10/8/
98 10/22
/98 11/5/
98 11/19
/98 12/3/
98 12/17
/98 12/31
/98Average Daily Flow (cfs)
67

Hydrological Data for the Bosque River Watershed
Figu
re B
–17
NC
060
Ave
rage
Dai
ly F
low
0.1110100
1000
1000
0
1000
00
1/1/
98 1/15
/98 1/29
/98 2/12
/98 2/26
/98 3/12
/98 3/26
/984/
9/98 4/
23/98
5/7/
98 5/21
/986/
4/98 6/
18/98
7/2/
98 7/16
/98 7/30
/98 8/13
/98 8/27
/98 9/10
/98 9/24
/98 10/8/
98 10/22
/98 11/5/
98 11/19
/98 12/3/
98 12/17
/98 12/31
/98Average Daily Flow (cfs)
68
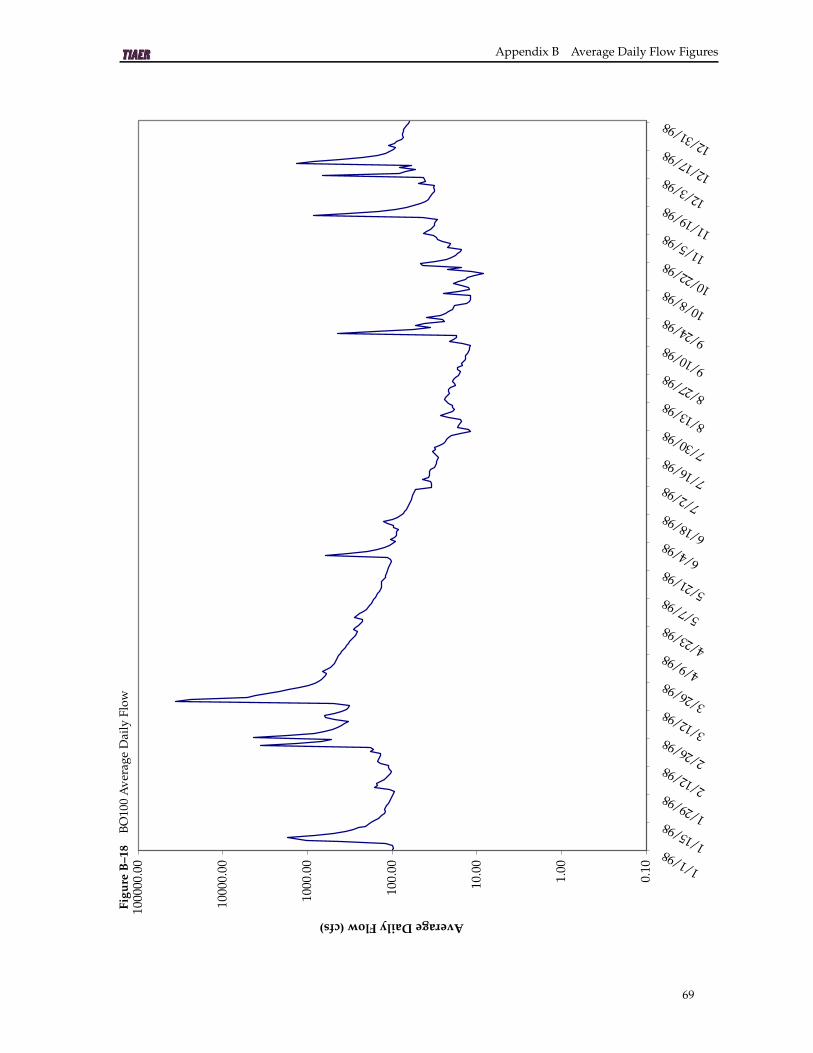
Appendix B Average Daily Flow Figures
Figu
re B
–18
BO
100
Ave
rage
Dai
ly F
low
0.10
1.00
10.0
0
100.
00
1000
.00
1000
0.00 1/1/98
1/15/981/29/982/12/982/26/983/12/983/26/984/9/98
4/23/985/7/98
5/21/986/4/98
6/18/987/2/98
7/16/987/30/988/13/988/27/989/10/989/24/9810/8/98 10/22/9811/5/98 11/19/9812/3/98 12/17/98 12/31/98
Average Daily Flow (cfs)
0.10
1.00
10.0
0
100.
00
1000
.00
1000
0.00
1000
00.0
0 1/1/981/15/981/29/982/12/982/26/983/12/983/26/984/9/98
4/23/985/7/98
5/21/986/4/98
6/18/987/2/98
7/16/987/30/988/13/988/27/989/10/989/24/9810/8/98 10/22/9811/5/98 11/19/9812/3/98 12/17/98 12/31/98
Average Daily Flow (cfs)
0.10
1.00
10.0
0
100.
00
1000
.00
1000
0.00
1000
00.0
0 1/1/981/15/981/29/982/12/982/26/983/12/983/26/984/9/98
4/23/985/7/98
5/21/986/4/98
6/18/987/2/98
7/16/987/30/988/13/988/27/989/10/989/24/9810/8/98 10/22/9811/5/98 11/19/9812/3/98 12/17/98 12/31/98
Average Daily Flow (cfs)
69

Hydrological Data for the Bosque River Watershed
Figu
re B
–19
HC
060
Ave
rage
Dai
ly F
low
0.10
1.00
10.0
0
100.
00
1000
.00
1000
0.00
1000
00.0
0
1/1/
98 1/15
/98 1/29
/98 2/12
/98 2/26
/98 3/12
/98 3/26
/984/
9/98 4/
23/98
5/7/
98 5/21
/986/
4/98 6/
18/98
7/2/
98 7/16
/98 7/30
/98 8/13
/98 8/27
/98 9/10
/98 9/24
/98 10/8/
98 10/22
/98 11/5/
98 11/19
/98 12/3/
98 12/17
/98 12/31
/98Average Daily Flow (cfs)
70

Appendix B Average Daily Flow Figures
Figu
re B
–20
MB
060
Ave
rage
Dai
ly F
low
0.10
1.00
10.0
0
100.
00
1000
.00
1000
0.00 1/1/98
1/15/981/29/982/12/982/26/983/12/983/26/984/9/98
4/23/985/7/98
5/21/986/4/98
6/18/987/2/98
7/16/987/30/988/13/988/27/989/10/989/24/9810/8/98 10/22/9811/5/98 11/19/9812/3/98 12/17/98 12/31/98
Average Daily Flow (cfs)
0.10
1.00
10.0
0
100.
00
1000
.00
1000
0.00
1000
00.0
0 1/1/981/15/981/29/982/12/982/26/983/12/983/26/984/9/98
4/23/985/7/98
5/21/986/4/98
6/18/987/2/98
7/16/987/30/988/13/988/27/989/10/989/24/9810/8/98 10/22/9811/5/98 11/19/9812/3/98 12/17/98 12/31/98
Average Daily Flow (cfs)
71

Hydrological Data for the Bosque River Watershed
Figu
re B
–21
TC
020
Ave
rage
Dai
ly F
low
0.10
1.00
10.0
0
100.
00
1000
.00
1/1/
98 1/15
/98 1/29
/98 2/12
/98 2/26
/98 3/12
/98 3/26
/984/
9/98 4/
23/98
5/7/
98 5/21
/986/
4/98 6/
18/98
7/2/
98 7/16
/98 7/30
/98 8/13
/98 8/27
/98 9/10
/98 9/24
/98 10/8/
98 10/22
/98 11/5/
98 11/19
/98 12/3/
98 12/17
/98 12/31
/98Average Daily Flow (cfs)
72

Appendix B Average Daily Flow Figures
Figu
re B
–22
WC
020
Ave
rage
Dai
ly F
low
0.10
1.00
10.0
0
100.
00
1000
.00
1/1/
98 1/15
/98 1/29
/98 2/12
/98 2/26
/98 3/12
/98 3/26
/984/
9/98 4/
23/98
5/7/
98 5/21
/986/
4/98 6/
18/98
7/2/
98 7/16
/98 7/30
/98 8/13
/98 8/27
/98 9/10
/98 9/24
/98 10/8/
98 10/22
/98 11/5/
98 11/19
/98 12/3/
98 12/17
/98 12/31
/98Average Daily Flow (cfs)
73

Hydrological Data for the Bosque River Watershed
Figu
re B
–23
SB05
0 A
vera
ge D
aily
Flo
w
0.10
1.00
10.0
0
100.
00
1000
.00
1000
0.00
1000
00.0
0
1/1/
98 1/15
/98 1/29
/98 2/12
/98 2/26
/98 3/12
/98 3/26
/984/
9/98 4/
23/98
5/7/
98 5/21
/986/
4/98 6/
18/98
7/2/
98 7/16
/98 7/30
/98 8/13
/98 8/27
/98 9/10
/98 9/24
/98 10/8/
98 10/22
/98 11/5/
98 11/19
/98 12/3/
98 12/17
/98 12/31
/98Average Daily Flow (cfs)
74