hydrology and hydraulics technical report - bi-county parkway
TRANSCRIPT

Tri-County Parkway Location Study
HYDROLOGY AND HYDRAULICS TECHNICAL REPORT
Prepared for:
The Virginia Department of Transportation
Prepared by:
Parsons Brinckerhoff Quade and Douglas, Inc.
26 September 2004

(This page left blank intentionally)

i Hydrology & Hydraulics Technical Report
TABLE OF CONTENTS
S.0 EXECUTIVE SUMMARY ---------------------------------------------------------------------------------------------1 1.0 INTRODUCTION----------------------------------------------------------------------------------------------------- 1-1
1.1 Project Description and History ------------------------------------------------------------------------------- 1-1 1.2 Purpose and Need ----------------------------------------------------------------------------------------------- 1-4
2.0 ALTERNATIVES CONSIDERED-------------------------------------------------------------------------------- 2-1 2.1 Alternatives Eliminated from Detailed Study--------------------------------------------------------------- 2-1 2.2 The No-Build Alternative---------------------------------------------------------------------------------------- 2-1 2.3 Candidate Build Alternatives ---------------------------------------------------------------------------------- 2-1
2.3.1 The Comprehensive Plan CBA---------------------------------------------------------------------------- 2-2 2.3.2 The West Two CBA ------------------------------------------------------------------------------------------ 2-3 2.3.3 The West Four CBA------------------------------------------------------------------------------------------ 2-3
3.0 HYDROLOGIC & HYDRAULIC ANALYSIS ------------------------------------------------------------------ 3-1 3.1 Overview ----------------------------------------------------------------------------------------------------------- 3-1 3.2 Stream Crossing and Roadway Drainage------------------------------------------------------------------ 3-1 3.3 Stream Crossings ------------------------------------------------------------------------------------------------ 3-1 3.4 Roadway Drainage ---------------------------------------------------------------------------------------------- 3-5 3.5 Available Data----------------------------------------------------------------------------------------------------- 3-5 3.6 Criteria -------------------------------------------------------------------------------------------------------------- 3-5 3.7 Topographic Data ------------------------------------------------------------------------------------------------ 3-5 3.8 Cross Section Data ---------------------------------------------------------------------------------------------- 3-5 3.9 Starting Elevation ------------------------------------------------------------------------------------------------ 3-6 3.10 Discharge Data --------------------------------------------------------------------------------------------------- 3-6 3.11 Minimum Structures Requirement --------------------------------------------------------------------------- 3-6 3.12 Approach and Limits to the Analysis ------------------------------------------------------------------------ 3-6 3.13 Hydrologic Method ----------------------------------------------------------------------------------------------- 3-6 3.14 Hydraulic Methods ----------------------------------------------------------------------------------------------- 3-7
3.14.1 Backwater/Increases Over Existing Conditions ---------------------------------------------------- 3-8 3.14.2 Clearance---------------------------------------------------------------------------------------------------- 3-8 3.14.3 Flow Distribution ------------------------------------------------------------------------------------------- 3-8
3.15 Preliminary Determinations ------------------------------------------------------------------------------------ 3-8 3.16 Stormwater Management ------------------------------------------------------------------------------------ 3-11
4.0 REFERENCES ------------------------------------------------------------------------------------------------------- 4-1
ii Hydrology & Hydraulics Technical Report
LIST OF TABLES
TABLE 3.2-1 IDENTIFIED DRAINAGE FACILITIES------------------------------------------------------------------ 3-2 TABLE 3.3-1 MAJOR DRAINAGE FACILITES IN FLOODPLAINS -
FLOODPLAIN AND BRIDGE DATA -------------------------------------------------------------------- 3-3 TABLE 3.4-1 MAJOR DRAINAGE FACILITIES NOT IN THE FLOODPLAIN----------------------------------- 3-5 TABLE 3.13-1 MAJOR DRAINAGE FACILITIES IN FLOODPLAINS - 100-YEAR DISCHARGE---------- 3-7 TABLE 3.15-1 BRIDGE AFFECT UPON WATER SURFACE AND VELOCITY ------------------------------- 3-9 TABLE 3.16-1 STORMWATER QUALITY VOLUME REQUIREMENTS--------------------------------------- 3-12
LIST OF FIGURES
FIGURE 1.1-1 REGIONAL LOCATION MAP---------------------------------------------------------------------------- 1-2 FIGURE 1.1-2 STUDY AREA ----------------------------------------------------------------------------------------------- 1-3 FIGURE 2.4-1 GENERAL DESIGN SEGMENTS TYPICAL SECTIONS ----------------------------------------- 2-4 FIGURE 2.4-2 CANDIDATE BUILD ALTERNATIVES ---------------------------------------------------------------- 2-5
LIST OF APPENDICES
APPENDIX 1: BRIDGE STUDY MAP
APPENDIX 2: BRIDGE CROSSING ANALYSIS

S-1 Hydrology & Hydraulics Technical Report
S.0 EXECUTIVE SUMMARY
Project History and Overview
The Tri-County Parkway Location Study evaluates a new north/south transportation link in northern Virginia that will connect the City of Manassas with Interstate 66 (I-66) and the Dulles corridor. The corridor begins in the north at the intersection of US 50 and Route 606 (Old Ox Road) and extends to the south at the interchange of VA 28/VA 234 Bypass. It is approximately 15 miles long and traverses portions of the counties of Prince William, Fairfax, and Loudoun along with the cities of Manassas and Manassas Park. The three counties that the Tri-County Parkway will traverse are among the top ten fastest growing counties in the Commonwealth of Virginia. The City of Manassas and the City of Manassas Park have also experienced substantial population growth over the last ten years. Much of the growth in Northern Virginia can be attributed to the emergence of high-tech industries near the Washington Dulles International Airport. A second rapid growth corridor within the region is the I-66 corridor. The primary problem the Tri-County Parkway is intended to address is the lack of adequate north-south transportation facilities linking the I-66 corridor with the Dulles area and VA 267. East of US 15 and west of the I-495 (Capital Beltway), only three principal urban arterials link the spokes together - VA 28 (Sully Road), Route 7100 (Fairfax County Parkway), and VA 123. These north-south facilities are heavily congested and will deteriorate further by the year 2025.
Purpose and Need
The study area presently lacks adequate north-south transportation facilities linking the I-66 corridor with the Dulles area and VA 267. The purpose and need for the Tri-County Parkway is comprised of four key elements, namely:
1. Improve transportation mobility and capacity and, by doing so, improve access and reduce congestion.
2. Enhance the linkage of communities and the transportation system that serves those communities. 3. Accommodate social demands, environmental goals, and economic development needs. 4. Improve safety and, by doing so, reduce the average crash, injury, and accident rates on the
roadway network.
Each of the elements has equal value and importance in the overall transportation, environmental, economic, and quality of life objectives for the communities being served under the proposed action.
Alternatives
In accordance with NEPA requirements, alternatives initially considered for the Tri-County Location Study included the No-Build, Mass Transit, Transportation System Management (TSM), and Candidate Build Alternatives (CBAs). Each alternative was evaluated with respect to its potential impacts and its ability to address the project’s purpose and need.
Alternatives Eliminated from Detailed Study
Assessments conducted as part of the Tri-County Parkway Location Study determined that the nature of the study area makes the identification of a mass transit alternative that can address the corridor’s purpose and need problematic. No transit authority exists whose service area covers or would cover the entire study area, nor are there plans to establish such an authority. In addition, the development patterns and traffic patterns and volumes within the study corridor do not favor north-south through movement along the corridor. The majority of trips and greatest volumes are to points outside the study area or along only a portion of the corridor (i.e., from the Manassas and Centerville areas to I-66 and points east, from the South Riding area to the Dulles corridor). The through volumes are by far the weakest in the study area and would not attract sufficient transit riders to make such service viable; therefore, the mass transit alternative was eliminated from further consideration.
There are no practicable Transportation System Management (TSM) measures beyond those already proposed in the CLRP and VDOT Six Year Plan which could reasonably be implemented to satisfy the
S-2 Hydrology & Hydraulics Technical Report
purpose and need for the Tri-County Parkway. TSM-type improvements programmed into the aforementioned plans do not satisfy the project’s purpose and need when considered as a stand-alone alternative; therefore, the TSM Alternative was eliminated from further consideration.
The No-Build Alternative
The No-Build Alternative includes currently programmed committed and funded roadway and transit projects in the Virginia Department of Transportation (VDOT) Six Year Plan and the CLRP developed by the MWCOG. The No-Build Alternative, while having no direct construction costs, would result in other economic, environmental, and quality of life impacts that can be expected from the continuation of roadway system deficiencies. While the No-Build alternative does not meet the project needs for traffic, safety, and roadway infrastructure improvements, it provides a baseline condition with which to compare the improvements and consequences associated with the Candidate Build Alternatives.
Candidate Build Alternatives (CBAs)
Three Candidate Build Alternatives (CBAs) have been identified for further evaluation in a Draft Environmental Impact Statement (EIS). These CBAs are referred to hereinafter as: (1) the “Comprehensive Plan” CBA, (2) the “West Two” CBA, and (3) the “West Four” CBA. Each of the CBAs is expected to be comprised of two or more facility types according to localized needs and goals. To assess environmental effects associated with a particular facility type along each CBA, three general design segments were developed. These general design segments and their relationship to each alternative assessed are described in the body of this Technical Report.
The Comprehensive Plan CBA
The Comprehensive Plan CBA would be located east of the Manassas National Battlefield. The Comprehensive Plan CBA would provide a new urban principal arterial roadway from the northern terminus at the intersection of US 50 and Route 606 (Old Ox Road) and the southern terminus at the Route 28 and Route 234 Bypass Interchange, and would consist of Segments F’, F, and E. Segment F’ between Route 50 and Route 620 would be comprised of improvements along an existing four-lane divided facility within an existing right-of-way on an existing alignment. Segment F’ south of Route 620 would be a new four-lane divided facility within a new right-of-way on a new alignment. Three separate sections characterize segment E. The portion of Segment E between I-66 and the Fairfax/Prince William county line would be a new six-lane divided facility within a new right-of-way on a new alignment. The portion of segment E from the Fairfax/Prince William county line south to VA 234 would be a new six-lane divided facility within an existing right-of-way on an existing alignment. The portion of Segment E from VA 234 to the VA 234 Bypass would be comprised of improvements along an existing four-lane divided facility called Godwin Drive and would be widened to a six-lane divided facility within the existing right-of-way and on an existing alignment.
The West Two CBA
The West Two CBA is located west of the Manassas National Battlefield. The West Two CBA would provide a new urban principal arterial roadway from the northern terminus near the intersection of US 50 and Route 877 (Racefield Lane) and the southern terminus at the I-66 and Route 234 Interchange. The West Two CBA would be a new four-lane divided facility within a new right-of-way and on a new alignment, and would consist of Segments D and C.
The West Four CBA
The West Four CBA is also located west of the Manassas National Battlefield. The West Four CBA would provide a new urban principal arterial roadway from the northern terminus at the intersection of US 50 and Route 606 (Old Ox Road) and the southern terminus at the I-66 and Route 234 Interchange. The West Four CBA would consist of Segments F’, G, and C. Segment F’ between Route 50 and Route 620 (Braddock Road) would be comprised of improvements along an existing four-lane divided facility within an existing right-of-way on an existing alignment. Segment F’ south of Route 620 would be comprised of a new four-lane divided facility within a new right-of-way on a new alignment.
S-3 Hydrology & Hydraulics Technical Report
Affected Environment
The Candidate Build Alternatives (CBAs) – The Comprehensive Plan CBA, The West Two CBA, and the West Four CBA - generally run in a north-south orientation, crossing the Bull Run watershed and three of its major tributaries Catharpin Run, Flat Branch, and Cub Run. The CBAs cross these streams, as well as several smaller tributaries and, in some cases, run parallel to the stream along the edge of the floodplain. Required stormwater facilities that have been defined as “Major Structures not in a floodplain” tend to be within smaller watersheds with flows above 500 cfs for the 100 year storm. Typically, these facility needs can be resolved by using a culvert or series of culverts. As far as possible, with existing data and topography, any area or location needing a roadway culvert for roadway or small watershed drainage was preliminarily assessed to determine if it will fit into the Minor Drainage or Major Drainage Facility. The Major Drainage Facilities were further separated by the floodplain criteria to identify the culvert or bridge structures type.
Environmental Consequences
Facilities are required to provide roadway drainage and to allow conveyance under the roadway of storm water runoff from smaller watershed to an adequate receiving water or channel. These facilities are most likely to be culverts. Stream crossings are generally major bridge structures crossing both the floodway and floodplain overbanks. The design must be sensitive to the impact of upstream water surface elevations. The installation of piers and approaches to the bridge can increase the upstream water surface elevations (causing increased flooding) and can increase velocities through the bridge opening (causing potential for damaging scour). The preliminary determination shows no significant impact on the water surface profiles due to the preliminary bridge cross-sections. Stormwater management can ultimately be achieved by a combination of best management practices (BMP) during future design phases and when a preferred alternative is selected. Candidate BMPs include, but are not limited to: grassed swales, vegetated buffers and filter strips, check dams, extended detention basins, water quality structures, retention basins, enhanced basins, forebays, bioretention facilities, and regional facilities. Impervious areas, water quality volumes, and estimated basin excavation volumes for all watersheds are identified.
(This area left blank intentionally)

(This page left blank intentionally)

1-1 Hydrology & Hydraulics Technical Report
1.0 INTRODUCTION
1.1 PROJECT DESCRIPTION AND HISTORY
The Tri-County Parkway Location Study evaluates a new north/south transportation link in northern Virginia that will connect the City of Manassas with Interstate 66 (I-66) and the Dulles corridor. The corridor begins in the north at the intersection of US 50 and Route 606 (Old Ox Road) and extends to the south at the interchange of VA 28/VA 234 Bypass. It is approximately 15 miles long and traverses portions of the counties of Prince William, Fairfax, and Loudoun along with the cities of Manassas and Manassas Park.
The Tri-County Parkway was first identified during the development of the transportation element of the comprehensive plans for Prince William, Fairfax, and Loudoun counties. The Tri-County Parkway has been the subject of many local studies and plans and has been known by many names throughout the years. In Prince William County, it has been referred to as the “Route 28 Bypass” and, in Loudoun County, the Tri-County Parkway has been known as the “Loudoun County Parkway”. Several conceptual alignments were considered through Fairfax County even before it was first proposed in their comprehensive plan. The Tri-County Parkway has been incorporated in the three counties’ comprehensive plans for over ten years. The Tri-County Parkway was adopted by the Metropolitan Washington Council of Governments (MWCOG) and included in their Constrained Long-Range Plan (CLRP) and Transportation Improvement Program (TIP) in the early to mid 1990s. Figure 1.1-1 illustrates the Tri-County Parkway project from a regional perspective, while Figure 1.1-2 depicts the study area within which Tri-County Parkway alternatives will be evaluated.
The three counties that the Tri-County Parkway will traverse are among the top ten fastest growing counties in the Commonwealth of Virginia. According to the 2000 Census, Loudoun County’s population grew by 97 percent from 1990 to 2000. Prince William County’s and Fairfax County’s population grew by 30 percent and 19 percent, respectively, during those same years. The City of Manassas and the City of Manassas Park are also located within the Tri-County Parkway study area. Both of these cities have experienced substantial population growth over the last ten years. The City of Manassas had a population growth of 26 percent and the City of Manassas Park grew by 53 percent.
Much of the growth in Northern Virginia can be attributed to the emergence of high-tech industries near the Washington Dulles International Airport. By the year 2025, employment in the Dulles/Tysons corridor is expected to reach 280,000 jobs - 71 percent more than current conditions. The Dulles/Tysons corridor will become the second largest employer in the Washington Metropolitan region, second only to downtown Washington D.C. Prince William County and the City of Manassas have also experienced significant high-tech industry growth. The Dulles area consists of the Dulles Greenway, VA 7, VA 28, and US Route 50.
A second rapid growth corridor within the region is the I-66 corridor. Transportation improvements for the I-66 corridor from Interstate 495 (I-495) to the Gainesville area were evaluated in January 1999 as part of a comprehensive study entitled “The I-66 Corridor Major Investment Study (I-66 MIS).” Information from that study revealed that population in the I-66 corridor located within Fairfax, Prince William, and Loudoun counties is projected to increase from 269,000 persons in 1999 to 466,000 persons in 2020. This represents a 73 percent increase in population over the 22-year time frame. Employment is estimated to increase 83 percent in this same time period (from 162,000 jobs in 1999 to 296,000 jobs in 2020).
The primary problem the Tri-County Parkway is intended to address is the lack of adequate north-south transportation facilities linking the I-66 corridor with the Dulles area and VA 267. East of US 15 and west of the I-495 (Capital Beltway), only three principal urban arterials link the spokes together - VA 28 (Sully Road), Route 7100 (Fairfax County Parkway), and VA 123. These north-south facilities are heavily congested and will deteriorate further by the year 2025.
Level of service on VA 28 is currently deficient in the a.m. and p.m. peak periods. By 2025, most segments of VA Route 28 northbound in the a.m. and southbound in the p.m. are expected to operate at LOS F or G (a severely congested state). Traveling south in the p.m. between the Fairfax County line

1-2 Hydrology & Hydraulics Technical Report
Figure 1.1-1 REGIONAL LOCATION MAP

1-3 Hydrology & Hydraulics Technical Report
Figure 1.1-2 STUDY AREA

1-4 Hydrology & Hydraulics Technical Report
and I-66, speeds are estimated to drop along VA 28 from an already slow 18 miles per hour (mph) to 13 mph between 2000 and 2025. The posted speed limit in this area is 45 mph. By 2025 the peak periods for a.m. and p.m. traffic on VA 28 could extend for over three hours each; however, improvements to VA 28 have been proposed under the Virginia Public-Private Transportation Act (VPPTA) of 1995 to convert the 14-mile stretch of VA 28 between I-66 and Route 7 to a limited access freeway. That project would involve widening VA 28 to an eight-lane section, as well as replacing up to ten signalized intersections with grade-separated interchanges. If the VA 28 improvements project is completed as planned, the added capacity should increase speeds and reduce congestion along VA 28 - in effect improving operating speeds in the a.m. and p.m. peak periods.
1.2 PURPOSE AND NEED
The study area presently lacks adequate north-south transportation facilities linking the I-66 corridor with the Dulles area and VA 267. The purpose and need for the Tri-County Parkway is comprised of four key elements. Each of the elements is a critical and salient factor to be addressed by the transportation alternatives. There is no attempt to weight one element over the others. Each of the elements has equal value and importance in the overall transportation, environmental, economic, and quality of life objectives for the communities being served under the proposed action. The four elements are listed below and are further elaborated in Sections 1.3 through 1.7 of the associated document titled Purpose and Need Statement (VDOT, 2003):
1. Improve transportation mobility and capacity and, by doing so, improve access and reduce congestion.
2. Enhance the linkage of communities and the transportation system that serves those communities.
3. Accommodate social demands, environmental goals, and economic development needs.
4. Improve safety and, by doing so, reduce the average crash, injury, and accident rates on the roadway network.
(This area left blank intentionally)

2-1 Hydrology & Hydraulics Technical Report
2.0 ALTERNATIVES CONSIDERED
2.1 INTRODUCTION
In accordance with NEPA requirements, alternatives initially considered for the Tri-County Location Study included the No-Build, Mass Transit, Transportation System Management (TSM), and Candidate Build Alternatives (CBAs). Each alternative was evaluated with respect to its potential impacts and its ability to address the project’s purpose and need.
2.2 ALTERNATIVES ELIMINATED FROM DETAILED STUDY
Assessments conducted as part of the Tri-County Parkway Location Study determined that the nature of the study area makes the identification of a mass transit alternative that can address the corridor’s purpose and need problematic. No transit authority exists whose service area covers or would cover the entire study area, nor are there plans to establish such an authority. In addition, the development patterns and traffic patterns and volumes within the study corridor do not favor north-south through movement along the corridor. The majority of trips and greatest volumes are to points outside the study area or along only a portion of the corridor (i.e., from the Manassas and Centerville areas to I-66 and points east, from the South Riding area to the Dulles corridor). The through volumes are by far the weakest in the study area and would not attract sufficient transit riders to make such service viable; therefore, the mass transit alternative was eliminated from further consideration.
There are no practicable Transportation System Management (TSM) measures beyond those already proposed in the CLRP and VDOT Six Year Plan which could reasonably be implemented to satisfy the purpose and need for the Tri-County Parkway. TSM-type improvements programmed into the aforementioned plans do not satisfy the project’s purpose and need when considered as a stand-alone alternative; therefore, the TSM Alternative was eliminated from further consideration.
2.3 THE NO-BUILD ALTERNATIVE
Consistent with the requirements of the NEPA and related FHWA guidelines, full consideration is given to the environmental consequences of taking no action to meet future travel demand (hereinafter referred to as the “No-Build Alternative”). The No-Build Alternative includes currently programmed committed and funded roadway and transit projects in the Virginia Department of Transportation (VDOT) Six Year Plan and the CLRP developed by the MWCOG. The No-Build Alternative, while having no direct construction costs, would result in other economic, environmental, and quality of life impacts that can be expected from the continuation of roadway system deficiencies. While the No-Build alternative does not meet the project needs for traffic, safety, and roadway infrastructure improvements, it provides a baseline condition with which to compare the improvements and consequences associated with the Candidate Build Alternatives. The following is a list of major projects identified in the CLRP which influence the Tri-County Parkway study area:
● Dulles/VA 7 Corridor ● VA 28 Corridor ● Prince William Parkway (VA 3000) Corridor ● Fairfax County Parkway (VA 7100) Corridor ● I-66/US 29/US 50 Corridor ● I-495 (Beltway) Corridor ● Manassas National Battlefield Park Bypass ● Western Transportation Corridor
2.4 CANDIDATE BUILD ALTERNATIVES
Three Candidate Build Alternatives (CBAs) have been identified for further evaluation in a Draft Environmental Impact Statement (EIS). These CBAs are referred to hereinafter as: (1) the

2-2 Hydrology & Hydraulics Technical Report
“Comprehensive Plan” CBA, (2) the “West Two” CBA, and (3) the “West Four” CBA. The process leading to the identification of these three CBAs is discussed in greater detail in the associated document tilted Alternatives Identification, Development, and Screening Technical Report (VDOT, 2004). The northern and southern termini for these CBAs have been selected in accordance with FHWA Technical Guidelines for termini development and are discussed in greater detail in the associated document titled Logical Termini Technical Memorandum (VDOT, 2003).
Each of the CBAs is expected to be comprised of two or more facility types according to localized needs and goals. To assess environmental effects associated with a particular facility type along each CBA, three general design concepts have been developed:
• General Design Segment 1 (hereinafter referred to as “Segment 1”). • General Design Segment 2 (hereinafter referred to as “Segment 2”). • General Design Segment 3 (hereinafter referred to as “Segment 3”).
The process leading to the development of these general design segments is presented in the associated document tilted Study Location Report (VDOT, 2004). The three general design segments developed for purposes of this assessment are depicted in Figure 2.4-1 and are described as follows:
• Segment 1. Segment 1 will provide a controlled access facility with four 12-foot lanes divided with a 42-foot graded grass median and 10-foot multi-use trail. The 42-foot wide median will allow for expanding to six lanes in the future. Segment 1 could either include (1) paved shoulders in areas where right-of-way is needed or (2) curb and gutter in areas where portions of the facility have been partially constructed and right-of-way exists. These design options are represented as Option 1 and Option 2, respectively. The median width will be transitioned to include additional width at all intersection approaches to allow for construction of dual left turn lanes, as necessary.
• Segment 2. Segment 2 will provide a limited access facility with four 12-foot lanes divided with a 42-foot graded grass median, paved shoulders, and 10-foot multi-use trail. The median width will be transitioned to include additional width at all intersection approaches to allow for construction of dual left turn lanes, as necessary.
• Segment 3. Segment 3 will provide a limited access facility with six lanes (four 12-foot outside lanes and two 13-foot inside lanes) divided with a 42-foot graded median, paved shoulders, and a 10-foot multi-use trail. The 13-foot inside lanes are adjacent to curbed median only.
2.4.1 The Comprehensive Plan CBA
The Comprehensive Plan CBA is so named because it incorporates certain alignments recognized in local Comprehensive Plans. The Comprehensive Plan CBA would be located east of the Manassas National Battlefield. The Comprehensive Plan CBA would provide a new urban principal arterial roadway from the northern terminus at the intersection of US 50 and Route 606 (Old Ox Road) and the southern terminus at the Route 28 and Route 234 Bypass Interchange, and would consist of Segments F’, F, and E (see Figure 2.4-2). Segment F’ between Route 50 and Route 620 would be comprised of improvements along an existing four-lane divided facility within an existing right-of-way on an existing alignment. Segment F’ south of Route 620 would be a new four-lane divided facility within a new right-of-way on a new alignment. Three separate sections characterize segment E. The portion of Segment E between I-66 and the Fairfax/Prince William county line would be a new six-lane divided facility within a new right-of-way on a new alignment. The portion of segment E from the Fairfax/Prince William county line south to VA 234 would be a new six-lane divided facility within an existing right-of-way on an existing alignment. The portion of Segment E from VA 234 to the VA 234 Bypass would be comprised of improvements along an existing four-lane divided facility called Godwin Drive and would be widened to a six-lane divided facility within the existing right-of-way and on an existing alignment. The Comprehensive Plan CBA would consist of three of the aforementioned general design segments in the following areas:
• Segment 1 (Options 1 and 2) will extend from the intersection of US 50 and Route 606 (Old Ox Road) in Loudoun County to the Fairfax County Line.
2-3 Hydrology & Hydraulics Technical Report
• Segment 2 will extend from the Fairfax County Line to I-66 (east of the Manassas National Battlefield).
• Segment 3 will extend from I-66 in Fairfax County to Route 234 in Prince William County.
2.4.2 The West Two CBA
The West Two CBA is located west of the Manassas National Battlefield. The West Two CBA would provide a new urban principal arterial roadway from the northern terminus near the intersection of US 50 and Route 877 (Racefield Lane) and the southern terminus at the I-66 and Route 234 Interchange. The West Two CBA would be a new four-lane divided facility within a new right-of-way and on a new alignment, and would consist of Segments D and C (see Figure 2.4-2). The West Two CBA would consist of two of the aforementioned general design segments in the following areas:
• Segment 1 (Option 1) will extend from the intersection of US 50 and 877(Racefield Road) in Loudoun County to the Prince William County Line.
• Segment 2 will extend from the Prince William County Line to the interchange of I-66 and Route 234 (west of the Manassas National Battlefield).
2.4.3 The West Four CBA
The West Four CBA is also located west of the Manassas National Battlefield. The West Four CBA would provide a new urban principal arterial roadway from the northern terminus at the intersection of US 50 and Route 606 (Old Ox Road) and the southern terminus at the I-66 and Route 234 Interchange. The West Four CBA would consist of Segments F’, G, and C (Figure 2.4-2). Segment F’ between Route 50 and Route 620 (Braddock Road) would be comprised of improvements along an existing four-lane divided facility within an existing right-of-way on an existing alignment. Segment F’ south of Route 620 would be comprised of a new four-lane divided facility within a new right-of-way on a new alignment. The West Four CBA would consist of two of the aforementioned general design segments in the following areas:
• Segment 1 (Option 1) will extend from the intersection of US 50 and Route 606 (Old Ox Road) in Loudoun County to the Prince William County Line.
• Segment 2 will extend from the Prince William County Line to the interchange of I-66 and Route 234 (west of the Manassas National Battlefield).
(This area left blank intentionally)

2-4 Hydrology & Hydraulics Technical Report
Figure 2.4-1 GENERAL DESIGN SEGMENTS TYPICAL SECTIONS

2-5 Hydrology & Hydraulics Technical Report
Figure 2.4-2 CANDIDATE BUILD ALTERNATIVES

3-1 Hydrology & Hydraulics Technical Report
3.0 HYDROLOGIC & HYDRAULIC ANALYSIS
3.1 OVERVIEW
The Candidate Build Alternatives (CBAs) – The Comprehensive Plan CBA, The West Two CBA, and the West Four CBA - generally run in a north-south orientation, crossing the Bull Run watershed and three of its major tributaries Catharpin Run, Flat Branch, and Cub Run. The CBAs cross these streams, as well as several smaller tributaries and, in some cases, run parallel to the stream along the edge of the floodplain. The effects of these crossings and floodplain encroachments have been evaluated at a planning level.
Results of the hydrology and hydraulics analyses presented in this Technical Report provide data for comparison of alternatives and establish a preliminary structures requirement. The analyses are based on available data from USGS and county mapping, FEMA Flood Insurance Rate maps, and preliminary alignments set forth in the Location Study Report (VDOT, 2004). As the design process progresses, more accurate data will allow the design refinements necessary to produce preliminary and final design. Appendix 1 shows the study area, corridors for various alternatives, identified major bridges, and culvert crossings.
3.2 STREAM CROSSING AND ROADWAY DRAINAGE
The preliminary alternative alignments were located on USGS mapping and other available mapping. The stream crossings and drainage crossings necessary to convey water under the roads were identified on the maps, and the drainage areas were delineated for the three alternatives. These are listed in Table 3.3-1. The limited data and planning level nature of the analysis made it necessary to categorize the drainage facilities for the proposed crossings into these sets of facilities:
1. Minor Drainage Facilities – Generally a drainage area of less than 225 acres or less than 500 cubic feet per second (cfs) for the 100 year (1 percent clearance of occurrence) storm peak discharge from the watershed. These facilities would be designed in detail after additional data is obtained. The probable costs of construction for these facilities is considered incidental at the planning level and is included in the per linear foot of roadway cost.
2. Major Drainage Facilities but not in the floodplain – Generally a drainage area greater than 225 acres or more than 500 cfs up for the 100 year (one percent clearance of occurrence) storm peak discharge from the watershed. These facilities would be further refined as the design process moves toward preliminary and final design.
3. Major Drainage Facilities in flood plain areas. These are generally significant streams that have a definable floodplain. They would have a drainage area greater than 225 acres to over 20 square miles and have a peak discharge greater than 500 cfs up for the 100 year (one percent clearance of occurrence) storm peak discharge.
In some cases, these facilities are located parallel to the streams in the floodplain, and the bridge is provided to limit encroachment or to provide protection or mitigation of wetlands or other environmentally sensitive areas. The probable costs of construction for these is based on the required culvert or bridge developed by the planning level analysis and is included in the Major Drainage facilities line item.
3.3 STREAM CROSSINGS
Stream crossings are generally major bridge structures crossing both the floodway and floodplain overbanks. The design must be sensitive to the impact of upstream water surface elevations. The installation of piers and approaches to the bridge can increase the upstream water surface elevations (causing increased flooding) and can increase velocities through the bridge opening (causing potential for damaging scour). Table 3.3-2 lists the bridges or facilities that have been preliminarily determined to be necessary for each alternative.

3-2 Hydrology & Hydraulics Technical Report
Table 3.3-1 IDENTIFIED DRAINAGE FACILITIES
Number Crossing Alphanumeric Code Major w/Floodplain Major Minor < 500cfs
1 D-5 X 2 D-3 X 3 D-2 X D-2-A X
4 D-1 X 5 C-6 X 6 C-5 X 7 C-5A X 8 C-4 X 9 C-3 X 10 C-2 X 11 C-1 X 12 G-1 X 13 G-2 X 14 G-6 X 15 G-9 X 16 F-20 X (existing structure) 17 F-19 X (existing structure) 18 F-18 X 19 F-17 Pond/quarry 20 F-16 X 21 F-15 X 22 F-14 X 23 F-13 X 24 F-12 X 25 F-10A X 26 F-10B X 27 F-9 X 28 F-8 X 29 F-7 X 30 F-6 X 31 F-5 X 32 F-4 X 33 F-4A X 34 F-3 X 35 F-2 X 36 F-1A X 37 F-1B X 38 F-1C X 39 E-10A X 40 E-10B X 41 E-6A X 42 E-6B1 X 43 E-6B2 X 44 E-6B3 X 45 E-2 X (existing structure)

3-3 Hydrology & Hydraulics Technical Report
Table 3.3-2 MAJOR DRAINAGE FACILITES IN FLOODPLAINS
FLOODPLAIN AND BRIDGE DATA
Drainage Area ID Stream/Flood Plain
100-Year Floodplain
Width 100-Year
FEMA Elev. Main Channel Span Length
(ft) Begin
Station End
Station Total
Length (ft)
Spans Avg
Span Length
(ft) C2 Little Bull Run/Catharpin Run 360 243 80 599+45 604+48 503 4 126 C5 Lick Branch (to Catharpin Run) 440 253 45 670+22 674+43 421 3 140
C6 Catamount Branch 300 Not
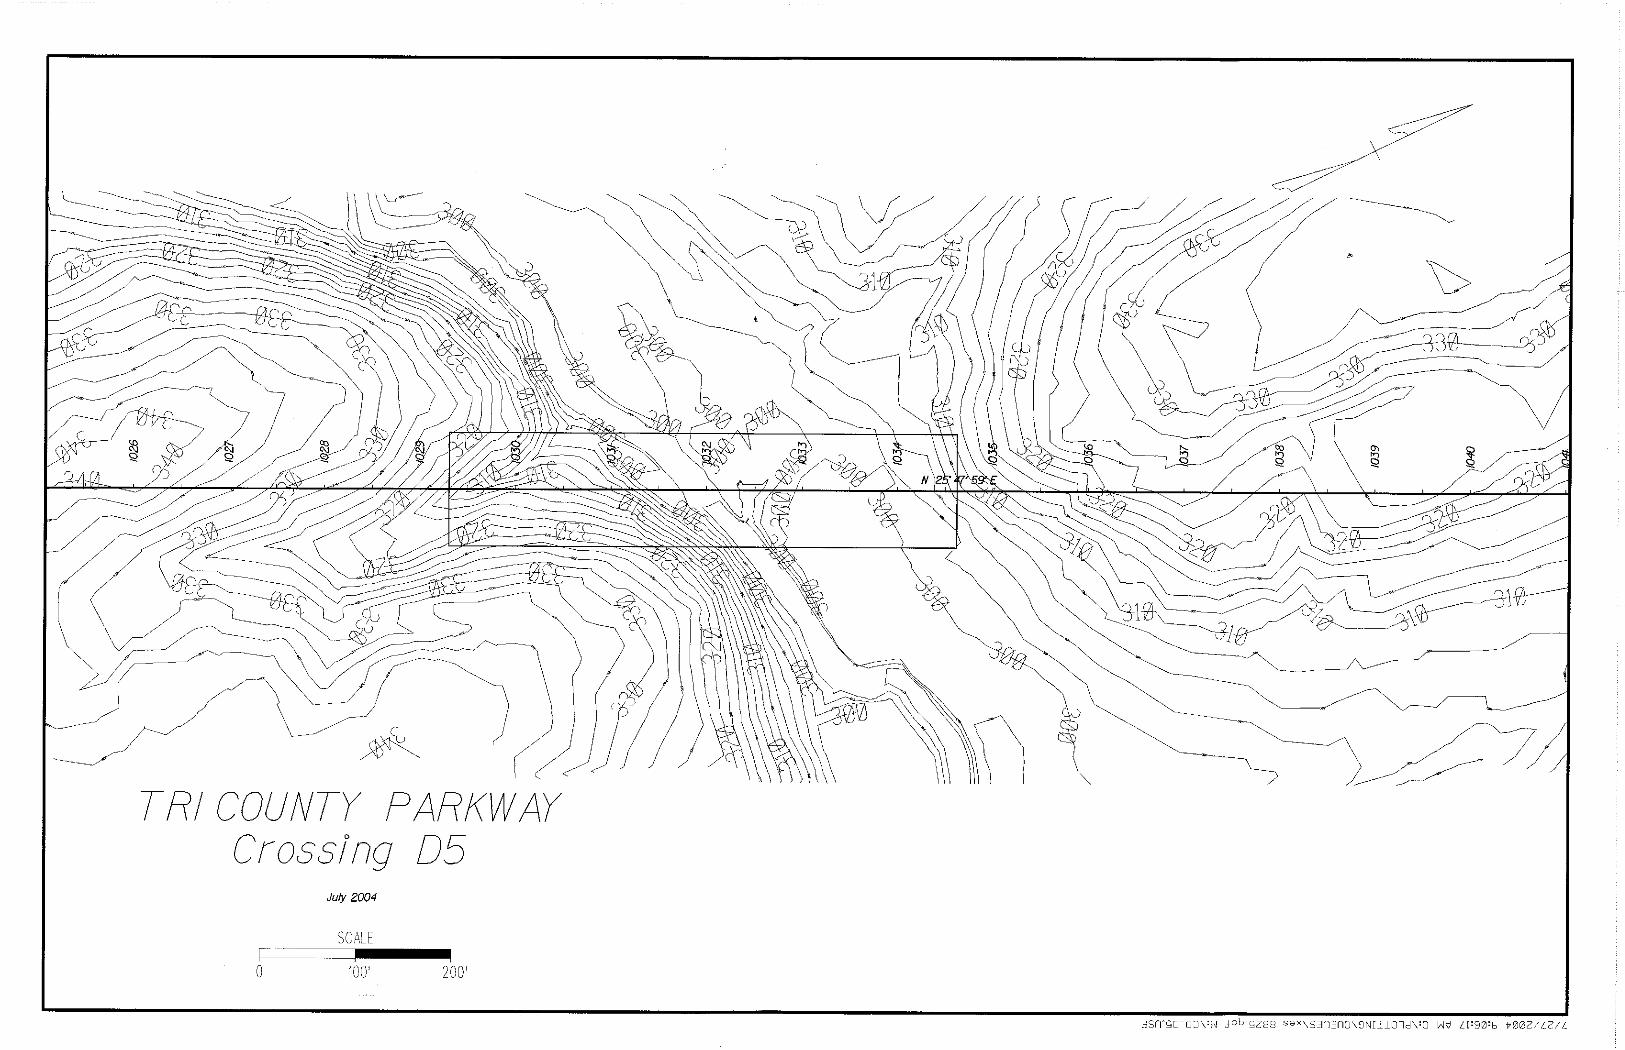
Determined 50 738+42 741+06 264 2 132 D2 Bull Run 560 254 70 840+79 850+50 971 8 121 D5 South Fork (trib to Broad Run) 380 310 95 1029+31 1034+63 532 4 133 E2 Cannon Branch 200 195 EXISTING - - - - -
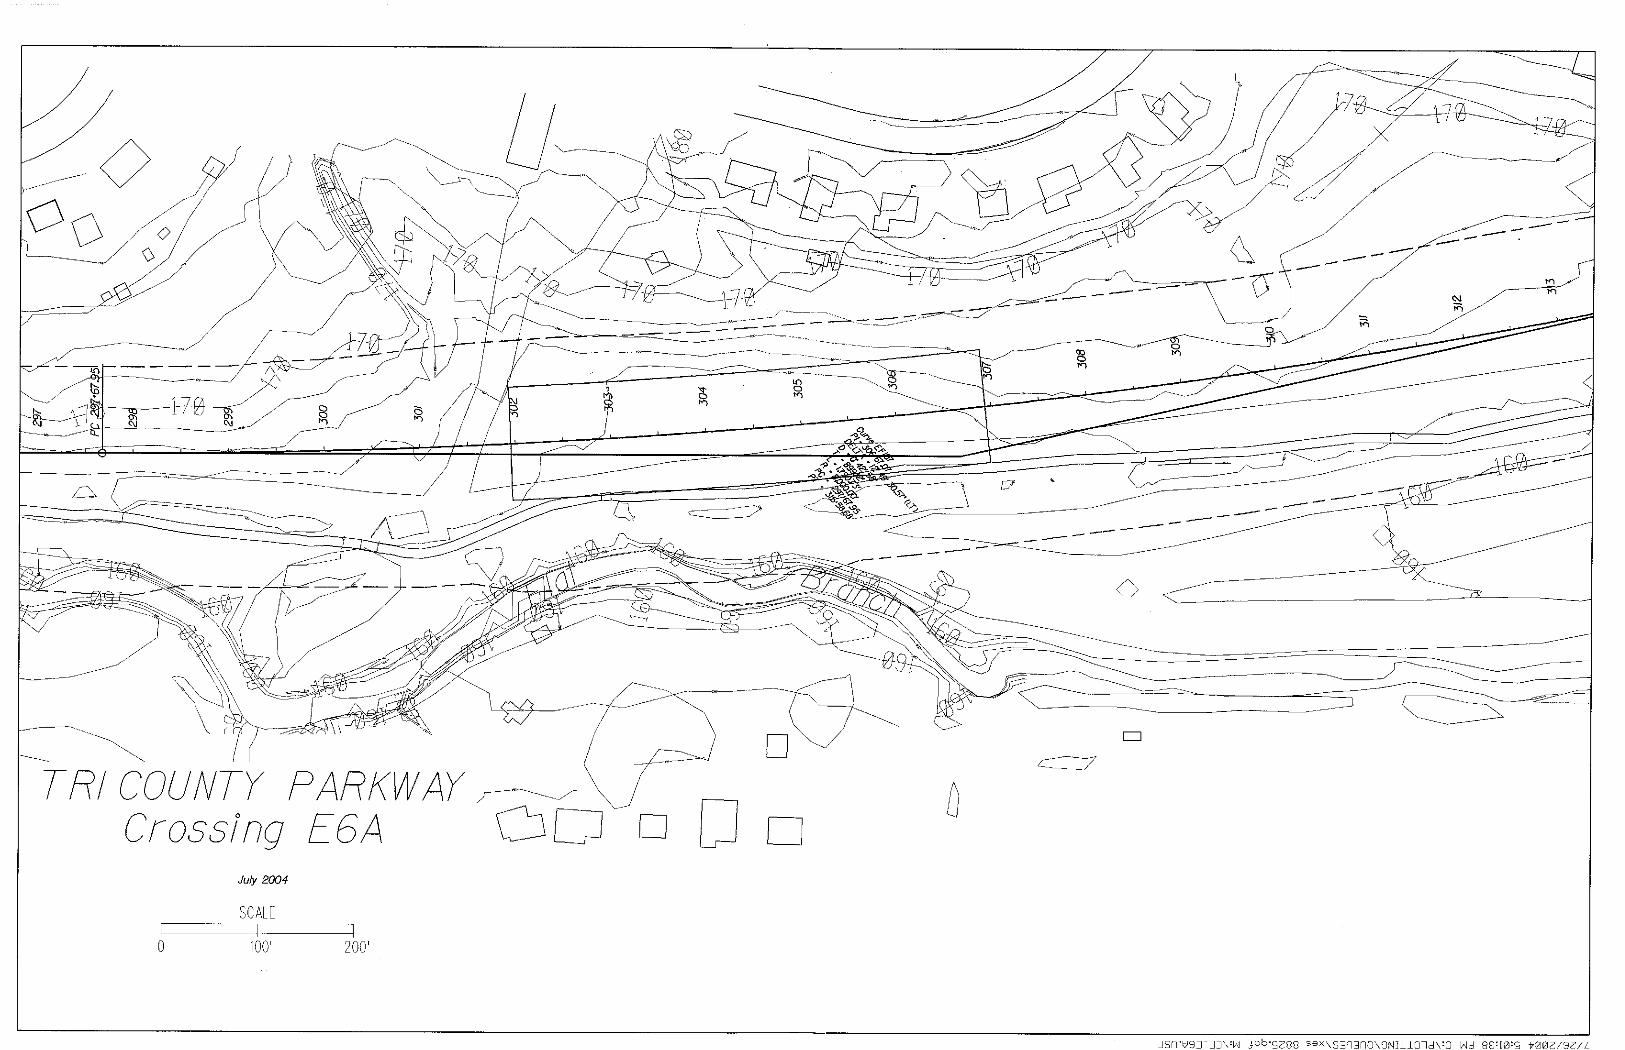
E6A Flat Branch Encroach.
Varies Varies Enc. 301+96 306+94 498 4 125
E6B1 Flat Branch Encroach.
Varies Varies 40 257+63 288+60 3097 25 124
E6B2 Flat Branch Encroach.
Varies Varies Enc. - -
E6B3 Flat Branch Encroach.
Varies Varies 35 25 124 E10A Bull Run 80 164 150 344+55 380+97 3642 29 126 E10B Bull Run 80 164 150 - - - - -
F10A Bull Run Feeder Stream 200 Not
Determined 100 596+08 597+08 100 1 100 F12 Elklick Run No Data Enc. Enc. 799+28 802+62 334 3 111
F17 Elklick Run 370 Not
Determined EXISTING 853+00 856+00 300 - - F19 Elklick Run 370 280 EXISTING EXISTING - - - -
F1A Cub Run 3700 Not
Determined 150 389+54 436+20 4666 37 126

3-4 Hydrology & Hydraulics Technical Report
Table 3.3.1 MAJOR DRAINAGE FACILITIES IN FLOODPLAINS
FLOODPLAIN AND BRIDGE DATA
Drainage Area ID Stream/Flood Plain
100-Year Floodplain
Width 100-Year
FEMA Elev. Main Channel Span Length
(ft) Begin
Station End
Station Total
Length (ft)
Spans Avg
Span Length
(ft)
F1B Cub Run 3700 Not
Determined 120
F1C Cub Run 3700 Not
Determined 80
F9 Bull Run Feeder Stream 350 Not
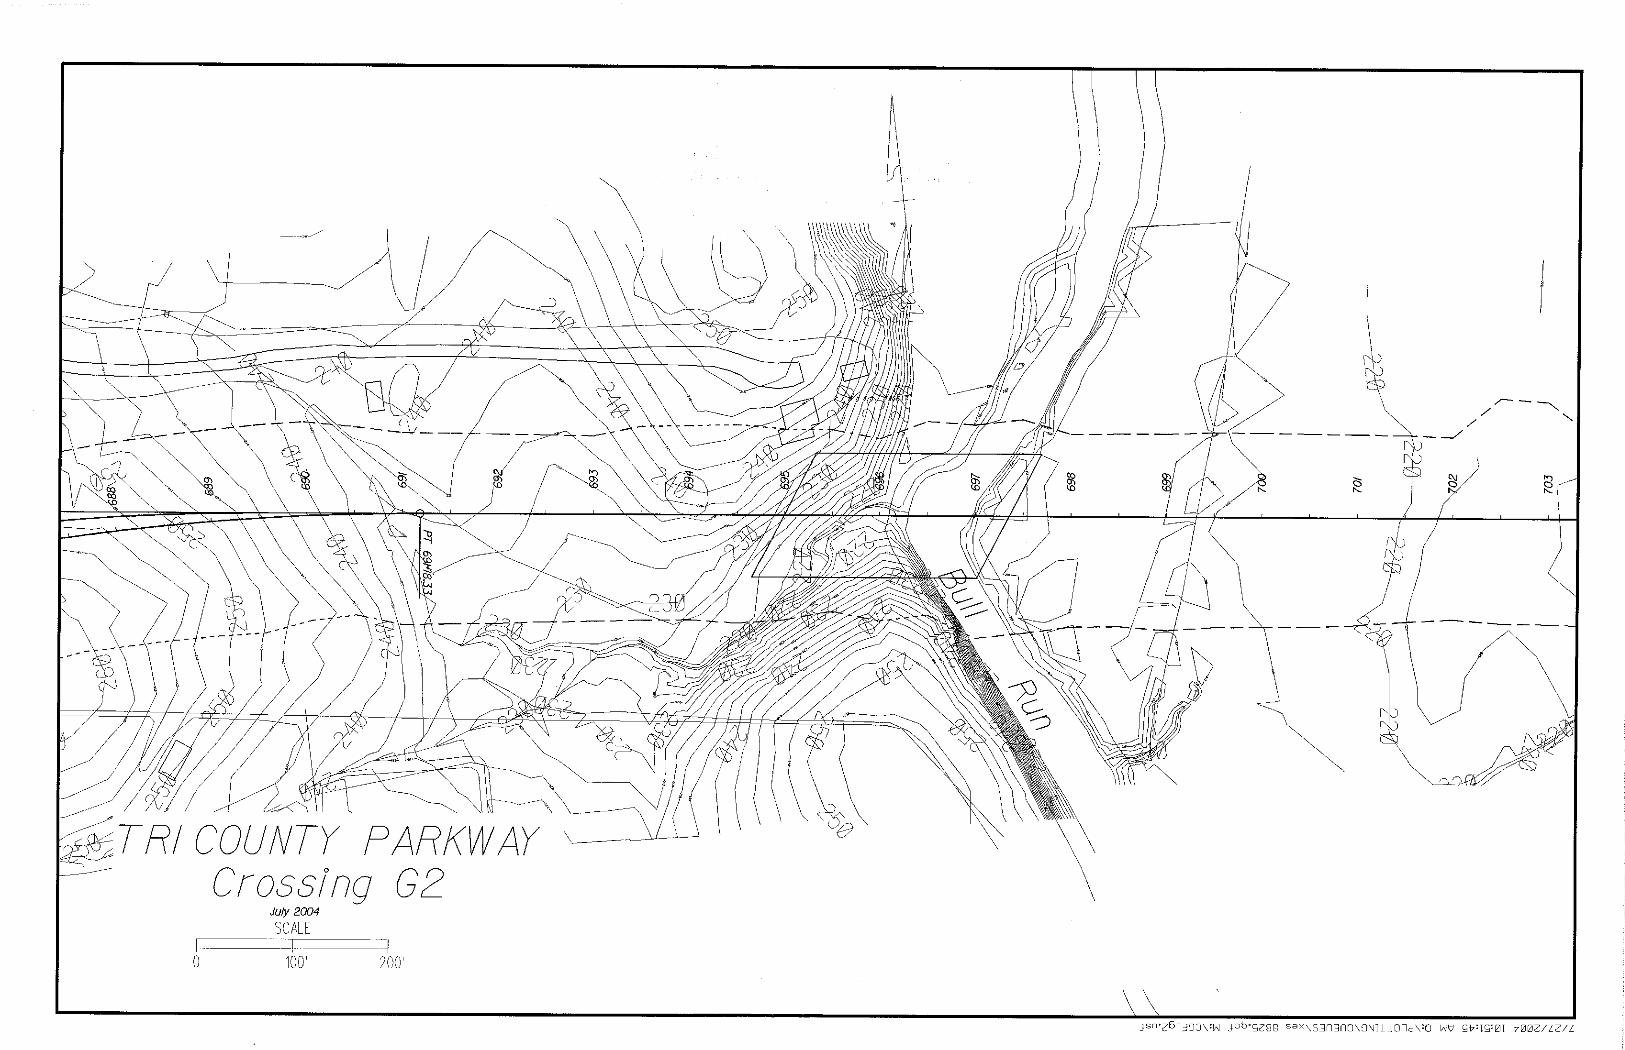
Determined 30 631+50 634+85 335 3 112 G2 Bull Run 650 225 140 695+00 697+36 236
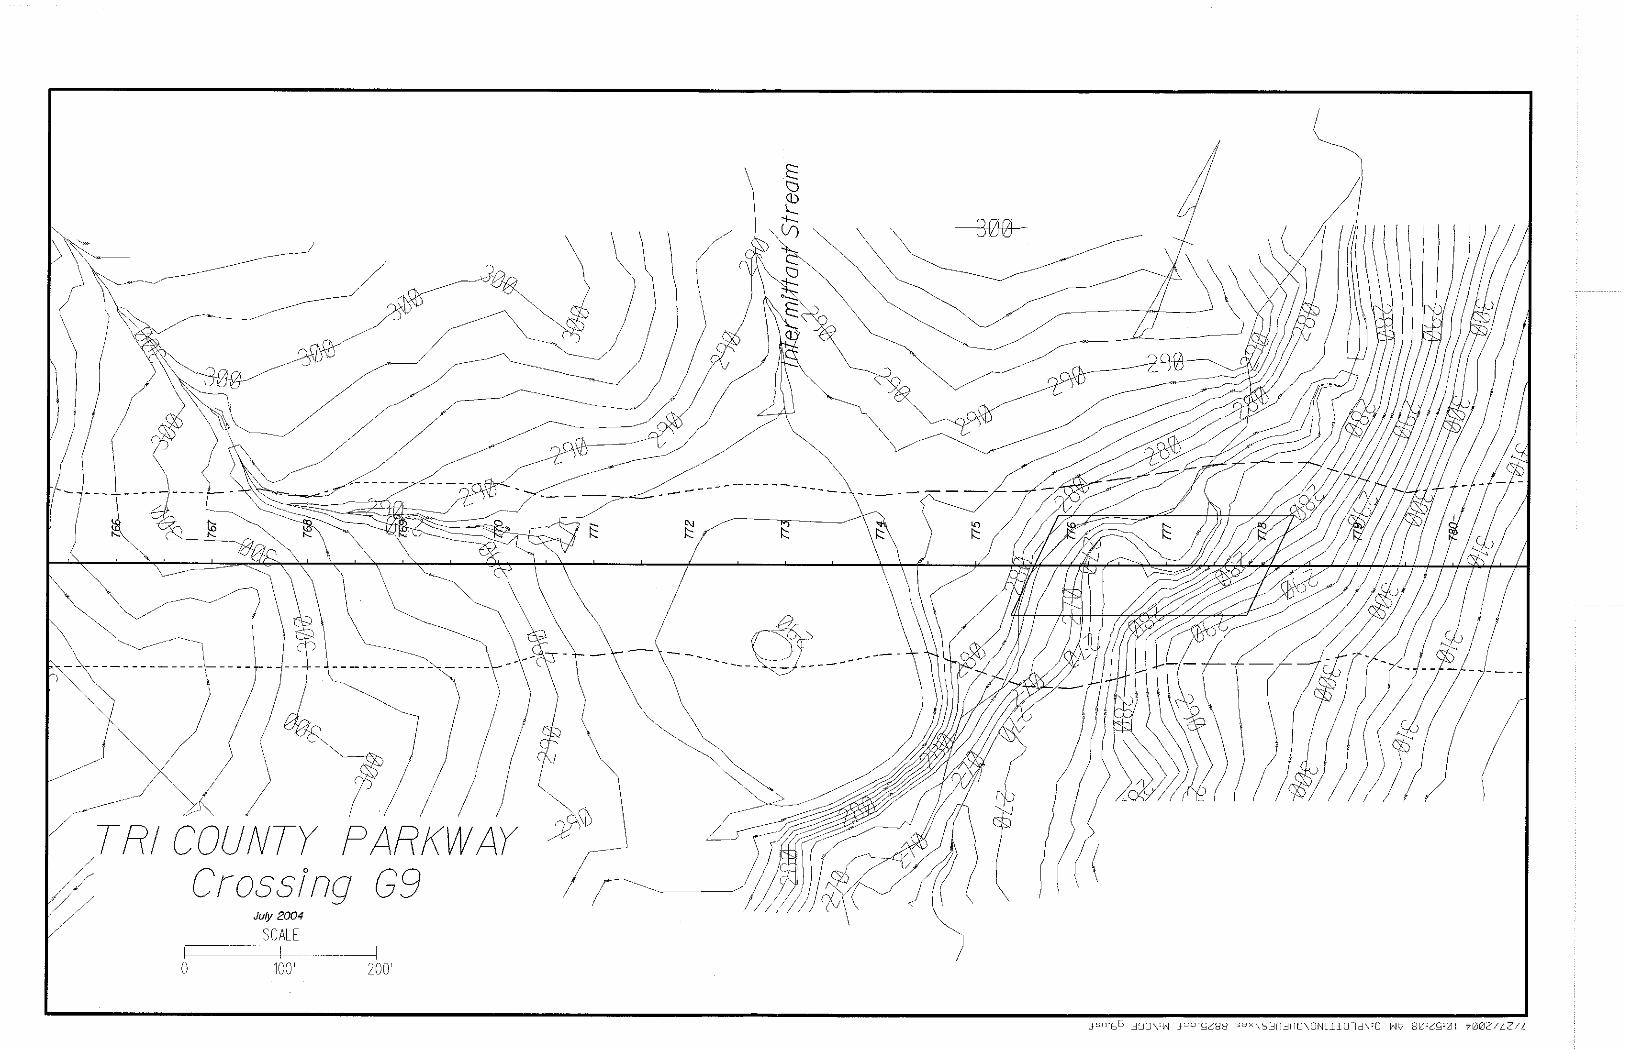
G9 (intermittent stream from GIS) 450 Not
Determined 150 775+62 778+08 246
3-5 Hydrology & Hydraulics Technical Report
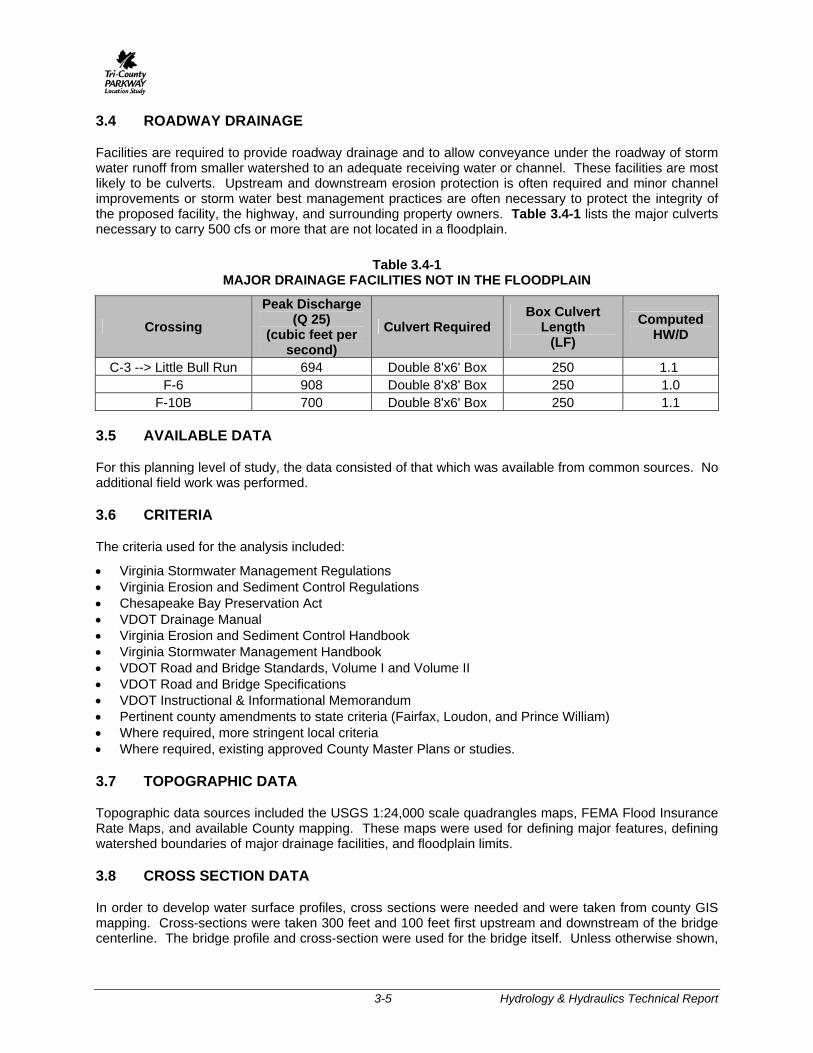
3.4 ROADWAY DRAINAGE
Facilities are required to provide roadway drainage and to allow conveyance under the roadway of storm water runoff from smaller watershed to an adequate receiving water or channel. These facilities are most likely to be culverts. Upstream and downstream erosion protection is often required and minor channel improvements or storm water best management practices are often necessary to protect the integrity of the proposed facility, the highway, and surrounding property owners. Table 3.4-1 lists the major culverts necessary to carry 500 cfs or more that are not located in a floodplain.
Table 3.4-1 MAJOR DRAINAGE FACILITIES NOT IN THE FLOODPLAIN
Crossing Peak Discharge
(Q 25) (cubic feet per
second) Culvert Required
Box Culvert Length
(LF) Computed
HW/D
C-3 --> Little Bull Run 694 Double 8'x6' Box 250 1.1 F-6 908 Double 8'x8' Box 250 1.0
F-10B 700 Double 8'x6' Box 250 1.1
3.5 AVAILABLE DATA
For this planning level of study, the data consisted of that which was available from common sources. No additional field work was performed.
3.6 CRITERIA
The criteria used for the analysis included:
• Virginia Stormwater Management Regulations • Virginia Erosion and Sediment Control Regulations • Chesapeake Bay Preservation Act • VDOT Drainage Manual • Virginia Erosion and Sediment Control Handbook • Virginia Stormwater Management Handbook • VDOT Road and Bridge Standards, Volume I and Volume II • VDOT Road and Bridge Specifications • VDOT Instructional & Informational Memorandum • Pertinent county amendments to state criteria (Fairfax, Loudon, and Prince William) • Where required, more stringent local criteria • Where required, existing approved County Master Plans or studies.
3.7 TOPOGRAPHIC DATA
Topographic data sources included the USGS 1:24,000 scale quadrangles maps, FEMA Flood Insurance Rate Maps, and available County mapping. These maps were used for defining major features, defining watershed boundaries of major drainage facilities, and floodplain limits.
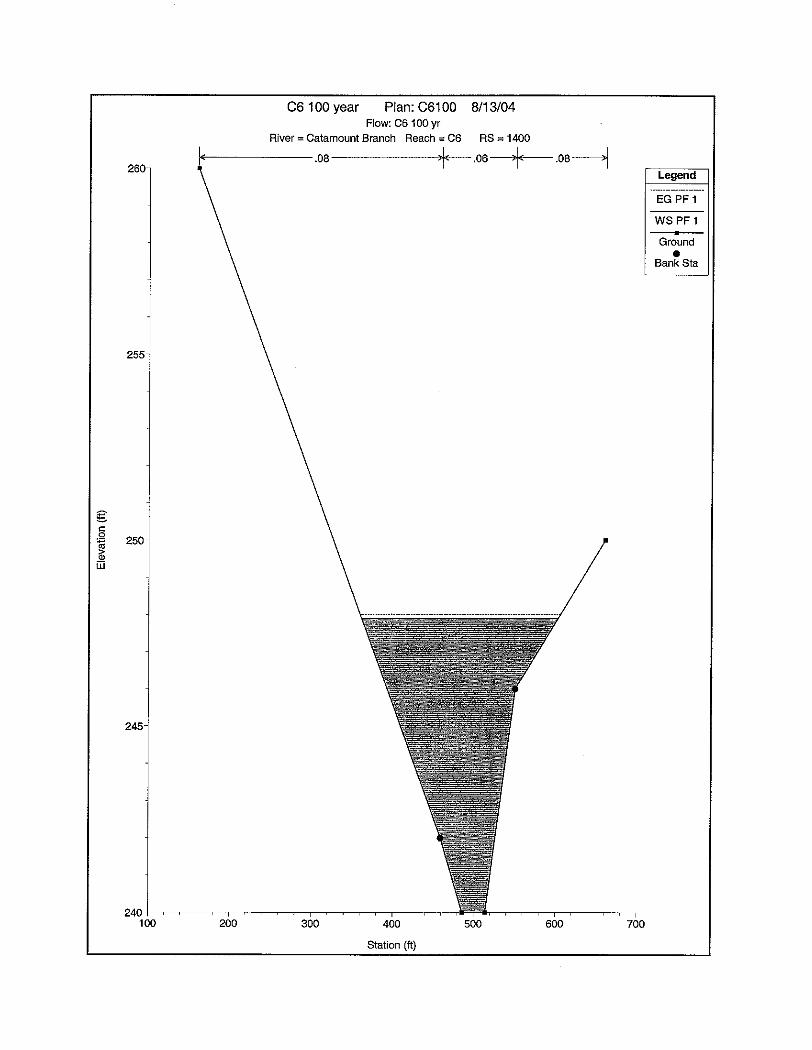
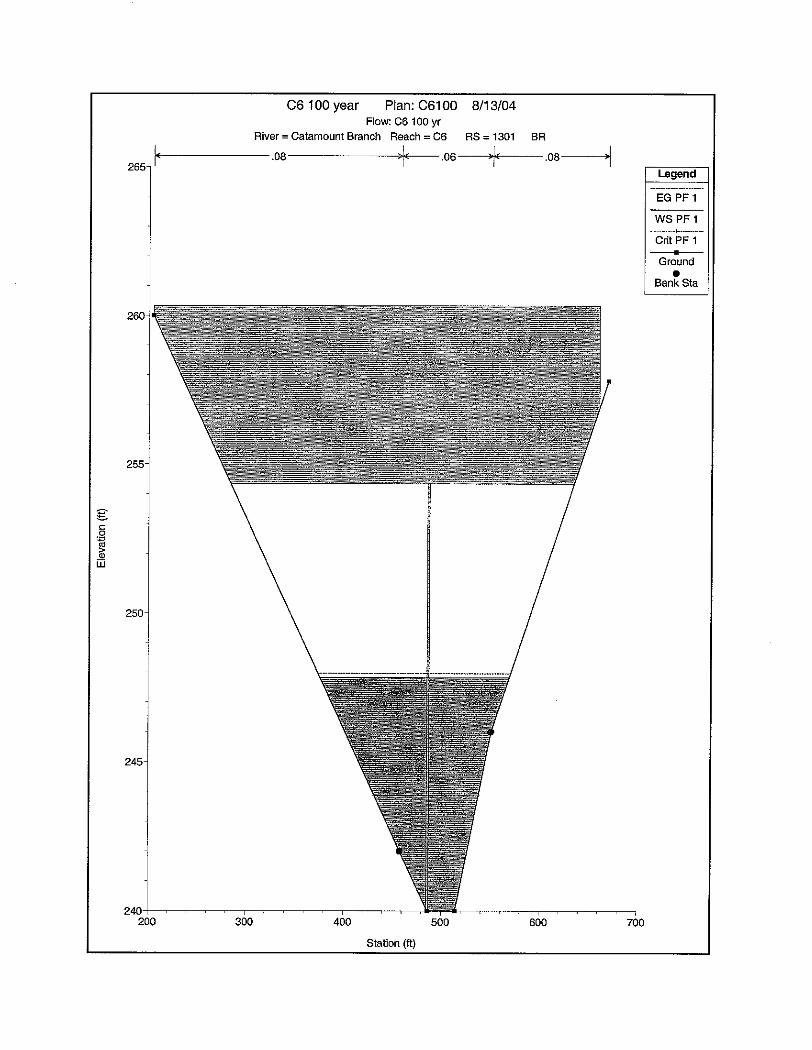
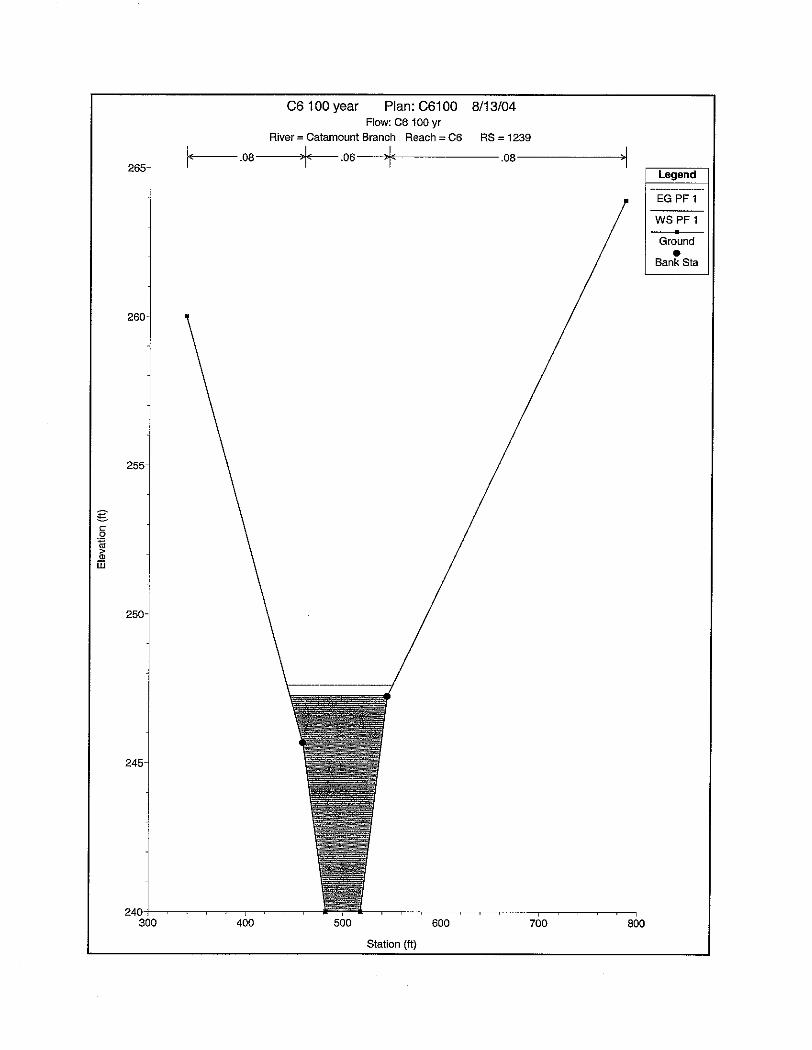
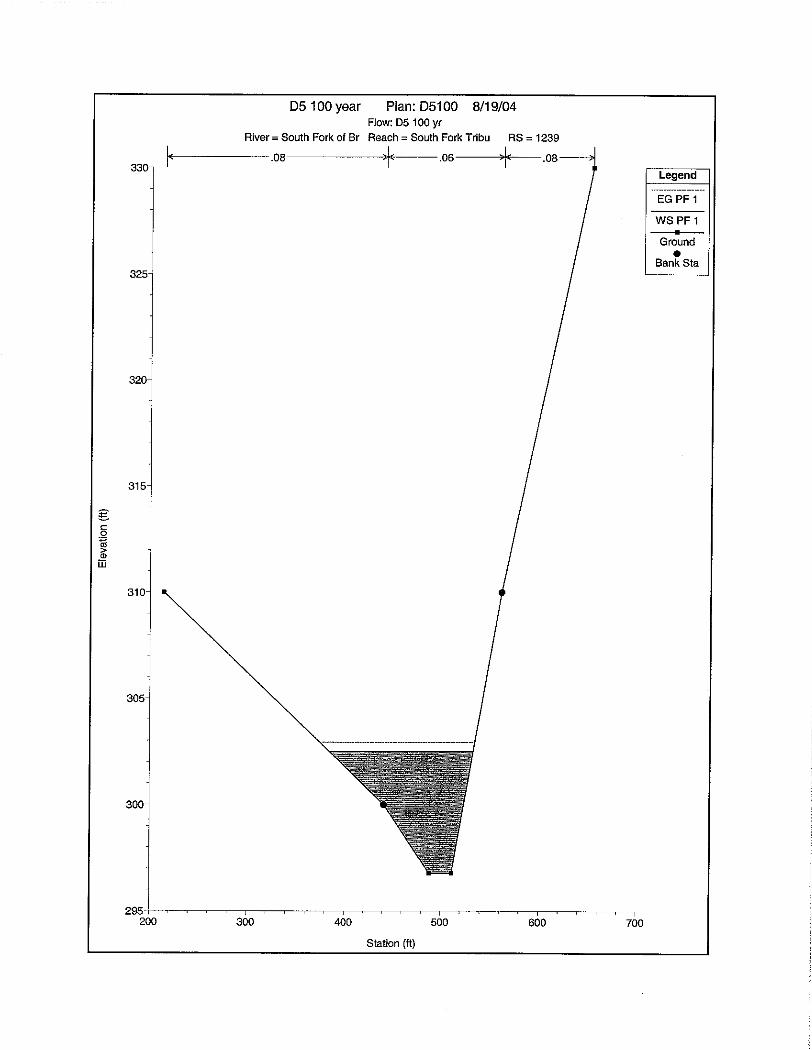
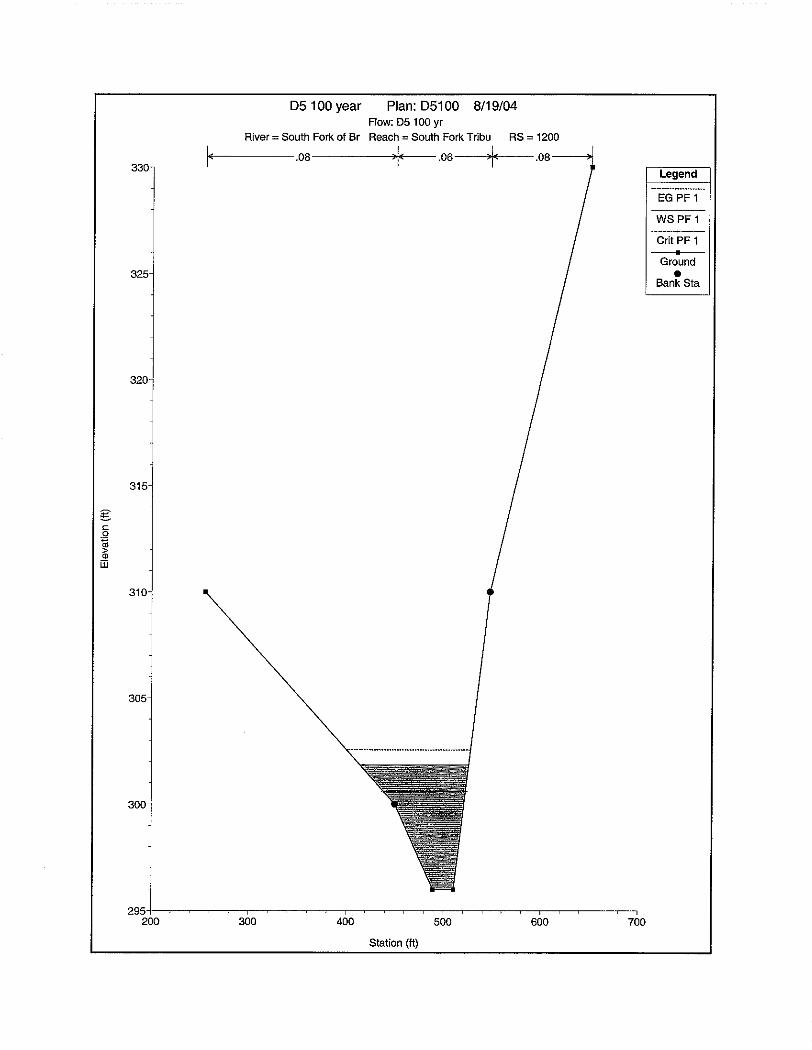
3.8 CROSS SECTION DATA
In order to develop water surface profiles, cross sections were needed and were taken from county GIS mapping. Cross-sections were taken 300 feet and 100 feet first upstream and downstream of the bridge centerline. The bridge profile and cross-section were used for the bridge itself. Unless otherwise shown,

3-6 Hydrology & Hydraulics Technical Report
the depth to low steel was assumed to be six feet from the top of roadway profile for planning purposes. The cross-sections were cut perpendicular to the direction of the flood flows and were extended to a point above the apparent edge of the floodplain elevation or the FEMA elevation for the 100 year storm, where that data was available.
3.9 STARTING ELEVATION
The computation of the water surface profile was started at the most downstream cross-section using the FEMA 100 year elevation, where available. If the FEMA elevations were not available, normal depth for the cross-section was determined using the cross-section data. The slope was the average stream bed slope as could be determined from either the streambed or the average floodplain elevation.
3.10 DISCHARGE DATA
The 100 year discharge was obtained from FEMA data or by computing the discharge using the VDOT regression analysis for major structures in the floodplain with drainage over 225 acres. For the structures not in the floodplain, the discharge was computed using TR55 and was limited to drainage areas less than 640 acres.
3.11 MINIMUM STRUCTURES REQUIREMENT
The analysis is to determine the minimum structure waterway opening and to provide a water surface elevation for the 100 year flood to assist in determining the low steel or lowest point of the bridge structure to avoid submergence during the 100 year flood. The water opening of the bridge was based on the end walls as shown on the preliminary alignment for the initial computation.
3.12 APPROACH AND LIMITS TO THE ANALYSIS
The approach to the determination of peak flows and water surface profile computations is suitable for the planning level and relative comparisons. The methods used have been derived for that level of accuracy. As the design progresses and more accurate data is available, the methodology will also change to produce more precise results.
3.13 HYDROLOGIC METHOD
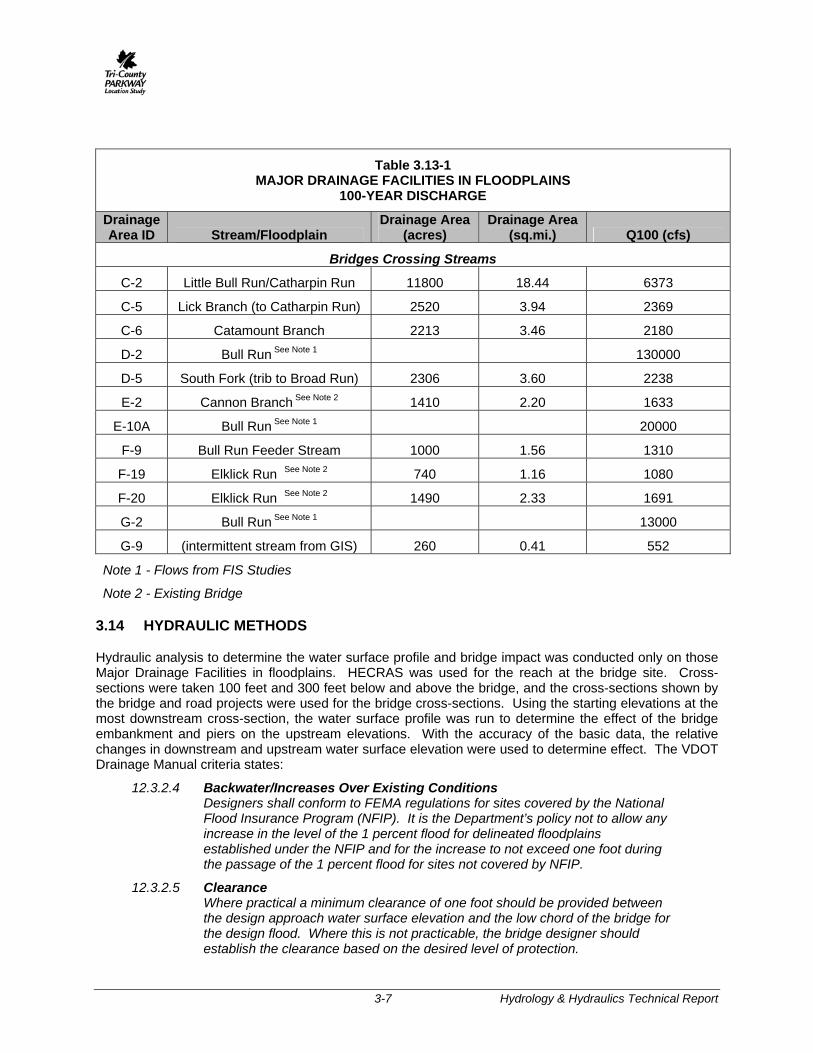
Required stormwater facilities that have been defined as “Major Structures not in a floodplain” tend to be within smaller watersheds with flows above 500 cfs for the 100 year storm. Typically, these facility needs can be resolved by using a culvert or series of culverts. As far as possible, with existing data and topography, any area or location needing a roadway culvert for roadway or small watershed drainage was preliminarily assessed to determine if it will fit into the Minor Drainage or Major Drainage Facility. The Major Drainage Facilities were further separated by the floodplain criteria to identify the culvert or bridge structures type. For those determined to be candidates for Major Drainage Structure not in a floodplain, the discharge was computed using TR55 area and only those with a discharge greater then 500 cfs were listed. Those so determined are listed in Table 3.3.1, as previously noted.
For the remainder of the Major Drainage Facilities in flood plain areas which generally are significantly larger watersheds, the discharge was computed using the VDOT Regression Analysis. The discharges computed by the Regression Analysis were compared to the FEMA 100 year discharges data and the largest value was used for the computations of the water opening. Table 3.13-1 shows these structures.
3-7 Hydrology & Hydraulics Technical Report
Table 3.13-1 MAJOR DRAINAGE FACILITIES IN FLOODPLAINS
100-YEAR DISCHARGE
Drainage Area ID Stream/Floodplain
Drainage Area (acres)
Drainage Area (sq.mi.) Q100 (cfs)
Bridges Crossing Streams
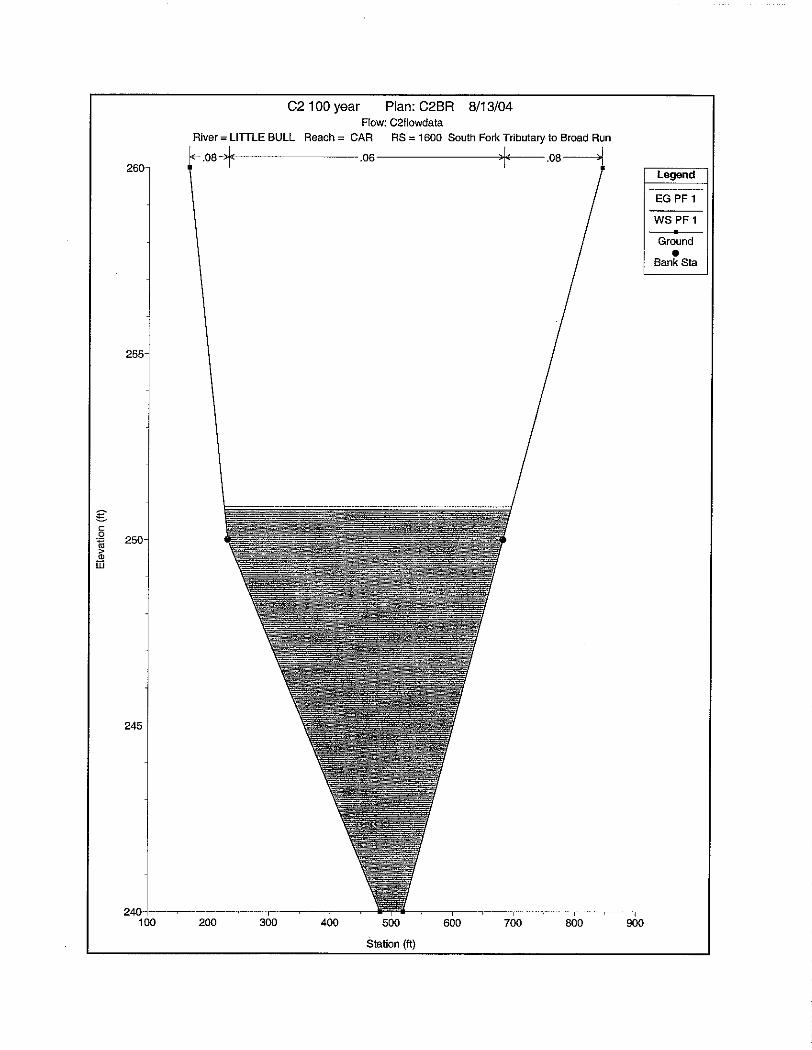
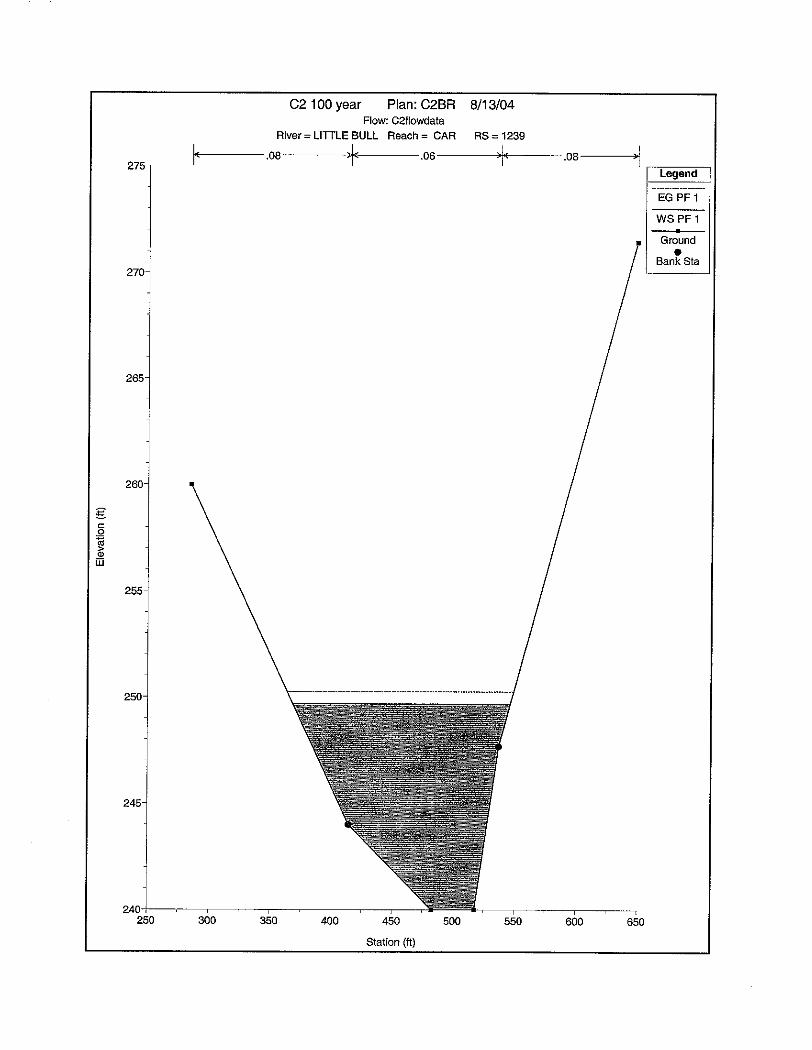
C-2 Little Bull Run/Catharpin Run 11800 18.44 6373
C-5 Lick Branch (to Catharpin Run) 2520 3.94 2369
C-6 Catamount Branch 2213 3.46 2180
D-2 Bull Run See Note 1 130000
D-5 South Fork (trib to Broad Run) 2306 3.60 2238
E-2 Cannon Branch See Note 2 1410 2.20 1633
E-10A Bull Run See Note 1 20000
F-9 Bull Run Feeder Stream 1000 1.56 1310
F-19 Elklick Run See Note 2 740 1.16 1080
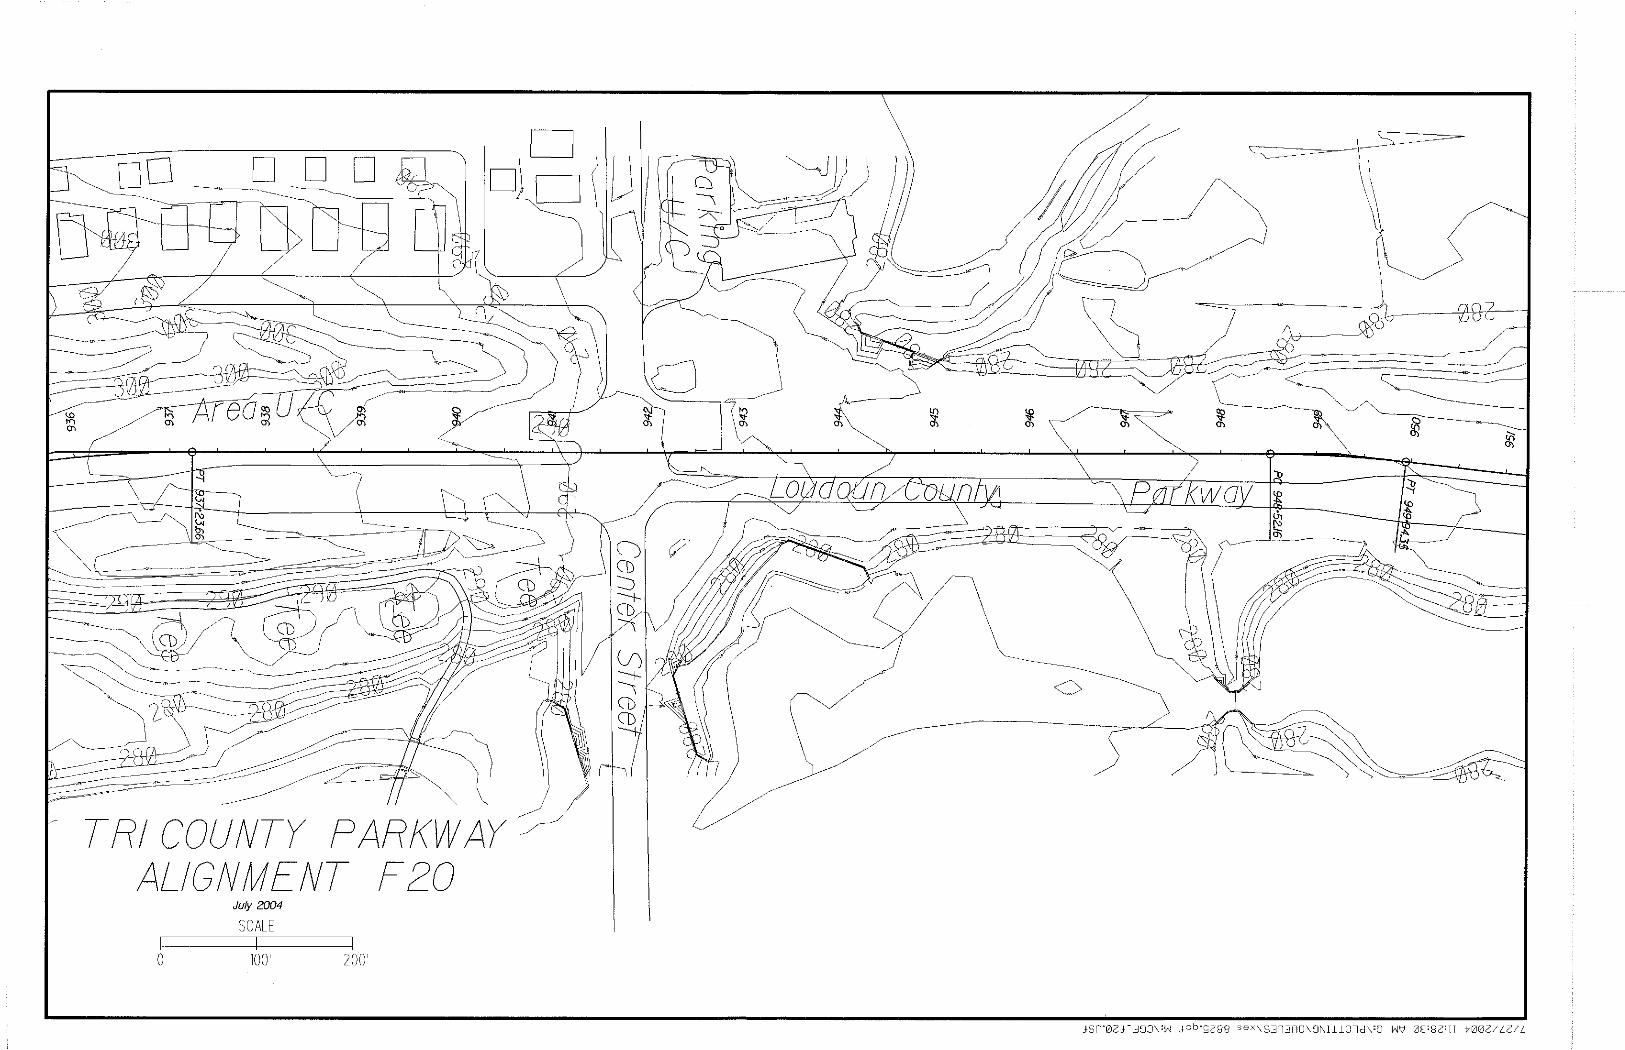
F-20 Elklick Run See Note 2 1490 2.33 1691
G-2 Bull Run See Note 1 13000
G-9 (intermittent stream from GIS) 260 0.41 552
Note 1 - Flows from FIS Studies
Note 2 - Existing Bridge
3.14 HYDRAULIC METHODS
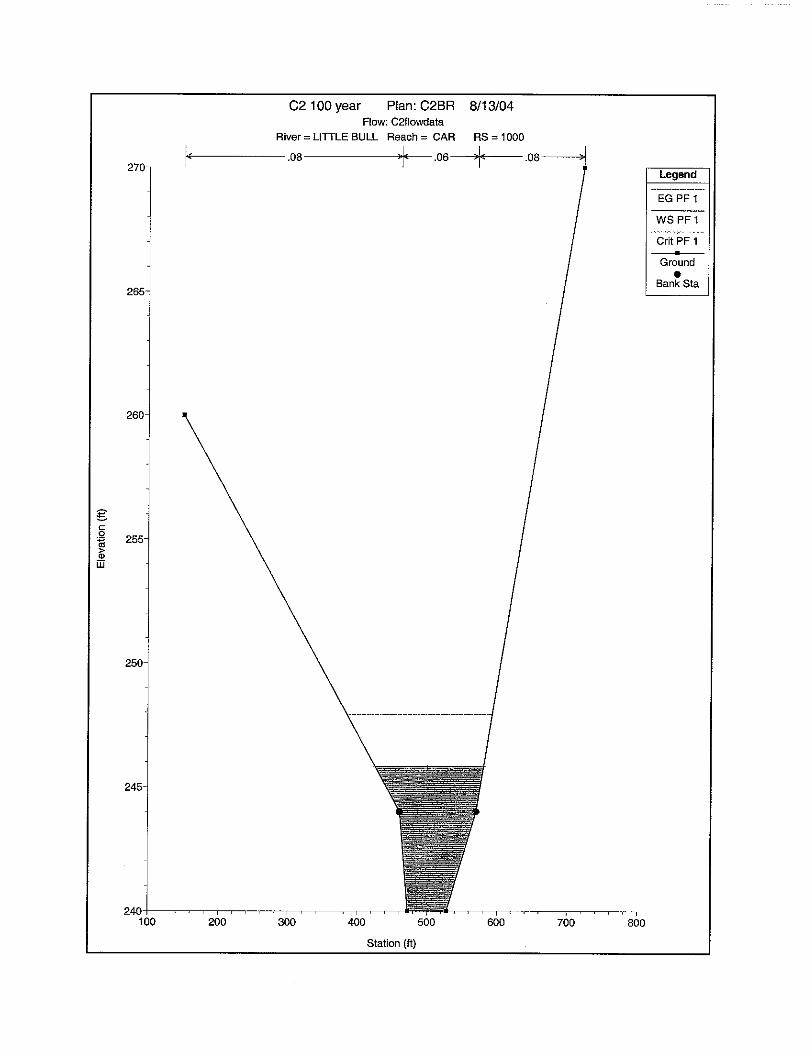
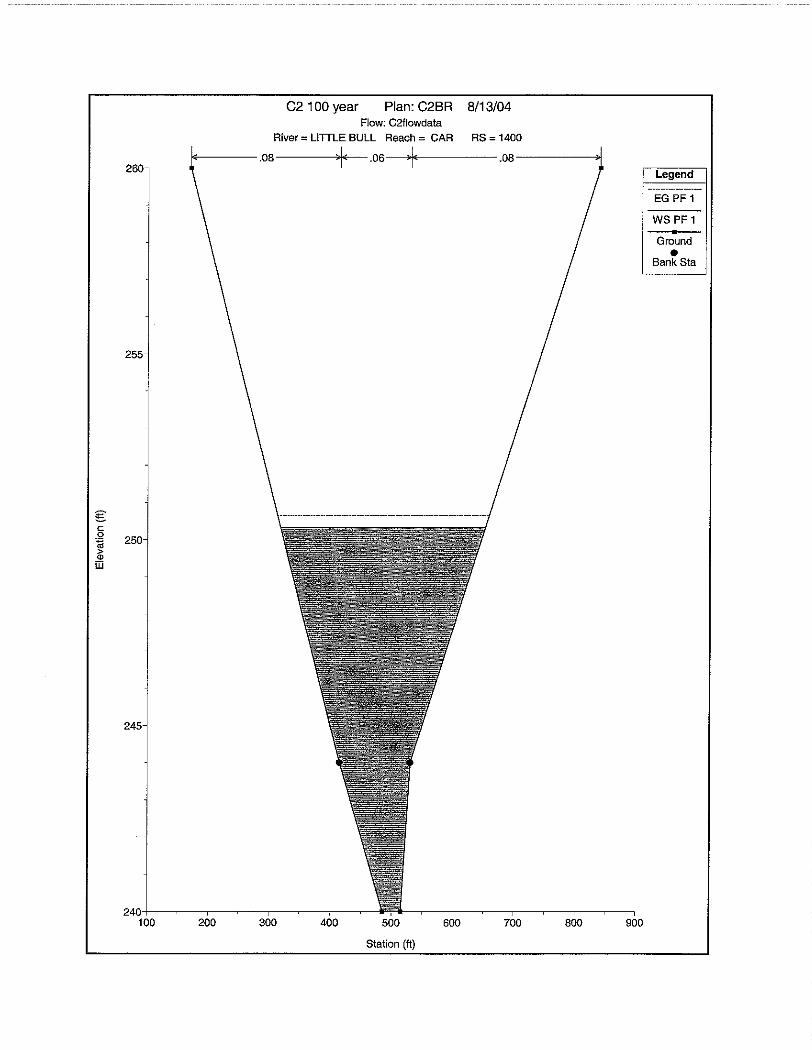
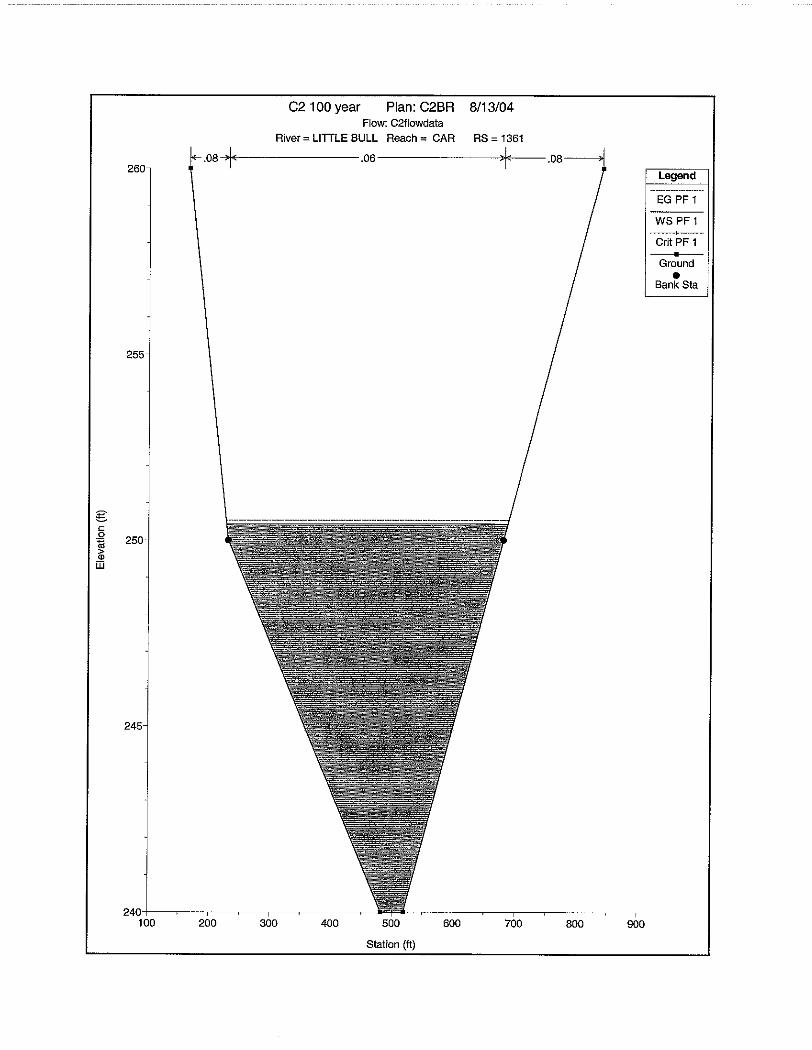
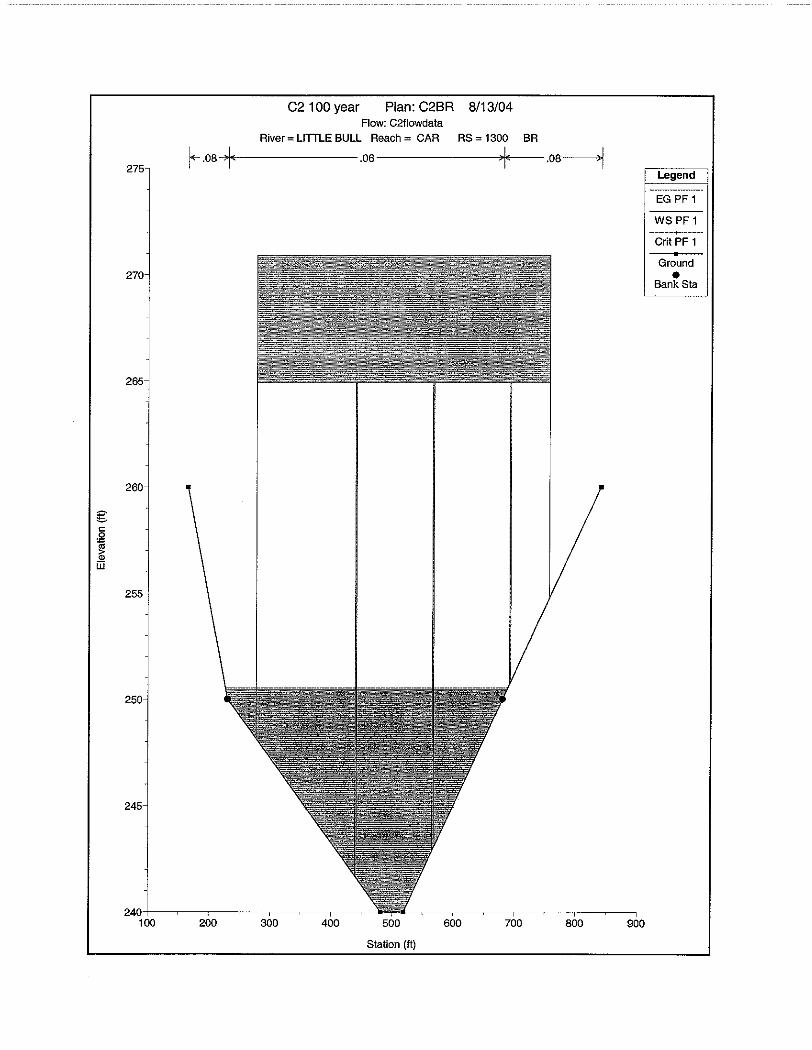
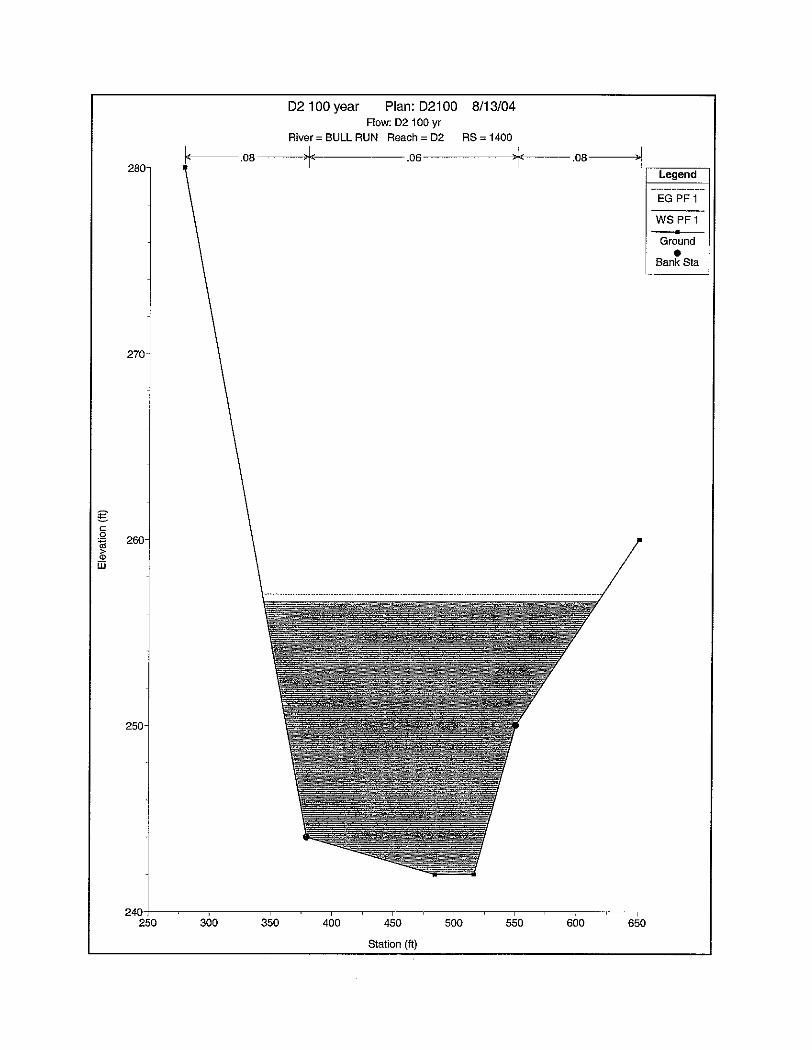
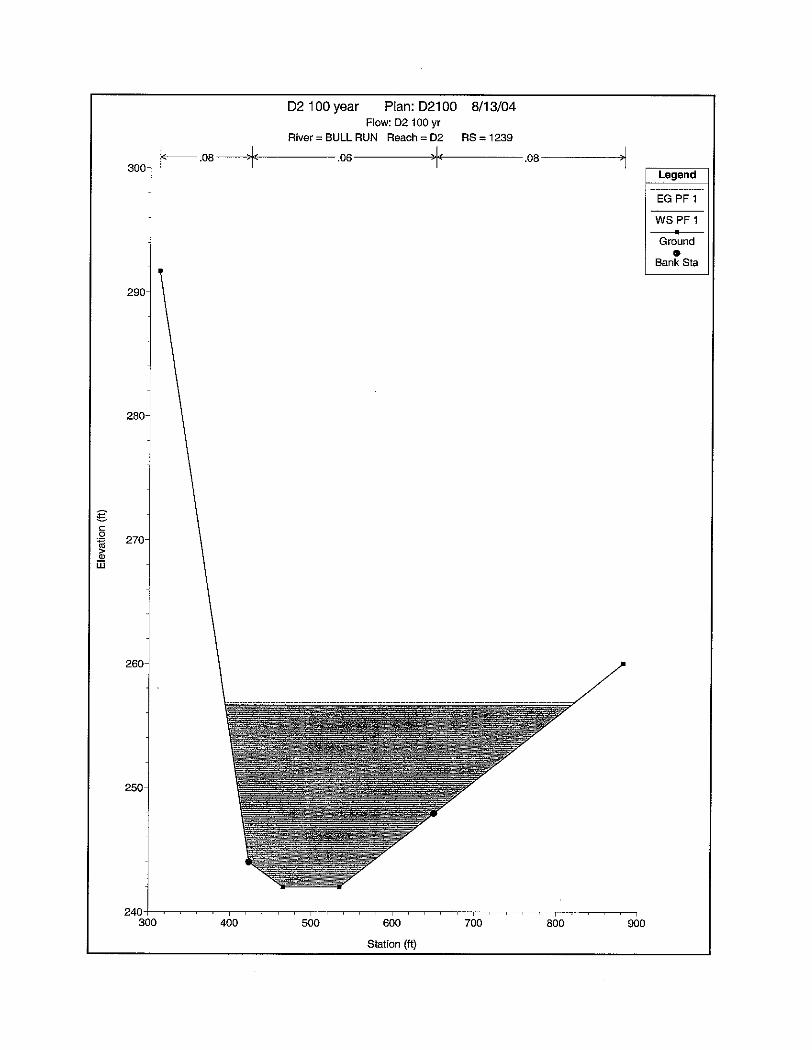
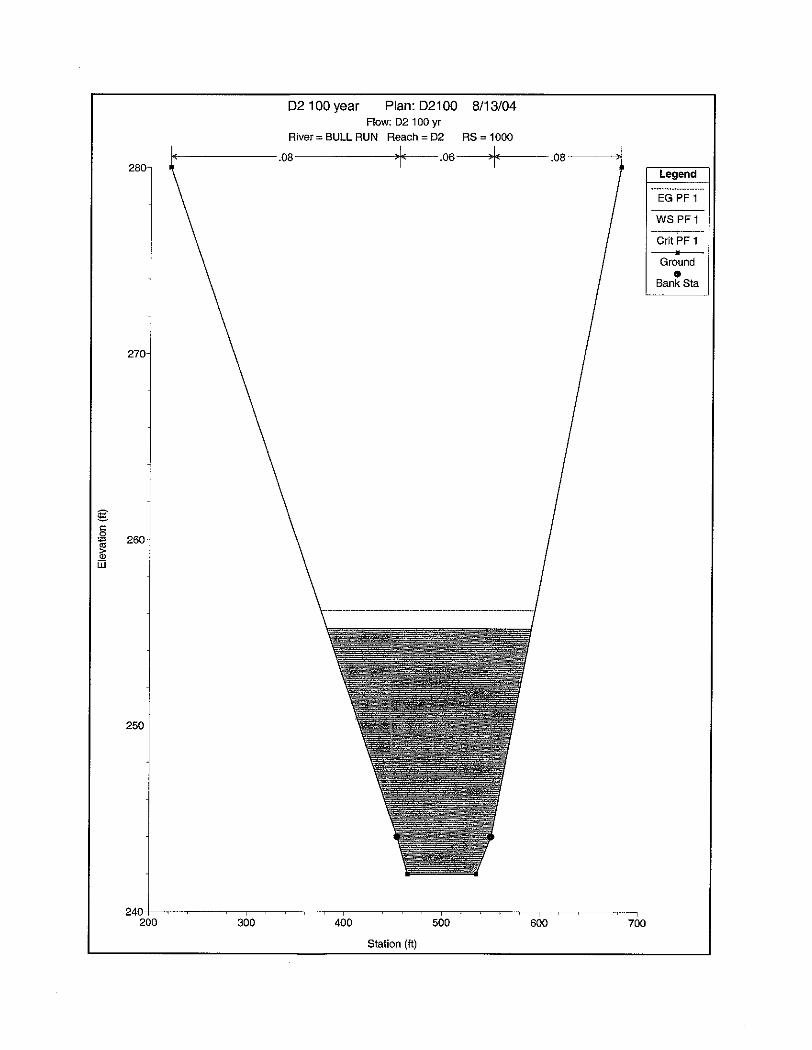
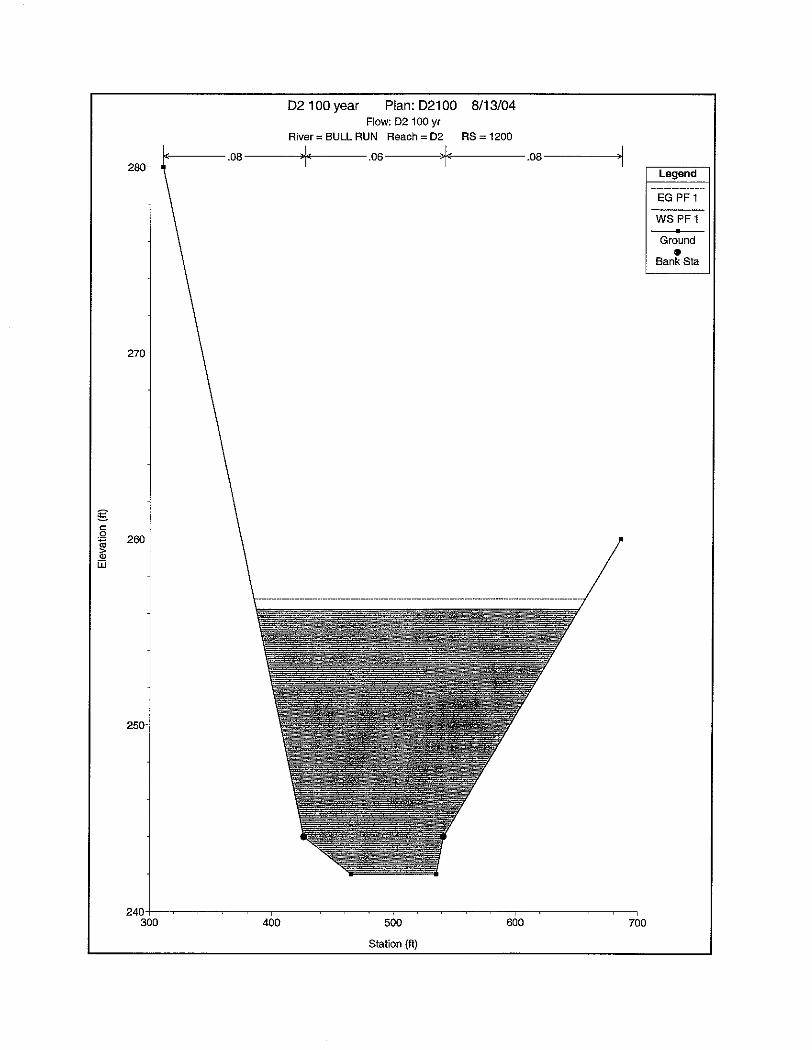
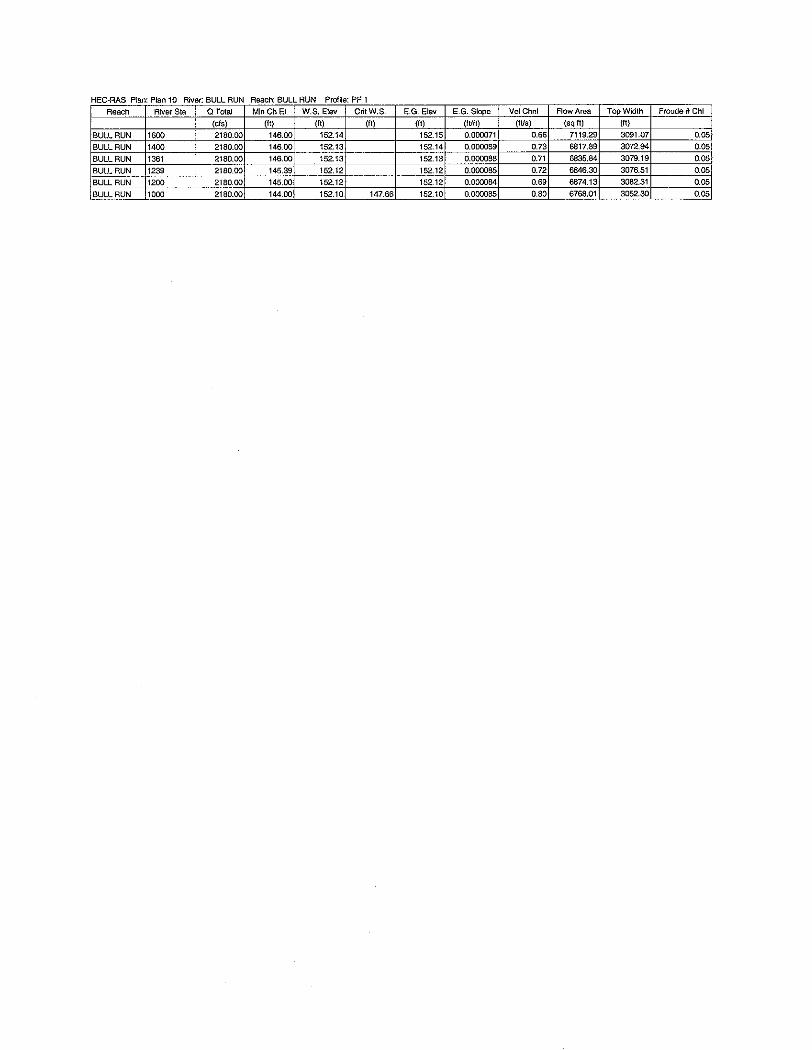
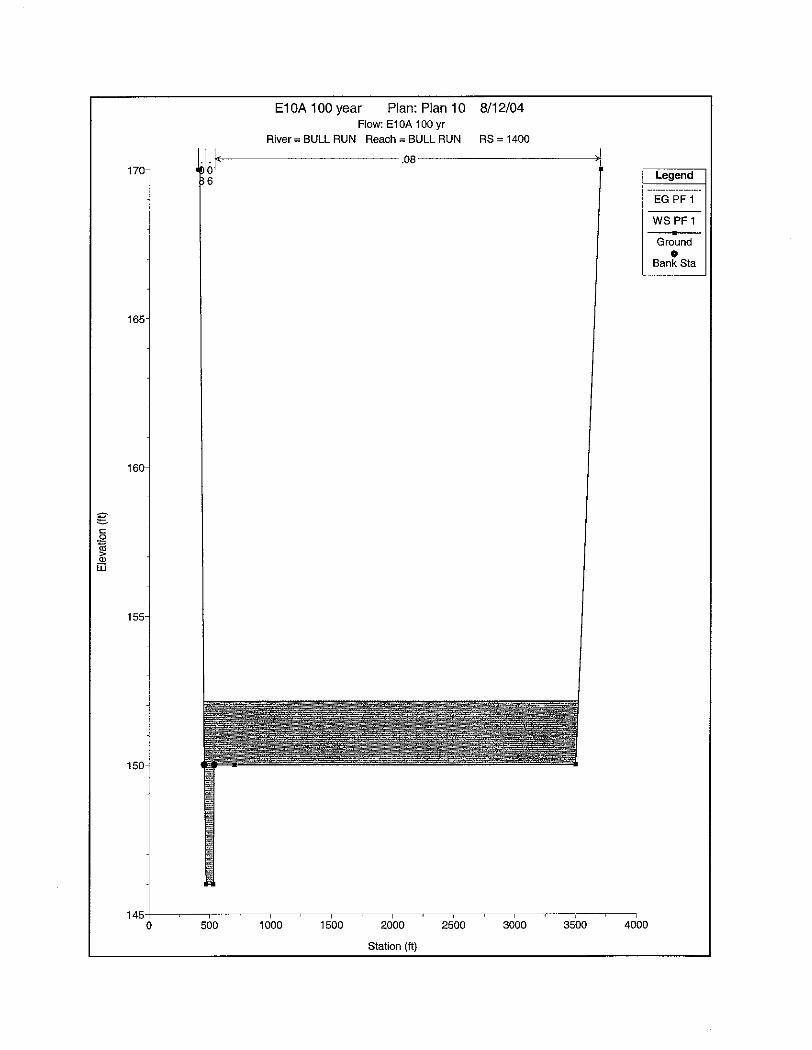
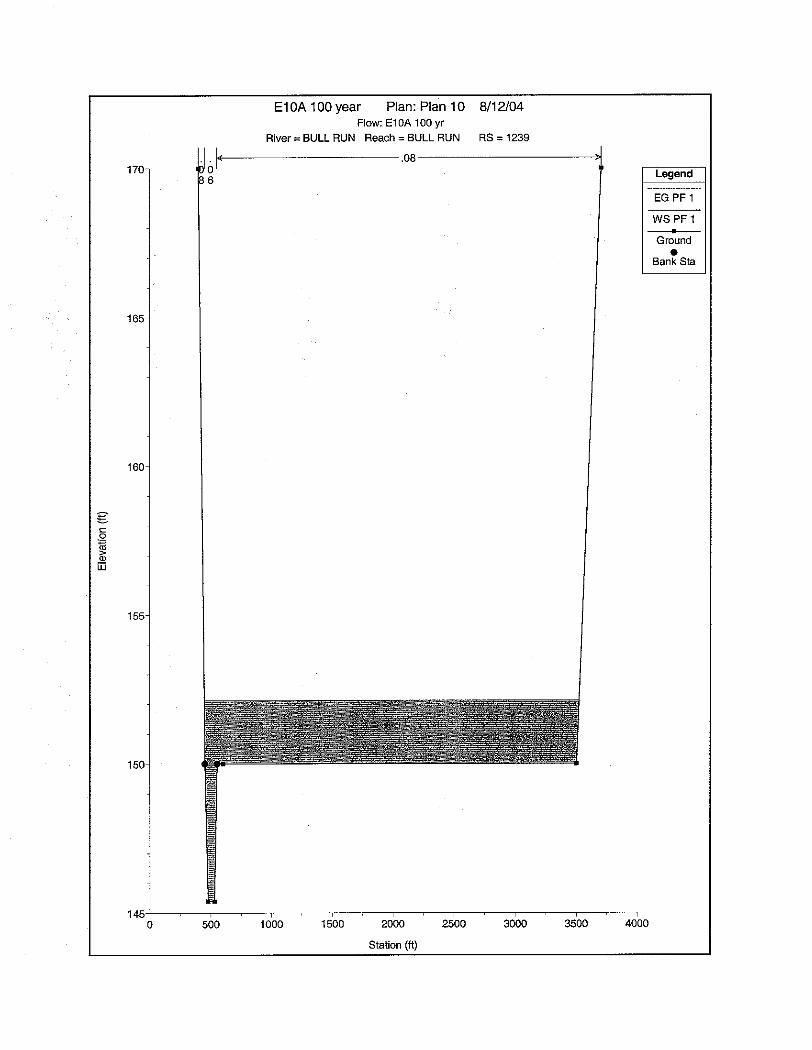
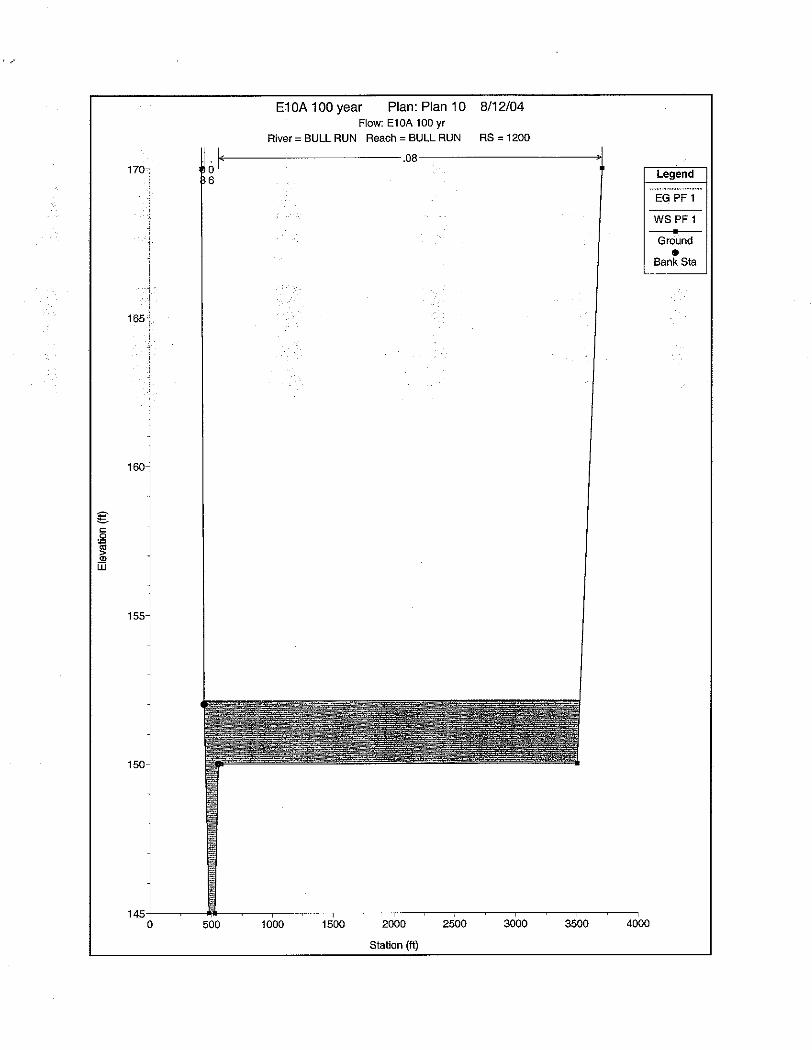
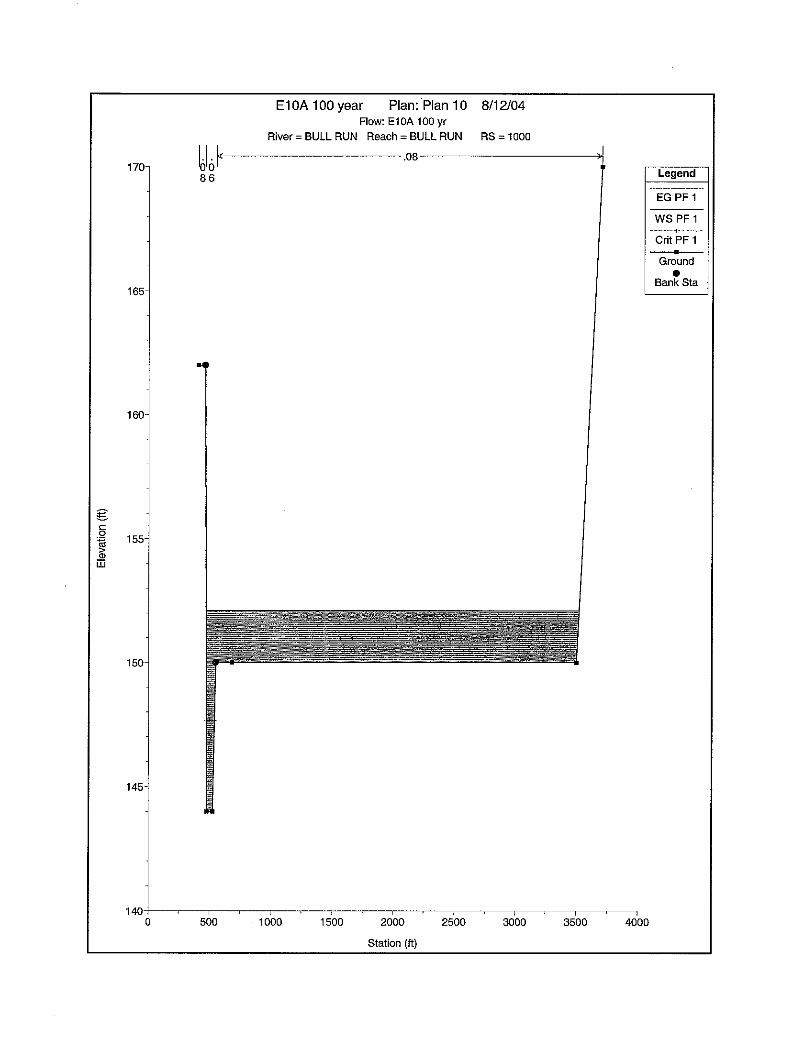
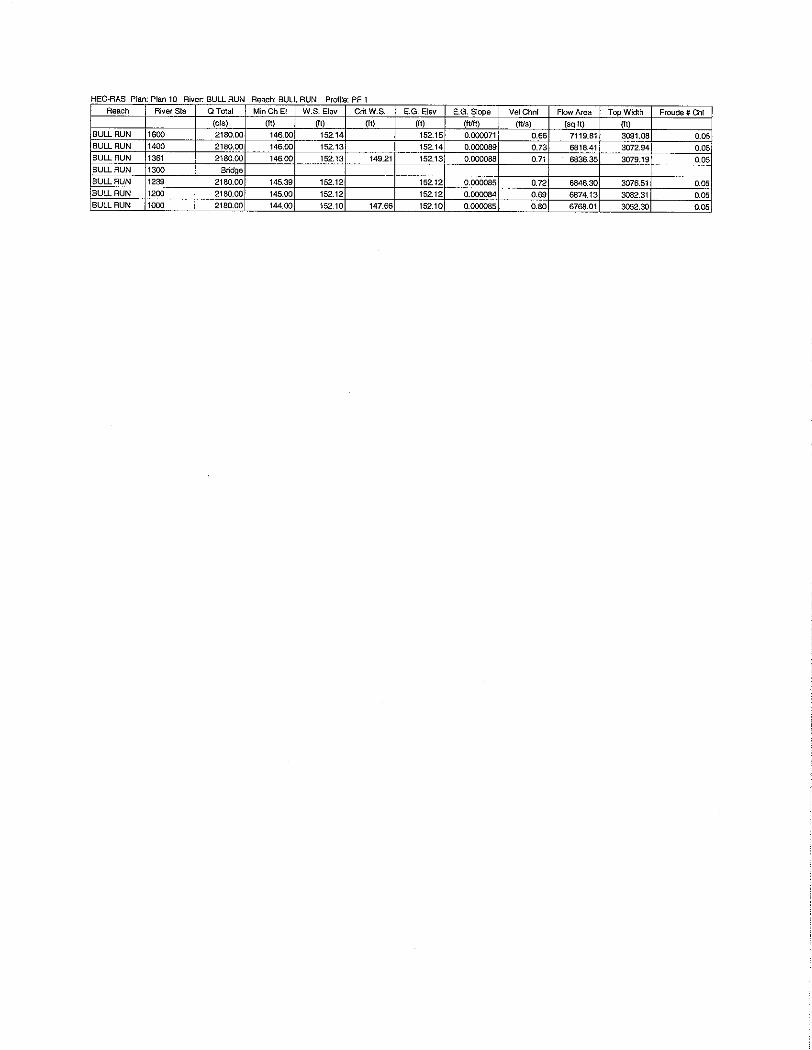
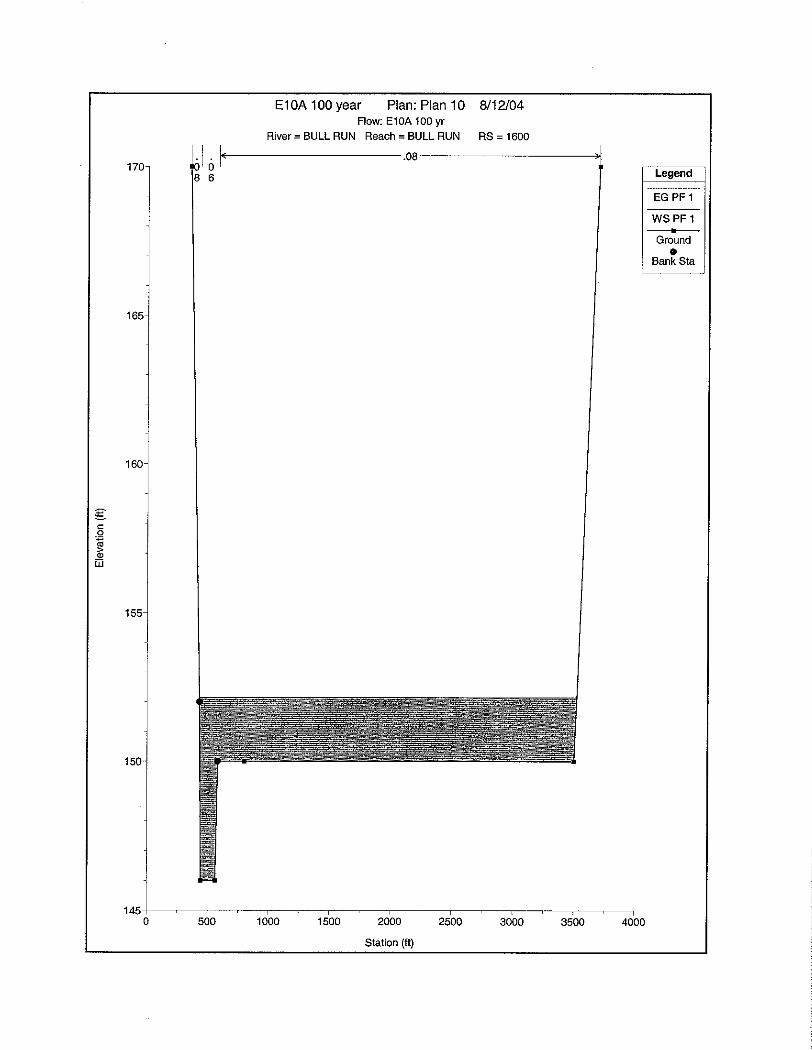
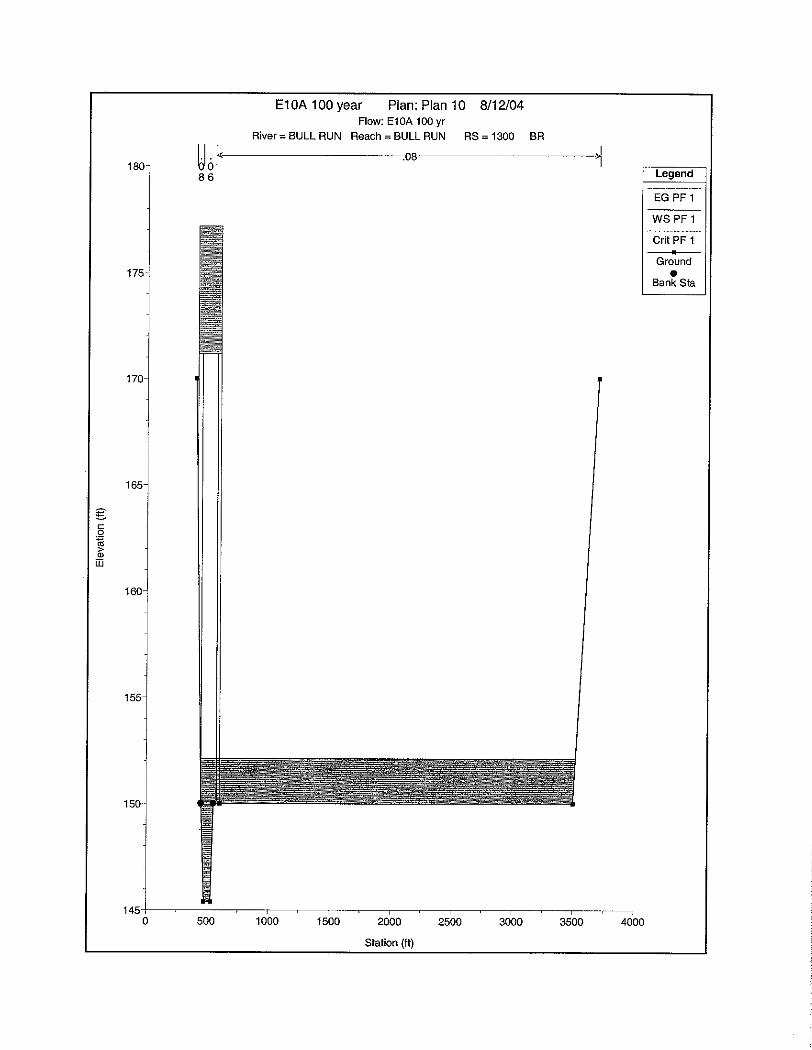
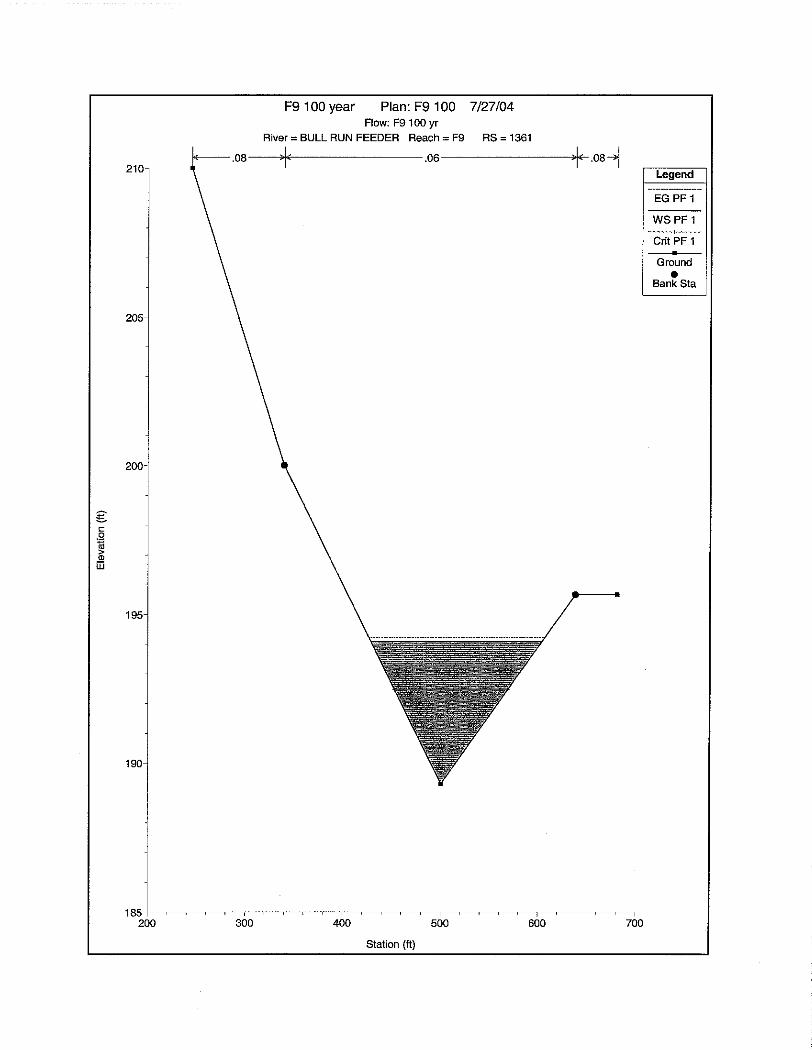
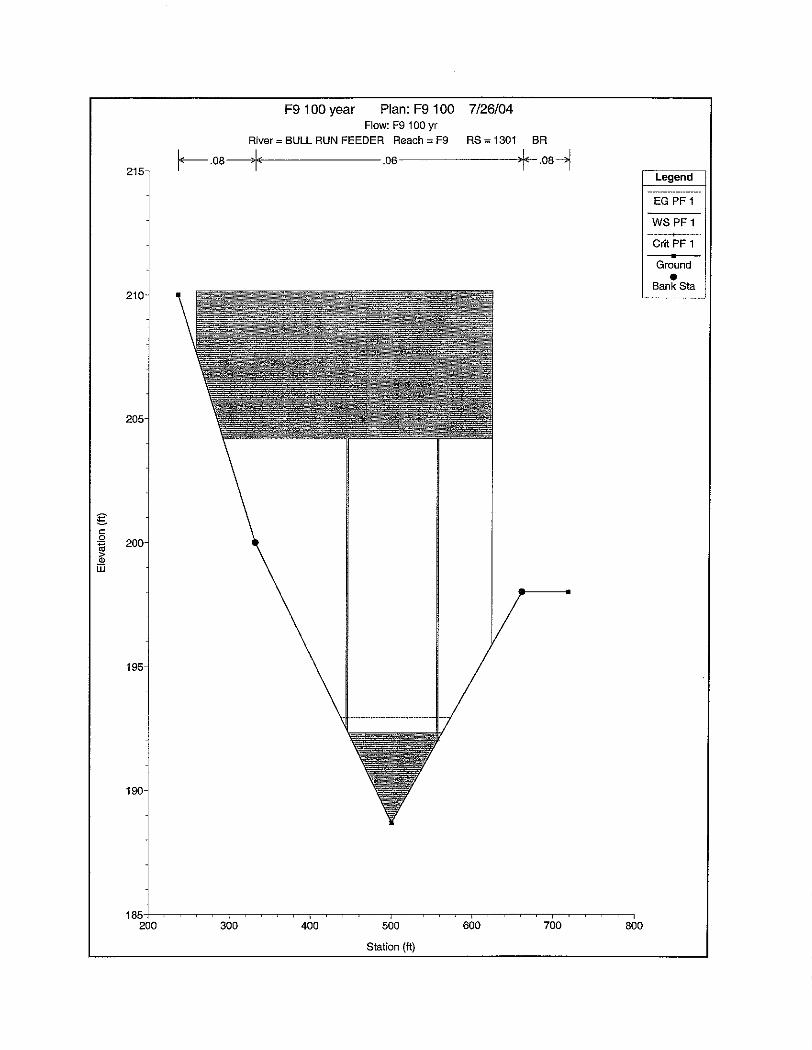
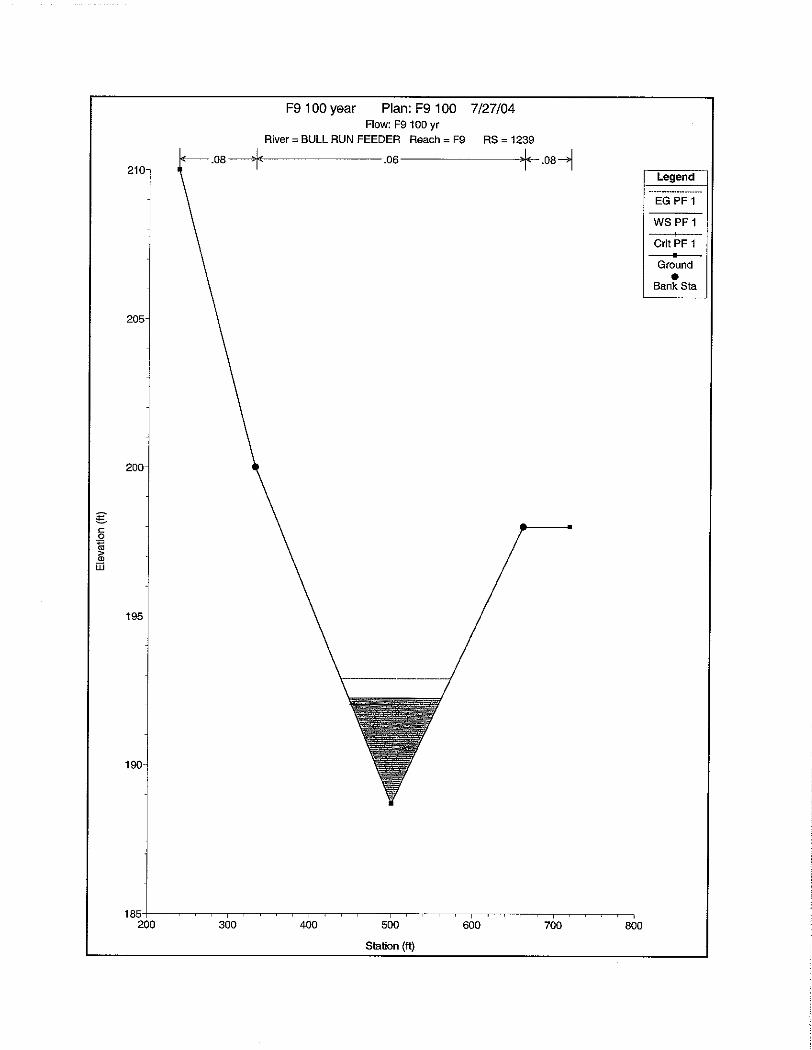
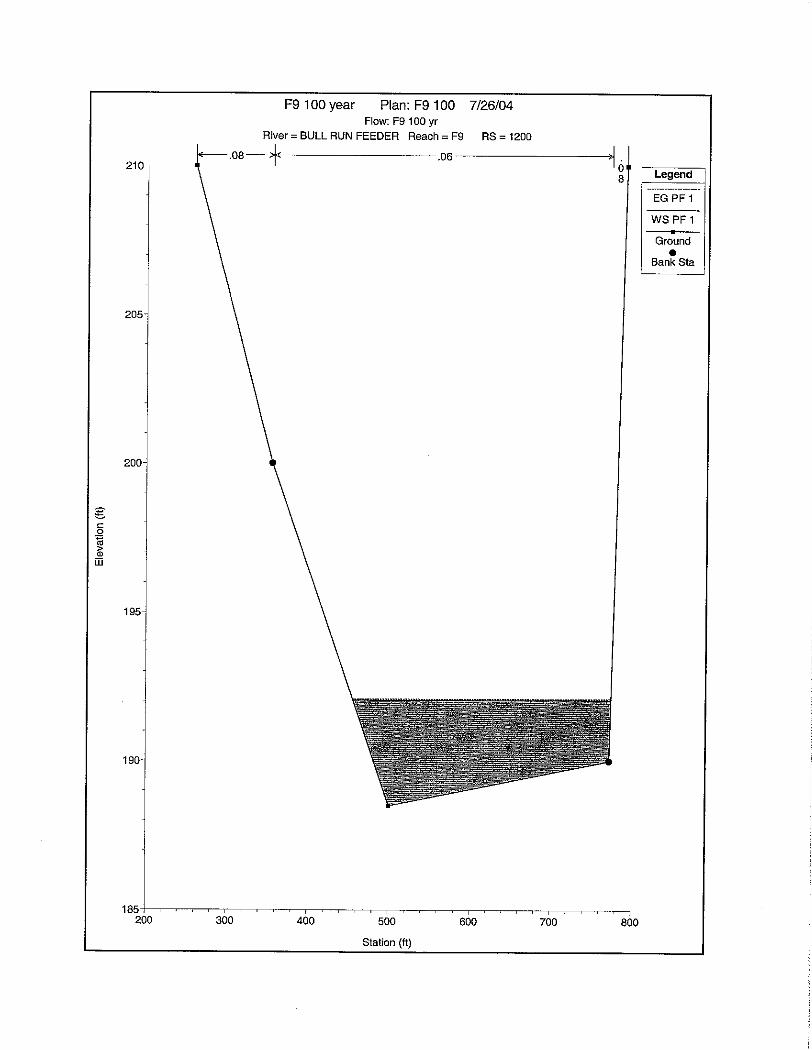
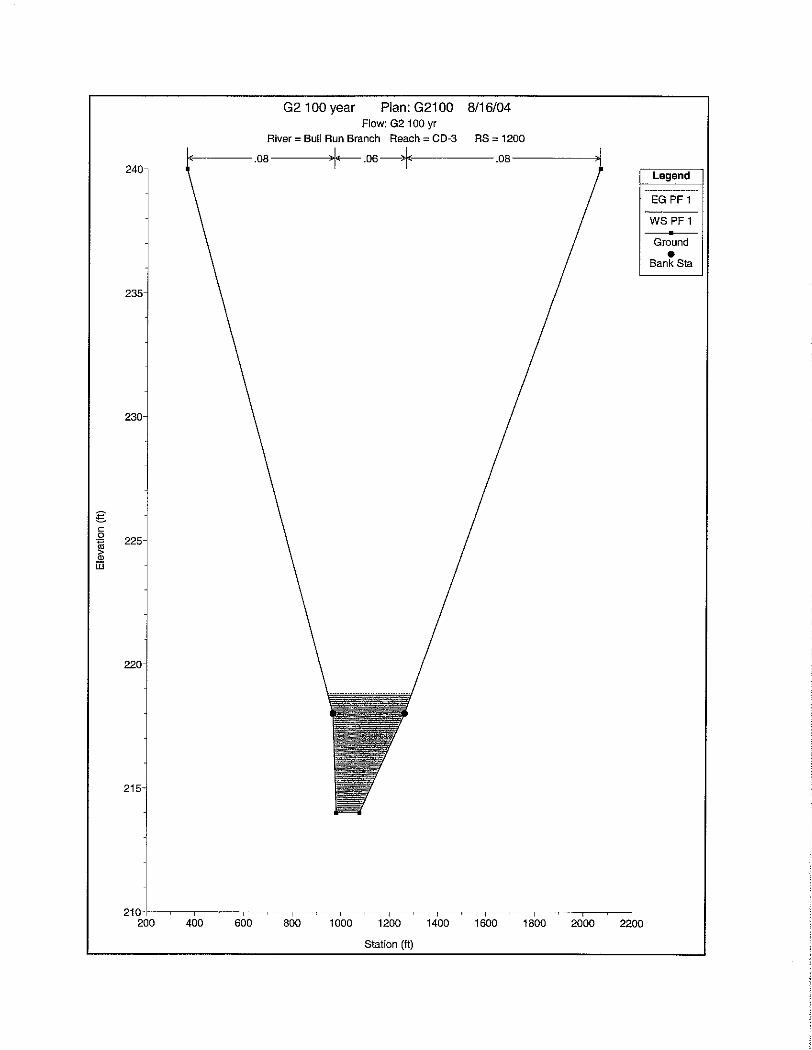
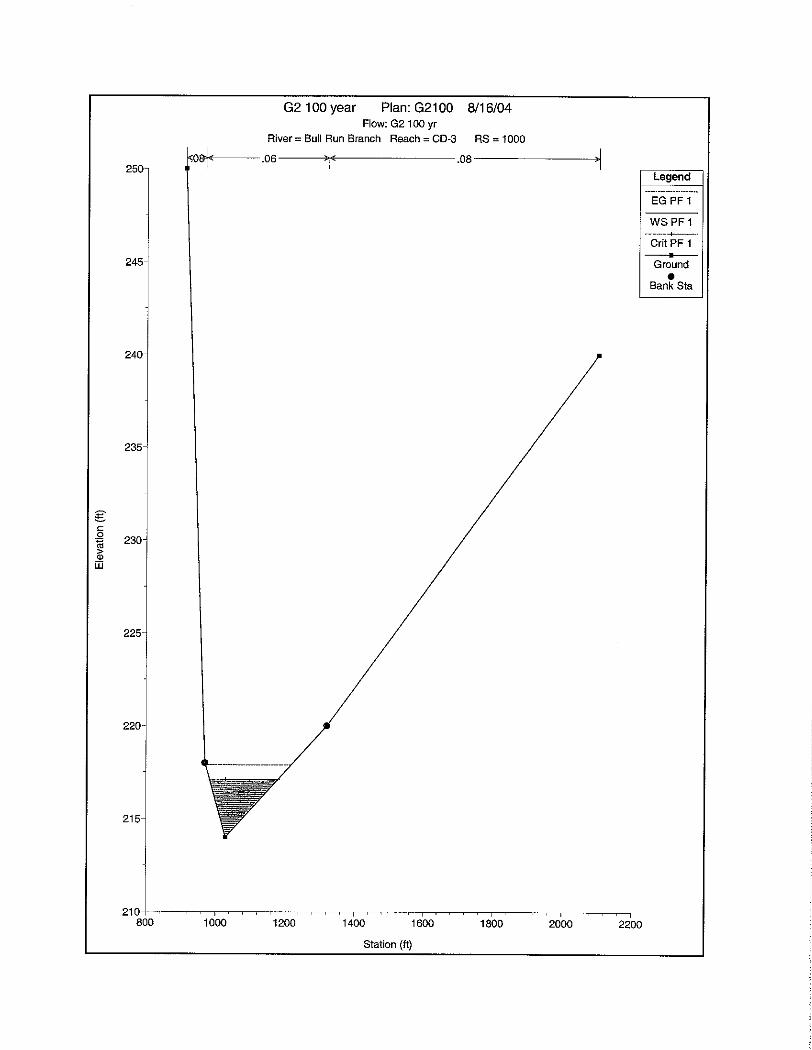
Hydraulic analysis to determine the water surface profile and bridge impact was conducted only on those Major Drainage Facilities in floodplains. HECRAS was used for the reach at the bridge site. Cross-sections were taken 100 feet and 300 feet below and above the bridge, and the cross-sections shown by the bridge and road projects were used for the bridge cross-sections. Using the starting elevations at the most downstream cross-section, the water surface profile was run to determine the effect of the bridge embankment and piers on the upstream elevations. With the accuracy of the basic data, the relative changes in downstream and upstream water surface elevation were used to determine effect. The VDOT Drainage Manual criteria states:
12.3.2.4 Backwater/Increases Over Existing Conditions Designers shall conform to FEMA regulations for sites covered by the National Flood Insurance Program (NFIP). It is the Department’s policy not to allow any increase in the level of the 1 percent flood for delineated floodplains established under the NFIP and for the increase to not exceed one foot during the passage of the 1 percent flood for sites not covered by NFIP.
12.3.2.5 Clearance Where practical a minimum clearance of one foot should be provided between the design approach water surface elevation and the low chord of the bridge for the design flood. Where this is not practicable, the bridge designer should establish the clearance based on the desired level of protection.

3-8 Hydrology & Hydraulics Technical Report
12.3.2.6 Flow Distribution The conveyance of the proposed stream crossing should be calculated to determine the flow distribution and to establish the location of bridge opening(s). The proposed facility should not cause any significant change in the existing flow distribution. Relief openings in the approach roadway embankment or other appropriate measures should be investigated if there is more than a 10 percent redistribution of flow.
3.14.1 Backwater/Increases Over Existing Conditions
Designers are required to conform to FEMA regulations for sites covered by the National Flood Insurance Program (NFIP). It is VDOT’s policy not to allow any increase in the level of the one percent flood for delineated floodplains established under the NFIP and for the increase to not exceed one foot during the passage of the one percent flood for sites not covered by NFIP.
3.14.2 Clearance
Where practical, a minimum clearance of one foot should be provided between the design approach water surface elevation and the low chord of the bridge for the design flood. Where this is not practicable, the bridge designer should establish the clearance based on the desired level of protection.
3.14.3 Flow Distribution
The conveyance of the proposed stream crossing should be calculated to determine the flow distribution and to establish the location of bridge opening(s). The proposed facility should not cause any significant change in the existing flow distribution. Relief openings in the approach roadway embankment or other appropriate measures should be investigated if there is more than a ten percent redistribution of flow. In order to adhere to this criteria; it was determined procedurally that, if the upstream 100-foot cross-section location water surface elevation was computed to increase one foot or more with the bridge in place over the water surface profile without the bridge in place, it was considered significant and the bridge width between abutments would be increased in 25-foot increments and the water surface profile re-computed until the change in water surface elevation between upstream and downstream at the 100-foot upstream and downstream cross-section was reduced to 0.5 foot. If the increase was less than one foot at the upstream 100-foot cross-section and less than 0.5 foot at the 300-foot upstream cross-section, it was considered insignificant. If the increase was less than one foot at the upstream cross-section, but greater than 0.5 foot at the 300-foot cross-section, bridge width was adjusted in 25-foot increments until the 100-foot cross-section elevation did not increase more than 0.5 foot. When the bridge crosses a lake, the hydraulic analysis was not conducted, since the impact would be insignificant hydraulically. Where the bridge is located in a floodplain parallel to the stream, the hydraulic analysis was deferred to a future level of design to more definitively determine the pier type, location, and orientation. Table 3.15-1 shows the preliminary results of the analysis
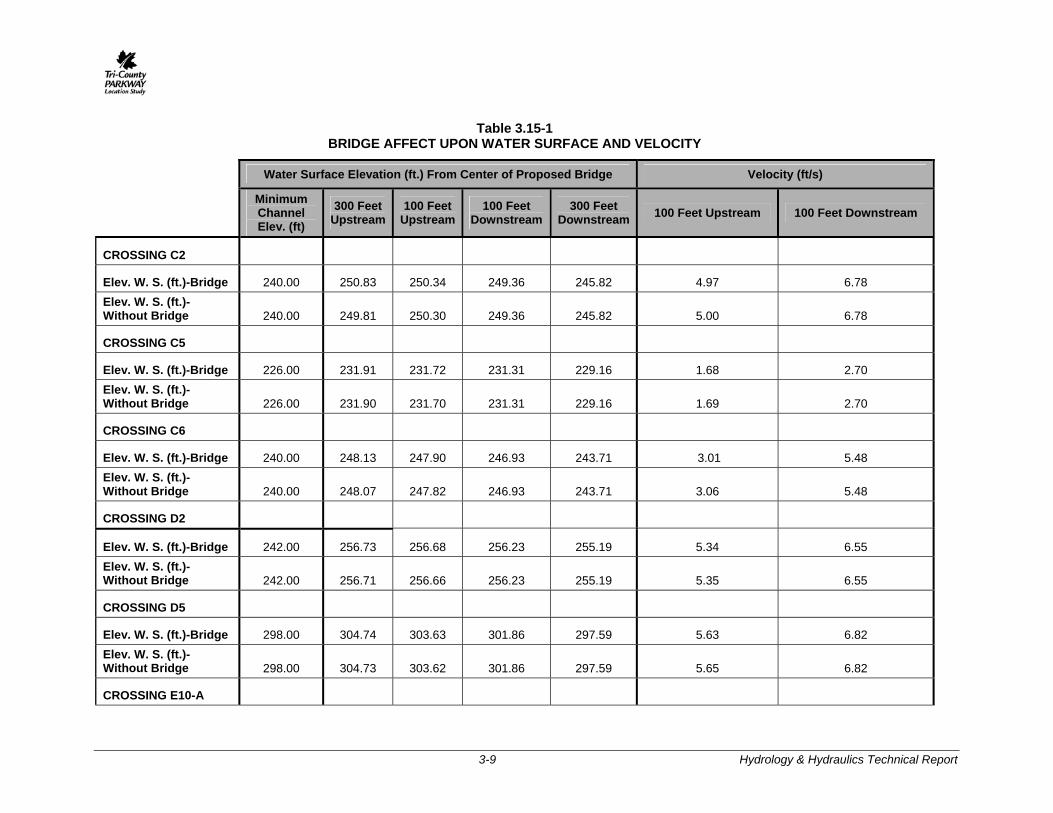
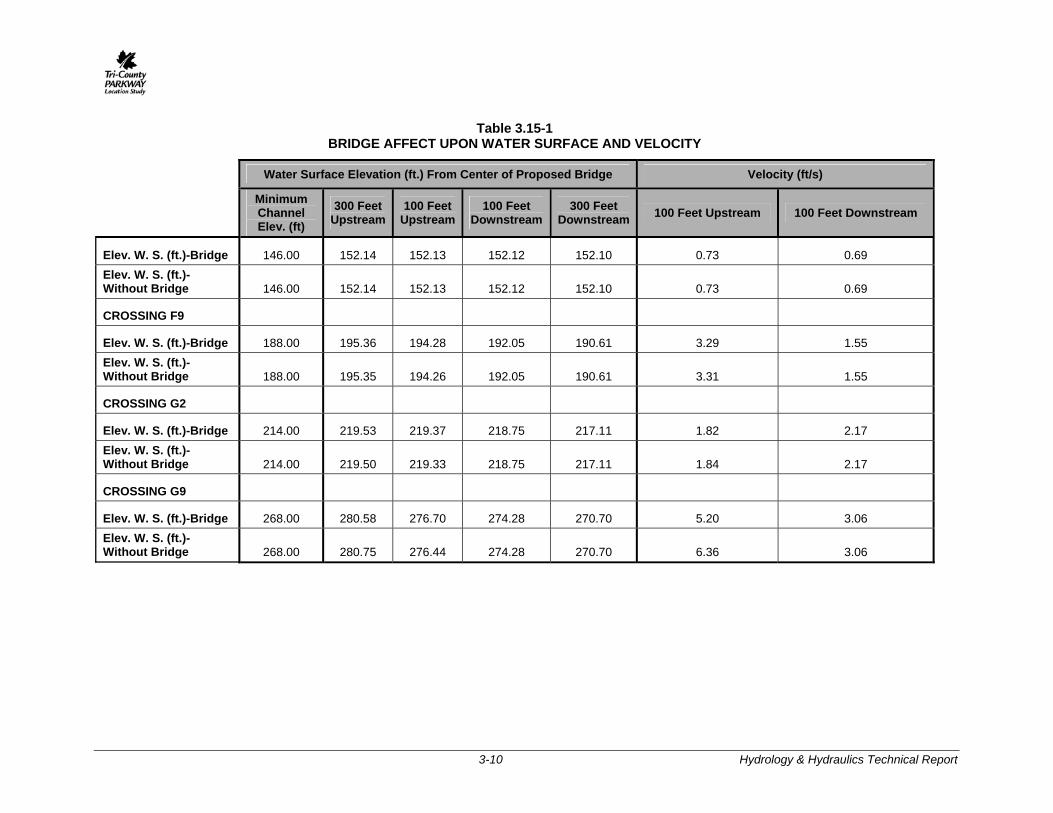
3.15 PRELIMINARY DETERMINATIONS
The hydraulic analysis of each bridge is shown in Table 3.15-1. Table 3.15-1 shows the bridge and the downstream and upstream water surface elevations with and without the bridge being in place. The plan, cross-sections, and profiles are available for each bridge in the appendix. Table 3.15-1 also shows the bridge and the velocity through the bridge section.
The preliminary determination shows no significant impact on the water surface profiles due to the preliminary bridge cross-sections.
3-9 Hydrology & Hydraulics Technical Report
Table 3.15-1 BRIDGE AFFECT UPON WATER SURFACE AND VELOCITY
Water Surface Elevation (ft.) From Center of Proposed Bridge Velocity (ft/s)
Minimum Channel Elev. (ft)
300 Feet Upstream
100 Feet Upstream
100 Feet Downstream
300 Feet Downstream 100 Feet Upstream 100 Feet Downstream
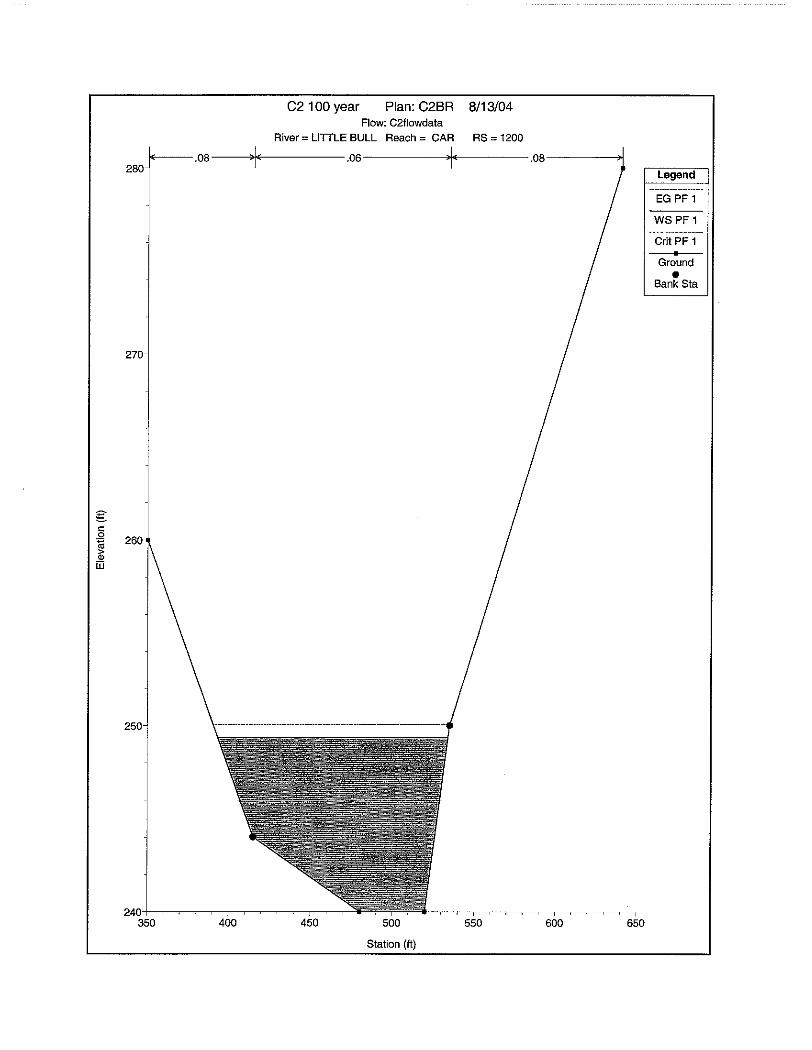
CROSSING C2
Elev. W. S. (ft.)-Bridge 240.00 250.83 250.34 249.36 245.82 4.97 6.78 Elev. W. S. (ft.)-Without Bridge 240.00 249.81 250.30 249.36 245.82 5.00 6.78
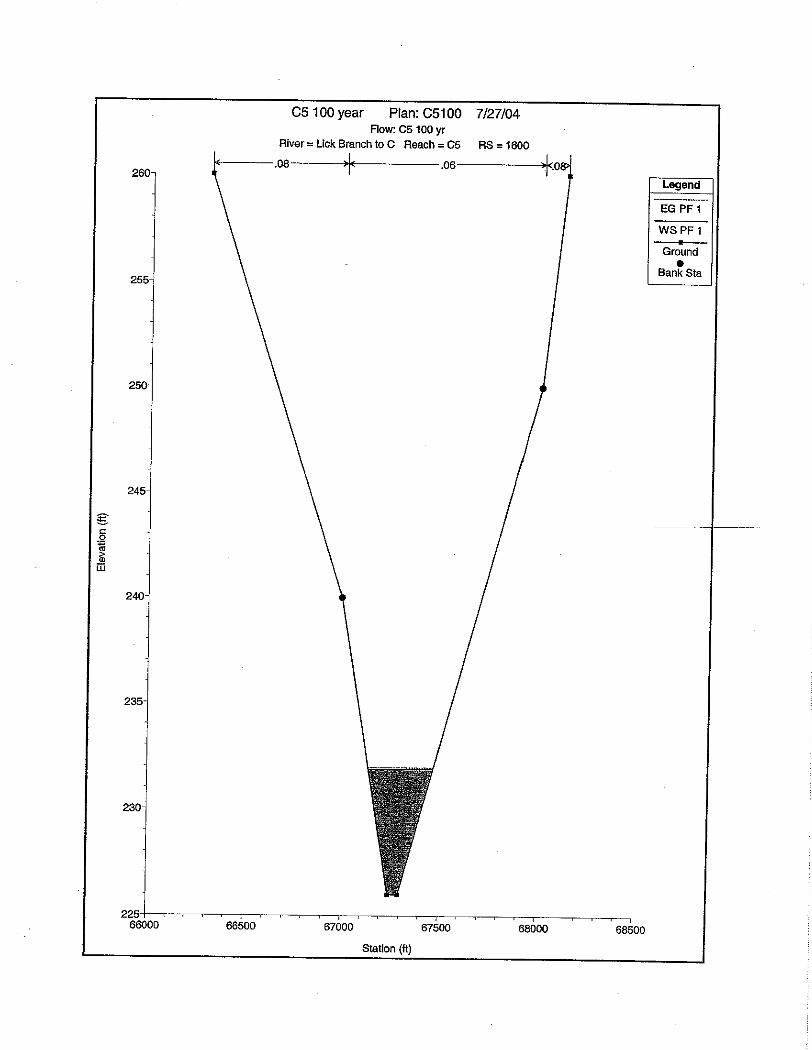
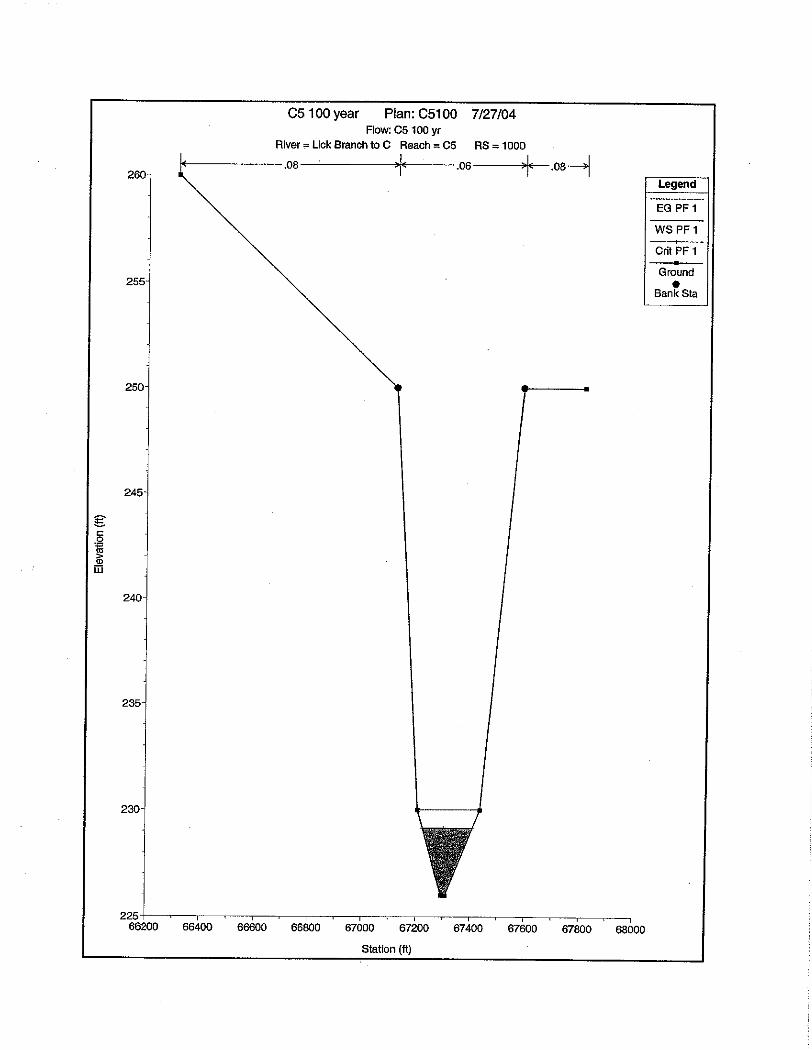
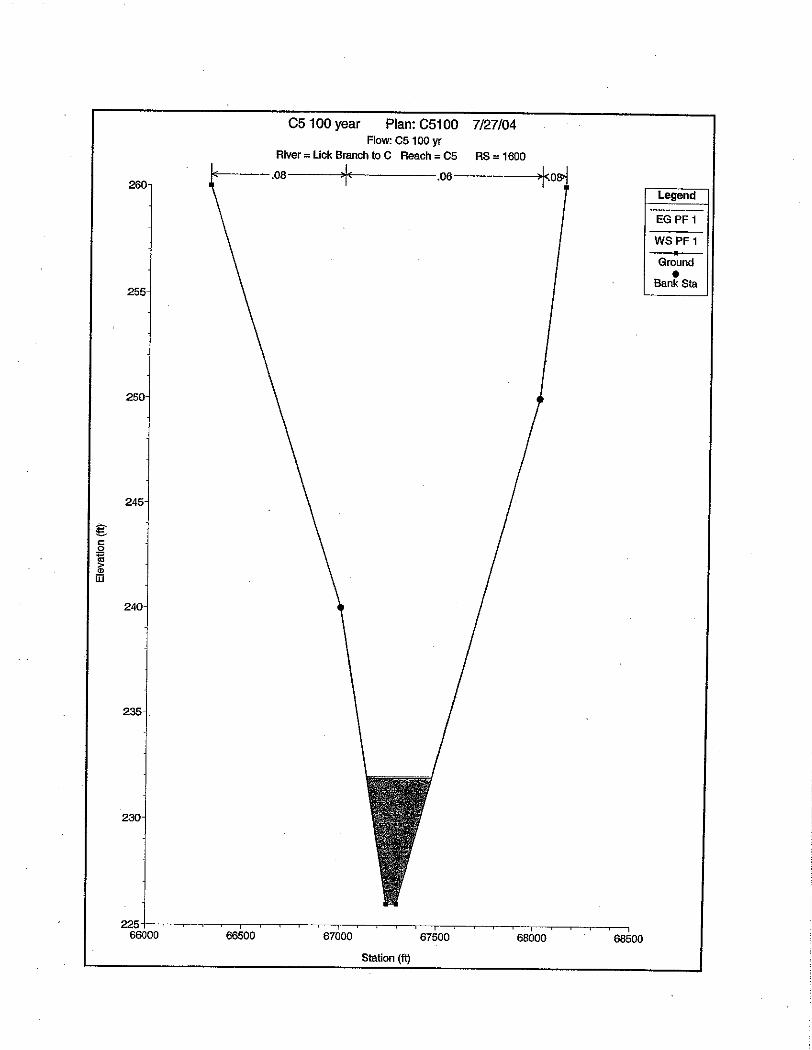
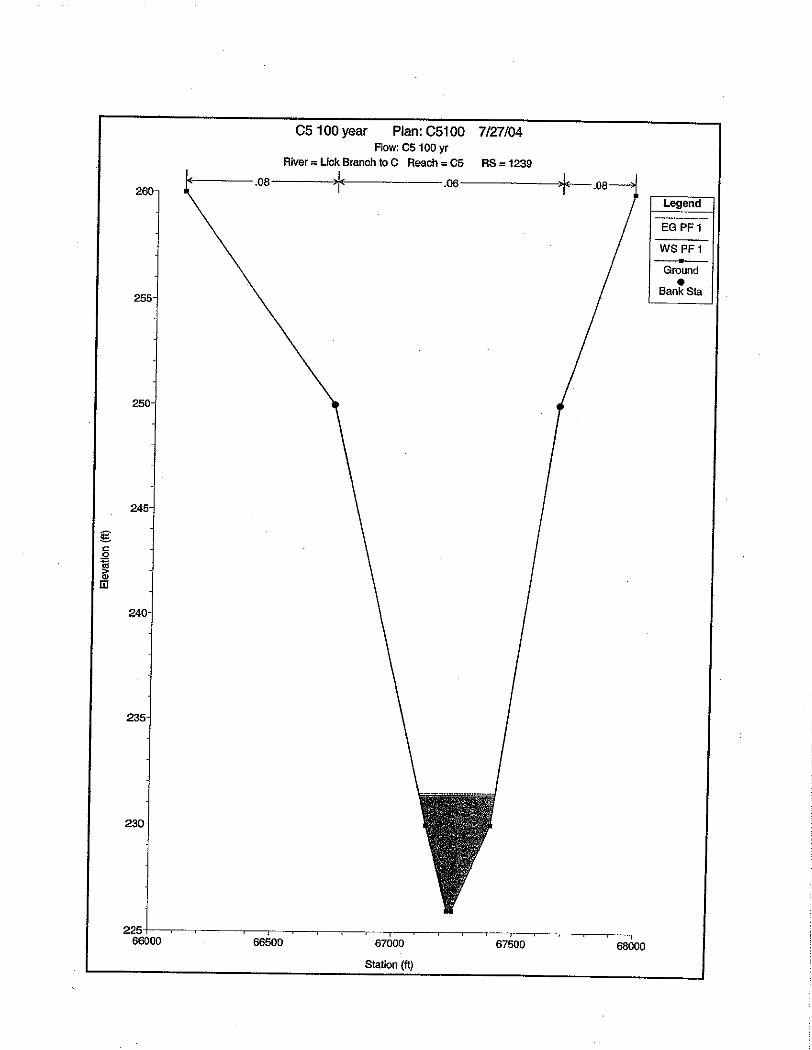
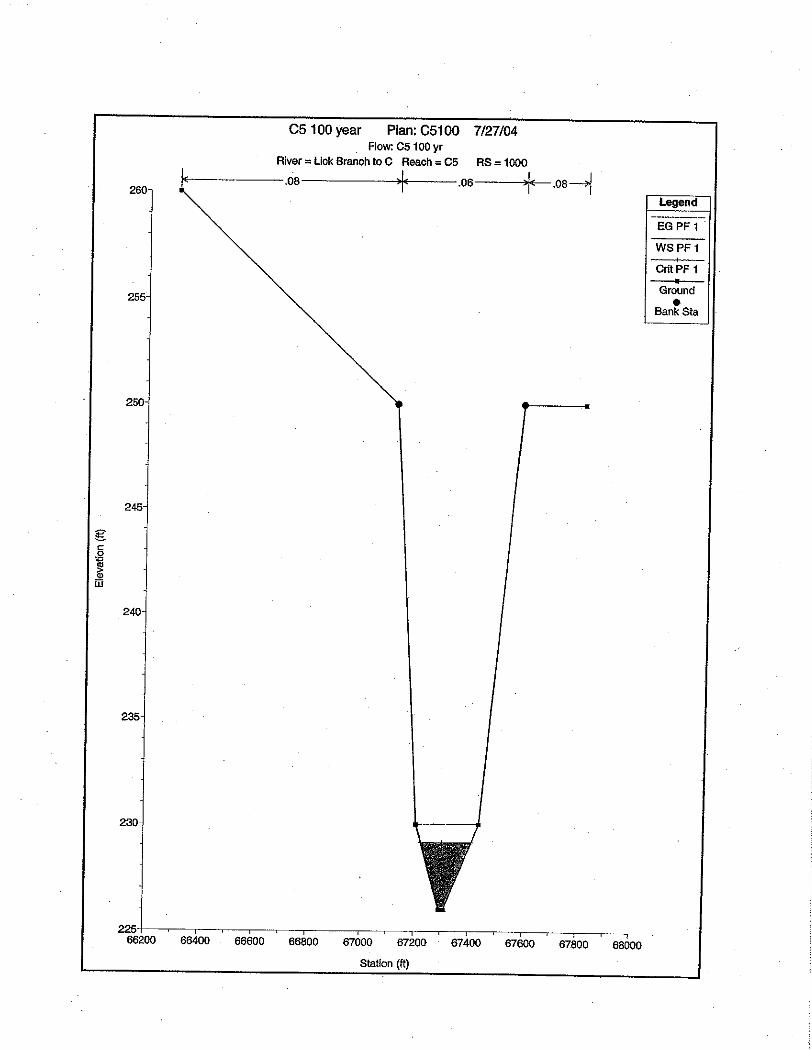
CROSSING C5
Elev. W. S. (ft.)-Bridge 226.00 231.91 231.72 231.31 229.16 1.68 2.70 Elev. W. S. (ft.)-Without Bridge 226.00 231.90 231.70 231.31 229.16 1.69 2.70
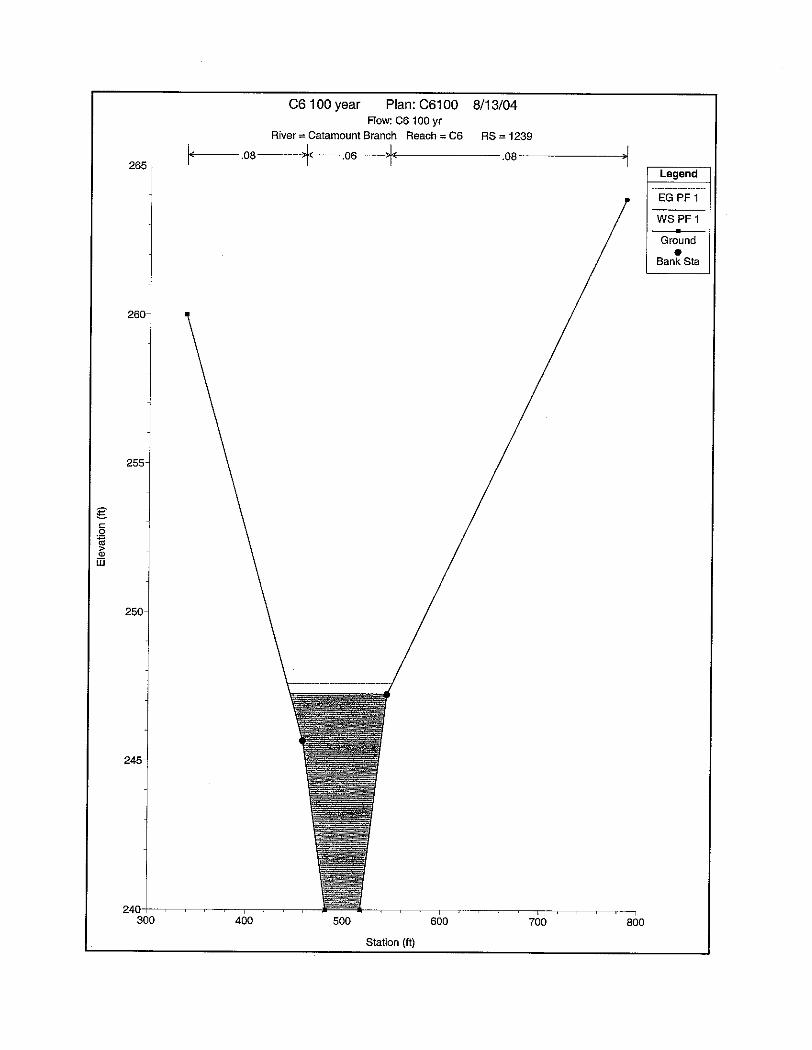
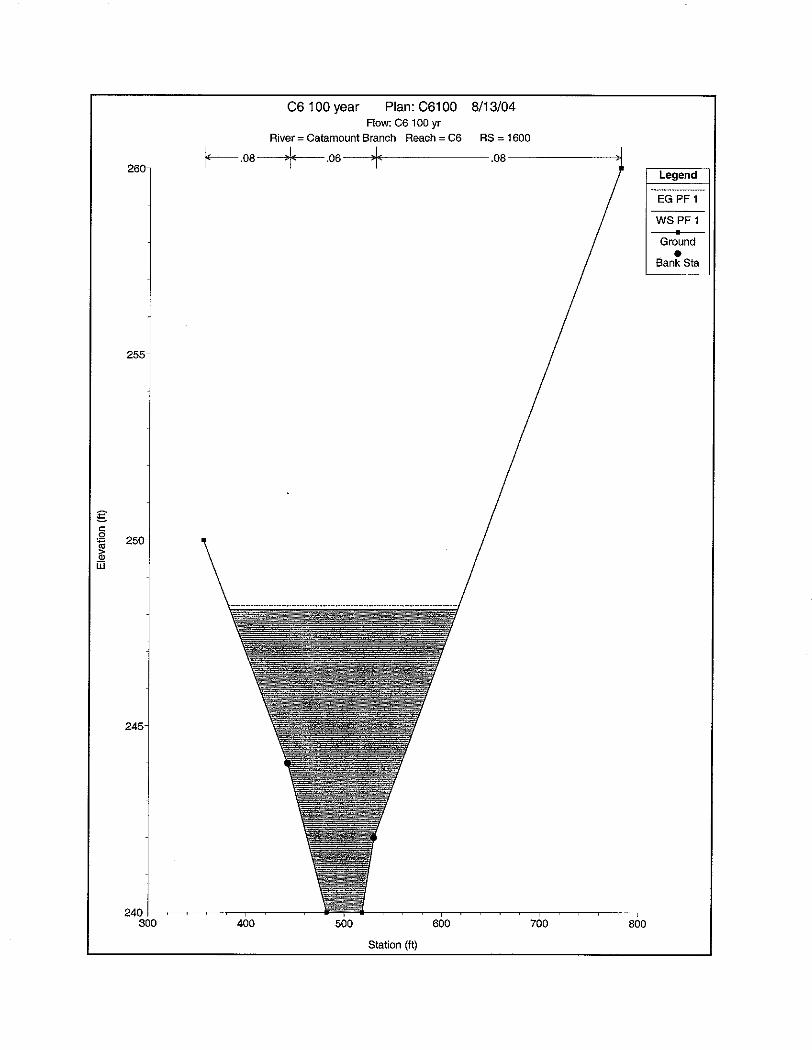
CROSSING C6
Elev. W. S. (ft.)-Bridge 240.00 248.13 247.90 246.93 243.71 3.01 5.48 Elev. W. S. (ft.)-Without Bridge 240.00 248.07 247.82 246.93 243.71 3.06 5.48
CROSSING D2
Elev. W. S. (ft.)-Bridge 242.00 256.73 256.68 256.23 255.19 5.34 6.55 Elev. W. S. (ft.)-Without Bridge 242.00 256.71 256.66 256.23 255.19 5.35 6.55
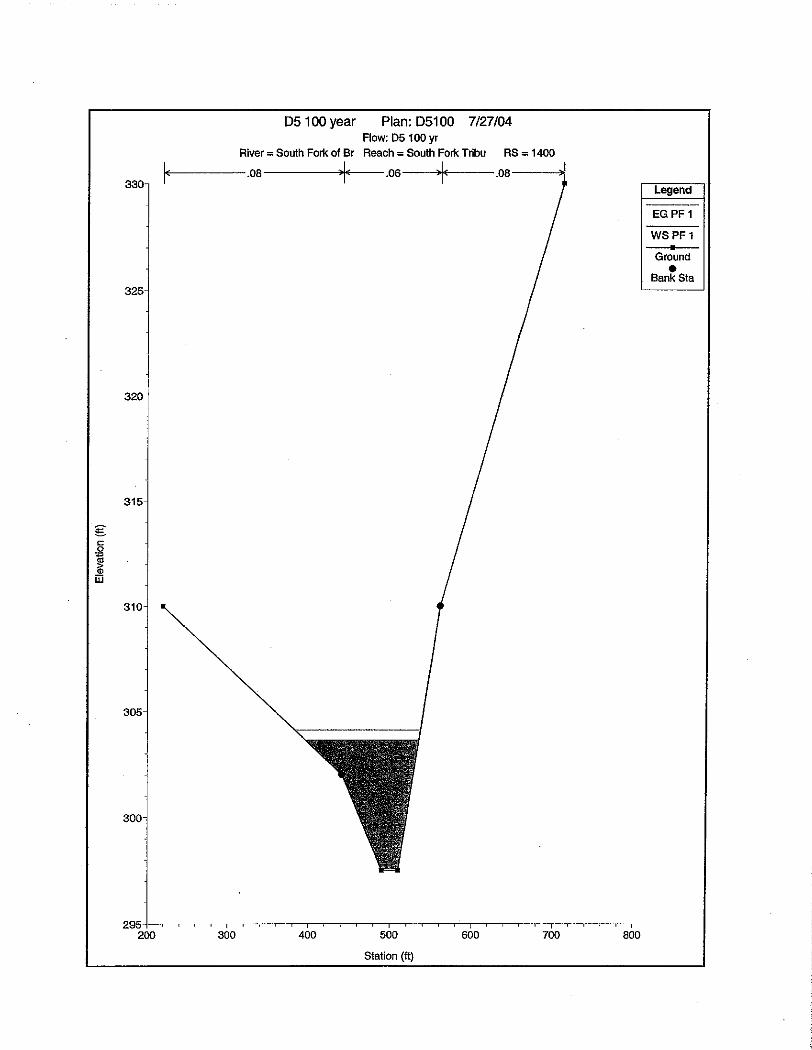
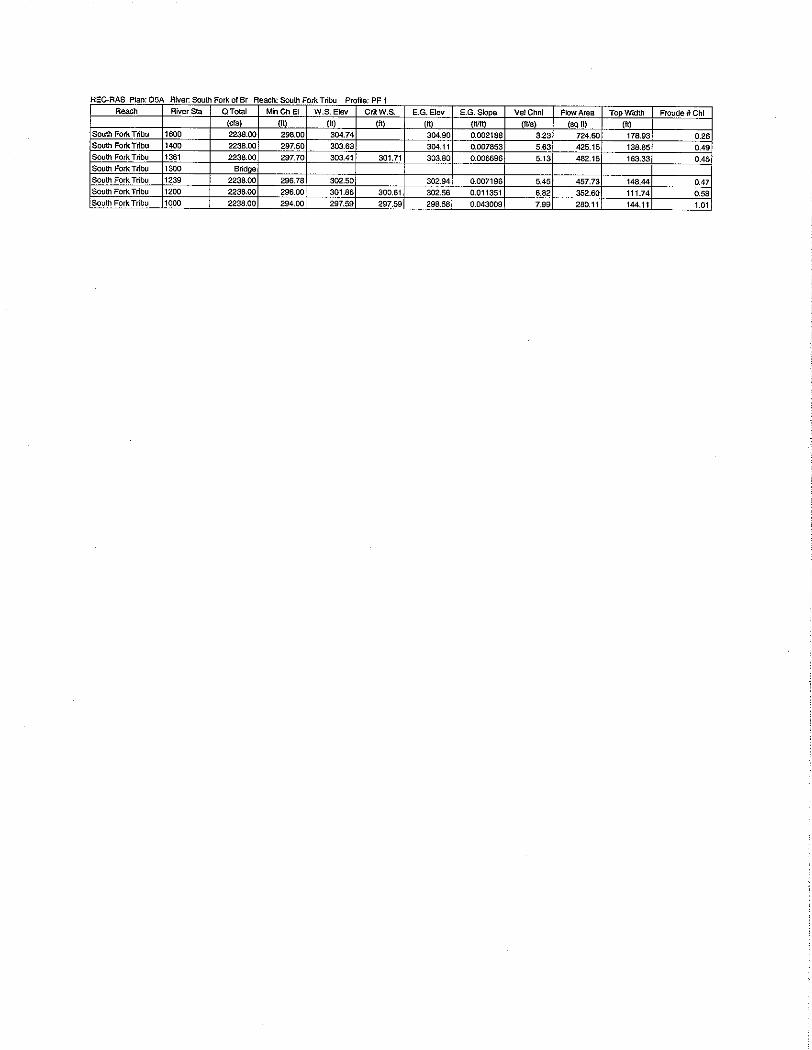
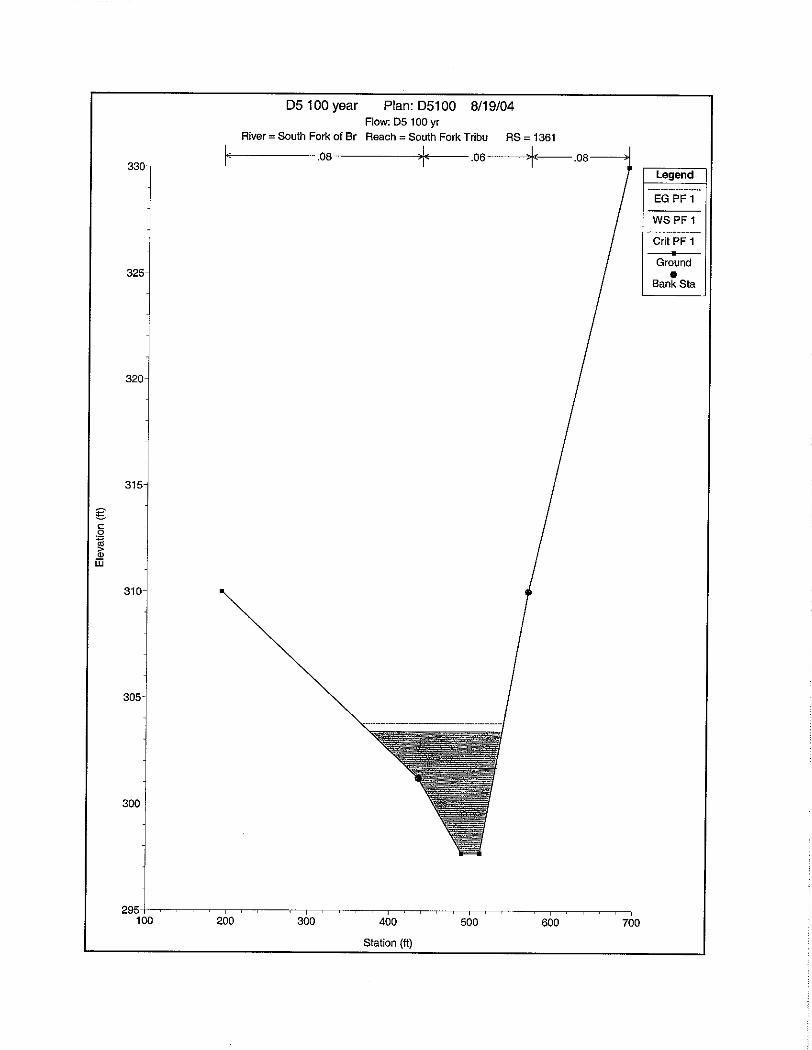
CROSSING D5
Elev. W. S. (ft.)-Bridge 298.00 304.74 303.63 301.86 297.59 5.63 6.82 Elev. W. S. (ft.)-Without Bridge 298.00 304.73 303.62 301.86 297.59 5.65 6.82
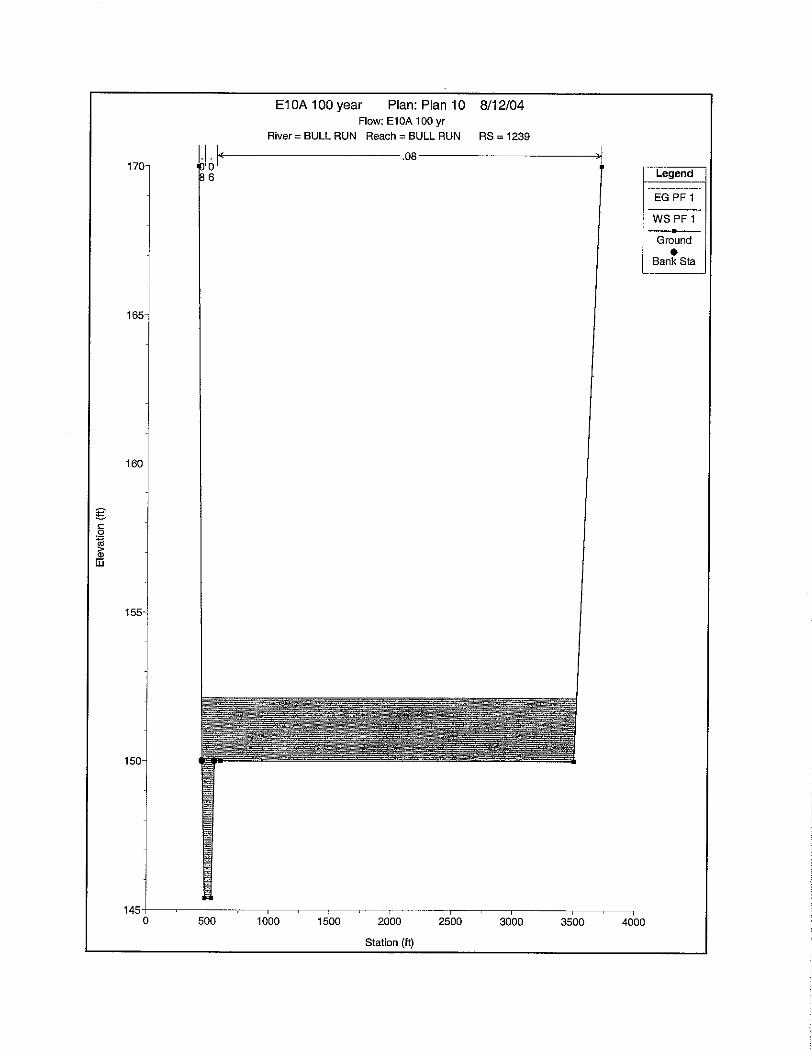
CROSSING E10-A
3-10 Hydrology & Hydraulics Technical Report
Table 3.15-1 BRIDGE AFFECT UPON WATER SURFACE AND VELOCITY
Water Surface Elevation (ft.) From Center of Proposed Bridge Velocity (ft/s)
Minimum Channel Elev. (ft)
300 Feet Upstream
100 Feet Upstream
100 Feet Downstream
300 Feet Downstream 100 Feet Upstream 100 Feet Downstream
Elev. W. S. (ft.)-Bridge 146.00 152.14 152.13 152.12 152.10 0.73 0.69 Elev. W. S. (ft.)-Without Bridge 146.00 152.14 152.13 152.12 152.10 0.73 0.69
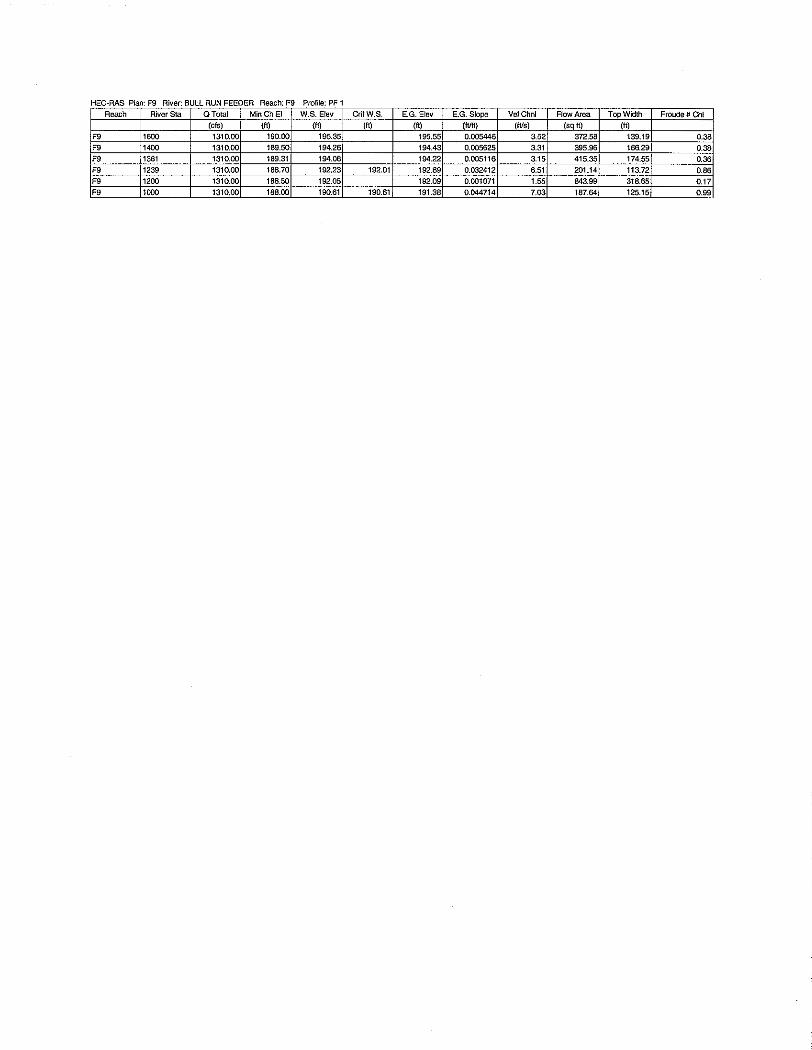
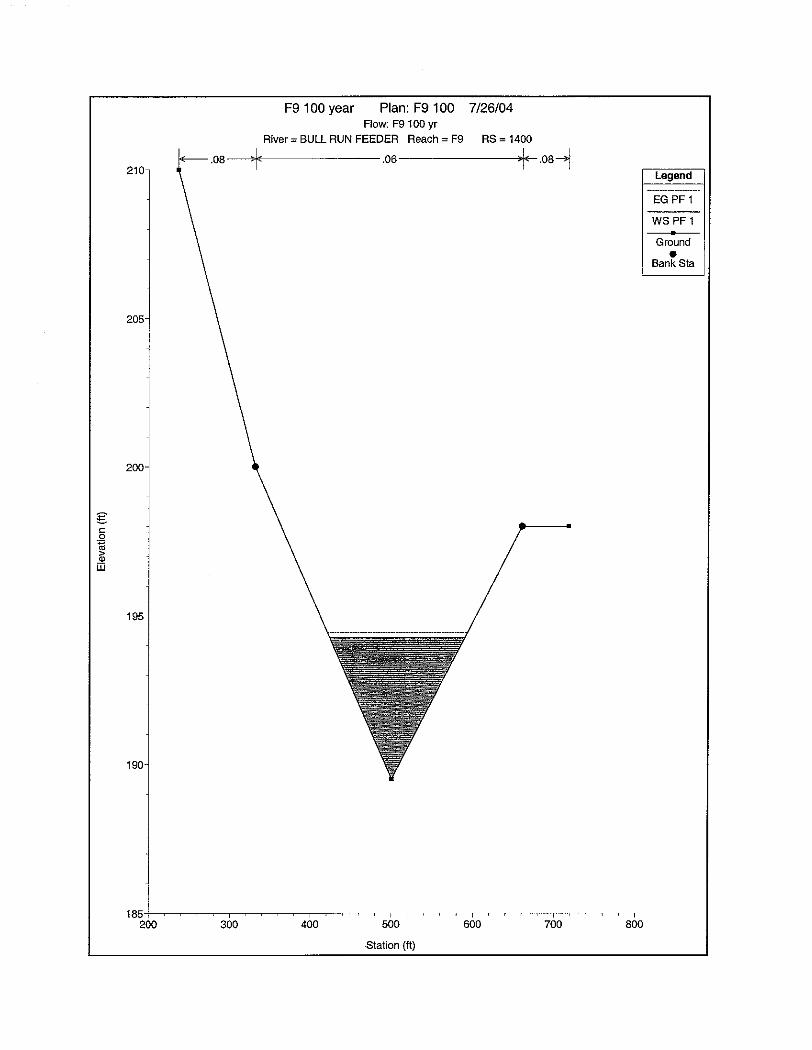
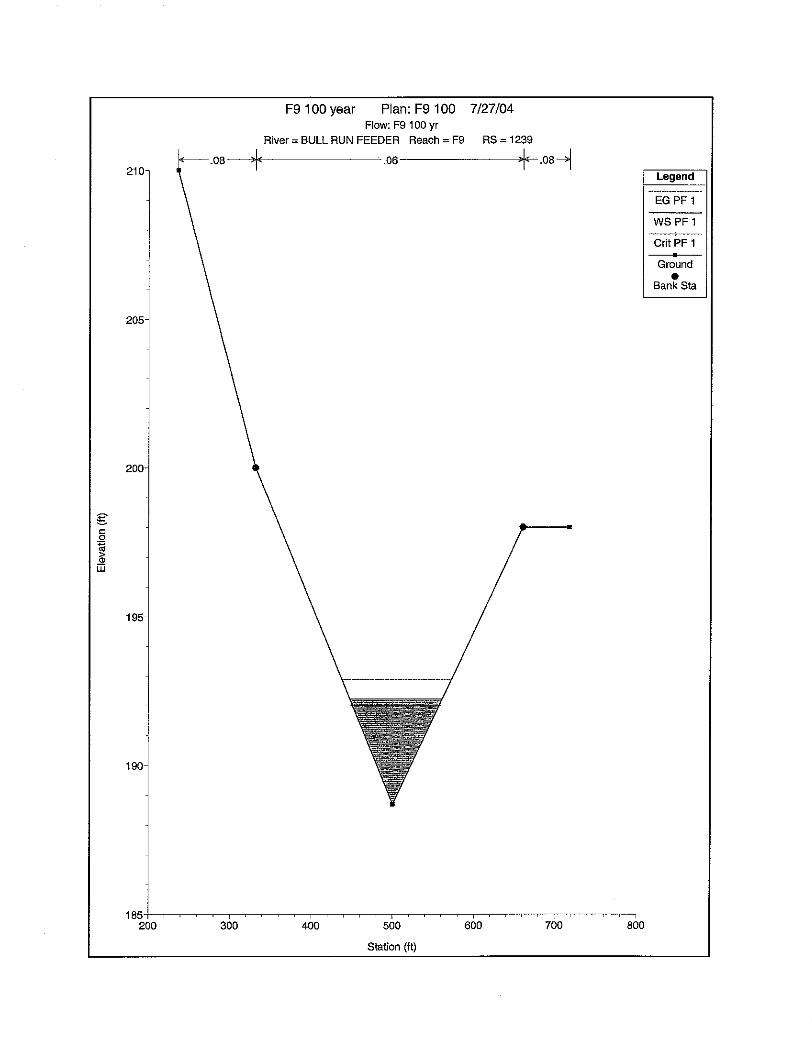
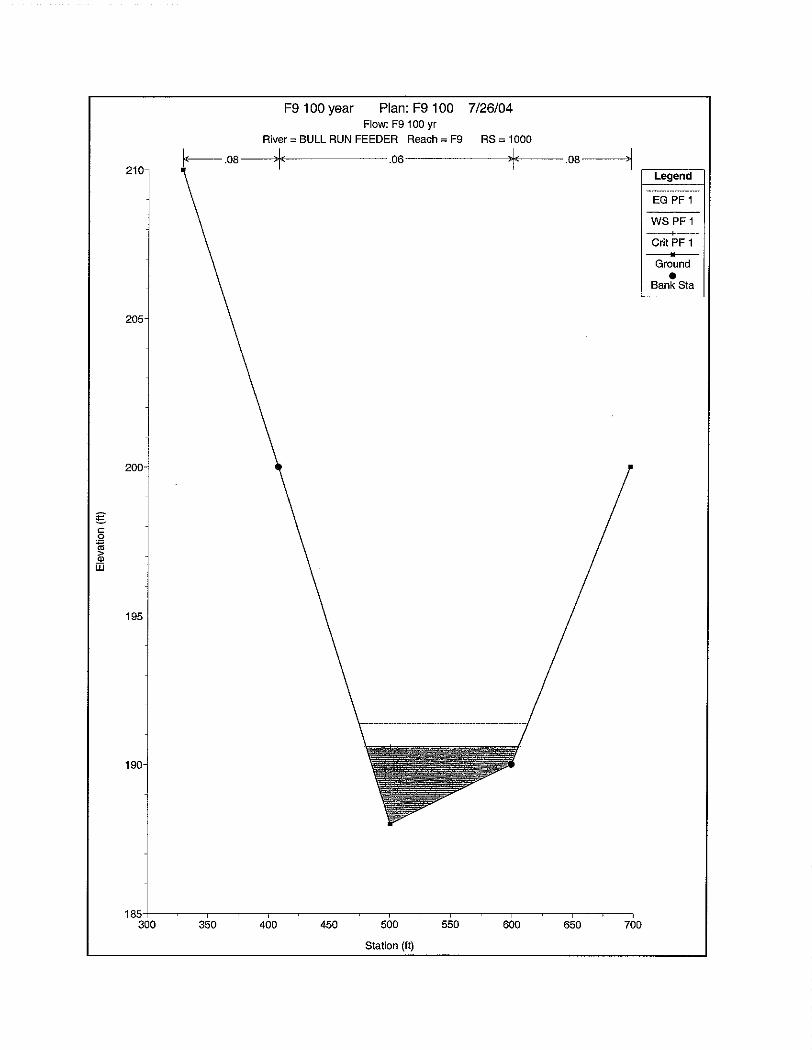
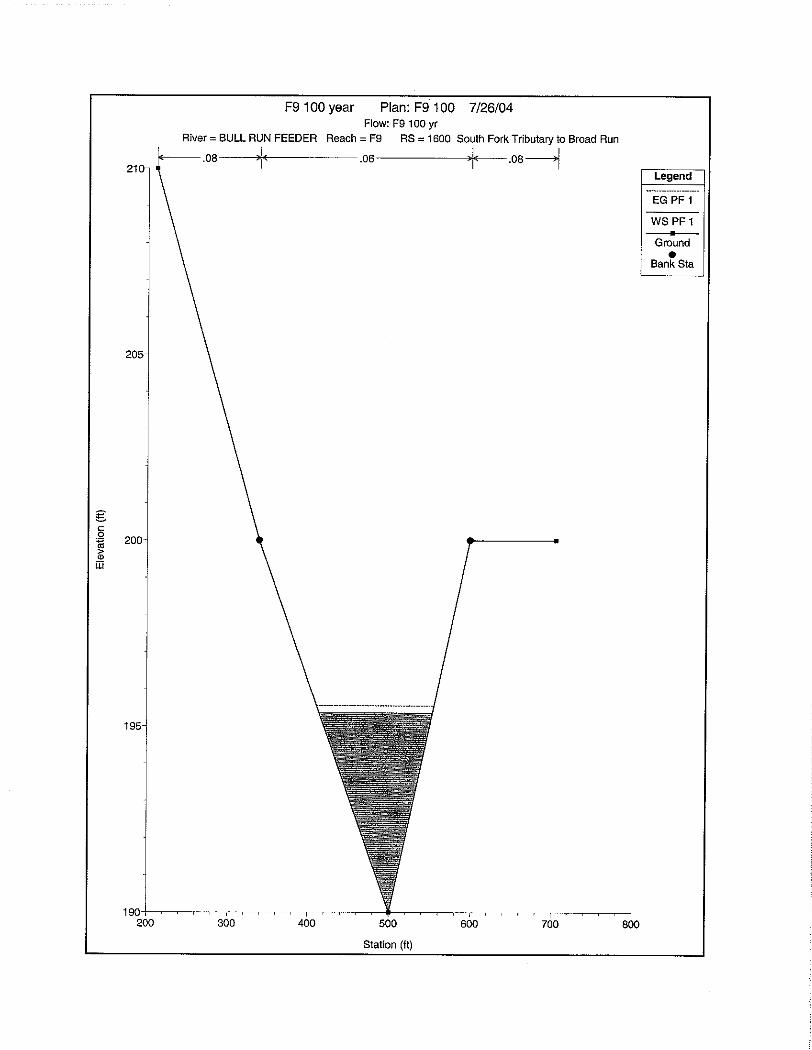
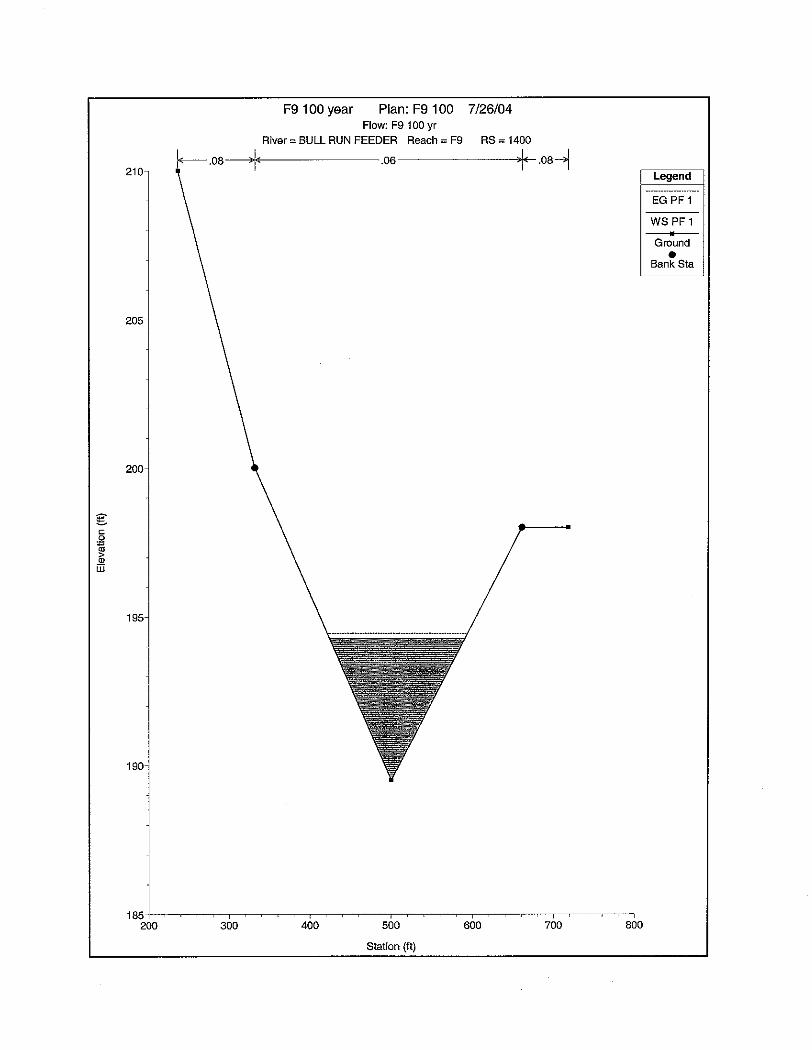
CROSSING F9
Elev. W. S. (ft.)-Bridge 188.00 195.36 194.28 192.05 190.61 3.29 1.55 Elev. W. S. (ft.)-Without Bridge 188.00 195.35 194.26 192.05 190.61 3.31 1.55
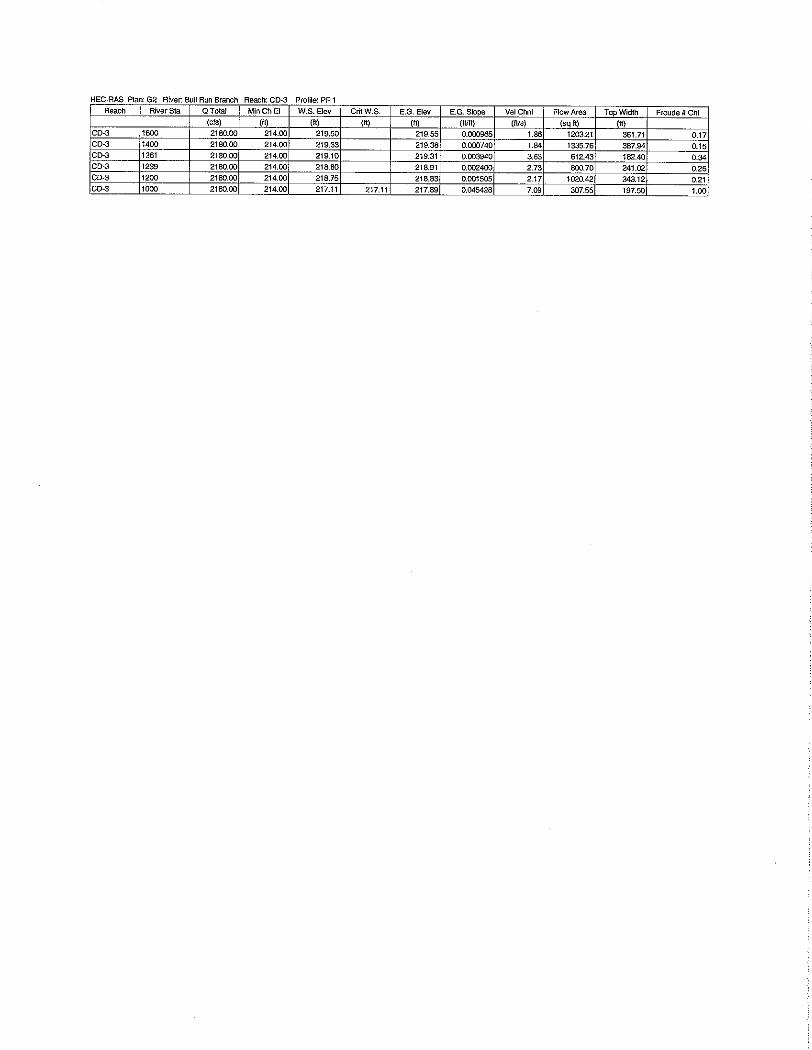
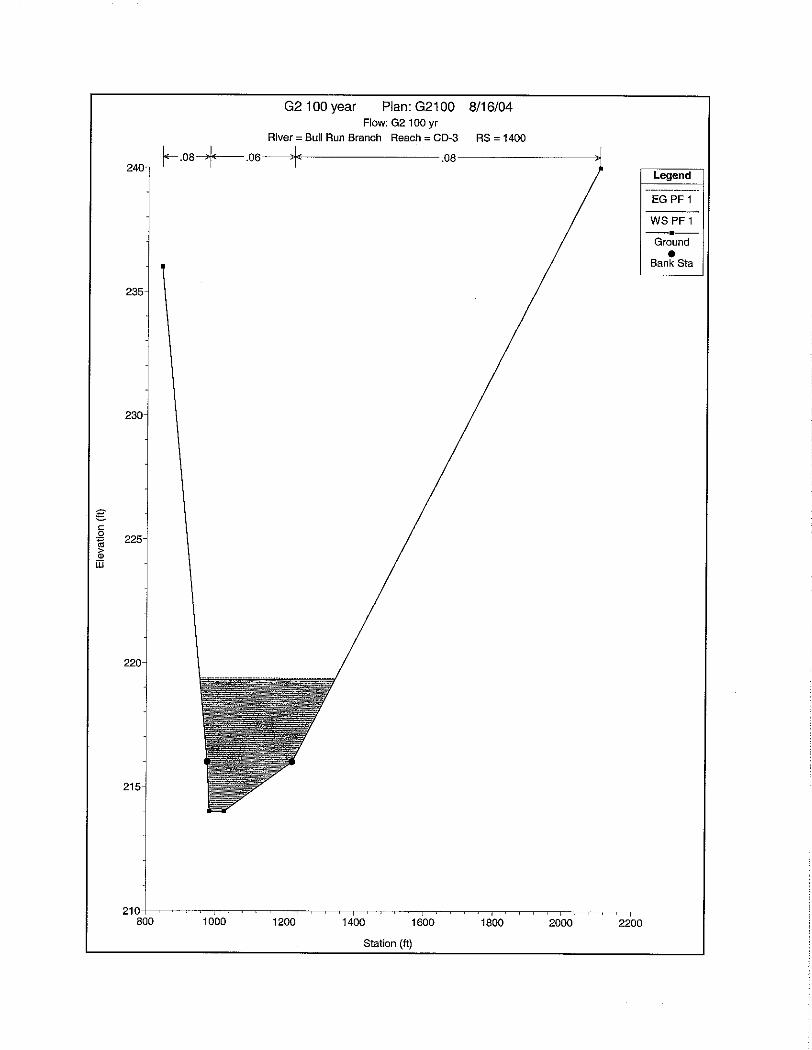
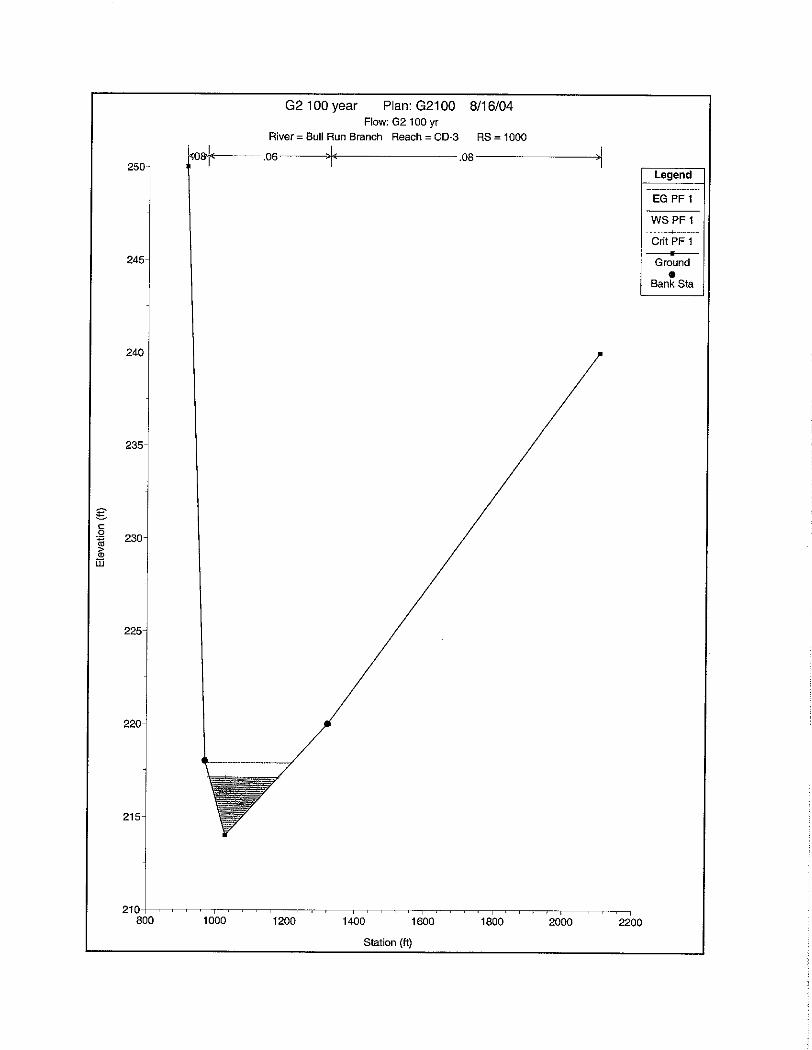
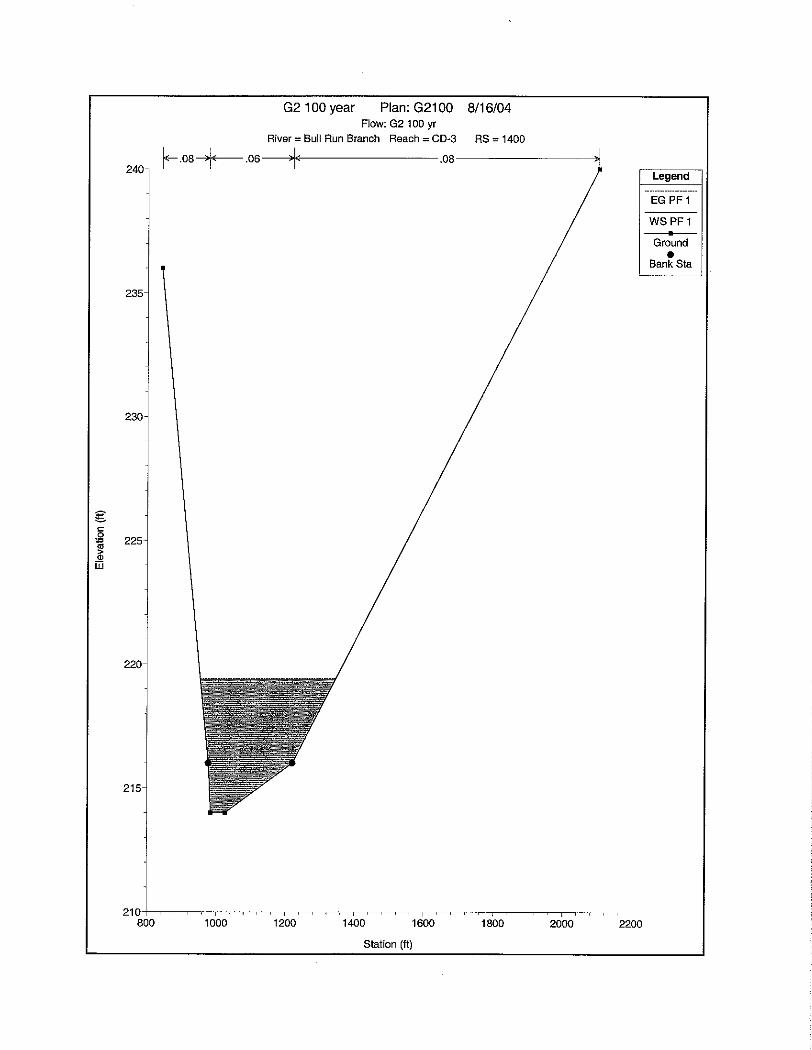
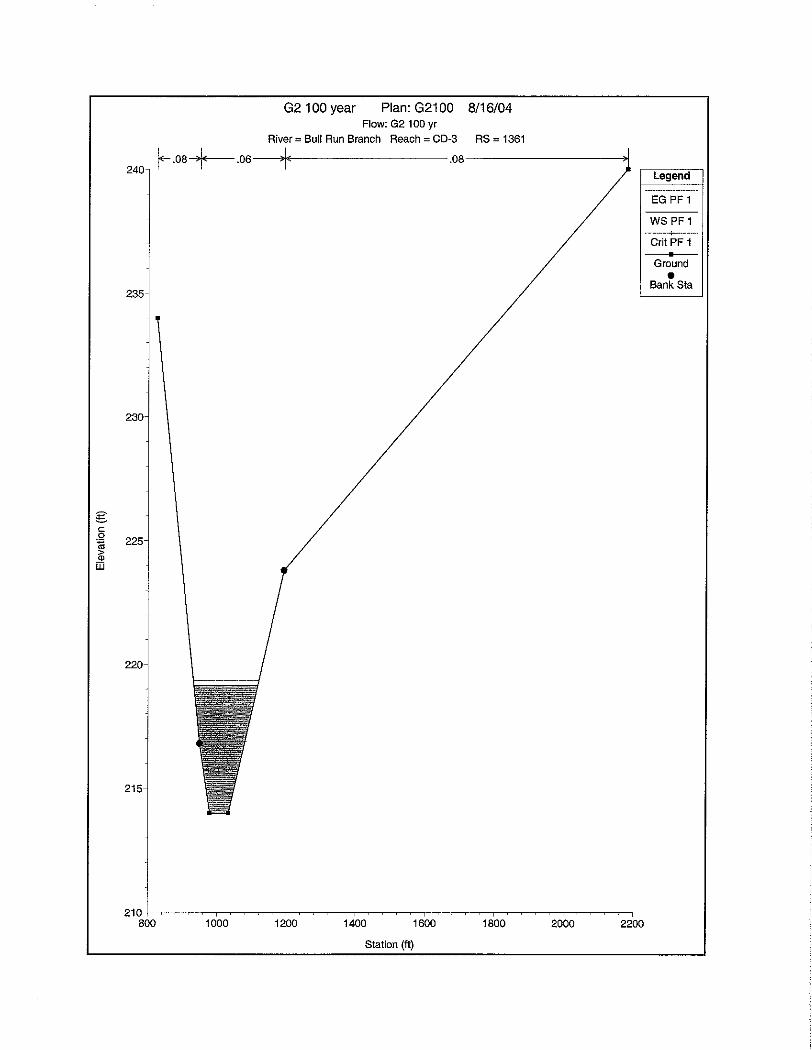
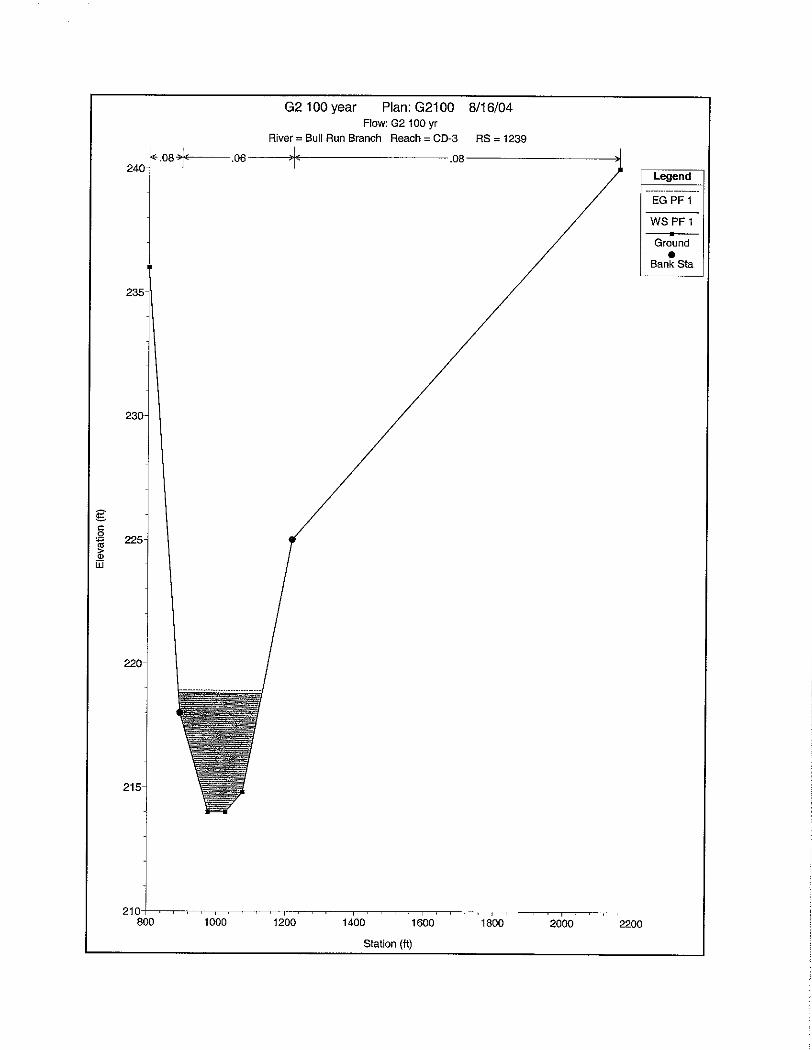
CROSSING G2
Elev. W. S. (ft.)-Bridge 214.00 219.53 219.37 218.75 217.11 1.82 2.17 Elev. W. S. (ft.)-Without Bridge 214.00 219.50 219.33 218.75 217.11 1.84 2.17
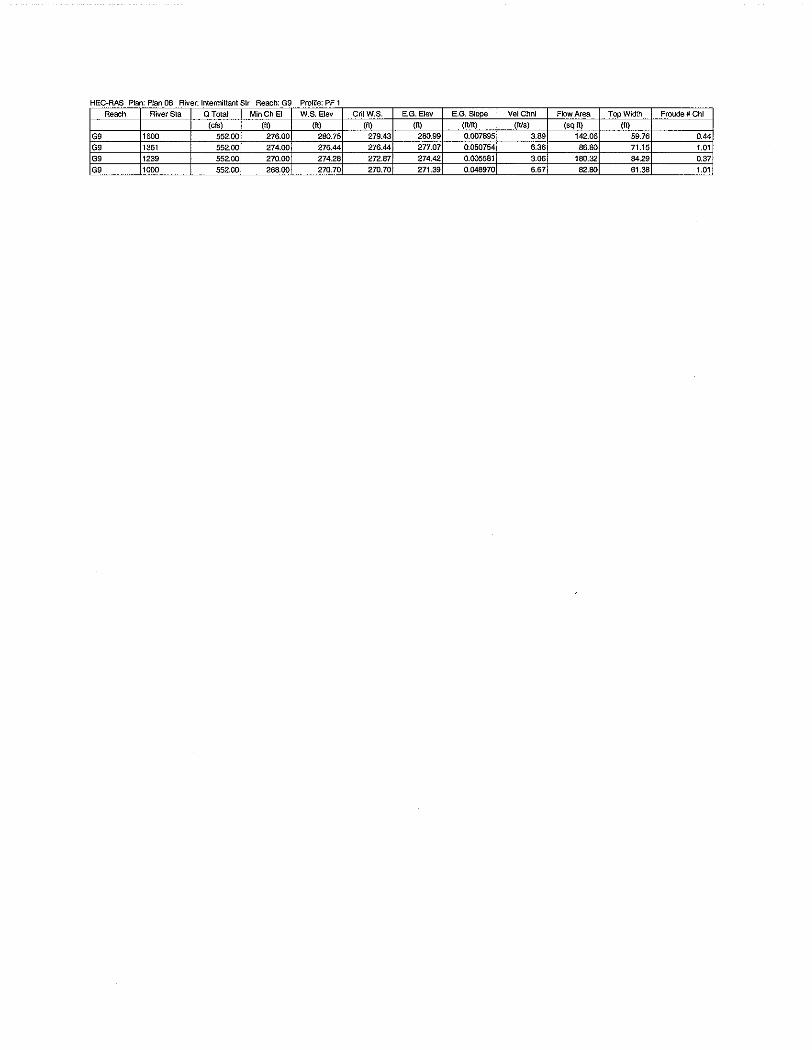
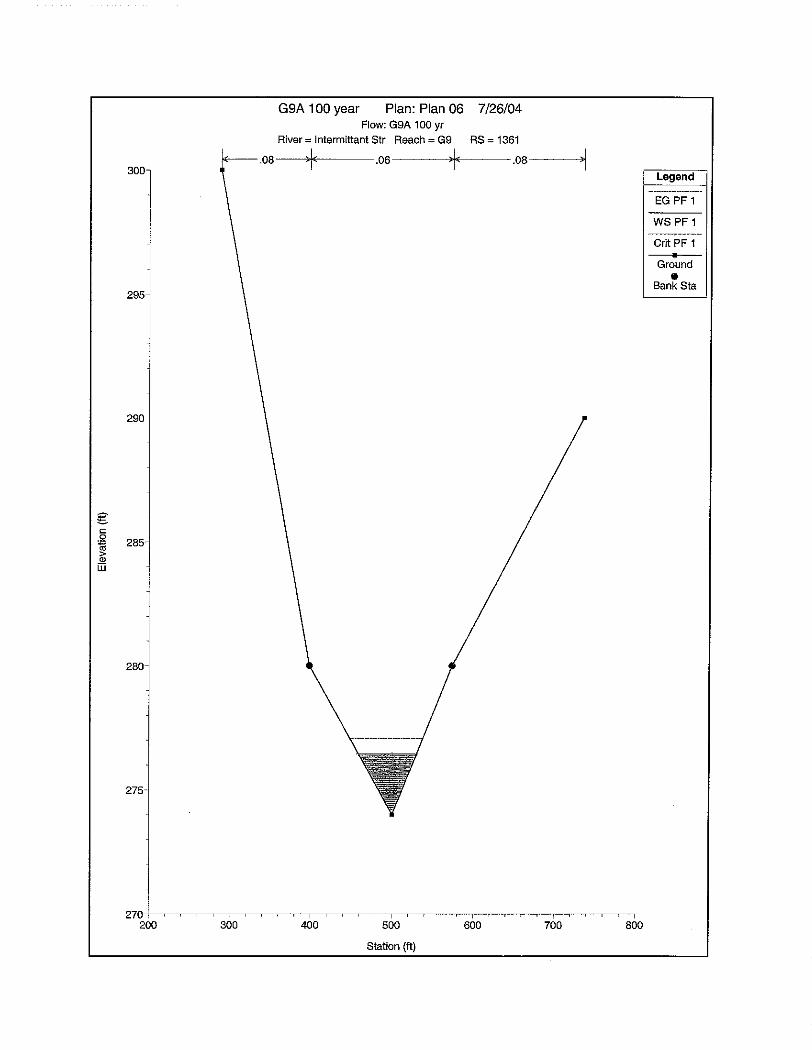
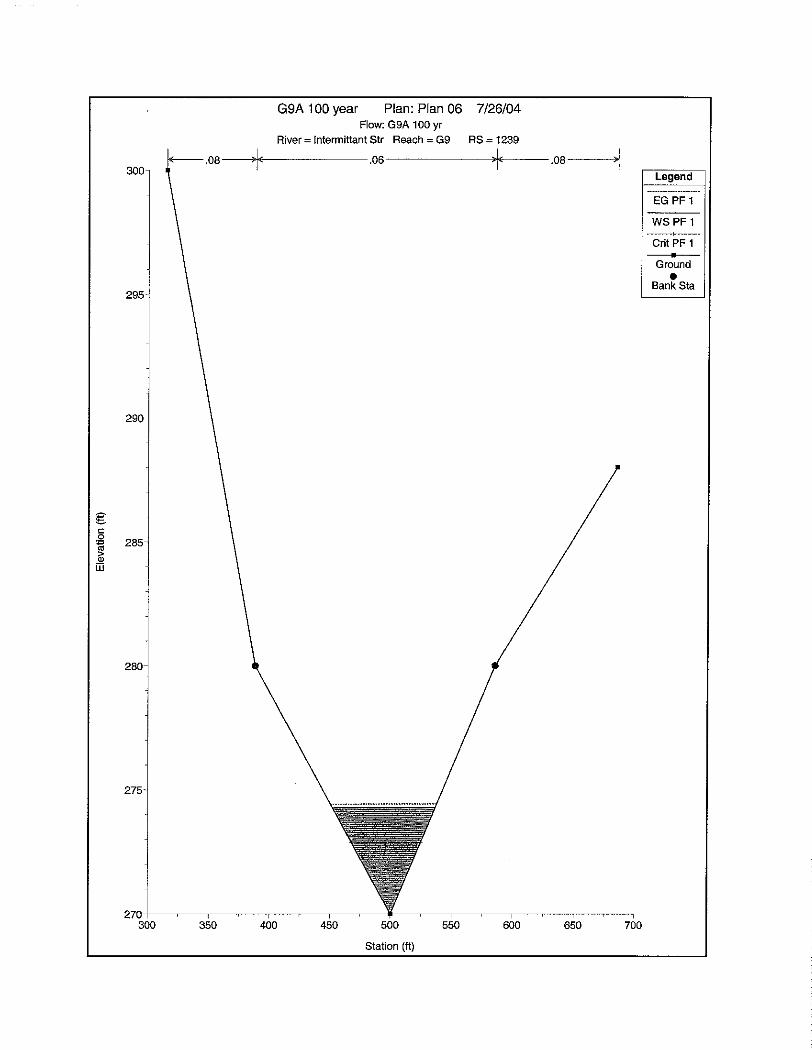
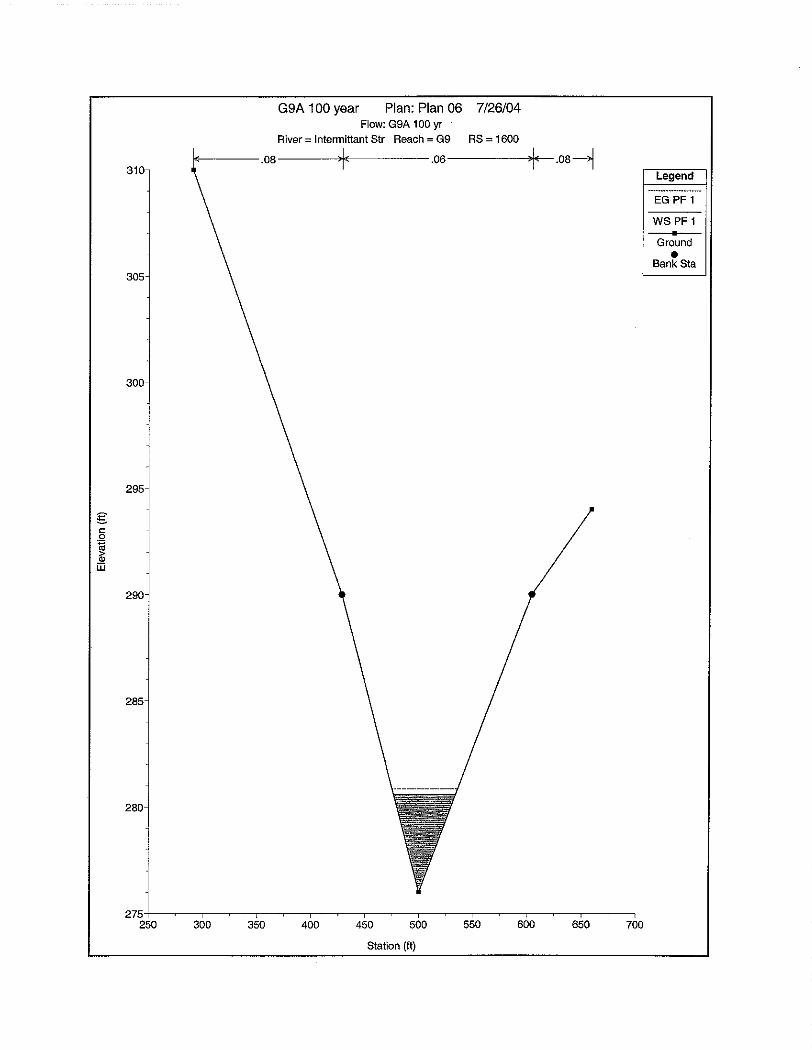
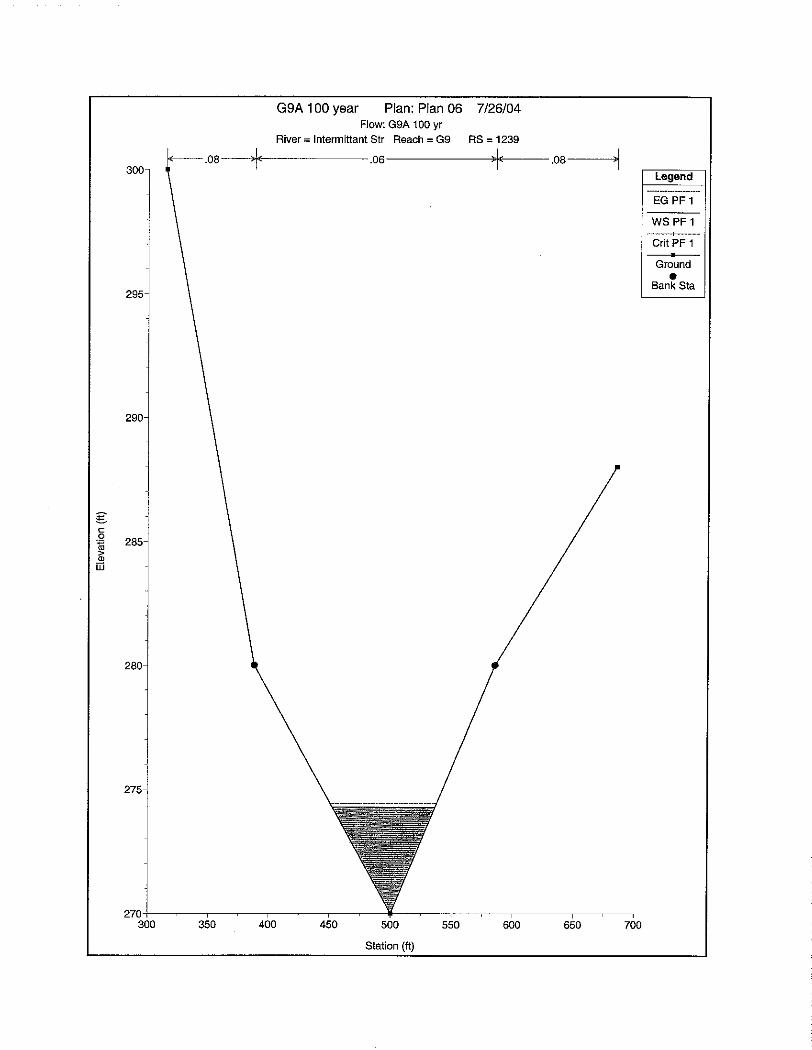
CROSSING G9
Elev. W. S. (ft.)-Bridge 268.00 280.58 276.70 274.28 270.70 5.20 3.06 Elev. W. S. (ft.)-Without Bridge 268.00 280.75 276.44 274.28 270.70 6.36 3.06

3-11 Hydrology & Hydraulics Technical Report
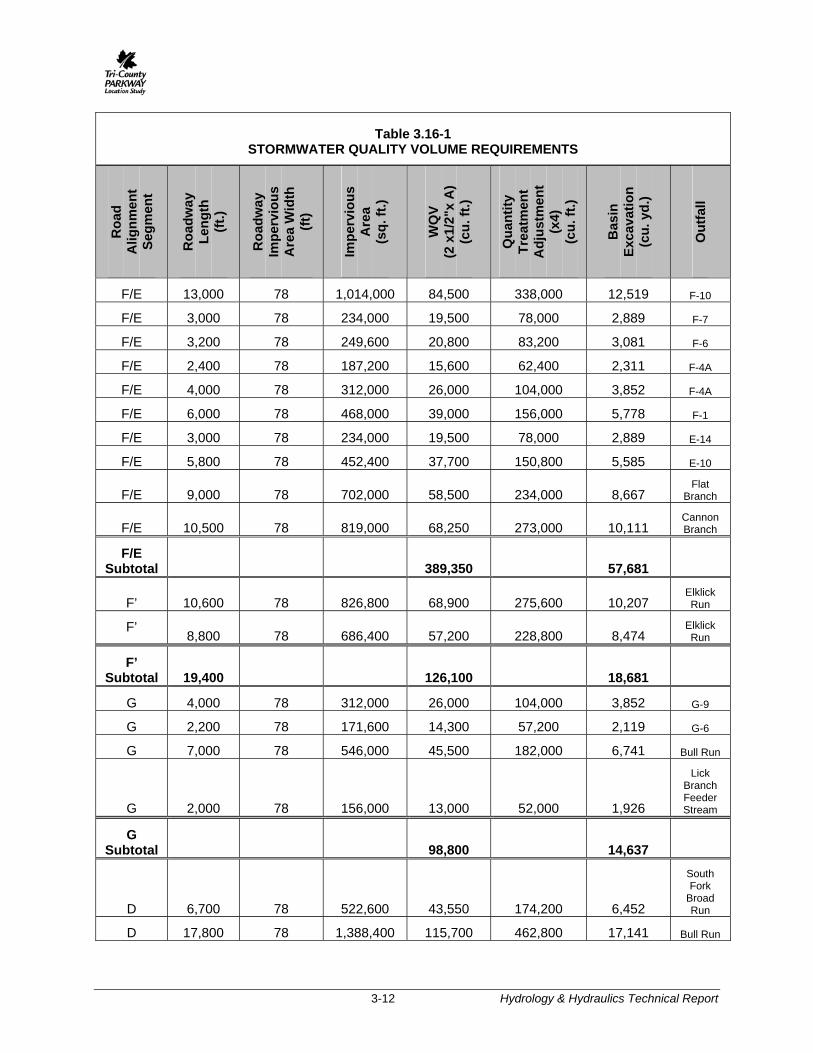
3.16 STORMWATER MANAGEMENT
The objective of a stormwater management plan is to protect the aquatic environment by controlling the post-developed water quantity and quality, as nearly as practicable, equal to or better than predevelopment runoff characteristics. The stormwater management plan developed at a later phase of design for the Tri-County Parkway will be in conformance with the Virginia Stormwater Management Regulations (SWMR), Virginia Stormwater Management Handbook, Virginia Erosion and Sediment Control Regulations, Chesapeake Bay Protection Act (CBPA), and any necessary local amendments to these requirements.
Proposed impervious areas for each watershed within project limits were tabulated. Roadway and other linear-type development projects with impervious areas of less than one acre draining to any single outfall generally do not require water quality treatment. The proposed Tri-County Parkway lies within the water supply watershed of the Occoquan Reservoir, so stormwater management facilities will be provided for all areas. Stormwater management facilities will be placed adjacent to the proposed roadway right-of-way and will be positioned generally to treat just the roadway runoff to the maximum extent practical. Basin excavation volumes were determined by computing the Water Quality Volume (WQV) and multiplying the result by a factor of two (for extended detention basins) and then multiplied by a factor of four to provide stormwater quantity volume requirements to attenuate peak flow to predevelopment levels.
Stormwater management can ultimately be achieved by a combination of best management practices (BMP) during future design phases and when a preferred alternative is selected. Candidate BMPs include, but are not limited to: grassed swales, vegetated buffers and filter strips, check dams, extended detention basins, water quality structures, retention basins, enhanced basins, forebays, bioretention facilities, and regional facilities.
Impervious areas, water quality volumes, and estimated basin excavation volumes for all watersheds are identified in Table 3.16-1.
(This area left blank intentionally)
3-12 Hydrology & Hydraulics Technical Report
Table 3.16-1 STORMWATER QUALITY VOLUME REQUIREMENTS
Roa
d A
lignm
ent
Segm
ent
Roa
dway
Le
ngth
(ft
.)
Roa
dway
Im
perv
ious
A
rea
Wid
th
(ft)
Impe
rvio
us
Are
a (s
q. ft
.)
WQ
V
(2 x
1/2"
x A
) (c
u. ft
.)
Qua
ntity
Tr
eatm
ent
Adj
ustm
ent
(x4)
(c
u. ft
.)
Bas
in
Exca
vatio
n (c
u. y
d.)
Out
fall
F/E 13,000 78 1,014,000 84,500 338,000 12,519 F-10
F/E 3,000 78 234,000 19,500 78,000 2,889 F-7
F/E 3,200 78 249,600 20,800 83,200 3,081 F-6
F/E 2,400 78 187,200 15,600 62,400 2,311 F-4A
F/E 4,000 78 312,000 26,000 104,000 3,852 F-4A
F/E 6,000 78 468,000 39,000 156,000 5,778 F-1
F/E 3,000 78 234,000 19,500 78,000 2,889 E-14
F/E 5,800 78 452,400 37,700 150,800 5,585 E-10
F/E 9,000 78 702,000 58,500 234,000 8,667 Flat
Branch
F/E 10,500 78 819,000 68,250 273,000 10,111 Cannon Branch
F/E Subtotal 389,350 57,681
F’ 10,600 78 826,800 68,900 275,600 10,207 Elklick Run
F’ 8,800 78 686,400 57,200 228,800 8,474
Elklick Run
F’ Subtotal 19,400 126,100 18,681
G 4,000 78 312,000 26,000 104,000 3,852 G-9
G 2,200 78 171,600 14,300 57,200 2,119 G-6
G 7,000 78 546,000 45,500 182,000 6,741 Bull Run
G 2,000 78 156,000 13,000 52,000 1,926
Lick Branch Feeder Stream
G Subtotal 98,800 14,637
D 6,700 78 522,600 43,550 174,200 6,452
South Fork
Broad Run
D 17,800 78 1,388,400 115,700 462,800 17,141 Bull Run

3-13 Hydrology & Hydraulics Technical Report
Table 3.16-1 STORMWATER QUALITY VOLUME REQUIREMENTS
Roa
d A
lignm
ent
Segm
ent
Roa
dway
Le
ngth
(ft
.)
Roa
dway
Im
perv
ious
A
rea
Wid
th
(ft)
Impe
rvio
us
Are
a (s
q. ft
.)
WQ
V
(2 x
1/2"
x A
) (c
u. ft
.)
Qua
ntity
Tr
eatm
ent
Adj
ustm
ent
(x4)
(c
u. ft
.)
Bas
in
Exca
vatio
n (c
u. y
d.)
Out
fall
D/C 10,200 78 795,600 66,300 265,200 9,822 Bull Run
C 4,500 78 351,000 29,250 117,000 4,333 Lick
Branch
C 15,600 78 1,216,800 101,400 405,600 15,022 Little Bull
Run
D/C Subtotal 312,650 46,319
4-1 Hydrology & Hydraulics Technical Report
4.0 REFERENCES
Blackburn, Alex C. Interpretive Guide to the Use of Soils Maps, Loudoun County, Virginia. Department of Building and Development, Loudoun County, Virginia. 2000.
Davis, Adam M., C. Scott Southworth, James E. Reddy, and J. Stephen Schindler. Geologic Map Database of the Washington DC Area Featuring Data from Three 30 x 60 Minute Quadrangles: Frederick, Washington West, and Fredericksburg. U.S. Geological Survey Open-File Report 01-227. 2001. http://pubs.usgs.gov/openfile/of01-227/
Drake, Avery Ala Jr., et al. Geologic Map of the Manassas Quadrangle, Fairfax and Prince William Counties, Virginia. U.S. Dept. of the Interior, USGS (Map GQ-1732). , 1994.
Fairfax County Health Department. 1999 Fairfax County Stream Water Quality Report.
Fairfax County Health Department. 2000 Fairfax County Stream Water Quality Report.
Federal Emergency Management Agency. Flood Insurance Rate Maps, Fairfax County, Community Panel, 515525 0025d. Revised 3/5/1990
Federal Emergency Management Agency. Flood Insurance Rate Maps, Loudoun County, Community Panel, 51107c0425d. Effective 7/5/2001
Federal Emergency Management Agency. Flood Insurance Rate Maps, Loudoun County, Community Panel, 51107c0390d. Effective 7/5/2001
Federal Emergency Management Agency. Flood Insurance Rate Maps, Loudoun County, Community Panel, 51107c0370d. Effective 7/5/2001
Federal Emergency Management Agency. Flood Insurance Rate Maps, Loudoun County, Community Panel, 51107c0365d. Effective 7/5/2001
Federal Emergency Management Agency. Flood Insurance Rate Maps, Loudoun County, Community Panel, 51107c0360d. Effective 7/5/2001
Federal Emergency Management Agency. Flood Insurance Rate Maps, Prince William County, Community Panel, 51153c0039d. Effective 1/5/1995
Federal Emergency Management Agency. Flood Insurance Rate Maps, Prince William County, Community Panel, 51153c0081d. Effective 1/5/1995
Federal Emergency Management Agency. Flood Insurance Study, Fairfax, Virginia and Unincorporated Areas. January 8, 1972, revised March 5, 1990.
Federal Emergency Management Agency. Flood Insurance Study, Loudoun County, Virginia and Unincorporated Areas. July 5, 2001.
Federal Emergency Management Agency. Flood Insurance Study, Prince William, Virginia and Unincorporated Areas. January 5, 1995.
Porter, H. C., et al., Soil Survey of Fairfax County, Virginia. Soil Survey Series, U.S. Dept. of Agriculture, Soil Conservation Service. 1955.
Prince William County Government, Department of Public Works – Environmental Services. Flood history information accessed at http://www.co.prince-william.va.us/pworks/env_services/flooding.htm. Copyright 1999 (last update not specified).
Prince William County Office of Public Works. Countywide Geographic Shapefiles, 100 year floodplain. Acquired 2000.
Prince William County Service Authority. 2000 Water Quality Report.
Prince William County. West County Water Plan. http://www.co.prince-william.va.us/planning/CompPlan/waterwest.htm. 5 August 2002.

4-2 Hydrology & Hydraulics Technical Report
U.S. Department of Agriculture, Soil Conservation Service. Soil Survey of Prince William County, Virginia. U.S. Dept. of Agriculture, Soil Conservation Service. August 1989.
U.S. Department of Commerce, National Oceanic and Atmospheric Administration, National Weather Service. Virginia Historic Flood Events. Information accessed at http://www.erh.noaa.gov/er/lwx/Hhistoric_Events/va-floods.html. Last modified 5 September 2002.
U.S. Department of Transportation, Federal Highway Administration. Is Highway Runoff A Serious Problem?. http://www.tfhrc.gov/hnr20/runoff/runoff.htm. 29 July 2002
U.S. Environmental Protection Agency. EPA, Polluted Runoff (Nonpoint Source Pollution), Controlling (NPS) Runoff from Roads, Highways and Bridges. http://www.epa.gov/OWOW/NPS/roads.html. 1 August 2002.
Virginia Department of Environmental Quality, Water Division. Potomac River Basin Impaired Water Segments. http://www.deq.state.va.us/watermaps/poto.html. 6 June 2002.
Virginia Department of Environmental Quality. 2002 303(d) Report. Draft 2002.
Virginia Department of Environmental Quality. 2002 305(b) Report. Draft 2002.
Virginia Department of Environmental Quality. Virginia Ambient Water Quality Monitoring Report, Monitoring Year 1999 (DEQ Technical Bulletin WQA/1999-004). December 15, 1999.
Virginia Department of Environmental Quality. Virginia Ambient Water Quality Monitoring Report, Monitoring Year 1998 (DEQ Technical Bulletin WQA/1998-003). December 30, 1998.
Virginia Department of Environmental Quality. Virginia Department of Environmental Quality web page. http://www.deq.state.va.us/permits/homepage.html. July 2002.
Virginia State Water Control Board. Water Quality Standards 9 VAC 25-260-5 et. seq.

APPENDIX 1
TRI-COUNTY PARKWAY BRIDGE STUDY MAP

(This page left blank intentionally)

APPENDIX 2
TRI-COUNTY PARKWAY BRIDGE STUDY MAP

(This page left blank intentionally)

TRI-COUNTY PARKWAY
BRIDGE CROSSING ANALYSIS
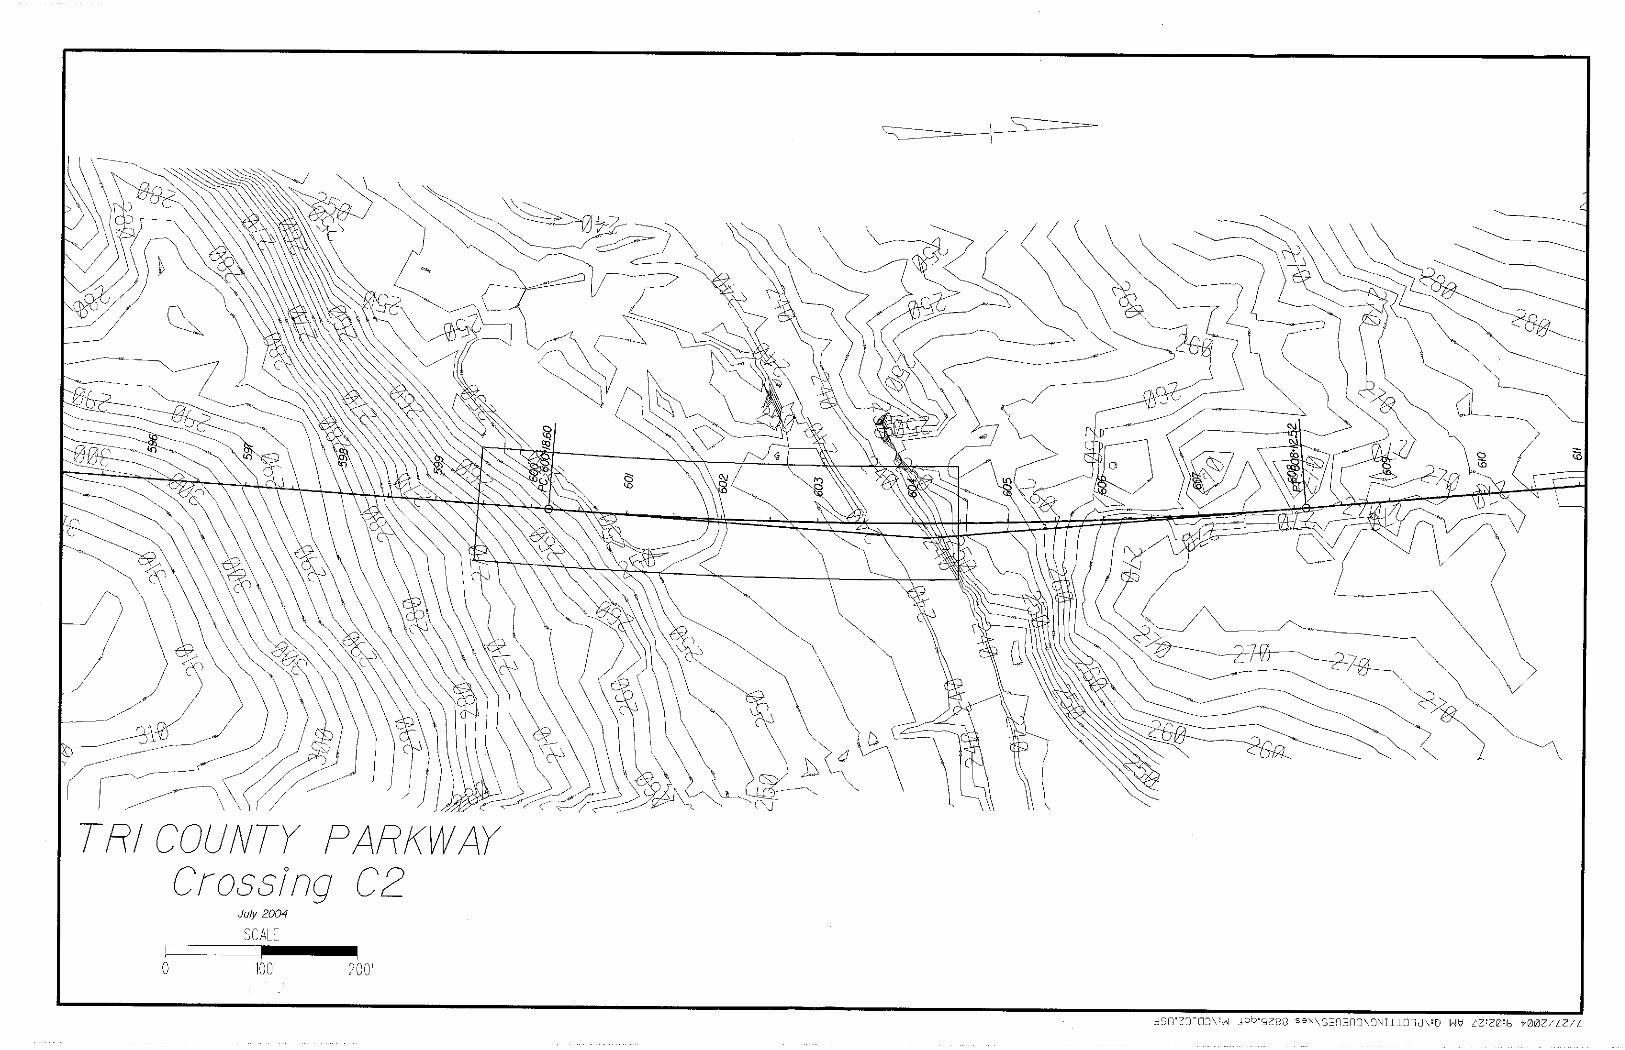
CROSSING C2
PART 1: Plan Sheet PART 2: HEC RAS Output of Existing Conditions PART 3: HEC RAS Cross Sections, Existing Conditions PART 4: HEC RAS Output, Proposed Bridge PART 5: HEC RAS Cross Sections, Proposed Bridge

(This page left blank intentionally)


TRI-COUNTY PARKWAY
BRIDGE CROSSING ANALYSIS
CROSSING C3
PART 1: Plan Sheet

(This page left blank intentionally)


TRI-COUNTY PARKWAY
BRIDGE CROSSING ANALYSIS
CROSSING C5
PART 1: Plan Sheet PART 2: HEC RAS Output of Existing Conditions PART 3: HEC RAS Cross Sections, Existing Conditions PART 4: HEC RAS Output, Proposed Bridge PART 5: HEC RAS Cross Sections, Proposed Bridge

(This page left blank intentionally)


TRI-COUNTY PARKWAY
BRIDGE CROSSING ANALYSIS
CROSSING C6
PART 1: Plan Sheet PART 2: HEC RAS Output of Existing Conditions PART 3: HEC RAS Cross Sections, Existing Conditions PART 4: HEC RAS Output, Proposed Bridge PART 5: HEC RAS Cross Sections, Proposed Bridge

(This page left blank intentionally)


TRI-COUNTY PARKWAY
BRIDGE CROSSING ANALYSIS
CROSSING D2
PART 1: Plan Sheet PART 2: HEC RAS Output of Existing Conditions PART 3: HEC RAS Cross Sections, Existing Conditions PART 4: HEC RAS Output, Proposed Bridge PART 5: HEC RAS Cross Sections, Proposed Bridge

(This page left blank intentionally)


TRI-COUNTY PARKWAY
BRIDGE CROSSING ANALYSIS
CROSSING D2A
PART 1: Plan Sheet

(This page left blank intentionally)


TRI-COUNTY PARKWAY
BRIDGE CROSSING ANALYSIS
CROSSING D5
PART 1: Plan Sheet PART 2: HEC RAS Output of Existing Conditions PART 3: HEC RAS Cross Sections, Existing Conditions PART 4: HEC RAS Output, Proposed Bridge PART 5: HEC RAS Cross Sections, Proposed Bridge

(This page left blank intentionally)


TRI-COUNTY PARKWAY
BRIDGE CROSSING ANALYSIS
CROSSING E2
PART 1: Plan Sheet

(This page left blank intentionally)


TRI-COUNTY PARKWAY
BRIDGE CROSSING ANALYSIS
CROSSING E6A
PART 1: Plan Sheet

(This page left blank intentionally)

TRI-COUNTY PARKWAY
BRIDGE CROSSING ANALYSIS
CROSSING E6B-1,2,3
PART 1: Plan Sheet

(This page left blank intentionally)


TRI-COUNTY PARKWAY
BRIDGE CROSSING ANALYSIS
CROSSING E-10A
PART 1: Plan Sheet PART 2: HEC RAS Output of Existing Conditions PART 3: HEC RAS Cross Sections, Existing Conditions PART 4: HEC RAS Output, Proposed Bridge PART 5: HEC RAS Cross Sections, Proposed Bridge

(This page left blank intentionally)


TRI-COUNTY PARKWAY
BRIDGE CROSSING ANALYSIS
CROSSING E10B
PART 1: Plan Sheet

(This page left blank intentionally)


TRI-COUNTY PARKWAY
BRIDGE CROSSING ANALYSIS
CROSSING F1-A
PART 1: Plan Sheet

(This page left blank intentionally)


TRI-COUNTY PARKWAY
BRIDGE CROSSING ANALYSIS
CROSSING F1B,C
PART 1: Plan Sheet

(This page left blank intentionally)


TRI-COUNTY PARKWAY
BRIDGE CROSSING ANALYSIS
CROSSING F6
PART 1: Plan Sheet

(This page left blank intentionally)


TRI-COUNTY PARKWAY
BRIDGE CROSSING ANALYSIS
CROSSING F9
PART 1: Plan Sheet

(This page left blank intentionally)


TRI-COUNTY PARKWAY
BRIDGE CROSSING ANALYSIS
CROSSING F10
PART 1: Plan Sheet

(This page left blank intentionally)


TRI-COUNTY PARKWAY
BRIDGE CROSSING ANALYSIS
CROSSING F17
PART 1: Plan Sheet

(This page left blank intentionally)


TRI-COUNTY PARKWAY
BRIDGE CROSSING ANALYSIS
CROSSING F19
PART 1: Plan Sheet

(This page left blank intentionally)


TRI-COUNTY PARKWAY
BRIDGE CROSSING ANALYSIS
CROSSING F20
PART 1: Plan Sheet

(This page left blank intentionally)

TRI-COUNTY PARKWAY
BRIDGE CROSSING ANALYSIS
CROSSING G2
PART 1: Plan Sheet PART 2: HEC RAS Output of Existing Conditions PART 3: HEC RAS Cross Sections, Existing Conditions PART 4: HEC RAS Output, Proposed Bridge PART 5: HEC RAS Cross Sections, Proposed Bridge

(This page left blank intentionally)


TRI-COUNTY PARKWAY
BRIDGE CROSSING ANALYSIS
CROSSING G6
PART 1: Plan Sheet

(This page left blank intentionally)


TRI-COUNTY PARKWAY
BRIDGE CROSSING ANALYSIS
CROSSING G9
PART 1: Plan Sheet PART 2: HEC RAS Output of Existing Conditions PART 3: HEC RAS Cross Sections, Existing Conditions PART 4: HEC RAS Output, Proposed Bridge PART 5: HEC RAS Cross Sections, Proposed Bridge

(This page left blank intentionally)