hydrology of brooklyn lake near keystone...
TRANSCRIPT

STATE OF FLORIDASTATE BOARD OF CONSERVATION
DIVISION OF GEOLOGY
FLORIDA GEOLOGICAL SURVEY
Robert O. Vernon, Director
REPORT OF INVESTIGATIONS NO. 33
HYDROLOGY OF BROOKLYN LAKENEAR
KEYSTONE HEIGHTS, FLORIDA
ByWilliam E. Clark, Rufus H. Musgrove,
Clarence G. Menke, and Joseph W. Cagle, Jr.
Prepared by the
UNITED STATES GEOLOGICAL SURVEYin cooperation with the
FLORIDA GEOLOGICAL SURVEY
Tallahassee1963

A . 33'AGRI.
FLORIDA STATE BOARD LTURAMLIBRARY
OFCONSERVATION
FARRiS BRYANT
Governor
TOM ADAMS J. EDWIN LARSON
Secretary of State Treasurer
THOMAS D. BAILEY RICHARD ERWIN
Superintendcet of Public Inltruction Attorney General
RAY E. GREEN DOYLE CONNER
Comptroller Commissioner of Agriculture
W. RANDOLPH HODGES
Director
ii

LETTER OF TRANSMITTAL
Jlorida ceological SurveyCallahassee
February 18, 1963
Honorable Farris Bryant, ChairmanFlorida State Board of ConservationTallahassee, Florida
Dear Governor Bryant:
The Florida Geological Survey is publishing, as Report of In-vestigations No. 38, a study on the "Hydrology of Brooklyn Lakenear Keystone Heights, Florida." This report was prepared by anumber of geologists and engineers, working with the U. S. Geo-logical Survey, in cooperation with the Florida Geological Survey.
The study was undertaken, because of the serious depletion ofwater levels during the severe drought of 1954-58, as a means ofdetermining the relationship of the lake water to shallow ground-water levels and to artesian water levels. This is a comprehensivestudy of these lakes and water levels, which will be helpful in de-signing control structures for the control of the levels of the seriesof lakes that extend from Blue Pond to Lake Geneva.
Respectfully yours,
Robert 0. VernonDirector and State Geologist
iii

Completed manuscript receivedDecember 20, 1962
Published for the Florida Geological SurveyTallahassee, Florida
1963
iv

PREFACE
This report was prepared by the Water Resources Division ofthe U. S. Geological Survey in cooperation with the FloridaGeological Survey. The investigation was under the generalsupervision of M. I. Rorabauigh and C. S. Conover, successivelydistrict engineer, Branch of Ground Water; A. O. Patterson, districtengineer, Branch of Surface Water; and J. W. Geurin, districtchemist; and K. A. MacKichan, succeeding district engineer,Branch of Quality of Water, U. S. Geological Survey.
v


TABLE OF CONTENTS
Abstract ....---.. _ ... _ ... _.. .......... ... ._ 1..................................... ............. 1Introduction .------........----..... ----.... --... --...... ........ _ ...--...... .............-- .....-- ...-. ..- 2
Purpose and scope --..---..----------.....------...-..... ----------....-....--.... -- 2Rainfall -------....... .........................-.-..................-................. ......-.... ...- 4
Physical description .............-..-... ...... ... ...-.....-.......... .......... ..-..-.........------ 6Surface drainage .----.-..... --................-------........ ..... . ............. ...- .....---- 6Stage fluctuations ---..--....-..--.----....---------...------ ...------------ 6Depths and storage ---.---......... -----......----........... .....-.--........---..-.--......... 9Chemical quality and temperature of water .-..---........---..-...--.. ..-....... 10
Relation of ground water to lake --..............----------------....-----.. ... -..-.. 15Water-table aquifer ---------..... ---.... -----.. --... ---......... -- --..---.....------ 19Confining bed -----...................-------............ ........ .--..... .......--......-.....-. 31Floridan aquifer ---..--..-......- --...................... .......-......-.......... ..-..-.. .... ... 32
Water budget ---....-..-. --...--........----- -- --............. --------............--.-.--. 35Methods of controlling Brooklyn Lake -..-..-..-..........--------- .....--- ..---- 39Conclusions -----.......-----.--------..... ..-..-..-------------...-.. --- ...-.....-...--......-- 43
ILLUSTRATIONS
Figure Page1 Location of Brooklyn Lake area -- ..---..- ...---..-..--- ................-------- 32 Bar graph of annual rainfall for the period 1900-60 at
Gainesville, Florida -...........................----.------....-......-.......---- -------.. 53 Surface drainage of Etonia Creek basin ------.......-...... ... ...-------...-- 74 Profile and location of chain of six lakes in the upper Etonia
Creek basin ---.......---...... --........-----.........._------- ..........-......-.....- 85 Stage graph of Brooklyn Lake -..--...-...--...-......-..-..........-......-------- .------- 96 Brooklyn Lake showing lines of equal depth at lake-surface
elevation of 117 feet above sea level -- .. ---- ... --------. . ------ 117 Brooklyn Lake showing lines of equal depth at the record-low
elevation of 97.2 feet above sea level ---------............... .......--- . .----. . 128 Curve showing relation of lake stage to lake storage -.--...---....----... 139 Relation of pH to depth of water occurrence, near Brooklyn Lake _. 15
10 Temperature profiles in Brooklyn Lake on May 9, 1960 andNovember 28, 1960 .--.....------....- .......--.....------...--...-..--. ...-------....--... 16
11 Brooklyn Lake area showing locations of wells and givingan explanation of the well-numbering system ..---.--.--------..-.----- 17
12 Brooklyn Lake area showing the locations of sections A-A',B-B', C-C', and D-D' -.-----......-- .... ...-- ................. ......-----------.._ ..-- 19
13 Section showing geologic formations, hydrologic units, andtypes of material in the Brooklyn Lake area along line A-A'in figure 12 ...... ....... ---------..... ........................ ......................................... -- 20
14 Section showing hydrologic units in the Brooklyn Lake areaalong line B-B' in figure 12 ...---..- ...----.............-..-............................... 20
15 Section showing hydrologic units in the Brooklyn Lake areaalong line C-C' in figure 12 ___-___.-....--._....._______ .... 21
16 Section showing hydrologic units in the Brooklyn Lake areathrough a filled sink along line D-D' in figure 12 ...............------ ....-... 22
vii
ILLUSTRATIONS (Continued)
17 Brooklyn Lake area showing contours on base of the water-table aquifer ----. ----------........-------......... .-.. . -...................... .............---- 24
18 Brooklyn Lake area showing contours on the water table onMarch 22, 1960 ....---. .............-........-- .......----...............................-......----- 25
19 Brooklyn Lake area showing contours on the water tableon October 17, 1960 --. --............... .....-- ...-.....--....... .... .. ....-.....-..... .... ...----- 26
20 Hydrographs of well 947-202-14 and Brooklyn Lake ........--....--......- . 2821 Hydrographs of wells 948-202-5 and 948-202-7, and
Brooklyn Lake ..--...-----.........-.......... ...................--- ...------ ......------- . ...- ........ 2922 Hydrographs of wells 948-201-8, 948-201-10, and 948-201-13,
and Brooklyn Lake ------.............-................ ........-------- - .....-.--.--.-- 3023 Hydrograph showing the water level in well 947-201-4 .......-............ 3424 Brooklyn Lake area showing contours on the piezometric
surface of the Floridan aquifer in June 1960 ------... ---...............-....--.-- 3625 Water budget of Brooklyn Lake for the period October 1957
to September 1960 .....--...... ........- ----....---.--..- ..-- ..----.....-. ....... „.-..... 3826 Stage graph of Santa Fe Lake and profile from Santa Fe
Lake to Brooklyn Lake -.......---- .. --.. ---...---.......--...-...--- 42
Table Page1 Average, maximum, and minimum mineral content and tem-
perature of Brooklyn, Magnolia, and Sandhill lakes .......................... 142 Geologic formations, hydrologic units, and their water-
bearing characteristics in the Brooklyn Lake area, ClayCounty, Florida ..... . ... ......_-......... . .. . ............ --- 18
viii
HYDROLOGY OF BROOKLYN LAKE
NEAR KEYSTONE HEIGHTS, FLORIDA
By
William E. Clark, Rufus H. MusgroveClarence G. Menke, and Joseph W. Cagle, Jr.
ABSTRACT
Brooklyn Lake receded about 20 feet during 1954-58 and reachedits lowest stage of record (97.2 feet) in February 1958; this wasthe lowest stage in the memory of longtime residents. This un-usually large recession was a result of deficient rainfall duringmore than a 3-year period, January 1954 to May 1957. However,by October 1959, after 21/ years of above normal rainfall, thelake had recovered and water was flowing through the surfaceoutlet.
Brooklyn Lake is the fourth lake from the head of a chain oflakes situated in a group of high sandhills in the upper EtoniaCreek basin. The sands covering this part of the basin are porous.Consequently, seepage rates are high and surface runoff is exceed-ingly low.
The dissolved solids content of Brooklyn Lake water rangedfrom 19 to 34 ppm (parts per million) during the period July 1957to June 1960. The pH values of the water ranged from 5.1 to 5.7.Seepage from the lake is apparently effective in localized loweringof the pH of the ground water. Temperature measurementsduring November 1957 and May 1960 indicate seasonal variationin temperature and degree of stratification.
The sediments that underlie Brooklyn Lake comprise threehydrologic units-the water-table aquifer, the confining bed, andthe Floridan aquifer. The water-table aquifer, the uppermost unit,is composed of sand, clay, limestone, and marl beds that have anaggregate maximum thickness of about 100 feet. The underlyingconfining bed is composed of relatively impermeable deposits thatare as much as 130 feet thick. The lowermost unit, the Floridanaquifer, is composed of a series of permeable limestone, dolomite,and dolomitic limestone beds that are more than 900 feet thick. Atplaces, the confining bed has been breached by collapse of theunderly Floridan limestone, or displaced by what may be faults orfractures.
1

2 FLORIDA GEOLOGICAL SURVEY
Brooklyn Lake both loses and gains water from the water-tableaquifer. During the period March through October 1960, about 400acre-feet more water left the lake than entered the lake throughthe water-table aquifer. Water leaks from the lake into theFloridan aquifer through old filled sinks that perforate the confiningbed, and water also probably seeps downward to the Floridan aqui-fer through the confining bed especially where it is thin.
A water budget computed for a 3-year period, October 1957through September 1960, indicated about 30,000 acre-feet of waterentered the lake by surface inflow and precipitation directly to thelake. This is more than twice the amount of water than can bestored in the, lake at any time. Slightly more than 10,000 acre-feetof the water entering the lake went to lake storage. The remaining20,000 acre-feet was removed from the lake in three ways:seepage, 55 percent; evaporation, 35 percent; and surface outflow,10 percent. Seepage accounted for an average daily loss of about3 million gallons during the 3-year period. An average of about 8mgd (million gallons per day) recharged the Floridan aquiferduring the 8-month period, March to October 1960. The amount ofwater evaporated from the lake surface was essentially equal tothat contributed directly by rainfall.
Three possible methods of increasing inflow to help maintain anormal lake stage during periods of deficient rainfall are: (1) bycarefully pumping from the Floridan aquifer at strategic sites; (2)by increasing storage in upper lakes during periods of excess rain-fall; and (3) by diversion of water from Santa Fe Lake. Plans tocontrol the stage of Brooklyn Lake should be based on detailedengineering studies.
INTRODUCTION
PURPOSE AND SCOPE
The level of Brooklyn Lake, near the city of Keystone Heightsin southwestern Clay County, fluctuates widely (fig. 1). As aconsequence both permanent and summer residents, who havebuilt many houses on its shores are concerned. Local organizationsand officials realized the need for determining the reason for thewide fluctuations and prompted an investigation. This report ex-plains why the lake level fluctuates widely and furnishes informa-tion for planning methods of regulating the lake level.

REPORT OF INVESTIGATIONS No. 33 3
8 *05 8200' 55' 5o 45' 40' 35' 8230
S KINGSLEY o
D riUVAL C ULTY coj,/ " I
1CLAY COUNT Y .S i
, STAROV S '0
-are i co®-'"
Map of Florida showing Cloy County
;I, KINGSL, YI I
Figure 1. Location of Brooklyn Lake area.
The investigation was made by the U. Geological Survey at
the request of and in cooperation with the Florida Geological Sur-
vey. The investigation of the lake was part of an investigation ofthe water resources of Alachua, Bradford, Clay, and Unioncounties. The results of this four-county study are contained in
reorts entitled "Water Resources of Alachuaorid Bradfordhowin ClayCl andCoun
Figure 1. Location of Brooklyn Lake area.
The investigation was made by the U. S. Geological Survey atthe request of and in cooperation with the Florida Geological Sur-vey. The investigation of the lake was part of an investigation ofthe water resources of Alachua, Bradford, Clay, and Unioncounties. The results of this four-county study are contained inreports entitled "Water Resources of Alachua, Bradford, Clay, and

4 FLORIDA GEOLOGICAL SURVEY
Union Counties, Florida," and "Water Resources Data of Alachua,Bradford, Clay, and Union Counties, Florida" by William E. Clark,Rufus H. Musgrove, Clarence G. Menke, and Joseph W. Cagle, Jr.to be published by the Florida Geological Survey. The report ofthe Brooklyn Lake area was prepared chiefly for the convenienceof the reader who is interested primarily in that aspect of theinvestigation.
Information is given in this report on the surface drainage,fluctuation of stage, depth, mineral content, and temperature ofBrooklyn Lake. The earth materials underlying and surroundingthe lake are described, and the movement of water into and outof the lake from these materials is discussed. Various ways thatthe lake gains and loses water are discussed and evaluated to de-termine if downward leakage occurs. Finally, some methods forregulating the stage of the lake are considered.
RAINFALL
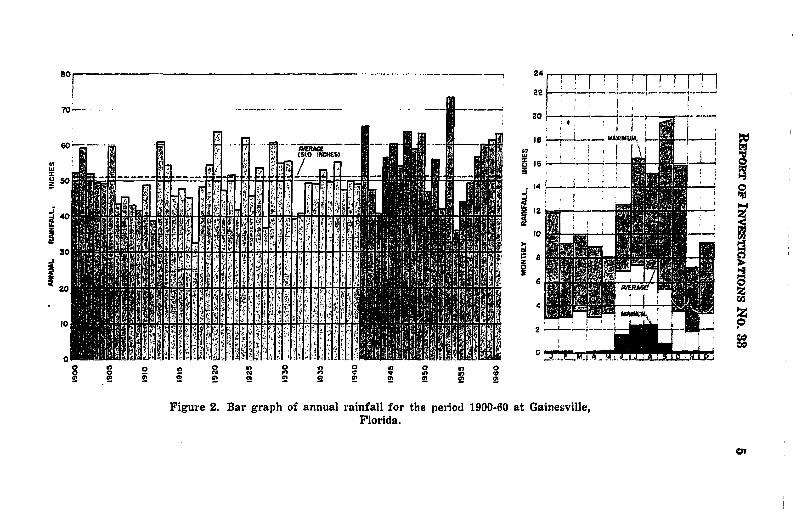
Brooklyn Lake receives all its water either directly or indirectlyfrom rainfall. Rain falling on the lake surface is the direct source.The indirect source is surface inflow and ground-water inflow. Therainfall on Brooklyn Lake averages 52 inches per year, based onrecords from three U. S. Weather Bureau stations within 30 milesof the lake-Gainesville, Glen St. Mary, and Federal Point. Thisamount is essentially equal to that at Gainesville. Records forthe period 1900-60 at Gainesville show that the rainfall thereaverages 51 inches and has ranged from 32.79 to 73.30 inches.
Figure 2 shows annual rainfall for the period 1900-60 atGainesville. Periods of excessive and deficient rainfall occur inunpredictable cycles. Rainfall at Gainesville in 1953 was 73.30inches, the highest annual rainfall of record for the area, and in1954 the rainfall was 36.24 inches, the second lowest annual rain-fall of record for the area. Also, 1954 marked the beginning of aprolonged period of deficient rainfall.
A period of more than 3 years of deficient rainfall from Janu-ary 1954 to May 1957, coupled with high rates of seepage, causedBrooklyn Lake to recede to the low levels that existed in 1957-58.Rainfall during the 3-year period 1954 to 1956 was below normal bynearly 23 inches. Above-normal rainfall started in March 1957, butBrooklyn Lake did not begin to rise until March 1958 when surfaceinflow started.
0"o-.- ..-.-.-...-.- -- 24
S. 18 i -- -M. ..AXM. -
Sso r
(5;0 i Il
-I-
2 -- ------ .
o 0 0
Figure 2. Bar graph of annual rainfall for the period 1900-60 at Gainesville,Florida.Florida.
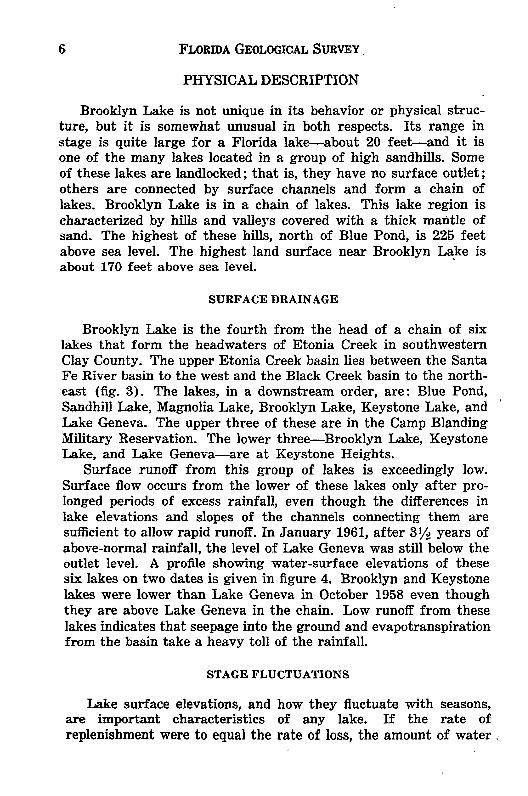
6 FLORIDA GEOLOGICAL SURVEY
PHYSICAL DESCRIPTION
Brooklyn Lake is not unique in its behavior or physical struc-ture, but it is somewhat unusual in both respects. Its range instage is quite large for a Florida lake-about 20 feet-and it isone of the many lakes located in a group of high sandhills. Someof these lakes are landlocked; that is, they have no surface outlet;others are connected by surface channels and form a chain oflakes. Brooklyn Lake is in a chain of lakes. This lake region ischaracterized by hills and valleys covered with a thick mantle ofsand. The highest of these hills, north of Blue Pond, is 225 feetabove sea level. The highest land surface near Brooklyn Lake isabout 170 feet above sea level.
SURFACE DRAINAGE
Brooklyn Lake is the fourth from the head of a chain of sixlakes that form the headwaters of Etonia Creek in southwesternClay County. The upper Etonia Creek basin lies between the SantaFe River basin to the west and the Black Creek basin to the north-east (fig. 3). The lakes, in a downstream order, are: Blue Pond,Sandhill Lake, Magnolia Lake, Brooklyn Lake, Keystone Lake, andLake Geneva. The upper three of these are in the Camp BlandingMilitary Reservation. The lower three-Brooklyn Lake, KeystoneLake, and Lake Geneva-are at Keystone Heights.
Surface runoff from this group of lakes is exceedingly low.Surface flow occurs from the lower of these lakes only after pro-longed periods of excess rainfall, even though the differences inlake elevations and slopes of the channels connecting them aresufficient to allow rapid runoff. In January 1961, after 31/½ years ofabove-normal rainfall, the level of Lake Geneva was still below theoutlet level. A profile showing water-surface elevations of thesesix lakes on two dates is given in figure 4. Brooklyn and Keystonelakes were lower than Lake Geneva in October 1958 even thoughthey are above Lake Geneva in the chain. Low runoff from theselakes indicates that seepage into the ground and evapotranspirationfrom the basin take a heavy toll of the rainfall.
STAGE FLUCTUATIONS
Lake surface elevations, and how they fluctuate with seasons,are important characteristics of any lake. If the rate ofreplenishment were to equal the rate of loss, the amount of water

REPORT OF INVESTIGATIONS No. 33 7
1 / T5N RE: s \ \
i' 3. S d of Eoi C bt r a s /
%,;
n t.t . How v, nf r m s a c os n ,
" -ETONIA CREEK BASIN
-LI I I I I I ,
Figure 3. Surface drainage of Etonia Creek basin.
stored in a lake would remain constant and the lake surface wouldnot fluctuate. However, no lake remains at a constant stage. Alllakes in Florida have some seasonal fluctuations. When stagefluctuations become so great that the utility of the lake ishampered, control measures are sought. In 1957 and 1958, BrooklynLake was at such a low level that control measures were desirable.
8 FLORIDA GEOLOGICAL SURVEY
PLAN
S.PROFILEi "!i '6 5t " I A
" I j L f--,---- -.I "!nC1 -.-- li 71i'V"'*L *bSTAsi. I WES
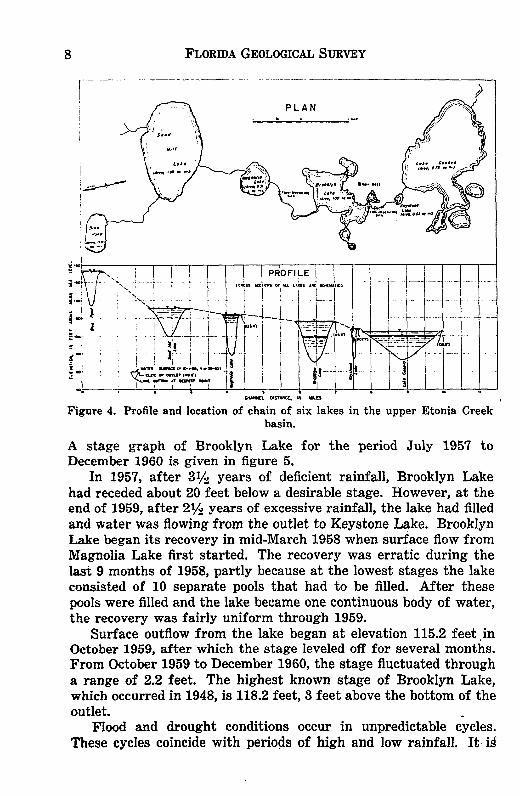
Figure 4. Profile and location of chain of six lakes in the upper Etonia Creekbasin.
A stage graph of Brooklyn Lake for the period July 1957 toDecember 1960 is given in figure 5.
In 1957, after 31/1 years of deficient rainfall, Brooklyn Lakehad receded about 20 feet below a desirable stage. However, at theend of 1959, after 21/ years of excessive rainfall, the lake had filledand water was flowing from the outlet to Keystone Lake. BrooklynLake began its recovery in mid-March 1958 when surface flow fromMagnolia Lake first started. The recovery was erratic during thelast 9 months of 1958, partly because at the lowest stages the lakeconsisted of 10 separate pools that had to be filled. After thesepools were filled and the lake became one continuous body of water,the recovery was fairly uniform through 1959.
Surface outflow from the lake began at elevation 115.2 feet inOctober 1959, after which the stage leveled off for several months.From October 1959 to December 1960, the stage fluctuated througha range of 2.2 feet. The highest known stage of Brooklyn Lake,which occurred in 1948, is 118.2 feet, 3 feet above the bottom of theoutlet.
Flood and drought conditions occur in unpredictable cycles.These cycles coincide with periods of high and low rainfall. It is

REPORT OF INVESTIGATIONS NO. 33 9
115-2 FEET114 ------------------------
- /108
9I --- -
110 6
_ i
106 ---- -.-. - - ----.. . .. . , ....... < ... .. ._ .. . .... . , .. _ _
I-o
°04 -.---- --.... -. ...--- ii~ iiill~I-
100 .8. ..
9 6 I l 1l 1 1 1 1 1 I I I I II l ll I 1 1 1 1 t1 11 1 1 I I I I i 1t1 1 11957 1958 I I 1959 I 1960
Figure 5. Stage graph of Brooklyn Lake.
possible for the cumulative deficiency for several consecutive yearsof slightly below-normal rainfall to cause a more serious droughtcondition than a large rainfall deficiency in a single year. Like-wise, in this lake region, it is possible for the cumulative effect ofslightly above-normal rainfall for several consecutive years tocause greater floods than those caused by 1 year of exceedinglyhigh rainfall. Figure 2 shows that the rainfall at Gainesville wasbelow normal during 1954-56. The end of the period of below-normal rainfall corresponds with the low lake levels that weremeasured in 1957. The graph in figure 2 also shows that the rain-fall was below normal from 1906-11, 1914-18, and 1931-34. Pre-sumable, the lake level was also low near the end of these periods.
DEPTHS AND STORAGE
Other physical aspects of Brooklyn Lake are shape, size, depth,and the related factor of storage. At the lake-full stage of 115.2
10 FLORIDA GEOLOGICAL SURVEY
feet, the area of the lake is 1.0 square mile and the length of shore-line is 8.4 miles. At the low stage of 97.2 feet in February 1958,the composite water-surface area of the 10 separate pools for thelake was only 0.5 square mile.
The map given in figure 6 shows lines of equal depth at thestage of 117 feet. The map was drawn from data obtained fromtraverses of the lake with a sonic depth recorder. Maximum depthsof the main body of the lake range from 20 to 34 feet. Several armsof the lake extend outward from the main body. The arm extendingsouthwest toward Keystone Heights is the shallowest, with a depthof 20 feet. The deepest point in the lake, 47 feet, is the middleof the series of three depressions extending to the northwest.Brooklyn Bay, to the southeast of State Highway 21, has a depthof 40 feet.
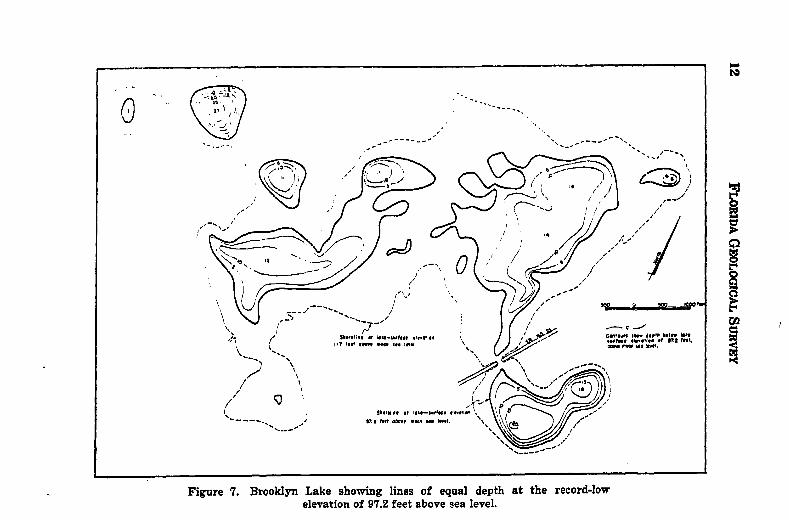
The lake divided into 10 separate pools when it was at its loweststage of 97.2 feet in February 1958. The maximum depth at thatstage was 27 feet. Figure 7 shows the outline of the lake and linesof equal depth at the low stage of 97.2 feet.
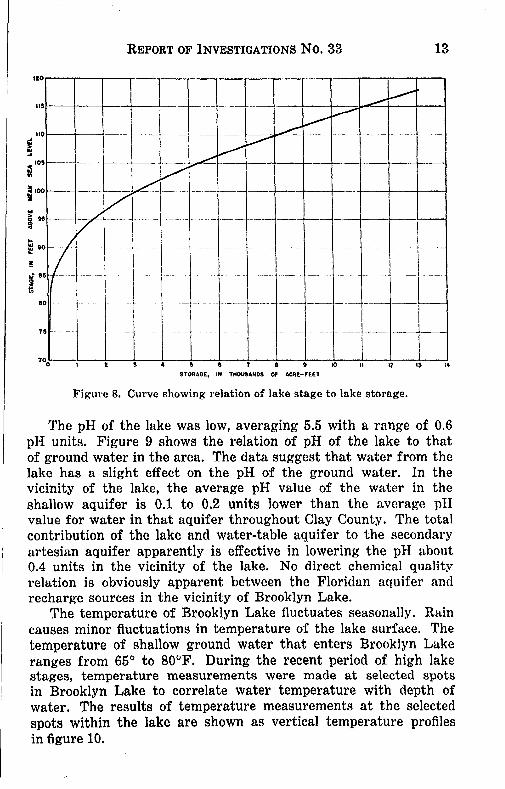
Storage, or volume, of water in the lake is related to stage andhas ranged from 2,200 to 13,000 acre-feet. (An acre-foot is thevolume needed to cover 1 acre to a depth of 1 foot.) The storage;curve in figure 8 shows the storage of Brooklyn Lake at any lakestage.
CHEMICAL QUALITY AND TEMPERATURE OF WATER
Chemical quality and temperature of Brooklyn Lake water forthe period of record, July 1957 to June 1960, were determined bysampling about twice yearly. Table 1 shows the results of chemicalanalyses of water in Brooklyn Lake, Magnolia Lake, and SandhillLake. During periods when surface inflow occurs, water inBrooklyn Lake is a blend of waters from the upper lakes andpossibly shallow ground water. Data for ground water wereobtained as a part of the four-county study.
The water in Brooklyn Lake has a low dissolved solids content.The maximum concentration of dissolved solids was 34 ppm asdetermined by the weight of residue on evaporation at 1800C(table 1). The maximum change in dissolved solids content was15 ppm as determined by the weight of residue. The chemicalcontent appears to have a general inverse relation to lake stage.None of the individual constituents varied markedly during theperiod of record. The most highly concentrated constituent waschloride with a maximum of 7 ppm.

2, 4 -
.onlou If dI plh btloI IT a @$I,
abole moon too level
10
o0 0 . oo 1000 fell
Figure 6. Brooklyn Lake showing lines of equal depth at lake-surface elevationof 117 feet above sea level.
I peso /" ms /y I-N O i Iffo 7
PI Ie av
ii '? I'
, ,t
Figure 7. Brooklyn Lake showing lines of equal depth at the record-low
elevation of 97.2 feet above sea level.
REPORT OF INVESTIGATIONS NO. 33 13
: 1 ! - 1 _ _ ......
ItI tti
S---- -- -------- 10 --. it 14
STORAOE, IN THOUSANDS OF ACGR-FlEt
Figure 8. Curve showing relation of lake stage to lake storage.
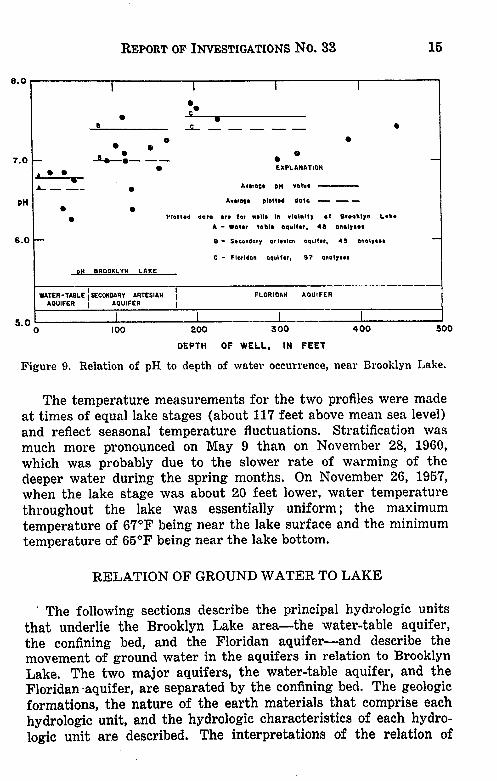
The pH of the lake was low, averaging 5.5 with a range of 0.6pH units. Figure 9 shows the relation of pH of the lake to thatof ground water in the area. The data suggest that water from thelake has a slight effect on the pH of the ground water. In thevicinity of the lake, the average pH value of the water in theshallow aquifer is 0.1 to 0.2 units lower than the average pHvalue for water in that aquifer throughout Clay County. The totalcontribution of the lake and water-table aquifer to the secondaryartesian aquifer apparently is effective in lowering the pH about0.4 units in the vicinity of the lake. No direct chemical qualityrelation is obviously apparent between the Floridan aquifer andrecharge sources in the vicinity of Brooklyn Lake.
The temperature of Brooklyn Lake fluctuates seasonally. Raincauses minor fluctuations in temperature of the lake surface. Thetemperature of shallow ground water that enters Brooklyn Lakeranges from 650 to 800F. During the recent period of high lakestages, temperature measurements were made at selected spotsin Brooklyn Lake to correlate water temperature with depth ofwater. The results of temperature measurements at the selectedspots within the lake are shown as vertical temperature profilesin figure 10.
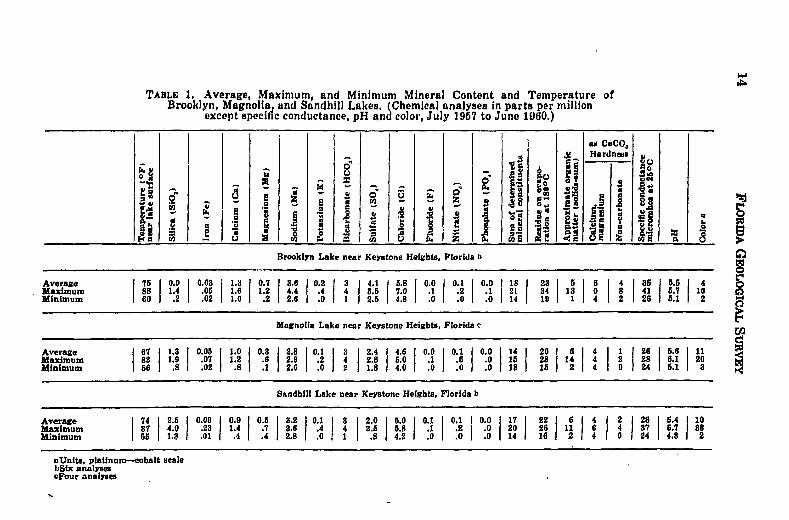
TABLE 1. Average, Maximum, and Minimum Mineral Content and Temperature ofBrooklyn, Magnolia, and Sandhill Lakes. (Chemical analyses in parts per million
except specific conductance, pH and color, July 1957 to June 1960.)
an CaCO,g Hardness
Brooklyn Lake near Keystone Heights, Florida b
Maximum 88 1.4 .06 1.6 1.2 4.4 .4 4 6.6 7.0 .1 .2 .1 I 21 34 13 9 8 41 6.7 10Minimum 60 2 .02 1.0 .2 2.6 0 1 2. 48 0 0 14 19 1 4 2 26 .1
Mafnolia Lake near Keystone Heights- Florida e
Maximum 83 1.0 .07 1.2 .6 2.9 .2 4 2.8 6.0 .1 .6 .0 16 28 14 4 2 28 6.1 20
bi i - d
Mnmum 6 .8 .02 .8 .1 2.6 .0 .0 .0 1 1 2 4 0 24 5.1
anrookly Lake near Keystone Heights, Florida b
Average 75 2.9 0.09 0.9 0.7 3.2 0.1 3 4.1 .0 0.1 0.1 0.0 17 23 6 4 2 28 5.4 1
Maximum 8811.4 .0 6 6 1.2 4.4 . 5 17.0 .1 .2 .1 21 4 2 1 09 8 41 5.71 oMinimum 60 .2 .02 1.0 .2 2.6 1.0 1 2.5 4.8 .0 1.0 .0 14 19 1 4 2 26 5.1
Magnolia Lake near Keystone Heights, Florida e
Average 67 1.3 0.05 1.0 0.312.810.1 12.4 4,6 10.010.110.0: 114 20 16 4 i 26 5.6 11Maximum 83I 1.9 .07 1.2 .•2 2.9 1.2 4 2.8 2 .05 .1•. 5 .0 15 28114 4 2 28 6.1 20Minimum 156 1.8 .021.81.112.61.0 2 1.814.0 1.0 1.01.0 13115 2 4 0 24 5.1 3
Sandhill Lake near Keystone Heights. Florida b
Average 17412.5 0.0910.910.513.2 0.11312.015.01 0.11 0.110.0 17 22 6 4 2 248 5:.4 10Maximum 87 4.0 .23 1.4 .7 3.6 .4 4 3.6 5.8 .1 .2 .0 20 26 11 6 4 37 5.7 88Minimum 55 1.3 .01 .4 .4 2.8 .0 1 .8 4.2 .0 .0 .0 14 16 2 4 0 24 4.8 2
aUnits, platinum-cobalt scalebSix analysescFour analyses
REPORT OF INVESTIGATIONS NO. 33 15
--------------
8.o
* S7.o 0- -
SEXPLANATION
A -_ Averoge PH value
pH Average plotted data - - -
SPlotted data are for wells In vicinity of Brooklyn Lake
A - Water table aquifer, 48 onalyses
6.0 - B - Secondary arteslan aquiter, 45 onalyses
C - Floridan aqulter, 97 onalyses
oH BROOKLYN LAKE
WATER-TABLE iSECONDARY ARTESIAN I FLORIDAN AQUIFERAQUIFER AQUIFER I
5.0 I I I I0 100 200 300 400 500
DEPTH OF WELL, IN FEET
Figure 9. Relation of pH to depth of water occurrence, near Brooklyn Lake.
The temperature measurements for the two profiles were madeat times of equal lake stages (about 117 feet above mean sea level)and reflect seasonal temperature fluctuations. Stratification wasmuch more pronounced on May 9 than on November 28, 1960,which was probably due to the slower rate of warming of thedeeper water during the spring months. On November 26, 1957,when the lake stage was about 20 feet lower, water temperaturethroughout the lake was essentially uniform; the maximumtemperature of 67 0F being near the lake surface and the minimumtemperature of 65 ° F being near the lake bottom.
RELATION OF GROUND WATER TO LAKE
The following sections describe the principal hydrologic units
that underlie the Brooklyn Lake area-the water-table aquifer,the confining bed, and the Floridan aquifer-and describe themovement of ground water in the aquifers in relation to BrooklynLake. The two major aquifers, the water-table aquifer, and theFloridan -aquifer, are separated by the confining bed. The geologicformations, the nature of the earth materials that comprise each
hydrologic unit, and the hydrologic characteristics of each hydro-logic unit are described. The interpretations of the relation of

16 FLORIDA GEOLOGICAL SURVEY
May 9, 1960 November 28, 1960Air temperature is 780 F Air temperature is 85* FLake stage is about +117 ft msJ Lake stage is about +117 ft. m.s..
0 O 1 0 -__
W20 20LL. IL
S30 - I 30
50 . 5050 60 70 80 50 60 70 80
TEMPERATURE *F TEMPERATURE "F
Figure 10. Temperature profiles in Brooklyn Lake on May 9, 1960 andNovember 28, 1960.
ground water to Brooklyn Lake, and also of the character andcomposition, thickness and structure, and extent of the geologicformations and hydrologic units are based on data from 39 testwells and many private wells. The locations of wells in theBrooklyn Lake area and an explanation of the well-numberingsystem are given in figure 11. Table 2 lists the geologic formationsthat comprise each hydrologic unit and summarizes the water-bearing characteristics of each unit.
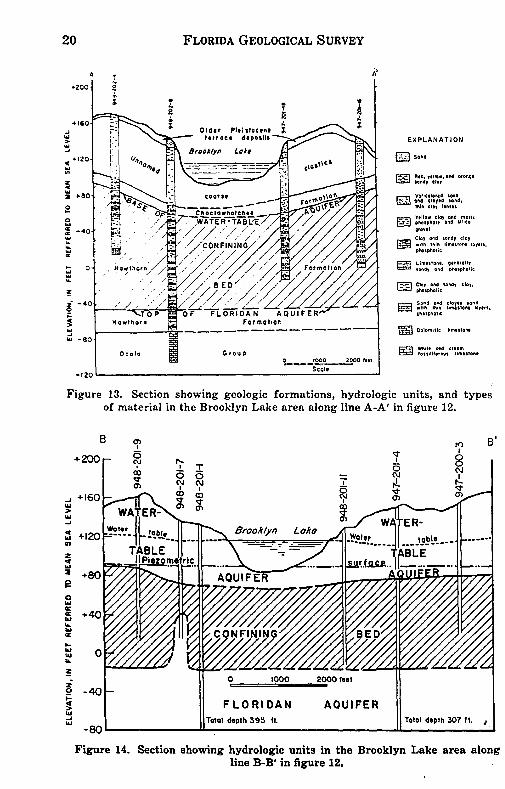
Figure 12 shows the locations of sections A-A', B-B', C-C' andD-D'. Section A-A' (fig. 13) shows graphically the lithology of theformations and relates the geology to the hydrologic units and tothe lake. Sections B-B' (fig. 14), C-C' (fig. 15), and D-D' (fig. 16)show the hydrologic units that underlie the Brooklyn Lake area.Figure 16 also shows a section through a filled sink.

REPORT OF INVESTIGATIONS No. 33 17
299, 82003 8202' 82,01'29.49'
-1 |" Treaot Read
uI 4 9,10
Loke Beofu. d
4 I3t 51
Inventored w l and well numbimoner
2948'Tet we
190 ellnumbering system 1
The ares of study is divided into 1-minute quadrangle. by the latitudinl.
by a heavy black line on the map, in which the wells are numbered consecutively.
10 11,12 00 0 1 Nte1,2 8 f
Each quadrangle is designated by the 1-minute latitudinal line on the south and
by the nute longitudinal line on the east. The quadrangle outlined on the
nap is described by latitude 29*47' and by longitude 82*01'. A well within thisquadrangle, such as number 9 shown by the arrow on the map, is numbered accordingto the quadrangle designation. The number is 29*47' - 82*01' - 9. This number
s siplified by dropping off the first digit of the degrees fro the latitudina Lo
and longitudinal lines and by omitting the degree and minute symbols. The well
47 number above isthus written 947 201- 9
I 0 mile
Bs taken from U. S. G.KS.topographic quadrangle
EXPLAMATION
1949
nvFigure 11. Brooklyn Lake area showing locations of wells and giving anumber
explanation of the well-numbering system.
Well-numbering system
The area of study is divided into l-minute quadrangles by the latitudinaland longitudinal lines. Each well is numbered consecutively within a quadranglein the order that it is inventoried. This is shown by the quadrangle outlinedby a heavy black line on the map, in which the wells are numbered consecutively.Each quadrangle is designated by the l-minute latitudinal line on the south andby the 1-minute longitudinal line on the east. The quadrangle outlined on themap is described by latitude 29*47' and by longitude 82"01'. A well within thisquadrangle
esuch as number 9 shown by the arrow on the map is numbered accordingto the quadrangle designation. The number is 29"47' - 82%01' - 9. This numberis simplified by dropping off the first digit of the degrees from the latitudinaland longitudinal lines and by omitting the degree and minute symbols. The wellnumber above IsIthus vritten 947 - 201 - 9.
1 2 0 I milo
aoDe token from U.S. 0.S.topogrophic quodrongle
1949
Figure 11. Brooklyn Lake area showing locations of wells and giving an
explanation of the well-numbering system.

TABLE 2. Geologic Formations, Hydrologic Units, and Their Water-Bearing Charac- 00
teristics in the Brooklyn Lake Area, Clay County, Florida'
Ilydrologle Normalunit Seris Formation range in Physical characteristic W rbearin characterlstics
thickness
Older Plesmitoceneterrace deposits 0-15 Band, tan, yellow and brown, loose.
Sand and clayey sand, varicolored, lo-Plelstocene cally contains quarts gravels, inter- Water in the aquifer is unconfined. The
Water-table Unnamed coarse 30-67 bedded thin lenses of clay or kaolin, sands and sandy clays are of low to moder.Watuer- clastics Upper few feet in places is red and ate permeability. The Choctawhatchee con-aquier yellow sandy clay bed. tains a few permeable zones.
Clay and marl, yellow and cream, indu-Choctawhatchee 10-20 rated in part, phosphate grains and
Formation pebbles, thin limestone and sand layers.
Clay and sandy clay, varicolored, inter. Relatively impervious clays and limestonesbedded thin sands and sandy phosphatic confine water in the Floridan aquifer underlimestones, disseminated grains and artesian pressure, Some sand and lime-
Miocene pebbles of phosphate. Some thick sand stone beds that are interbedded in clay areConfining Hawthor Formation beds with limestone layers, of low to moderate permeability.
Confining Hawthorn Formation 116.155 --bed The lowermost 25 feet of the Hawthorn
Is composed of very hard tan and graylimestones and dolomitic limestones withinterbedded clay and sand lenses.
Limestone, white, cream, and tan, soft, Water in the Floridan aquifer is under ar.Crystal River Fm. granular, porous, fossiliferous, coqui- tesian pressure. Beds in the lower part of
Ocala Williston Fm. noid in part. Some hard layers of tan the Hawthorn are the least permeable partGroup Inglis Formation 210 and gray crystalline limestone, dolo- of the aquifer. Limestones in the Ocala
(Undifferentiated) mitic in part. Group are highly porous and permeable and K'
constitute the most productive part of theSDolomite, dark brown and tan, granu- aquifer. The Avon Park, Lake City, and
Eocene lar, hard, dense to porous: interbedded Oldsmar Limestones contain many rela-Floridan Avon Park Limestone 210 ta d cream limestone and dolomitic tively impervous beds, but the ormationsaquifer limestone, are generally moderately to highly perme-
auie- limetone, able.
Limestone, dolomite, and dolomiticLake City Limestone 4604. limestone.
Limestone, dolomite, and dolomiticOldsmar Limestone ? limestone.
iThe stratigraphic nomenclature used in this report conforms to the usage of the Florida GeologicalSurvey.

REPORT OF INVESTIGATIONS No. 33 19
B.ea"o' seao.. Be.•O\29*499
Lake Seof. -d)A A
4 D ' C l
U. 3
8 A'
Su _ _ _ _ _ Loch Lommond
! 1D
KeKeysone Heghts
Paradise Loke
Bose token from U.S. G.S.topographic quadrangle 1
1949 1 Z 0 I mile
Figure 12. Brooklyn Lake area showing the locations of sections A-A', B-B',C-C', and D-D'.
WATER-TABLE AQUIFER
The upper and middle parts of the water-table aquifer arecomposed predominantly of sands and clayey sands. These sandsand clayey sands grade into soft clay and marl beds in the bottompart of the aquifer. From the surface downward the aquifer ismade up of the older Pleistocene terrace deposits, the unnamedcoarse clastics of Pleistocene age, and the Choctawhatchee Forma-tion of Miocene age.
The older Pleistocene terrace deposits which lie at the surfaceare yellow, tan, and brown, fine to coarse; loose sands that are asmuch as 15 feet thick.
The underlying unnamed coarse clastic unit is composed of twoparts. At most places, the upper part is a bed of coarse, red, yel-low, and orange sandy clay that is from 6 to 16 feet thick. The
20 FLORIDA GEOLOGICAL SURVEY
A ,A
+200
..-- -- Older PleistoceneW ; '< - I*r
r oes dep»Hlt s EXPLANATION
+120 Brooln Lak s
S R., Yest,,o. nd oonc,
+80 " or COar e Fo -aio a p .+80, CcrOd lend,
0 WATR TB / / /'//o cl r onsi o
0-g e HaSthorn Y Cl ot and ChophicTt tono• n lo ndtO l toBli
- 40 to L .n IO l IOllO"wilh tl e t I•0•t y
SoP COF FLORIDAN AQUIFER phtphoic eLim stoe. endeOt rall
S How thorn R
Fol moi onad
of120 matria int Brooklyn Lake are n e A Algre 1 .
o N rc
+80
0 1000 2000 list
WA -------- - - ->- T -- '
Scale
L0 OIDAN AtUbEl7
-IZO
Figure 13. Section showing geologic formations, hydrologic units, and types
of material in the Brooklyn Lake area along line A-A' in figure 12.
+2 00
+16-40 ->FLORIAN AQUIFERWAER-
line B-B' in figure 12.
Fiue1.Scinsoighdooi nt nteBoky aeae lnlieBBIi igr 2

REPORT OF INVESTIGATIONS NO. 33 21
.. J
> C - - C'
i o o< +160 - tj C •o CO o
S1 D Co0Z
< Z WATER-2 +120 - ter Loch
lbe Lomo n dTABLE -..
S Piezometric - surface
a +80 - AQUIFERwLLW
w +40
U O CON FINING BED
0
w F LORIDAN AQUIFER_Jlu -40
0 10,00 2000 feet
Figure 15. Section showing hydrologic units in the Brooklyn Lake area alongline C-C' in figure 12.
bed was not penetrated at the sites of test wells 947-201-4 (eastside of lake), 947-202-13 (southwest side of lake), and 948-200-1and 4 (northeast side of lake near Loch Lommond), and 948-201-7(north side of lake). The sandy clay either changes character or isabsent in the area northeast from the lake and in the area generallynorth of test wells 948-201-9 and 948-202-4. The sediments that liebeneath the sandy clay bed and comprise the lower part of the un-named coarse clastic unit are varicolored micaceous sands andclayey sands that contain thin lenses of kaolin clay and sandy clay,and locally contain quartz gravel. Where the sandy clay in theupper part of the unnamed coarse clastics units is absent, thevaricolored sands and clayey sands are continuous with the over-lying loose surface sands. Test wells penetrated 20 to 58 feet ofthe varicolored sands and clayey sands. The thickness of the
22 FLORIDA GEOLOGICAL SURVEY
. 0
0 GD D'
N ft
+150S Brooklyn
-JJ "•"t-et"-' -' Loke a table
,L +100 Piezometric - ~ surface
W WATER TABLE AQUIFER
LI +50 /7
z< /CON FINING BED
S-50 -
ILl
FLORIDAN d AQUIFER
S-2 50
L- -so -"0z
z
-300
0 1000 2000 Feet
-350
Figure 16. Section showing hydrologic units in the Brooklyn Lake area througha filled sink along line D-D' in figure 12.

REPORT OF INVESTIGATIONS NO. 33 23
unnamed coarse clastics including the sandy clay bed ranged from30 to 67 feet.
The basal part of the aquifer, the Choctawhatchee Formation,is composed of 10 to 20 feet of soft, yellow, and olive sandy clayand partly indurated marl with some sand, red and brown phos-phorite and silica gravel, thin limestone, and a few poorly pre-served mollusk shells and impressions.
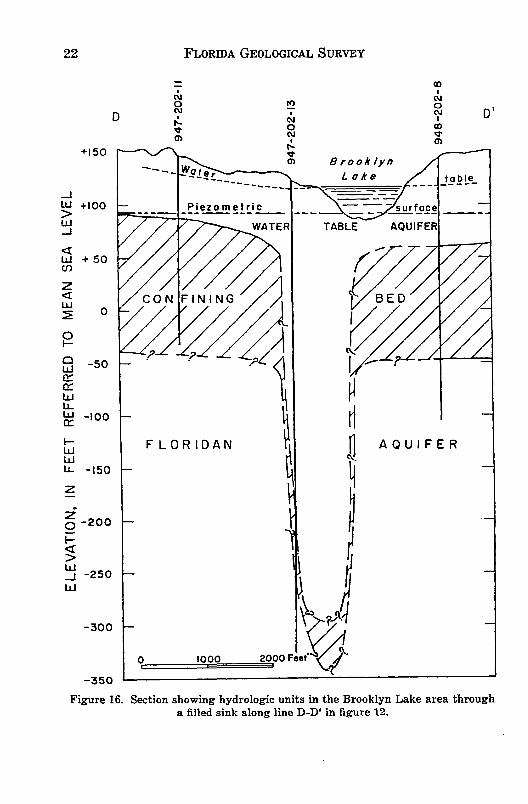
The water-table aquifer, as a composite of the above describedmaterials and formations ranged in thickness in test wells from50 to 85 feet. However, where deep filled sinks occur the aquiferis much thicker, as at the site of test well 947-202-13 (sectionD-D', fig. 16) where 319 feet of sediments were penetrated.
The sands that comprise the unnamed coarse elastic unit, themain part of the water-table aquifer, have a low to moderatepermeability owing to clay that is disseminated in the bed. Thepredominantly clayey Choctawhatchee Formation, though it con-tains a few permeable zones, will transmit only very small amountsof water.
Figure 17 shows the configuration of the base of the water-tableaquifer. Comparison of figure 17 with the contour map of thebottom of Brooklyn Lake (fig. 6) and figures 13, 14, 15, and 16shows that nearly everywhere the bottom of the lake is in thewater-table aquifer. The lake bottom generally lies from 15 to 25feet above the base of the aquifer. Only in its deepest parts doesthe lake bottom extend to or slightly below the base of the water-table aquifer.
Water in the water-table aquifer is unconfined so that itssurface is free to rise and fall. The water in the aquifer is derivedfrom local rainfall and from water that at times flows into theaquifer from lakes and perhaps from streams. The clayey sand orsandy clay layer in the upper part of the aquifer, shown in figure 13,does not prevent water from moving downward. While test wellswere being drilled near the lake, no water was found in the loosesand above this layer. Moreover, water placed in casings endingin the layer soon disappeared.
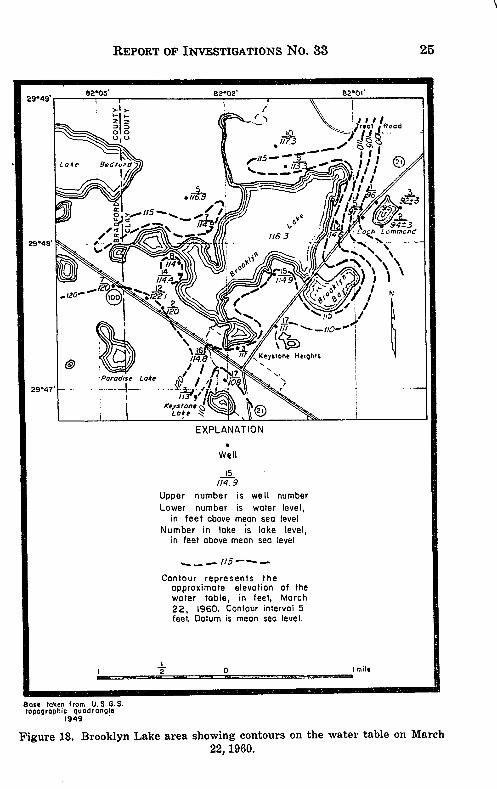
Figures 18 and 19 show the general configuration of the watertable on March 22 and October 17, 1960, respectively. The watertable and Brooklyn Lake on October 17 was higher than on March22. In general, the water table slopes toward the lake on thenorthern, northwestern, western, and southwestern sides of thelake and slopes away from the lake on the eastern and southeasternsides of the lake. In March, a trough existed in the water tablenear the lake on the northern and northwestern sides of the lake.

24 FLORIDA GEOLOGICAL SURVEY
S 82*03' 82*02' 8201'29.4 9 . -- ,--,---
Treat Road
Lake Bedfur_
474&87
0
S 0m / P ^ 'Keystone Heighs h Lommnd
w , i
referred to mean sea level
0 70- -
Dashed line represents inferredposition of contour. Contourinterval 10 feet. Datum is meansea level
Bse Kken from U. SH Ge S.topograhic quadrangie I__
1949 I 2 0oI mile
Figure 17. Brooklyn Lake area showing contours on base of the water-tableaquifer.aquifer.
REPORT OF INVESTIGATIONS NO. 33 25
299. 92
03' 82*02' 82'0
'
S7 .3 .0 ood
Lake Beo /t.d a
WillS/1
c I/e bLo h mmondQ9 I48' 00
oer14 nake is a lI-o. N. i
Contour r epresents the ighapproximte elevtion of the
2 / 9N7
EXPLANATION
15114.9
Upper number is well numberLower number is water level,
in feet above mean sea levelNumber in lake is lake level,
in feet above mean sea level
Contour represents theapproximate elevation thewater table, in feet, March
22, 1960. Contour interval 5feet. Datum is mean sea level.
i02 a mile
Base token from U. S.G.S.topographic quadrongle
1949Figure 18. Brooklyn Lake area showing contours on the water table on March
22, 1960.

26 FLORIDA GEOLOGICAL SURVEY
282*03' 82*02' 82*01'
D0 Treat Rood
>.1./ 6 7//
I U2117 / Loc Lommond
-1 115. 1• :;o>
4 / / 4
Keystone Heights 1
Para dis2 L a
"117
Upper number is well numberLower number is water level,
in feet above mean sea levelNumber in lake is lake level,
in feet. above mean sea level
water table, in feet, October17, 1960. Contour interval 5
Keystone
feet. Datum is mean sea level.
EXPLANATION
Bose thken from U S.G.5SoaograoOhic quadoangie
Well
1949
Upper number is well number
Figure 19. Brooklyn Lake area showing contours on the water levelable onin feet above mean se lev1960.
Number in ltke is lake level,in feet. above mean sea level
Contour represents theapproximate elevation of thewater table, in feet, October17, 1960. Contour interval 5feet. Datum is mean sea level.
1 2 I mile
Base taken from U-S.G.StopagraPhic quadrangle
1949
Figure 19. Brooklyn Lake area showing contours on the water table onOctober 17, 1960.
REPORT OF INVESTIGATIONS NO. 33 27
Also, a depression exists on the water table on the western sideof the lake.
Ground water moves downgradient in a direction at right anglesto the contours on the water table. Thus, in general, water in thewater-table aquifer moves toward the lake on the northern, north-western, western, and southwestern sides of the lake and from thelake on the eastern and southeastern sides. While the trough inthe water table on the northern and northwestern sides exists,however, water moves from the lake toward the trough. Also,water moves from the lake toward the depression in the water tableon the western side of the lake.
Some conditions under which water moves into the lake fromthe water-table aquifer and from the lake into the water-tableaquifer are illustrated by the movement of water in the aquiferat three sites near the lake.
The water levels in the wells and the contours north and north-west of the lake on the water table (fig. 18, 19) show that waterin the aquifer several hundred feet north and northwest of thelake moved toward the lake during the period March throughOctober 1960. However, near the lake as evidenced by the lowground-water levels, water moved from the lake into the aquifer.Before the rapid rise of the stage of the lake in 1959 (fig. 5),water probably moved into the lake in most places on the northand northwest sides of the lake.
The steepest slope of the water table toward the lake is on thesouthwestern side of the lake. On this side of the lake, watermoved from the lake into the aquifer in most places for a timeduring and after the rapid rise of the lake level (fig. 5), but aftera few months, water again began moving into the lake from theaquifer, except near well 947-202-13 where the confining bed hasbeen breached as shown on figure 16.
Some conditions under which water moves into the lake fromthe water-table aquifer and from the lake into the water-tableaquifer are illustrated by the movement of water in the aquifer atthree sites near the lake.
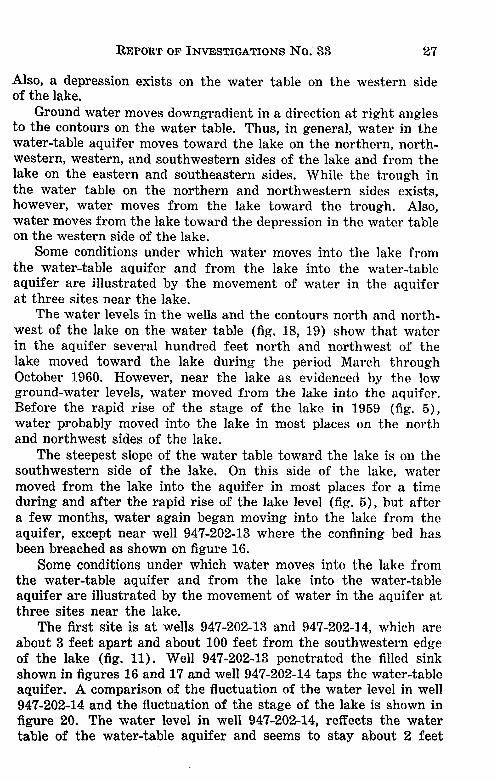
The first site is at wells 947-202-13 and 947-202-14, which areabout 3 feet apart and about 100 feet from the southwestern edgeof the lake (fig. 11). Well 947-202-13 penetrated the filled sinkshown in figures 16 and 17 and well 947-202-14 taps the water-tableaquifer. A comparison of the fluctuation of the water level in well947-202-14 and the fluctuation of the stage of the lake is shown infigure 20. The water level in well 947-202-14, reffects the watertable of the water-table aquifer and seems to stay about 2 feet
28 FLORIDA GEOLOGICAL SURVEY
- 118__ Brooklyn Lake
th 117
0 1160
-0
115
) -- Well 947-202-14S114 (Well tops water-
table aquifer about(D 100 feet southwest
Sof lake.)113113 Jan Feb Mar Apr May June July Aug Sept Oct INov Dec
1960Figure 20. Hydrographs of well 947-202-14 and Brooklyn Lake.
lower than the level of the lake. Thus, the water table slopes fromthe lake toward the filled sink, and accordingly water moves fromthe lake into the water-table aquifer in the vicinity of the filledsink shown in figures 16 and 17.
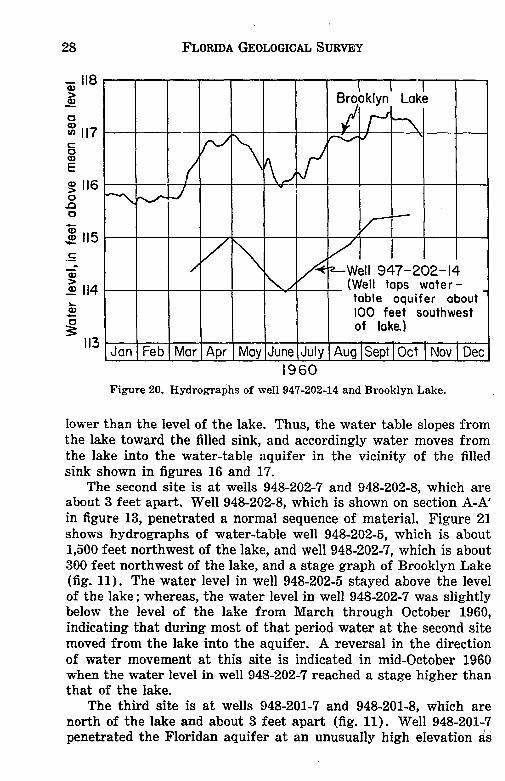
The second site is at wells 948-202-7 and 948-202-8, which areabout 3 feet apart. Well 948-202-8, which is shown on section A-A'in figure 13, penetrated a normal sequence of material. Figure 21shows hydrographs of water-table well 948-202-5, which is about1,500 feet northwest of the lake, and well 948-202-7, which is about300 feet northwest of the lake, and a stage graph of Brooklyn Lake(fig. 11). The water level in well 948-202-5 stayed above the levelof the lake; whereas, the water level in well 948-202-7 was slightlybelow the level of the lake from March through October 1960,indicating that during most of that period water at the second sitemoved from the lake into the aquifer. A reversal in the directionof water movement at this site is indicated in mid-October 1960when the water level in well 948-202-7 reached a stage higher thanthat of the lake.
The third site is at wells 948-201-7 and 948-201-8, which arenorth of the lake and about 3 feet apart (fig. 11). Well 948-201-7penetrated the Floridan aquifer at an unusually high elevation as
REPORT OF INVESTIGATIONS NO. 33 29
120
> Well 948-202-5- 119 (Well taps water-
o table aquifer about/U 1500 feet northwestc of lake.)
-117 -,
4sie- ---- * -/
--.- 116
S/ Well 948-202-7i 115 / - (Well taps water-'- table aquifer about
300 feet northwestof lake.)
Jon Feb Mar Apr May June July Aug Sept Oct Nov Dec1960
Figure 21. Hydrographs of wells 948-202-5 and 948-202-7, and Brooklyn Lake.
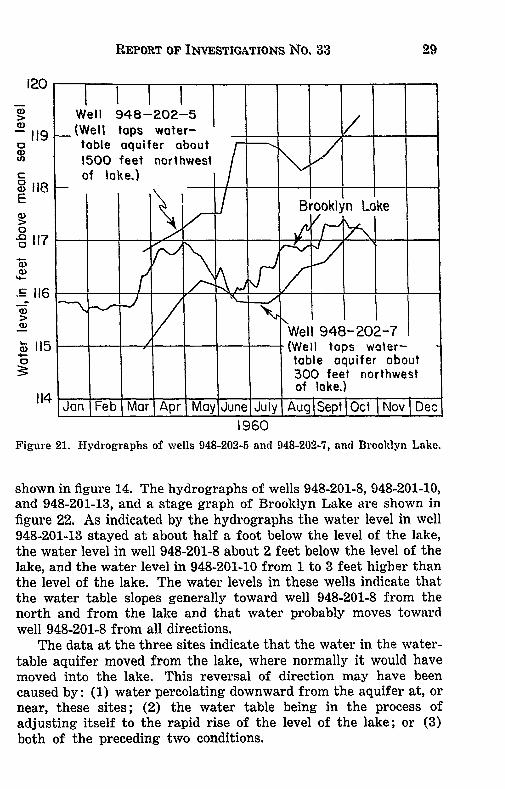
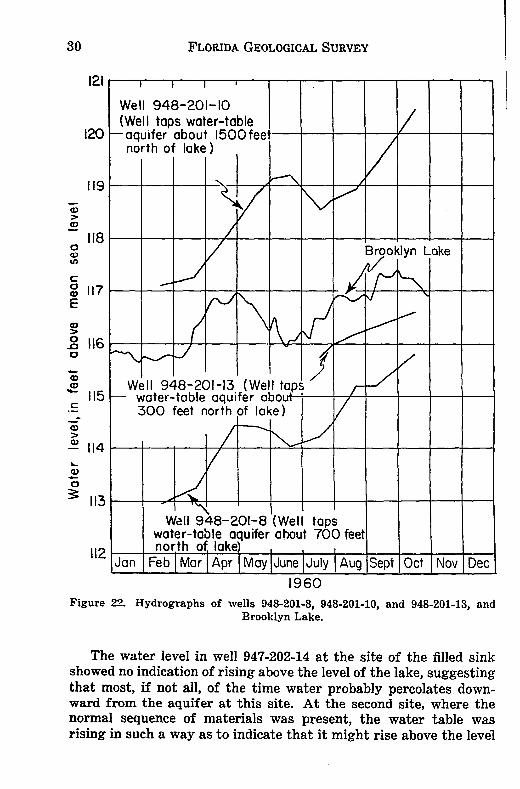
shown in figure 14. The hydrographs of wells 948-201-8, 948-201-10,and 948-201-13, and a stage graph of Brooklyn Lake are shown infigure 22. As indicated by the hydrographs the water level in well948-201-13 stayed at about half a foot below the level of the lake,the water level in well 948-201-8 about 2 feet below the level of thelake, and the water level in 948-201-10 from 1 to 3 feet higher thanthe level of the lake. The water levels in these wells indicate thatthe water table slopes generally toward well 948-201-8 from thenorth and from the lake and that water probably moves towardwell 948-201-8 from all directions.
The data at the three sites indicate that the water in the water-table aquifer moved from the lake, where normally it would havemoved into the lake. This reversal of direction may have beencaused by: (1) water percolating downward from the aquifer at, ornear, these sites; (2) the water table being in the process ofadjusting itself to the rapid rise of the level of the lake; or (3)both of the preceding two conditions.
30 FLORIDA GEOLOGICAL SURVEY
121 1 1 i
Well 948-201-10(Well taps water-table
120 -aquifer about 1500feetnorth of lake)
119- __-
118o Brooklyn Lake
g 117,c 117
-1 Well 948-201-13 (Well taps115 water-table aquifer about- -_
- 300 feet north of lake)
114
Well 948-201-8 (Well tapswater-table aquifer about 700 feet
11 1 3 north of lake) la eJan Feb Mar Apr May June July Aug Sept IOct I Nov Dec
1960Figure 22. Hydrographs of wells 948-201-8, 948-201-10, and 948-201-13, and
Brooklyn Lake.
The water level in well 947-202-14 at the site of the filled sinkshowed no indication of rising above the level of the lake, suggestingthat most, if not all, of the time water probably percolates down-ward from the aquifer at this site. At the second site, where thenormal sequence of materials was present, the water table wasrising in such a way as to indicate that it might rise above the level
REPORT OF INVESTIGATIONS No. 33 31
of the lake. The water table at this site, during the period Marchthrough October 1960, was probably in the process of adjustingitself to a higher stage of the lake. At the third site, where theFloridan aquifer extends to an unusually high elevation, the watertable was rising, but whether the water table would rise above thelevel of the lake is problematical. Water at this site probably waspercolating downward and the water table was probably adjustingitself to a higher level of the lake.
The relationship between water in the water-table aquifer andwater in the lake is complex. The movement of water in the aquifernorthwest of the lake at the second site, where the normal sequenceof materials is present below the surface, is probably typical of themovement of water around most of the lake. At the second sitewater moved from the lake into the water-table aquifer during mostof the period, March through October 1960. The normal directionof flow on the northern, northwestern, and southwestern sides ofthe lake is probably from the aquifer into the lake and was probablyreversed by the rapid rise in lake stage in 1959. The flow from thelake into the aquifer was accelerated on the eastern and south-eastern sides of the lake. This acceleration and the reversal offlow in some places around the lake are temporary conditions thatwill exist only while the water table is adjusting itself to a higherlevel of the lake. At other places near the lake, such as the firstsite at the location of the filled sink, water probably normally movesfrom the lake into the water-table aquifer and thence percolatesdownward.
CONFINING BED
Relatively impermeable deposits of the Hawthorn Formation ofMiocene age make up the confining bed. Limestone and dolomiticlimestone beds in the bottom part of the Hawthorn, however, donot belong to the confining bed but are a part of the Floridanaquifer. The confining bed locally includes secondary artesianaquifers. The confining bed is composed mostly of various shadesof green, gray, yellow, and blue phosphatic clay and sandy clay,containing sand and limestone lenses. The limestone lenses, whichrange in thickness from a few inches to about 6 feet, are gray,white and bluish gray, and are usually sandy and phosphatic.
In the southwestern half of the lake, which includes sectionsA-A' and D-D' (fig. 13, 16), the middle and lower parts of theconfining bed, in most places, contain a bed of tan and gray, fineto coarse, sand and clayey sand. The middle and lower part of the
32 FLORIDA GEOLOGICAL SURVEY
confining bed also contain some interbedded thin limestone layerswhose thickness, permeability and relative position within theconfining bed are variable. The sand is thickest and most permeablesouthwest of the lake. In well 947-202-11, shown on section D-D',figure 16, a thickness of 45 feet of fine to medium-grained sand andclayey sand was penetrated between depths of 135 and 180 feet,overlain by 75 feet of clay and limestone of the confining beds.
In the northeastern half of the lake, which includes sectionsB-B' and C-C' (fig. 14, 15), the confining bed is composed mostlyof relatively "tight" clay and limestone. The limestone containssmall cavities and, together with thin bedded sands, forms zones ofrelatively high permeability within the clay beds.
The confining bed is thinnest in the northeastern part at thesite of test well 948-201-7 (section B-B',, fig. 14) where only about30 feet of clayey materials that comprise the bed overlie theFloridan aquifer. The greatest thickness of the confining bed was120 feet in test well 947-202-11. The maximum thickness of theconfining bed in the Brooklyn Lake area is estimated to be about130 feet.
The confining bed is ordinarily the hydraulic barrier thatseparates the water-table aquifer from the Floridan aquifer.Although the bed is not completely impermeable, the verticalpermeability of the bed is low and it will normally pass onlycomparatively small amounts of water. However, in the vicinityof Brooklyn Lake at two sites where test wells were drilled, waterprobably moves through the confining bed relatively easily. Thesetwo sites are at wells 947-202-13 and 948-201-7. Well 947-202-13was drilled into a filled sink (fig. 16) and at the site of well948-201-7 the confining bed is thin. At other sites around the lakeand beneath the lake, similar conditions probably exist.
FLORIDAN AQUIFER
The Floridan aquifer below the confining bed consists from topto bottom, of limestone in the bottom part of the Hawthorn For-mation and limestone, dolomite, and dolomitic limestone informations of Eocene age that include the Ocala Group, the AvonPark Limestone, the Lake City Limestone, and, in part, the OldsmarLimestone. Nine wells shown on figure 11, 947-201-1, 2, and 4;947-202-13 and 18; 948-201-1, 2, and 7; and 948-202-8 penetratethe Floridan aquifer. The deepest penetration of the aquifer, bywell 948-201-1 (section B-B', fig. 14), is to the approximate base ofthe Ocala Group at 262 feet below mean sea level.
REPORT OF INVESTIGATIONS NO. 33 33
Wells drilled into the Floridan aquifer usually penetrate a tanto gray or brown, very hard limestone or dolomitic limestone of theHawthorn Formation at the top of the aquifer. Interbedded withthe hard limestones in the lower part of the Hawthorn are claysand thin sand lenses, the unit being about 25 feet thick. Beneaththe limestones and clays of the Hawthorn is the Ocala Group, whichis about 210 feet thick and composed predominantly of white andcream, soft, fossiliferous limestones. The underlying Avon ParkLimestone, estimated to be about 210 feet thick, the Lake CityLimestone more than 450 feet thick, and the lowermost Floridanunit, the Oldsmar Limestone which is of undetermined thickness,are composed of a series of dolomite, limestone, and dolomiticlimestone beds. Limestone of the Hawthorn Formation is relativelyimpermeable, that of the Ocala Group is highly permeable, and thelimestone of the Avon Park, Lake City, and Oldsmar Limestones ismoderately to highly permeable.
Results of test drilling near Brooklyn Lake show that theFloridan aquifer probably had been breached. At test well947-202-13 (fig. 16) the Floridan aquifer has been breached by acollapse of the underlying Eocene limestone. The breach has beenfilled with sediments of the confining bed and the water-tableaquifer.
At test well 948-201-7 (fig. 14) where the Floridan aquifer is atan unusually high elevation, the Floridan aquifer and the confiningbed seems to be breached. During the drilling of well 948-201-7,the water level rose to an elevation that corresponded to the eleva-tion of the Floridan piezometric surface when the drill had pene-trated only 30 feet of the confining bed at a depth of 96 feet belowthe land surface. The relatively thin 30-foot layer of clayey sedi-ments of the confining bed that here separates the Floridan aquiferfrom the water-table aquifer is apparently underlain by about 54feet of materials that normally would be a part of the confining bedbut instead are hydrologically a part of the Floridan aquifer. Theapparent breaching of the beds in well 948-201-7 that has allowedthe hydrologic connection with the confining bed does notnecessarily involve collapse as in well 947-202-13 but might beattributed to the displacement of the beds by faulting or fracturing.
Three conditions must exist if Brooklyn Lake is to leak sub-stantial amounts of water to the Floridan aquifer: (1) thepiezometric surface or the pressure head in the Floridan aquifermust be below the level of the lake; (2) a relatively permeableroute from the lake to the Floridan aquifer must exist; and, (3) the
34 FLORIDA GEOLOGICAL SURVEY
Floridan aquifer must be capable of transmitting the leaked waterto other areas.
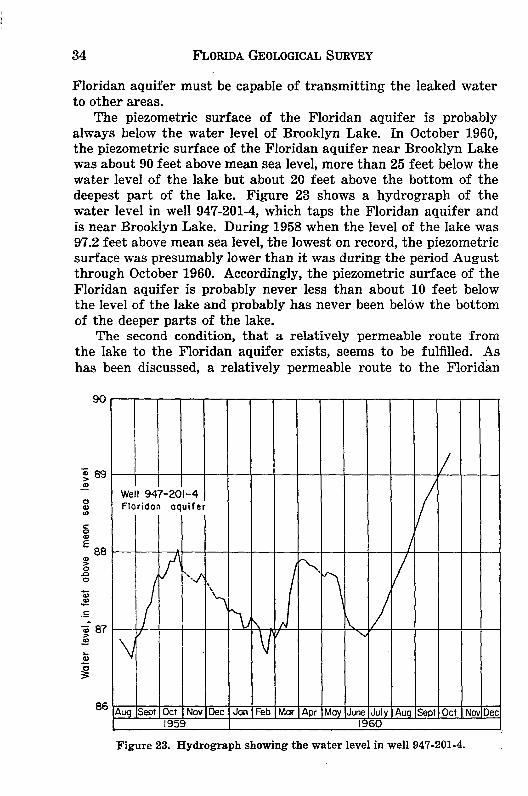
The piezometric surface of the Floridan aquifer is probablyalways below the water level of Brooklyn Lake. In October 1960,the piezometric surface of the Floridan aquifer near Brooklyn Lakewas about 90 feet above mean sea level, more than 25 feet below thewater level of the lake but about 20 feet above the bottom of thedeepest part of the lake. Figure 23 shows a hydrograph of thewater level in well 947-201-4, which taps the Floridan aquifer andis near Brooklyn Lake. During 1958 when the level of the lake was97.2 feet above mean sea level, the lowest on record, the piezometricsurface was presumably lower than it was during the period Augustthrough October 1960. Accordingly, the piezometric surface of theFloridan aquifer is probably never less than about 10 feet belowthe level of the lake and probably has never been below the bottomof the deeper parts of the lake.
The second condition, that a relatively permeable route fromthe lake to the Floridan aquifer exists, seems to be fulfilled. Ashas been discussed, a relatively permeable route to the Floridan
90
I 89
Well 947-201-4C Floridan aquifer
E 88(DN
- 87
86 AugSept Oct Nov Dec Jan Feb Mar Apr May June July Aug Sept Oct Nov Dec1959 1960
Figure 23. Hydrograph showing the water level in well 947-201-4.
REPORT OF INVESTIGATIONS NO. 33 35
aquifer apparently exists at the site of well 947-202-13, which isat the site of a filled sink, and at well 948-201-7, which is at a sitewhere the confining bed is thin and the Floridan aquifer extends toan unusually high elevation.
The third condition, that the Floridan aquifer be capable oftransmitting large amounts of water away from the lake, seemsto be fulfilled also. The capability of the aquifer to transmit wateris demonstrated by the ease with which large amounts of water arereleased to wells tapping the aquifer. Although no figures for thetransmissibility, a measure of the ease with which the aquifertransmits water, are available for the Brooklyn Lake area, thetransmissibility is probably more than 100,000 gpd (gallons perday) per foot.
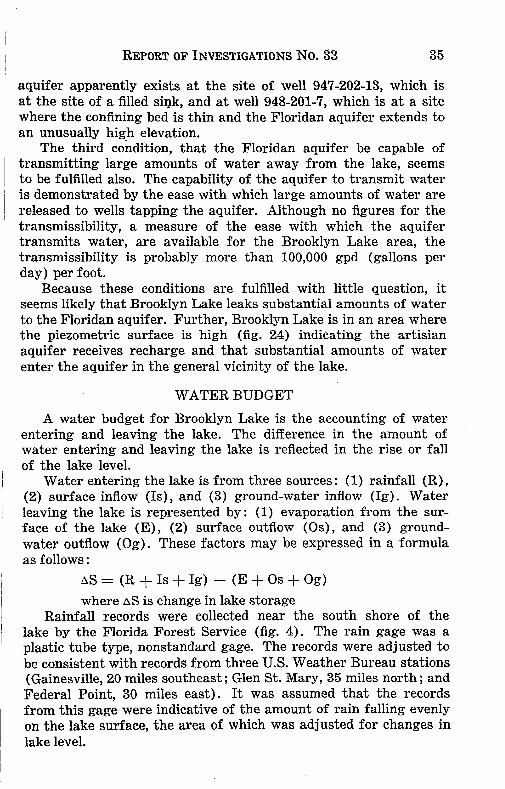
Because these conditions are fulfilled with little question, itseems likely that Brooklyn Lake leaks substantial amounts of waterto the Floridan aquifer. Further, Brooklyn Lake is in an area wherethe piezometric surface is high (fig. 24) indicating the artisianaquifer receives recharge and that substantial amounts of waterenter the aquifer in the general vicinity of the lake.
WATER BUDGET
A water budget for Brooklyn Lake is the accounting of waterentering and leaving the lake. The difference in the amount ofwater entering and leaving the lake is reflected in the rise or fallof the lake level.
Water entering the lake is from three sources: (1) rainfall (R),(2) surface inflow (Is), and (3) ground-water inflow (Ig). Waterleaving the lake is represented by: (1) evaporation from the sur-face of the lake (E), (2) surface outflow (Os), and (3) ground-water outflow (Og). These factors may be expressed in a formulaas follows:
AS = (R + Is + Ig) - (E + Os + Og)
where AS is change in lake storageRainfall records were collected near the south shore of the
lake by the Florida Forest Service (fig. 4). The rain gage was aplastic tube type, nonstandard gage. The records were adjusted tobe consistent with records from three U.S. Weather Bureau stations(Gainesville, 20 miles southeast; Glen St. Mary, 35 miles north; andFederal Point, 30 miles east). It was assumed that the recordsfrom this gage were indicative of the amount of rain falling evenlyon the lake surface, the area of which was adjusted for changes inlake level.
36 FLORIDA GEOLOGICAL SURVEY
10' 05' 82*00'
55'
- /C ,o 9 hnson -- 50I 16 " o 8uke
S1 ond Hi
5 - \O I C O LoeLakeLokeSI a) Jonson
2940' O r I 2 4 ees n 940'
0k 05' 8 'O*0' 55'
EXPLANATIONWell
87_ 3Upper number is well number.Lower number is water level,
in feel above mean sea level.
Contour represenls the approximate
4elevtion of the pieometri c urface,4
Fe 93:5 -pUTNLA.M CO.
In feet above mean sea level. Contourinterval 5 feelt
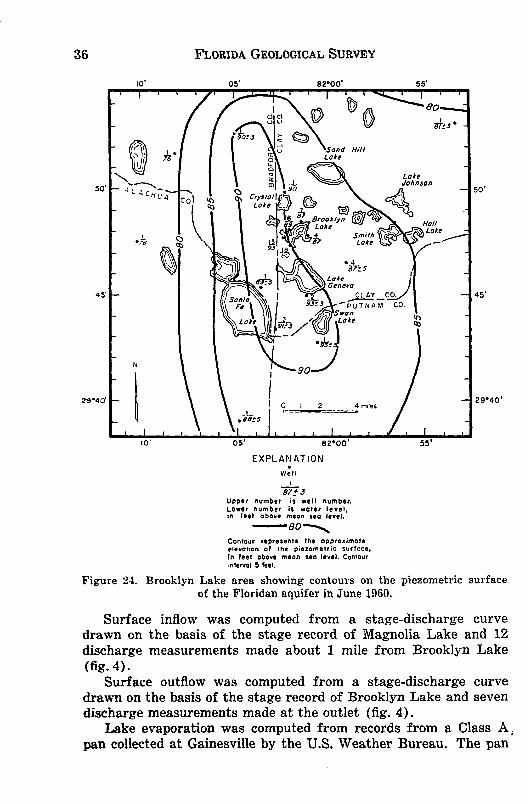
Figure 24. Brooklyn Lake area showing contours on the piezometric surfaceof the Floridan aquifer in June 1960.
Surface inflow was computed from a stage-discharge curvedrawn on the basis of the stage record of Magnolia Lake and 12
29'40' 2 9
*40
'
discharge measurements made about 1 mile from Brooklyn Lake
10' 05' 82'00' 55'
EXPLANATION
Well
Si _
Upper number is well number.Lower number is woter level,
(fig. 4).
Surface outflow was computed from a stage-discharge curvelevel.
drawn on the basis of the stage record of Brooklyn Lake and seven
Codischarge measurements made atpre the outlet (fig. 4).
elevolion of the piezometric surfoce,In feet above mean sea level. Contourinterval 5 feet.
Figure 24. Brooklyn Lake area showing contours on the piezometric surfaceof the Floridan aquifer in June 1960.
Surfae evaporation was computed from a stagrecrds from a Class Aurvedran colleted at Gainesvill of the by the U.S. Weather Bureau. Threcord of Magnolia Lake and 12
discharge measurements made about 1 mile from Brooklyn Lake(fig. 4).
Surface outflow was computed from a stage-discharge curvedrawn on the basis of the stage record of Brooklyn Lake and sevendischarge measurements made at the outlet (fig. 4).
Lake evaporation was computed from records from a Class A,pan collected at Gainesville by the U.S. Weather Bureau. The pan
REPORT OF INVESTIGATIONS NO. 33 37
evaporation was about 67.04 inches for the 1958 water year; about61.50 inches for the 1959 water year; and about 66.49 inches forthe 1960 water year. Records from the Class A pan were adjustedby monthly coefficients developed for the period 1940-46 for LakeOkeechobee, Florida, by Kohler (Kohler, M. A., 1954, Water lossinvestigations: Lake Hefner Studies, Technical Report: U.S. Geol.Survey Prof. Paper 269, p. 128.) These coefficients ranged from0.69 for February to 0.91 for July and August. The mean annualcoefficient was 0.81. Adjustments in evaporation were made totake account of the variation in lake surface due to changes in lakelevel.
Changes in lake storage were computed from the stage-storagecurve given in figure 8. Data used to develop the stage-storagecurve and the depth-contour map given in figure 6 were collectedwith a sonic depth recorder.
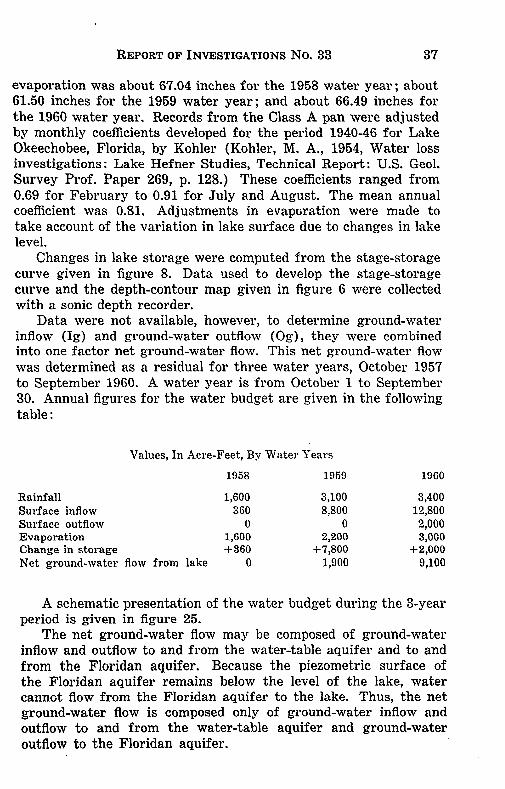
Data were not available, however, to determine ground-waterinflow (Ig) and ground-water outflow (Og), they were combinedinto one factor net ground-water flow. This net ground-water flowwas determined as a residual for three water years, October 1957to September 1960. A water year is from October 1 to September30. Annual figures for the water budget are given in the followingtable:
Values, In Acre-Feet, By Water Years
1958 1959 1960
Rainfall 1,600 3,100 3,400Surface inflow 360 8,800 12,800Surface outflow 0 0 2,000Evaporation 1,600 2,200 3,000Change in storage +360 +7,800 +2,000Net ground-water flow from lake 0 1,900 9,100
A schematic presentation of the water budget during the 3-yearperiod is given in figure 25.
The net ground-water flow may be composed of ground-waterinflow and outflow to and from the water-table aquifer and to andfrom the Floridan aquifer. Because the piezometric surface ofthe Floridan aquifer remains below the level of the lake, watercannot flow from the Floridan aquifer to the lake. Thus, the netground-water flow is composed only of ground-water inflow andoutflow to and from the water-table aquifer and ground-wateroutflow to the Floridan aquifer.
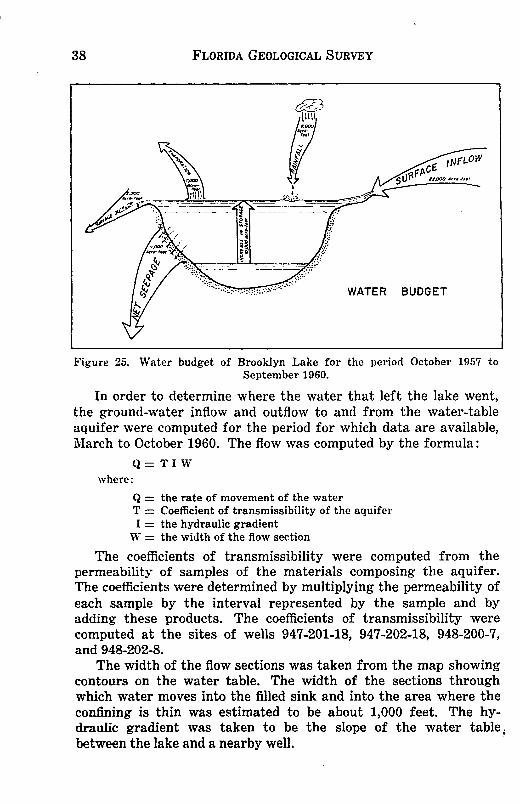
38 FLORIDA GEOLOGICAL SURVEY
WNFLOWISFAF
.. :'"' WATER BUDGET
Figure 25. Water budget of Brooklyn Lake for the period October 1957 toSeptember 1960.
In order to determine where the water that left the lake went,the ground-water inflow and outflow to and from the water-tableaquifer were computed for the period for which data are available,March to October 1960. The flow was computed by the formula:
Q= TIWwhere:
Q = the rate of movement of the waterT = Coefficient of transmissibility of the aquiferI = the hydraulic gradient
W = the width of the flow section
The coefficients of transmissibility were computed from thepermeability of samples of the materials composing the aquifer.The coefficients were determined by multiplying the permeability ofeach sample by the interval represented by the sample and byadding these products. The coefficients of transmissibility werecomputed at the sites of wells 947-201-18, 947-202-18, 948-200-7,and 948-202-8.
The width of the flow sections was taken from the map showingcontours on the water table. The width of the sections throughwhich water moves into the filled sink and into the area where theconfining is thin was estimated to be about 1,000 feet. The hy-draulic gradient was taken to be the slope of the water tablebetween the lake and a nearby well.
REPORT OF INVESTIGATIONS No. 33 39
The movement of water into the lake, and from the lake,through the water-table aquifer was estimated for monthly inter-vals for the period March through October 1960. During thisperiod about 70 acre-feet of water was estimated to have movedinto the lake from the water-table aquifer on the southwesternside of the lake and about 200 acre-feet was estimated to have leftthe lake on the eastern side of the lake. During this period about400 acre-feet more water was estimated to have left the lake thanentered the lake through the water-table aquifer.
The lateral movement of water through the water-table aquiferfrom Brooklyn Lake, during the period March through October1960, was computed to be less than 10 percent of the loss to theaquifers. Therefore, most of the net ground-water flow from thelake was to the Floridan aquifer.
The net ground-water outflow, most of which was outflow to theFloridan aquifer, was the largest loss from the lake. The netground-water outflow was zero during the 1958 water year when thelake was low, and increased rapidly during 1959 and 1960 as thelake surface rose. The increase in the net ground-water outflowas the level of the lake rose may be accounted for by: (1) a decreasein inflow from and an increase in outflow to the water-table aquifer;and (2) an increase in outflow to the Floridan aquifer.
When the level of the lake was low, undoubtedly the flow to theFloridan aquifer was least; the inflow from the water-table aquiferwas probably more, and the outflow less. The outflow to theFloridan aquifer is related to the difference in head between thelake level and the piezometric surface of the Floridan aquifer. Anexact relation between the head difference and the outflow to theFloridan aquifer could not be determined. The difference in headwas undoubtedly much less in 1958 than it was in 1960. The inflowfrom the water-table aquifer was probably larger when the lakewas low because the gradient of the water table to the lake wasprobably greater. Likewise, the outflow was probably less becausethe gradient was probably smaller. Thus, the amount of inflowrequired to maintain the lake at a high stage is greater than thatrequired to maintain the lake at a low stage.
METHODS OF CONTROLLING BROOKLYN LAKE
Both high and low stages must be considered in any plan tocontrol Brooklyn Lake. The problem is to prevent the stage fromfalling below or rising above desirable levels. Additional waterdiverted into the lake to supplement the natural inflow would

40 FLORIDA GEOLOGICAL SURVEY
prevent critically low stages, but if allowed to remain during periodsof high water, could overtax the conveyance of the natural outletchannel and cause flooding. Conversely, if the outlet channel waslowered and its capacity increased to carry off more water andprevent flooding, lake storage would be reduced and additionallowering of the lake during periods of deficient rainfall wouldresult. A detailed engineering study would be required to determinethe overall feasibility and cost of controlling the lake and to workout the details of hydraulics. The following is a general discussionof several possibilities for controlling the lake.
Low lake stages have created more serious problems in recentyears than have flood stages. The extremely low stages that existedin 1957-59 were brought about because the rate of movement ofwater from the lake exceeded the rate at which it was entering thelake from rainfall and surface inflow. The solution to the problemwould then seem to be to retard the losses or increase the inflow.
The water budget analysis indicates that water is removed fromthe lake by the following processes and in the following proportions:surface outflow, 10 percent; evaporation, 35 percent; and the netground-water outflow, 55 percent. The amount flowing through thesurface outlet is the only one that could be reasonably retarded.However, the control of the surface outflow would not solve theproblem of low lake levels as outflow occurs only at high stages. Infact, surface outflow is then necessary as a relief measure toprevent flooding. Reduction of seepage and evaporation losses isnot easily accomplished and probably not feasible. Therefore,measures other than preventing the usual natural water lossesmust be considered.
Increasing inflow is a possible method by which Brooklyn Lakecould be prevented from falling below a desired level. In consideringthis method of control, the amount and source of supplementalinflow need to be determined.
Lake storage was reduced about 10,000 acre-feet during therecession of lake levels that ended in 1958. It is reasonable toassume that the period of this recession coincided with the 31-yearperiod of deficient rainfall. Therefore, a reduction in lake storageof 10,000 acre-feet during a 31/-year period is equivalent to anaverage rate of about 4 cubic feet per second, which is the averagerate of loss and the apparent minimum rate of supplemental inflowneeded to prevent such a recession. However, the greater differencein head between the lake surface and ground-water level that would.be induced by control measures could cause a substantial increase

REPORT OF INVESTIGATIONS NO. 33 41
in the rate of seepage to the ground, which would increase the in-flow requirements necessary to hold the lake at a constant level.Also, the greater average lake surface brought about by the higheraverage lake stage would increase the evaporation. The increasein evaporation would be essentially offset by the evaporation on thelarger lake surface. Though the exact rate of inflow needed to holdthe lake at a higher level is uncertain, any amount would be helpful.
Three possible ways in which additional water may be providedto Brooklyn Lake are: (1) by pumping from the Floridan aquifer;(2) by increasing the storage capacity of the lakes that areconnected by channels above Brooklyn Lake (fig. 3); and, (3) bydiverting water from Santa Fe Lake. A study would be necessaryto determine the feasibility and cost of these methods and to de-termine the effects that each of these methods would have on therelated bodies of water.
Enough water may be pumped from the Floridan aquifer tostabilize the level of the lake if the pumping of water from theaquifer does not induce appreciable increases in leakage. Theleakage from the lake is proportional to the head difference betweenthe lake and the Floridan aquifer. The pumping of water from theaquifer will create a cone of depression in the piezometric surface.If the cone of depression extends to where the lake leaks, it willcreate an additional head difference between the lake and theaquifer. Thus, the downward flow of water to the Floridan aquiferwould increase and, in effect, part of the water pumped would becirculated.
The amount of additional leakage that will be induced bypumping from the Floridan aquifer was not studied. The greaterthe distance of the pumped wells from the lake the less additionalleakage the pumping will induce. If, however, the water from thelake leaks into an extensive system of solutional channels, such asmight be expected where large quantities of water enter a limestoneaquifer, the pumping of water from wells may induce only smallamounts of additional leakage from the lake. Accordingly, it maybe feasible to supply the lake with the needed water by pumpingfrom wells located at strategic sites adjacent to the lake.
Magnolia Lake (average surface area, 0.31 sq. mi.), SandhillLake (average surface area 1.95 sq. mi.), and Blue Pond (averagesurface area, 0.31 sq. mi.) are at higher elevations than BrooklynLake and are connected by channels. Storage in these upper lakesmay be increased by low-head controls in the outlet channels. Thecombined area of these three lakes in 2.57 square miles compared

42 FLORIDA GEOLOGICAL SURVEY
to the 1.00 square mile area of Brooklyn Lake. These lakes wouldsupply only a relatively small amount of water.
Another possible source of supply is Santa Fe Lake which is inin the headwaters of the Santa Fe River basin, the adjoining basinwest of Brooklyn Lake. Santa Fe Lake has a surface area of 8.05square miles and had a range in stage of 4.2 feet from 1957 to 1960.Santa Fe Lake fluctuated through a range in stage of only 4.2 feetduring the period August 1957 to December 1960 while BrooklynLake fluctuated through a range of 20 feet (fig. 5, 26). The stageof Santa Fe Lake is higher than that of Brooklyn Lake by about40 feet at low stages and about 25 feet at high stages. The map infigure 2 shows possible location of a diversion canal from Santa FeLake to Brooklyn Lake. The canal would extend from the northeastend of Little Santa Fe Lake through Silver Lake and Mid Lake andinto the westernmost end of Brooklyn Lake. A profile showingelevations from Santa Fe Lake to Brooklyn Lake, and a stage depthgraph of Santa Fe Lake, are given in figure 26.
STAGE OF SANTA FE LAKE
95 958 t959 1960
5 4. - -- -__ ---
- ~ \
,, .. ' .\ . I "C, -
0 1 2 3DISTANCE, IN MILES
Figure 26. Stage graph of Santa Fe Lake and profile from Santa Fe Lake toBrooklyn Lake.
REPORT OF INVESTIGATIONS NO. 33 43
The methods suggested herein for controlling the stage ofBrooklyn Lake have been based on the hydrologic data that havebeen collected for this study. Additional detailed engineeringstudies will be required to determine the most feasible method andto prepare plans for the construction and operation of any struc-tures that are required.
CONCLUSIONS
Brooklyn Lake receded about 20 feet during the period 1955-58.This period of recession coincided with, and was a direct result of,a period of deficient rainfall. Rainfall was deficient by nearly 23inches during this period. The lack of rainfall upset the hydrologicbalance that normally keeps the lake stage from falling, and allowedthe rate of loss from the lake to far exceed the rate ofreplenishment.
The lake's source of replenishment is rain that falls directly onthe lake surface and surface inflow from Magnolia Lake. Duringprolonged periods of deficient rainfall surface inflow ceases, whichwas the case during 1955-58. The lake received about twice asmuch water from the surface inflow as it did from rain directly onthe lake surface during the 3-year period covered by this report.
Water leaves the lake through evaporation, surface outflow, andseepage. From October 1957 to September 1960, seepage was by farthe greatest loss, accounting for 55 percent of all losses, or anaverage of more than 3 mgd. Evaporation took 35 percent, andsurface outflow took 10 percent, of the total loss.
To prevent Brooklyn Lake from falling below a desirable stageduring prolonged periods of deficient rainfall it will be necessary todivert water into the lake from other sources. Three possible waysto divert water into the lake are: (1) by pumping from the Floridanaquifer; (2) by increasing the storage in the three upper lakesduring periods of excess rainfall and releasing it to Brooklyn Lakewhen needed; and (3) by diversion from Santa Fe Lake. Carefuland thorough engineering studies should precede the adoption ofany of these methods or any combination of them.
-FLORIDA-GEOLOGICAL-SURVEY
COPYRIGHT NOTICE© [year of publication as printed] Florida Geological Survey [source text]
The Florida Geological Survey holds all rights to the source text ofthis electronic resource on behalf of the State of Florida. TheFlorida Geological Survey shall be considered the copyright holderfor the text of this publication.
Under the Statutes of the State of Florida (FS 257.05; 257.105, and377.075), the Florida Geologic Survey (Tallahassee, FL), publisher ofthe Florida Geologic Survey, as a division of state government,makes its documents public (i.e., published) and extends to thestate's official agencies and libraries, including the University ofFlorida's Smathers Libraries, rights of reproduction.
The Florida Geological Survey has made its publications available tothe University of Florida, on behalf of the State University System ofFlorida, for the purpose of digitization and Internet distribution.
The Florida Geological Survey reserves all rights to its publications.All uses, excluding those made under "fair use" provisions of U.S.copyright legislation (U.S. Code, Title 17, Section 107), arerestricted. Contact the Florida Geological Survey for additionalinformation and permissions.