hydropedology of problematic … hydropedology of problematic interfluve transported soils in the...
TRANSCRIPT

1
HYDROPEDOLOGY OF PROBLEMATIC INTERFLUVE TRANSPORTED SOILS IN
THE CENTRAL PIEDMONT OF VIRGINIA
Erik D. Severson1
ABSTRACT
Transported soils have been mapped and observed in upland landform positions throughout
Virginia’s central and western Piedmont. Over 145,000 ha of transported soils on interfluves have
been recognized in just the central Virginia Piedmont. The soils of focus in this study were the
Appomattox and the Mattaponi soil series that both contain reticulate mottling patterns and form
perched water tables (PWT). These problematic soils occur throughout the mid-Atlantic Piedmont
and therefore their associated interpretations are a province-wide phenomenon and not a localized
occurrence. They are problematic because the soil morphology is difficult to interpret with respect
to their depth of seasonal saturation and septic systems installed into these soils may fail
prematurely. Understanding the water table dynamics of these soils would aid in the interpretation
process used by onsite septic system evaluators to make sound land use decisions.
INTRODUCTION
Onsite wastewater disposal systems (OWDS) are commonly referred to as septic systems and are
designed to treat and dispose of wastewater. It is estimated that over 1.1 million OWDSs are
installed in Virginia alone (Marcellis, 2009). Between 25 and 40 % of Virginians rely on OWDSs
(EPA, 2002). Basic components of a typical OWDS are the source of wastewater, the septic tank,
the dispersal system, and the soil. Wastewater produced by the home flows into the septic tank.
Solids settle to the bottom of the tank and the liquid portion of the waste is termed septic tank
effluent (STE). The STE flows into the drainfield and ultimately into the soil.
Onsite wastewater disposal systems in the Central Virginia Piedmont which are installed
into soils with restrictions may aid to the premature OWDS failure. Failure of OWDS is defined
in Virginia in several ways including sewage backup into the household, surface seepage of septic
tank effluent (STE) and contamination of groundwater. Failures of OWDS occur for multiple
reasons, but often due to their installation into unsuitable soils. Impeded internal drainage may
result in a perched water table (PWT) which, at the time of its presence would preclude additional
hydraulic load of STE and would cause STE to encroach the surface.
Perched Water Tables (PWT)
A PWT is defined as a layer of saturated soil separated from the underlying local water table by a
layer of unsaturated soil (Soil. Sci. Soc. Am., 2008). Soil saturation is usually defined by the
presence of free water which is not under measureable tension (Soil Survey Staff, 1999). The
upper level in the ground where water pressure is equal to atmospheric pressure is referred to as
the water table (Soil Sci. Soc. Am., 2008). The water table can be envisioned by a below ground
surface where the soil is saturated. The water table usually moves down gradient. A PWT formed
as a result of a subsurface limiting layer and produces local episaturation conditions similar to
those shown by Figure 1-1.
1 Erik D. Severson, Soil Scientist, Virginia Tech, 1502 Williamson Rd. 2nd Floor, Roanoke VA 24012 [email protected]

2
Figure 1-1. Example of a red problematic Piedmont soil with perched water above a hydraulically
limiting layer at 75 to 105cm. Photo by: Jarred Hubbard
Perched zones of soil saturation are ordinarily only observed seasonally, developing in the cooler
autumn months and persisting through the winter and into the spring. This is in response to
decreased evapotranspiration rates when air temperatures are low and plant growth and associated
water uptake slows or ceases. These events may be important in the transport of dissolved or
suspended chemicals. Soils with PWTs usually have moderately permeable horizons overlying
layers with slow or very slow permeability. Permeability is the relative ease to which gasses,
liquids, and plant roots pass through a layer of soil. The flow of downward percolating water is
retarded by the restrictive horizon, thus causing water to mound at the restriction interface with
the overlying permeable materials (Daniels and Fritton, 1994), and the water is then forced to move
laterally (Reuter, 1998; Shaw et al., 2001). The rate of lateral flow is primarily controlled by
gradient of the land surface, the topography of the restrictive layer (Jenkinson and Franzmeier,
1996), and the permeability of the materials above the restricting layer. Lateral flow results in a
range of potential fates of STE on the landscape (Figure 1-2). Soils without a restrictive horizon
allow for the unimpeded downward percolation of liquids from the OWDS trench bottoms into the
regional groundwater table.
Seasonal High Water Table Determinations
Determination of the depth to a seasonal high water table (SHWT) is a regulatory requirement of
an on-site septic system soil evaluation in Virginia according to the 2012 Sewage Handling and
Disposal Regulations (SDHR, 2012). The minimum required vertical distance from the bottom of
the drainfield trenches to a soil limitation such as an impermeable layer, bedrock, or groundwater
is 46 cm (SDHR, 2012). The SHDR define the “seasonal water table” as that portion of the soil
profile where a color change has occurred in the soil as a result of saturated soil conditions.
Determining the characteristics which indicate soil saturation is difficult to ascertain in the

3
problematic transported soils in the central Piedmont. Figure 1-2 shows the aerobic soil
underneath drainfield trenches needed to renovate wastewater before it reaches groundwater
supplies.
Groundwater
Well
Aerobic soil
Figure 1-2. Graphic showing aerobic soil required underneath drainfield trenches.
Morphologic indicators of problematic transported soils
A defining characteristic of both red and non-red problematic capping is a reticulate or netlike
mottling color pattern. When the horizontal component of the mottling is usually more pronounced
over the vertical component, the pattern is called laminar. These layers are typically characterized
by firm to very firm moist consistence and very sticky wet consistence. They often have platy
primary structures, high bulk densities, and RMFs found both in and above these hydraulically
limiting layers (Elder and Pettry, 1969b, Wilson et al., 1983). These dense layers are associated
with low porosity and discontinuities and can pose drainage problems such as perched water tables
(PWTs) which can affect land use interpretations and management. The reticulated and laminar
color patterns are shown in figure 1-3 below.
Figure 1-3. Laminar RMF pattern in non-red soil (left) and reticulate RMF (right) in a red soil.

4
RESEARCH OBJECTIVES
The overall hypothesis of this study was that the red and yellow mottling, as described in the
SHDR, represents active RMFs which are indicative of present-day fluctuating water tables.
Misinterpretation of the wetness regimes in these soils can lead to erroneous land use assessments
and potential groundwater contamination. This research can promote improved OWDS design,
resulting in better functioning and longer lasting septic systems. Specific research objectives were
to:
1. Characterize soil morphology and related soil properties of selected soils at the
experimental sites across the central Piedmont.
2. Correlate the relationship between frequency, depth and duration of soil saturation and
redoximorphic features and/or pattern.
3. Determine if epiaquic conditions are present by monitoring saturation within and
underneath the transported materials.
4. Assess differences between the saturation of residual vs. transported soils by monitoring
nearby residual soils on comparable landscapes and land uses at each site.
MATERIALS AND METHODS
Site descriptions
Eight experimental sites were chosen for study of both red and non-red interfluve capping soils of
the Central Virginia Piedmont. Each site contained residuum at varying depths weathered from
felsic rocks, typically micaceous schist. They are located in Appomattox, Bedford, Buckingham,
Campbell, and Nottoway Counties. The sites contained the following Soil Series; Appomattox,
Bentley, Brockroad, Catharpin, and Dothan and met the following criteria: 1) contained >1 m of
well transported material overlying felsic residuum; 2) unmodified drainage; 3) on broad
interfluves with minimal dissection; 4) not associated with modern river terraces; and 5) not
located in Triassic Basins. Figure 1-4 shows site locations in Virginia.
Figure 1-4. Yellow pins indicating site locations in central Virginia. Source: Google
Earth.

5
Field methods Hydrology at each site was recorded over a three year period via an array of data loggers housed
in wells and piezometers. There were two locations within the sites selected for detailed water
level monitoring; i) colluvial soils in an open canopy; and ii) residual soils on the same general
landscape. At the first location within a site, piezometers and wells were placed above and below
suspected perching layers (Figure 3-1), and in the underlying residuum. Wells installed below
suspected perching layers were sealed off with bentonite clay. Sites instrumented with automated
wells were visited periodically for data retrieval. Each automated well was fitted with an Odyssey
Data Flow Capacitance water level logger (Christchurch, New Zealand) and collected water level
data at least twice daily. Data loggers were of 0.5 m, 1 m, and 2 m lengths. Rainfall at each site
was correlated to the nearest (<16 km) weather station or will be read manually onsite. Figure 1-
5 is a topographic map showing the locations of study at the Chap site. Location 1 monitored a
transported soil and location 2 was a residual soil.
Figure 1-5. Topographic map of the Chap site showing data monitoring at two locations.
Location 1:
Transported
Soils
Location 2:
Residual
soil

6
Data Analysis
Average water table and depths to oxyaquic conditions were calculated for each soil for each year,
for three years. The depths to which oxyaquic conditions within 1 m of the soil surface were met
were determined by two different criteria per monitoring period. One was the highest level in the
soil which was saturated for 30 or more days. The other is the highest depth the soils were saturated
for 20 days consecutively. Cumulative saturation duration percentages were calculated by the
amount of time the soil was saturated at or above the level of different redoximorphic feature
occurrences divided by the total time within a given wet period per year.
RESULTS
The differences between the residual and transported soils were the presence of redox features and
a relatively impermeable layer in the transported soil. The transported soils had shallower water
tables for longer durations than the residual soils. All residual sites met the 30-day oxyaquic
criteria despite containing no RMFs. The saprolite within 1 m depth of the lithologic discontinuity
typically has low permeability and the presence of depleted ped faces. Again, saprolite is highly
weathered, rotten rock that looks like rock but acts like soil. Saprolite greater than 1 m depth
below this contact has a moderate to high permeability and does not hold water. Transported
materials containing RMFs below 1 m have been shown to contain perched water, due to its low
permeability. Therefore it is concluded that the RMFs found in these zones are indicative of
current day wetness.
Figure 1-6 shows a typical horizon sequence for the transported Appomattox soil. The white
dashed lines represent horizon boundaries and the colored arrows on the left represent key depths
to which soil limitations occur. The blue line at 24 inches (61 cm) represents where soil wetness
features are found and is a representative of the top of the seasonal high water table, in the Bt2
horizon. The red lines represent a stone line parallel to the soil surface, indicating of a change in
parent material. The parent material change is noted by the numeral 2 prefix in the 2BC horizon
at 40 in (102 cm). This layer has restrictive permeability and is in part why there is a perched
water table forming in the above layers. The 3CBt horizon at 58 in (147 cm) formed in residuum,
or soils formed from rock, in place. This layer is altered by the transported material and is
hydraulically restrictive. Lastly, the 3Ct horizon is weathered from mica-schist which yields a
permeable layer with oxidizing conditions.

7
Figure 1-6. Typical horizon sequence of the Appomattox Soil Series.
Ap
Bt1
Bt2
2BCt
3CBt
3Ct

8
Soil Profile Summary
At all sites, the transported soils contain relatively impermeable layers characterized by high bulk
densities, platy structure, and firm to very firm consistencies in the lower argillic horizons, giving
rise to potential perched water table systems within and above these layers. The presence of redox
features were evidence that these soils saturate seasonally. Average depths to redox depletions,
depleted clay films, depths to a restriction, thickness of restriction, depths to a lithologic
discontinuity between transported and residual materials, the thickness of altered saprolite
underneath the transported materials, and the and depth to moderately rapid permeable saprolite
were summarized in table 1-1 for both transported and residual materials.
Table 1-1. Average depths to soil morphologic features in both residual and transported soils.
Depth to feature (cm)
Redox
depletio
n
Deplete
d Clay
films
Restrictio
n
Thicknes
s
restrictio
n
Discontinuit
y
Thicknes
s
Altered
Saprolite
Permeabl
e
Saprolite
Transporte
d Soils 53 73 77 136 148 91 223
Residual
Soils NA NA 83 62 108* 39* 158
Where applicable; three residual sites had local colluvium mantling residuum
There were notable differences between the residual and transported soils. Transported soils
contained redox depletions and depleted clay films, whereas the residual soils contained no redox
features and contained red clay films throughout their profiles. The depths to the hydraulically
limiting layers were similar for both transported and residual soils. These layers in the transported
soils averaged >1.4 m thick and < 62 cm thick for residual soils.
Three of the residual soils contained approximately 1 m of local colluvial materials overlying
residuum. This was due to the close proximity of locations developed wholly in transported
materials. This colluvial layer could not be observed from an auger boring. The average depth to
a lithologic discontinuity was 1.5 m for the transported soils. Permeable saprolite was found on
average of 2.2 m versus 1.6 m in residual soils. The thickness of saprolite that was altered
underneath the transported material was 90 cm compared to an average of 40 cm in residual soils.

9
Water Table Summary across all Sites
The average depth to the water table information is presented in table 1-2. The average water table
depth for transported soils with redox features is 81 cm. The average depth across all sites to
where the soils were saturated for 30 days cumulatively and 20 days consecutively are 64 and 91
cm respectively.
Table 1-2. Water table summary for the transported soils site.
All Transported Soils with RMFs Oxyaquic Conditions met (cm)
Site/ Location Avg. Water Table (cm) 30-day 20-day
Blackstone 1 55 30 52
Buckingham 1 91 64 106
Buckingham 2 92 88 --
Chap 1 65 30 70
Chap 2 76 72 78
Horseshoe Rd 101 64 94
Flint Hill 1 94 89 -
Flint Hill 2 78 66 89
Flint Hill 3 77 54 86
New London 1 87 66 104
New London 2 90 70 100
Pamplin 51 30 51
Rustburg 1 90 77 92
Rustburg 3 93 95 -
Averages 81 64 91
Water table information for the residual soils on broad ridge tops without RMFs are shown below
(table 1-3). The average water table depths and the 30-day water cumulative water table were
deeper in the residual soils than the transported soils. No residual soil at any site was ever saturated
for longer than 20 days consecutively.
Table 1-3. Summary for the residual soils water table data by site.
Residual SUMMARY
Oxyaquic Conditions met
(cm)
Site Avg. Water
Table (cm)
30-day 20-day
Horseshoe 81 86 --
Buckingham 95 82 --
Chap 91 80 --
New London 75 76 --
Pamplin 90 78 --
Rustburg 99 93 --
Averages 95 83 --
10
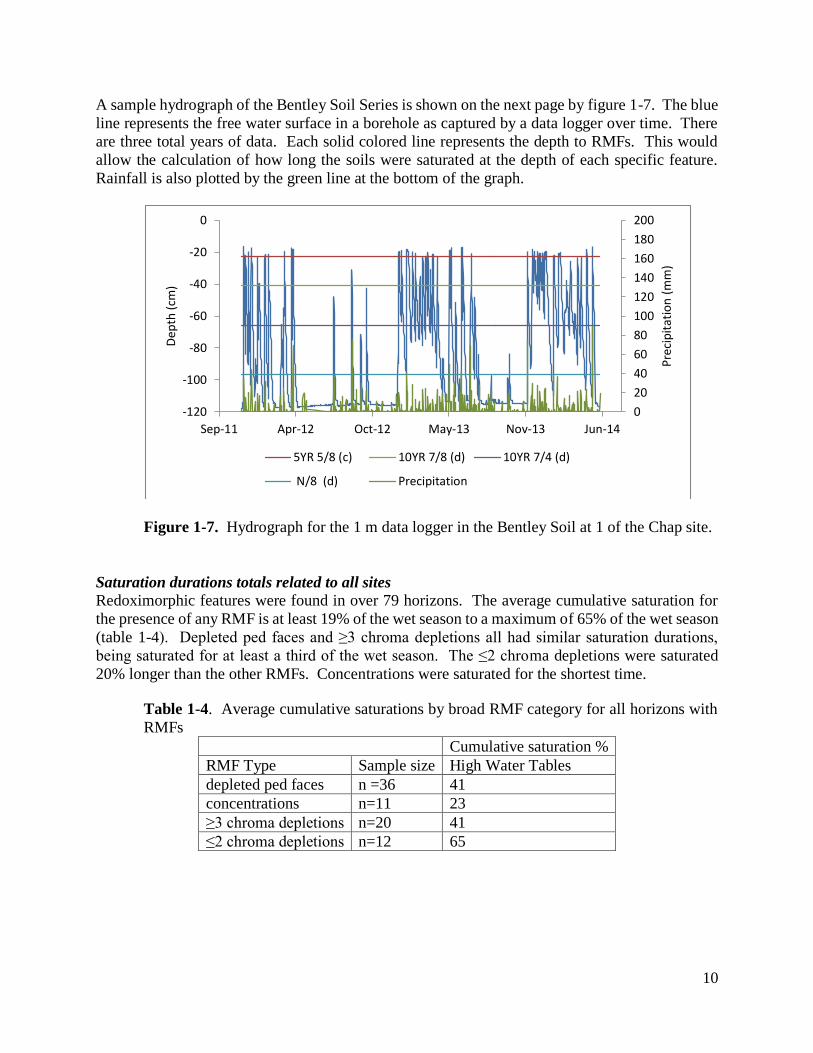
A sample hydrograph of the Bentley Soil Series is shown on the next page by figure 1-7. The blue
line represents the free water surface in a borehole as captured by a data logger over time. There
are three total years of data. Each solid colored line represents the depth to RMFs. This would
allow the calculation of how long the soils were saturated at the depth of each specific feature.
Rainfall is also plotted by the green line at the bottom of the graph.
Figure 1-7. Hydrograph for the 1 m data logger in the Bentley Soil at 1 of the Chap site.
Saturation durations totals related to all sites
Redoximorphic features were found in over 79 horizons. The average cumulative saturation for
the presence of any RMF is at least 19% of the wet season to a maximum of 65% of the wet season
(table 1-4). Depleted ped faces and ≥3 chroma depletions all had similar saturation durations,
being saturated for at least a third of the wet season. The ≤2 chroma depletions were saturated
20% longer than the other RMFs. Concentrations were saturated for the shortest time.
Table 1-4. Average cumulative saturations by broad RMF category for all horizons with
RMFs
Cumulative saturation %
RMF Type Sample size High Water Tables
depleted ped faces n =36 41
concentrations n=11 23
≥3 chroma depletions n=20 41
≤2 chroma depletions n=12 65
0
20
40
60
80
100
120
140
160
180
200
-120
-100
-80
-60
-40
-20
0
Sep-11 Apr-12 Oct-12 May-13 Nov-13 Jun-14
Pre
cip
itat
ion
(m
m)
Dep
th (
cm)
5YR 5/8 (c) 10YR 7/8 (d) 10YR 7/4 (d)
N/8 (d) Precipitation

11
Perching conditions confirmed
Saturation monitored underneath the transported materials are documented and contrasted with the
data from the overlying (1 m) data loggers. Figure 1-8 shows the concept for objective 3. The
transported soil at had a fluctuating water table in the upper profile. This was evidenced in the soil
by the presence of intra matrix depletions and depleted clay films. Transported material capped
residuum at the 2 m well that contained no redox features. As a result perching of water in the
transported material was suspected. The 2 m data logger never recorded water present during the
entire study in the residuum underlying the transported material.
Figure 1-8. Hydrograph comparison of data loggers in the transported material.
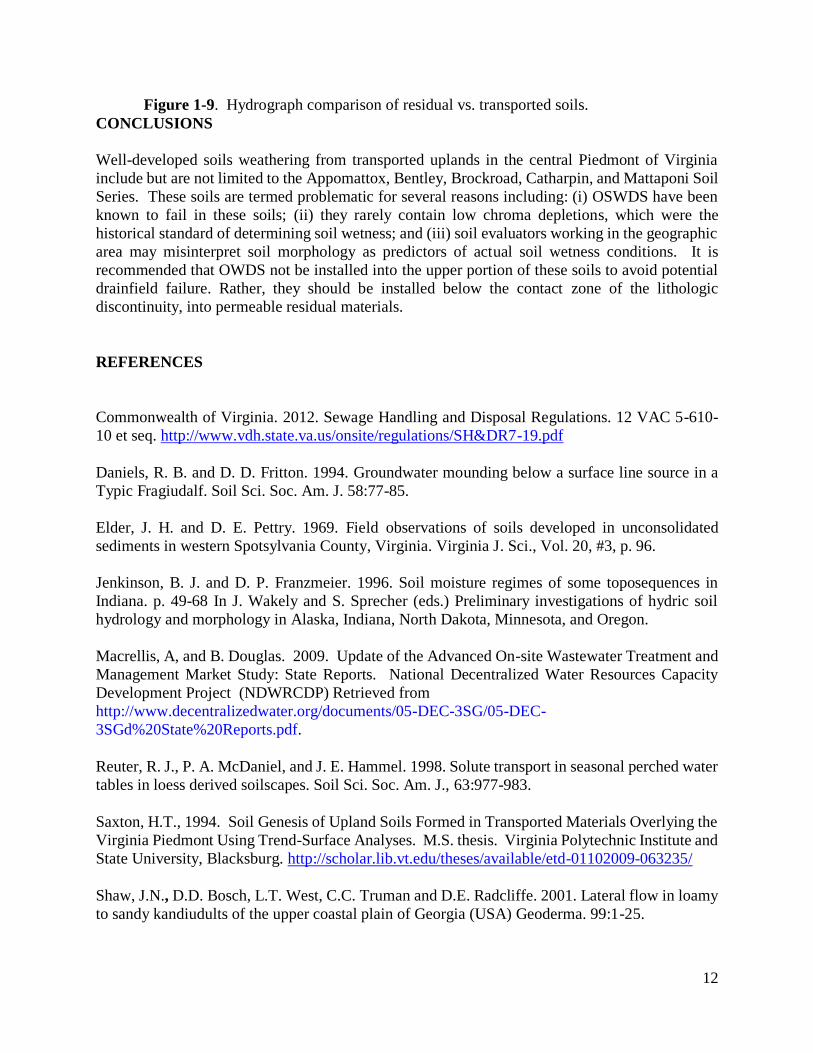
Differences between saturation of residual and transported soils
At most sites there is a location that contained residual soils. Data from monitoring wells installed
in the residual soils are used to compare with those data from the transported soils. Figure 1-9
shows the concept for research objective 4. Addition details confirming this concept are located
in the appendix. The residual soil was not expected to have a fluctuating water table that persisted
for long periods of time. The transported soil was expected to have a persistent water table in the
layers soil containing redox features.
-120
-100
-80
-60
-40
-20
0
Nov-12 Feb-13 May-13 Aug-13 Nov-13 Feb-14 May-14
Dep
th (
cm)
Residual Transported
12
Figure 1-9. Hydrograph comparison of residual vs. transported soils.
CONCLUSIONS
Well-developed soils weathering from transported uplands in the central Piedmont of Virginia
include but are not limited to the Appomattox, Bentley, Brockroad, Catharpin, and Mattaponi Soil
Series. These soils are termed problematic for several reasons including: (i) OSWDS have been
known to fail in these soils; (ii) they rarely contain low chroma depletions, which were the
historical standard of determining soil wetness; and (iii) soil evaluators working in the geographic
area may misinterpret soil morphology as predictors of actual soil wetness conditions. It is
recommended that OWDS not be installed into the upper portion of these soils to avoid potential
drainfield failure. Rather, they should be installed below the contact zone of the lithologic
discontinuity, into permeable residual materials.
REFERENCES
Commonwealth of Virginia. 2012. Sewage Handling and Disposal Regulations. 12 VAC 5-610-
10 et seq. http://www.vdh.state.va.us/onsite/regulations/SH&DR7-19.pdf
Daniels, R. B. and D. D. Fritton. 1994. Groundwater mounding below a surface line source in a
Typic Fragiudalf. Soil Sci. Soc. Am. J. 58:77-85.
Elder, J. H. and D. E. Pettry. 1969. Field observations of soils developed in unconsolidated
sediments in western Spotsylvania County, Virginia. Virginia J. Sci., Vol. 20, #3, p. 96.
Jenkinson, B. J. and D. P. Franzmeier. 1996. Soil moisture regimes of some toposequences in
Indiana. p. 49-68 In J. Wakely and S. Sprecher (eds.) Preliminary investigations of hydric soil
hydrology and morphology in Alaska, Indiana, North Dakota, Minnesota, and Oregon.
Macrellis, A, and B. Douglas. 2009. Update of the Advanced On-site Wastewater Treatment and
Management Market Study: State Reports. National Decentralized Water Resources Capacity
Development Project (NDWRCDP) Retrieved from
http://www.decentralizedwater.org/documents/05-DEC-3SG/05-DEC-
3SGd%20State%20Reports.pdf.
Reuter, R. J., P. A. McDaniel, and J. E. Hammel. 1998. Solute transport in seasonal perched water
tables in loess derived soilscapes. Soil Sci. Soc. Am. J., 63:977-983.
Saxton, H.T., 1994. Soil Genesis of Upland Soils Formed in Transported Materials Overlying the
Virginia Piedmont Using Trend-Surface Analyses. M.S. thesis. Virginia Polytechnic Institute and
State University, Blacksburg. http://scholar.lib.vt.edu/theses/available/etd-01102009-063235/
Shaw, J.N., D.D. Bosch, L.T. West, C.C. Truman and D.E. Radcliffe. 2001. Lateral flow in loamy
to sandy kandiudults of the upper coastal plain of Georgia (USA) Geoderma. 99:1-25.

13
Soil Science Society of America. 2008. Glossary of Soil Science Terms. Madison, WI. Soil Sci.
Soc. Am.
Soil Survey Staff, 1999. Soil Taxonomy, A basic system of soil classification for making and
interpreting soil surveys; second edition. Agricultural Handbook 436; Natural Resources
Conservation Service, USDA. Washington DC, USA.
United States Environmental Protection Agency. 2002. Onsite Wastewater Treatment Systems
Manual. EPA 832-R-97-001b.
Wilson, M.A., L.W. Zelazny, and J.C. Baker. March 1983. An investigation of soils within the
Tatum and Eliok mapping units in the Virginia Piedmont. Virginia Agricultural Experimental
Station. Bulletin 83-1.