hydrophobic surfaces: effect of surface structure on ...559961/fulltext01.pdf · hydrophobic...
TRANSCRIPT

Hydrophobic surfaces:
Effect of surface structure on wetting and interaction forces
PETRA HANSSON
Doctoral Thesis at the Royal Institute of Technology
Stockholm 2012

ii
Akademisk avhandling som med tillstånd av Kungliga Tekniska Högskolan framläggs till offentlig granskning för avläggande av teknologie doktorsexamen fredagen den 2 november 2012 kl 10.00 i sal F3, KTH, Lindstedtsvägen 26, Stockholm. Petra Hansson. Hydrophobic surfaces: Effect of surface structure on wetting and interaction forces TRITA-CHE Report 2012:52 ISSN 1654-1081 ISBN 978-91-7501-506-4 YKI Publication A-3055 Denna avhandling är skyddad enligt upphovsrättslagen. Alla rättigheter förbehålles. Copyright © 2012 Petra Hansson. All rights reserved. No part of this thesis may be reproduced without permission from the author. The following papers are printed with permission: Paper I: Copyright © Royal Society of Chemistry Paper II, III and V: Copyright © American Chemical Society Printed at E-Print, Stockholm 2012

iii
Abstract
The use of hydrophobic and superhydrophobic surfaces is of importance for many processes both in nature and industry. Interactions between hydrophobic species and their wetting behavior play a key role in industrial applications such as water-cleaning procedures, pitch control during papermaking, flotation processes but they also give information on how to design surfaces like hydrophobic mineral pigments. In this thesis, the influence of surface structure, roughness and chemistry on wetting and surface interaction forces has been studied. This was achieved by preparing surfaces with a defined structure and roughness. Surfaces with hexagonally close-packed particles, pore arrays, randomly deposited nanoparticles as well as flat reference surfaces were prepared. The atomic force microscope (AFM) was utilized for surface characterization as well as force and friction measurements while contact angles and confocal Raman microscopy experiments were mainly used for wetting studies. The deposition of silica particles in the size range of nano- to micrometers using the Langmuir-Blodgett (LB) technique resulted in ordered particle coated surfaces exhibiting hexagonal close-packing and close to Wenzel state wetting after hydrophobization. Force measurements using these particle coated surfaces displayed long-range interaction forces assigned to be a consequence of air cavitation between the surfaces. Smaller roughness features provided larger forces and interaction distances interpreted as being due to fewer restrictions of capillary growth. Friction measurements proved both the surface structure and chemistry to be important for the observed frictional forces. Wetting on hydrophobic pore array surfaces were shown not to be described by the well-established Wenzel or Cassie-Baxter models. Instead, the three-phase contact line of water droplets avoided the pores which created a jagged interface. The influence of the pores was evident in force curves measured in water, both in terms of the shape, in which the three-phase contact line movements around the pores could be detected, as well as the depth of the pores providing different access and amount of air. When

iv
water/ethanol mixtures were used, the interactions, displaying no sign of air cavities, were concluded to be due to ethanol condensation. Confocal Raman microscopy experiments with water and water/ethanol mixtures on superhydrophobic surfaces gave evidence for water depletion and ethanol/air accumulation close to the surface. Force measurements using superhydrophobic surfaces showed extremely long-range interaction distances of several micrometers. This work has provided evidence for air cavitation between hydrophobic surfaces in aqueous solution. It was also shown that the range and magnitude of interaction forces could, to some extent, be predicted by looking at certain surface features like structure, roughness and the overall length scales. Key words: hydrophobic surface, superhydrophobic surface, atomic force microscopy, surface forces, capillary forces, cavitation, surface roughness, friction, wetting, confocal Raman, contact angles, surface preparation, Langmuir-Blodgett

v
Sammanfattning
Hydrofoba och superhydrofoba ytor samt dess egenskaper är viktiga för en lång rad industriella processer såsom vattenrening, hartskontroll vid papperstillverkning, flotation och många fler men också för att skräddarsy, till exempel, hydrofoba ytor av mineralpigment. Denna avhandling behandlar hur egenskaper hos en yta, till exempel strukturen, ytråheten och kemin, påverkar krafter mellan och vätning på hydrofoba ytor. Ytor med tätpackade partiklar, ordnade porer, godtyckligt deponerade nanopartiklar samt plana referensytor tillverkades och studerades. Ett atomkraftsmikroskop (AFM) användes för att karaktärisera ytor samt mäta krafter och friktion medan vätning studerades genom mätningar av kontaktvinklar och konfokal Ramanmikroskopi. Genom att deponera silikapartiklar i storleksordningen nano- till mikrometer med användning av Langmuir-Blodgettekniken (LB) kunde ytor med hexagonalt ordnade partiklar och vätning i Wenzelregimen produceras. Kraftmätningar med dessa partikelytor i vatten visade på väldigt långväga krafter som antas uppkomma genom att luft bildar kaviteter mellan ytorna. Lägre grad av ytråhet gav upphov till starkare krafter och mer långväga interaktioner, vilket tolkades som en konsekvens av minskad begränsning för kapillären att växa. Friktionsmätningar visade att både ytstrukturen och kemin påverkar de uppmätta friktionskrafterna. Vätningsstudier gjorda på hydrofoba porösa ytor visade att varken Wenzel- eller Cassie-Baxtermodellen kunde tillämpas. Studier av kraftkurvor från mätningar i vatten visade tydligt att porerna påverkar både formen på kurvan samt att pordjupet bestämde avstånden på växelverkan genom att ge tillgång till luft på olika djup och i olika mängd. Växelverkan uppmätt i vatten/etanolblandningar verkade uppstå på grund av kondensering av etanol snarare än luftkaviteter. Konfokal Ramanmikroskopi användes för att studera superhydrofoba ytor täckta med vatten och vatten/etanol, vilket gav bevis för att vatten trängs bort från ytan medan etanol och/eller luft ackumuleras. Kraftmätningar med

vi
superhydrofoba ytor gav upphov till extremt långväga interaktioner på flera mikrometer. Den här avhandlingen har påvisat förekomsten av luftkaviteter nära hydrofoba ytor i vattenlösning. Storleken och avståndet på krafter mellan ytorna har även visat sig kunna, till stor del, förutspås genom att undersöka ytstrukturen och ytråheten.

vii
List of Papers
This thesis is based on the following papers, which are referred to in the text by their Roman numerals.
I Solvent segregation and capillary evaporation at a
superhydrophobic surface investigated by confocal Raman microscopy and force measurements Brandner, B. D., Hansson, P. M., Swerin, A., Claesson, P. M., Wåhlander, M., Schoelkopf, J., Gane, P. A. C. Soft Matter, 2011, 7, 1045-1052.
II Robust hydrophobic surfaces displaying different surface roughness scales while maintaining the same wettability Hansson, P. M., Skedung, L., Claesson, P. M., Swerin, A., Schoelkopf, J., Gane, P. A. C., Rutland, M. W., Thormann, E. Langmuir, 2011, 27, 8153-8159.
III Influence of surface topography on the interactions between nanostructured hydrophobic surfaces Hansson, P. M., Swerin, A., Schoelkopf, J., Gane, P. A. C., Thormann, E. Langmuir, 2012, 28, 8026-8034.
IV Frictional forces between hydrophilic and hydrophobic particle coated nanostructured surfaces Hansson, P. M., Claesson, P. M., Swerin, A., Schoelkopf, J., Gane, P. A. C., Thormann, E. manuscript
V Effect of surface depressions on wetting and interactions between hydrophobic pore array surfaces Hansson, P. M., Hormozan, Y., Brandner, B. D., Linnros, J., Claesson, P. M., Swerin, A., Schoelkopf, J., Gane, P. A. C., Thormann, E. Langmuir, 2012, 28, 11121-11130.
VI Hydrophobic pore array surfaces: Wetting and interaction forces in water/ethanol mixtures Hansson, P. M., Hormozan, Y., Brandner, B. D., Linnros, J., Claesson, P. M., Swerin, A., Schoelkopf, J., Gane, P. A. C., Thormann, E.
submitted for publication

viii
The author’s contribution to the papers was as follows: I Part of experimental work, part of manuscript preparation II Major part of experimental work, part of manuscript preparation III-IV All experimental work, major part of manuscript preparation V-VI Major part of experimental work, major part of manuscript
preparation

ix
Table of contents
Abstract ........................................................................................................ iii
Sammanfattning .......................................................................................... v
List of Papers .............................................................................................. vii
Abbreviations and Symbols ...................................................................... xi
1 Introduction .............................................................................................. 1
1.1 Hydrophobicity and superhydrophobicity ........................................................ 1
1.2 Hydrophobicity in nature .................................................................................... 2
1.3 Applications related to hydrophobicity ............................................................ 3
2 Theory ........................................................................................................ 5
2.1 Surface structure .................................................................................................. 5
2.2 Surface forces ....................................................................................................... 6
2.2.1 DLVO theory ................................................................................................. 7
2.2.2 Interaction forces between hydrophobic surfaces ............................ 11
2.2.3 Adhesion ...................................................................................................... 15
2.3 Friction .................................................................................................................. 16
2.4 Wetting ................................................................................................................. 17
2.4.1 Wenzel state ............................................................................................... 18
2.4.2 Cassie-Baxter state ................................................................................... 19
2.4.3 Transitions between Wenzel and Cassie – Intermediate situations19
2.4.4 Validity of the assumptions underlying the Wenzel and Cassie-
Baxter models ....................................................................................................... 19
3 Experimental ........................................................................................... 21
3.1 Atomic force microscopy ................................................................................... 21
3.1.1 Imaging ....................................................................................................... 22
3.1.2 Force ............................................................................................................. 23
3.1.3 Friction ......................................................................................................... 24
3.1.4 Contact angle of colloidal probe ............................................................. 25
3.2 Confocal Raman microscopy ............................................................................ 26
3.3 Contact angles ..................................................................................................... 28
3.4 Surface preparation ........................................................................................... 28

x
3.4.1 Langmuir-Blodgett .................................................................................... 28
3.4.2 Lithography and etching .......................................................................... 29
3.4.3 Dip coating .................................................................................................. 30
3.4.4 Sintering ...................................................................................................... 30
3.4.5 Silanization .................................................................................................. 31
4 Results ...................................................................................................... 32
4.1 Surface preparation ........................................................................................... 32
4.1.1 Particle coated surfaces – Langmuir-Blodgett deposition ................ 32
4.1.2 Pore array surfaces – Photolithography and etching ......................... 34
4.1.3 Superhydrophobic surfaces – Dip coating ........................................... 35
4.2 Surface characterization ................................................................................... 36
4.2.1 Particle coated surfaces – Hexagonal structure and robustness .... 36
4.2.2 Pore array surfaces – Structure of three-phase contact line and
water penetration into the pores ...................................................................... 38
4.2.3 Superhydrophobic surface – Lotus effect ............................................. 41
4.3 Force measurements ......................................................................................... 41
4.3.1 Particle coated surfaces – Dependence on roughness length scale
and extremely long-range forces ...................................................................... 42
4.3.2 Pore array surfaces – Consequences of pores observed in the force
curves ..................................................................................................................... 45
4.3.3 Superhydrophobic surfaces – Long-range forces ............................... 48
4.4 Friction measurements ...................................................................................... 49
4.4.1 Particle coated surfaces – Amontonian or adhesion controlled
friction ..................................................................................................................... 50
4.5 Capillary effects .................................................................................................. 51
4.5.1 Detection of air/water vapor and accumulation of ethanol on
superhydrophobic surfaces ................................................................................ 52
4.5.2 Influence of ethanol – removal of capillary forces ............................. 53
4.6 General discussions about interactions between hydrophobic surfaces. 55
5 Conclusions ............................................................................................. 59
6 Future work ............................................................................................. 62
7 Acknowledgements ................................................................................ 64
8 References ............................................................................................... 66

xi
Abbreviations and Symbols
Abbreviations: AFM Atomic force microscopy DLS Dynamic light scattering DLVO Derjaguin-Landau-Verwey-Overbeek DNA Deoxyribonucleic acid EDL Electrostatic double layer FWHM Full width half maximum HRSEM High resolution scanning electron microscopy IR Infra-red JKR Johnson-Kendall-Roberts LB Langmuir-Blodgett NA Numerical aperture π-A Surface pressure-area PB Poisson-Boltzmann SEM Scanning electron microscopy SFA Surface force apparatus vdW van der Waals VSFS Vibrational sum frequency spectroscopy Symbols: A Hamaker constant (J) α polarizability (C m2 V-1) α0 normal detector sensitivity (m V-1) c molar concentration (mol dm-3) cm concentration per m3 D distance, surface separation (m) Δ relative change δ torsional detector sensitivity (V rad-1) ε relative permittivity ε0 permittivity of free space (8.854 x 10⁻¹² C2 J-1 m-1)
F force (N) f area fraction Fadh adhesion force (N) Fcap capillary force (N) Ff frictional force (N) FN normal force (N)

xii
FvdW van der Waals force (N) γ surface tension (N m-1) γint interfacial tension (N m-1) h Planck’s constant (6.626 x 10⁻³⁴ J s) heff effective height (m) η viscosity (Pa s) kB Boltzmann’s constant (1.381 x 10⁻²³ J K-1) kn normal spring constant (N m-1) kt torsional spring constant (Nm rad-1) κ-1 Debye length (m) λ wavelength (m) µ coefficient of friction µi dipole moment (C m) N number of points n refractive index υ ionization frequency (Hz) υe main electronic absorption frequency (Hz) P pressure (Pa) P0 saturation vapor pressure (Pa) R radius (m) or molar gas constant (8.314 J K-1 mol-1) Ra arithmetic mean roughness (m) RN normalized radius (m) Rq root mean square roughness (m) r curvature (m-1) or roughness factor ρ density (kg m-3) T temperature (°C or K) θ contact angle (°) β angle against normal plane (°) Vcap capillary volume (m3) Vf lateral photodetector signal (V) Vm molar volume (m3 mol-1) W interaction free energy (J) Wadh work of adhesion (J) Zave average value, value at central plane
Zi local value z ion valency

1 Intr
The aiminfluenceorder to meaningthe impoand in te
1.1 HyThe confear) anfundametype of sto underand recoapplicatihaving superhydthan 150accomparolls off
Figure 1hydrophosuperhyd
roductio
m of this thee wetting andunderstand t
g of hydrophortance of thechnical appl
ydrophobncepts of hynd superhyental purposesurface properstanding of ognition of itions. The sia static w
drophobic su0°, as showanied by a sthe surface.
1-1. Schematicobic surface drophobic surf
on
esis work wad interactionthis rather cohobicity/supehe hydropholications are
bicity and ydrophobicitydrophobicityes as well as erty has grow
f the criteria s potential asimplest explwater contacurface is sup
wn in Figuresmall roll-off
c illustration with a c
face displaying
1
as to investin forces betwomplex phenerhydrophobobic propertiprovided in t
superhydy (Greek: hyy are of v
in industrialwn substantia
for formings, for examplanation of ct angle hpposed to exe 1-1. The f angle, i.e.
showing a mcontact angleg a contact an
igate how suween hydrophnomenon, a bbicity and anies through this chapter.
drophobicydro = watevital imporl applicationally during thg superhydro
ple, liquid barhydrophobic
higher than xhibit a conthigh contacthe liquid e
macroscopic we higher th
ngle above 150
urface structhobic surfacebackground ton explanatioits use in na
city er and phobrtance both ns. Interest inhe past yearsophobic surfrriers in diffecity is a sur
90°, whiltact angle hict angle is oasily bounce
water droplet han 90° an0°.
tures es. In o the
on of ature
os = for
n this s due faces erent rface le a igher often es or
on a nd a

1.2 HyThere superhyd(Nelumbpropertysurfaces low rollmechaniBarthlottnanostrucombinatogether superhydextremelhysteresicontrast the rose angle busurface athe nano
Figure 1-figure, wathe right the surfac
ydrophobexist nu
drophobicitybo nucifera) y, “the lotu
is even naml-off angles ism was nott and Neinhu
uctures of theation of rou
with a lowdrophobicityly low roll-is between to some oth(Rosa rubig
ut also a higand a water
ostructured la
-2. Two photoater easily roldisplays a ro
ce.
bicity in numerous
y in nature (Fmust be th
us effect”, med after the
were noticet realized uuis systematie leaf.1,2 The
ughness in bw surface eny. The self-c-off angle oadvancing a
her plants exginosa) is thgh adhesion,droplet. This
ayer but not t
ographs showills off the surfse plant with
2
ature examples
Figure 1-2), ahe most wedisplayed b
e plant. The ed a long tintil the endically recordey found thaboth the m
nergy wax lacleaning effef water dro
and recedinghibiting the e most studi, i.e. a highs is due to pthe microstru
ing hydrophobface of the ladvery high ad
of speciamong whichell-known. Tby some suhigh contac
ime ago butd of the 20t
ded images oat hierarchic
micro- and nayer were th
fect of the loplets whichg contact anso-called peied, that hav
h roll-off angenetration ofuctures unde
bic surfaces indy’s cape leaf dhesion betwe
ies exhibh the lotus floThe self-cleauperhydrophct angles andt the underlth century, wof the micro-al structures
nanometer she origin oflotus implie
h means a sngles. This ietal effect, wve a high congle, betweenf the dropletrneath.3,4
n nature. In thwhile the figuen the drople
iting ower aning hobic d the lying when - and , i.e. cale, f the s an
small is in
where ntact n the
into
e left ure to t and

3
In addition to many leaves of plants, several insects also have the ability to resist water spreading on their wing surfaces. The water strider (Gerris remigis) with its non-wetting legs that enable the insect to stand on a water surface is one of the most well-known examples.5 Other insects showing superhydrophobic properties are butterflies and cicadas which give them the possibility to stay dry and clean.6 Also, many birds have feathers with the capability to resist spreading of water during swimming. Another important phenomenon governed by interactions between hydrophobic materials is the folding of proteins, the biomacromolecules consisting of a chain of amino acids and encoded for by deoxyribonucleic acid (DNA). Protein misfolding can originate from disturbances in the hydrophobicity/hydrophilicity of the interacting molecules and is known to cause severe neurological diseases such as Alzheimer’s, Parkinson’s and Creutzfeldt-Jakob disease.7,8
1.3 Applications related to hydrophobicity The fundamental studies on how to prepare superhydrophobic surfaces and how their properties can be explained have increased enormously during the last decade. Today, superhydrophobic surfaces should not only display water repellency but also exhibit, for example, transparency, specific colors and flexibility.9 As the number of fundamental studies increases, more and more industrial applications on hydrophobic or superhydrophobic materials are realized. Its use as corrosion protection,10,11 in de- or antiicing applications,12,13 as coatings in liquid resistant papers14,15 or in fabrics,16,17 has been a recent focus of interest and the number of applications will most likely continue to rise. An increased understanding of the influence of hydrophobic materials on surface interactions is of importance for many industries. In deinking, the forces between the cellulose fibers and the ink particles are a key issue during separation.18 Flotation processes, such as froth flotation in the mining industry as well as waste water treatment, demand a high degree of knowledge about hydrophobic materials.19 Control of sticky materials,

4
pitch, in wood is of vital importance in pulp and paper making processes due to the stickiness causing severe problems and cost for the industry.20 In summary, more detailed knowledge about the interactions between different hydrophobic species is a prerequisite for development of materials and processes in many different types of industries.

5
2 Theory
This chapter presents the theoretical background for the most important phenomena needed in order to be able to interpret and understand the obtained results. Definitions of surface structure and presentations of relevant surface forces and wetting theories are discussed. Also, previous work in the field is introduced.
2.1 Surface structure The structure of a surface is an important property and, together with for example the material and the size, it is deciding its overall quality. Surface structure is often characterized in terms of the surface roughness. The most common ways to measure surface roughness are, if the roughness length scales are in the micrometer range, by profilometry while atomic force microscopy (AFM) often is used for surfaces with length scales in the nanometer range. Several different parameters can be extracted from a roughness measurement but two of the most commonly discussed are the root mean square roughness, Rq, and the arithmetic mean roughness value, Ra, as given by:
N
ZZR
N
ii
1
2ave
q
)( (2-1)
where Zave = average Z value within the given area, Zi = local Z value and N = number of points within the given area and
N
ZZR
N
ii
1
ave
a (2-2)
where Zave = Z value at the central plane, Zi = local Z value and N = number of points within the given area. The roughness parameters

6
mentioned above only describe the height variance in lateral direction and do not give any information about the actual shape of the surface structures. When fabricating superhydrophobic surfaces it has been noted that many different structures can give rise to surfaces with a high contact angle as long as they introduce a certain roughness together with a low surface energy. Surfaces consisting of multilayers of particles and/or polymers,21 deposited particles,22,23 etched or deposited pillars24,25 or pores26 are all examples of some of the possible structures that can be used to produce a superhydrophobic surface.
2.2 Surface forces The concept of surface and intermolecular forces is of fundamental importance to the issues discussed in this thesis. Intermolecular forces are always present and they always affect molecules in solution, in solid materials and at interfaces. The collective effect of intermolecular forces between two larger bodies (particles/surfaces) is known as surface forces and they are subdivided into different classes depending on the molecular origin. Electrostatic forces, van der Waals forces and interactions between hydrophobic surfaces and its possible origins are most relevant for this work and they will be presented briefly below and can be seen in Figure 2-1. In order to accurately measure quantitative forces between surfaces, the geometry of the surfaces needs to be taken into consideration. This is done through the Derjaguin approximation which relates the measured force, F, to the interaction free energy per unit area, W, for two flat surfaces separated by a distance, D, according to:27
(2-3).
RN is the normalized radius that depends on the geometry of the interacting objects, e.g. a sphere-flat geometry gives RN = Rsphere and crossed cylinders give RN = . The Derjaguin

approxim∂W/∂D i
Figure 2-and the DLVO tohydropho
2.2.1 D
The theoelectrostreferred forces anthe sum and van
2.2.1.1 v
The van(Keesomfrom dis
mation is vals continuous
-1. Summary van der Waa
ogether with aobic surfaces i
DLVO theo
ory on the sttatic double
to as thend the DLVof the contrder Waals, W
van der Waa
n der Waals m), inductionsplacement o
lid when R>>s.
of the most rals and electra typical apprin aqueous sol
ory
tability of colayer forces Derjaguin-
VO interactioributions fromWvdW(D), inte
als interactio
force is a con (Debye) aof permanent
7
>D, the surfa
elevant forcesrostatic doublroach curve folution.
olloidal partis and van de-Landau-Ver
on free energm the electroeractions by
ons
ollective namand dispersit or induced
faces are non
s in this thesisle layer force
for a measurem
icles, i.e. theer Waals forrwey-Overbegy is simplyostatic doubl
me describinion (Londondipoles in th
n-deformable
s; the DLVO es contributinment between
e combinatiorces, is geneeek (DLVO calculated fle layer, Wed
(2
g the orientan) forces arihe molecules
e and
force ng to n two
on of rally
O)28,29 from
dl(D),
2-4).
ation ising s and

8
they always have to be considered when discussing forces between molecules. Two molecules with permanent dipoles and the ability to rotate nearly freely will preferentially align themselves along their opposite charges and therefore attract each other. The corresponding dipole-dipole interaction energy is referred to as the Keesom energy:30
(2-5)
where µi is the dipole moment for molecule i. Eq. 2-5 is valid for nearly freely rotating dipoles which means kBT > μ μ /4 , and thus energetically favorable orientations between the dipoles are slightly preferred.
A polar molecule in close proximity to another molecule will induce a dipole which results in an attractive force as described as follows according to Debye:31
(2-6)
where α is the the polarizability of the neutral molecule. The third and last contribution to the van der Waals force is the London forces. In contrast to the Keesom and Debye forces, these dispersive forces cannot be calculated using classical physics but quantum mechanical perturbation theory must be involved. All atoms have, at every moment, a dipole moment due to displacement of their electron clouds. If several atoms are bonded together to form a molecule, this effect is even more pronounced and the created instantaneous dipole has the ability to affect other molecules in the surrounding. These induced dipoles can attract or repel each other. Two molecules with ionization frequencies of ν1 and ν2 have a total free energy from the London forces described by:32
(2-7).

9
Eqs. 2-5 to 2-7 are applicable to a pair of molecules interacting across vacuum. When van der Waals forces between macroscopic bodies are considered, many body effects and the fact that a medium is present between the bodies will affect the van der Waals interaction and therefore need to be considered. The van der Waals force between macroscopic bodies is calculated using the Hamaker constant, A. It was first derived by incorrectly assuming pairwise additivity of the forces from all the molecules in the macroscopic surface.33-35 Lifshitz later made a more rigorous, but also more complex, calculation and found an expression for the Hamaker constant based on the bulk dielectric properties of the material according to:
√ / (2-8)
where εi is the static dielectric constant for medium i, νe is the main electronic absorption frequency in the UV region and ni is the refractive index of medium i in the visible region.36 Eq. 2-8 is valid for two identical materials (1) interacting through another medium (3). In most cases, the macroscopic van der Waals force is attractive but a repulsive force is also possible for certain material combinations.37,38 For the geometry used in this thesis, that is a flat surface interacting with a spherical particle, the van der Waals force can be calculated using
(2-9).
For other geometries similar expressions can be derived.39
2.2.1.2 Electrostatic double layer interactions
Most of the experiments included in this thesis have been performed in water or in water mixtures. Due to its very high dielectric constant, water is a good solvent for ions. The dissociation of surface groups and adsorption of charged molecules make almost all surfaces in water

10
charged. The electric field created by the charged surface gives enrichment in the concentration of counterions, i.e. the ion with opposite charge and depletion of co-ions, i.e. the ions with the same charge as the surface, in close proximity to the surface. This layer of surface charges and ions is referred to as the “electrostatic double layer”. The decay of surface potential with respect to distance from the surface is described by the Debye length, κ-1, which can be calculated using:
∑
/ (2-10)
where zi is the valency of the ions and cm is the concentration of the electrolyte per m3. For an aqueous NaCl solutions, the equation can be simplified to read
.
√ (2-11)
where c is the molar concentration of the ions. When two surfaces in water are approaching each other, their electrostatic double layers will, at some point, overlap and induce a repulsive force approximately described by an exponentially decaying equation:
(2-12)
where C is a constant that depends on the surface geometries, their surface charge density and the solution. It is determined by solving the Poisson-Boltzmann (PB) equation for the particular system.40,41 A numerical solution of the PB equation must be used for small surface separations to extract the exact double layer force. In the force studies presented in this work, a 10 mM NaCl aqueous solution has in most cases been used as the liquid medium in order to partly screen the electrostatic interactions and to calculate the contribution of the double layer force in relation to the measured forces.

11
2.2.2 Interaction forces between hydrophobic surfaces
Just as phase separation of water and oil occurs due to unfavorable conditions of enthalpy exceeding that of entropy, hydrophobic species in water attract each other, thus lowering the total free energy of the system by minimizing the area exposed to water. The first measurement of interactions between hydrophobic surfaces in aqueous solution was performed by Israelachvili and Pashley in 1982 using the surface force apparatus (SFA).42 Their study was soon followed by others who investigated and tried to interpret the extremely long-range interactions of sometimes several hundreds of nanometers, much longer than the expected van der Waals force, as can be seen in Figure 2-1.43-46 The sharp jump-in at a distance of several tens of nanometers as well as a retract curve showing an exponential decay are the well-known features for such a force curve. There is still an on-going debate regarding the mechanism behind the origin of the interactions and several suggestions have been proposed. Here follow short descriptions of some of the most frequently used explanations for this “hydrophobic interaction”:
2.2.2.1 Cavitation/bridging bubbles
Cavitation or bridging bubbles due to dissolved gas in water soon became the most plausible explanation for the observed interactions between hydrophobic surfaces45,47,48 and the mechanism has continued to be used to explain many of the results obtained.20,49-56 Figure 2-2 shows the proposed mechanism for cavity formation between hydrophobic surfaces. This theory is somewhat supported by the observation that by degassing the water, the range and magnitude of the interaction decrease even though it does not disappear completely.57,58 However, most liquid cells used during force measurements are open to the surroundings which mean that water is saturated with air shortly after degassing. The proposed air bridges can either be formed from a thin air/water vapor layer or from micrometer or nanometer sized air bubbles resting on the surface. Even though the Laplace pressure states that the pressure inside the nanobubbles should be too high for them to be stable, numerous studies have shown both their existence as well as their apparent stability for hours.51,59-63 In order to study the nanobubbles in detail, a protocol for

nanobubwho utilwater annanobubnanobubbubbles6
distributbeen useof cavitasimilaritsurfaces indicatestheory obeen ass
Figure 2surfaces there are formed onbefore theuntil it e)
2.2.2.1.1
Conventliquid msurfaces form of liquid. Cbeing lyoThis wilthe Kelv
bble formatiolized that gasnd ethanol. Tbbles can bebbles shows65,66 while ted like a coed to image aation being thty of the res
in water as that both af capillary foigned a secti
2-2. Schematin aqueous sno interactio
n approach aney d) are sepa breaks
1 Capillary fo
tionally, capmeniscus aro
in a humid a liquid brid
Capillary conophilic with ll make the vvin equation:7
on is often uses have diff
Thus, by chane formed ins, in someother stud
ntinuous filmair close to ahe main soursulting forceand hydrophare due to corces is of imion of its ow
tic illustrationolution. In a)ns between thnd they jump arated which i
forces
illary forcesound the con
environmendge in anothendensation is
respect to thvapor conden72
ln
12
sed. This waferent solubilnging the son a controlle cases, sp
dies indicatem.67,68 Also, a hydrophobirce behind th curves meahilic surfaceapillary con
mportance forn.
n of cavitati) the surfaceshem and in b)together. c) Tis accompanie
are thoughtntact areas nt. However,er immiscible
the result ofhe vapor in thnse between
as developedlity in differ
olvent duringled manner.pherically e more irrmore indire
ic surface prohe long-rangasured betwees in a hum
ndensation/evr this thesis a
ion between s are complet) an air cavity
The surfaces ared by extensio
t to occur byof particles, they can ale liquid or asf the two intthe surroundi
the surfaces
d by Zhang eent solvents,
g a measurem58,64 Imagingshaped isolregular bub
ect methods oviding evid
ge forces.69,70
een hydrophmid atmosp
vaporation.71 and has there
two hydrophtely separatedy between there in direct coon of the air c
y formation or macrosc
lso appear ins gas bridgeseracting surfing environms as describe
(2
et al. , e.g.
ment, g of lated bbles have
dence The
hobic phere
The efore
hobic d and em is ontact avity
of a copic n the s in a faces ment. ed by
-13).

r1 and r2
pressureVm is the The capican be ca
where
Figure 2probe. Dvolume against tthe line sdirection2-14 is ointroduccalculategeneral line durithe cavit
Figure 2cavitation
2 describe th, P0 is the sa
e molar volum
illary force, alculated usi
2-3 shows a sD is the distof the capillthe surface astarting fromn and towardonly valid foing D=0 ined. When sumore compling cavity grty is not allow
2-3. Illustratin between two
he curvatureaturation vapme of the con
Fcap, betweeing the follow
4π
schematic figance betweelary, θ1 and and the probem the center ods the contacr situations w
n Eq. 2-14, urface roughlex with posrowth. This wwed to grow
ion of the po hydrophobic
13
e of the menpor pressure,ndensing liqu
en a sphere, wing express
1
gure of the caen the probeθ2 are the coe respectivelof the sphericct point of thwith constan
the theorethness is intrssible pinninwould give ato its optimu
parameters inc surfaces in w
niscus, P is , γ is the sur
quid.
with radius sion:73
avity betweee and the surontact anglesly and β is thcal probe goihe capillary nt volume of tical adhesiotroduced, theng of the thra lower adheum size.
ncluded in Ewater.
the actual vrface tension
R, and a sur
(2
(2
en a surface arface, Vcap iss of the capihe angle betwing in the noat the probethe capillary
on force cane situation iree-phase conesion force s
Eq. 2-14 sho
vapor n and
rface
2-14)
-15).
and a s the llary
ween rmal . Eq.
y. By n be is in ntact since
wing

14
2.2.2.2 Water structural effects
Even though this thesis promotes the idea of the long-range interactions between hydrophobic surfaces being due to cavitation and capillary forces, there are other suggested mechanisms that should not be disregarded. One is restructuring of water, in which the force is said to originate from an overlap of two boundary layers of perturbed water structure when the surfaces are approaching, i.e. creating a surface-induced water structure.46,74 This theory has mostly been used to explain interactions of a shorter-range type and fails to predict the long-range interaction forces. Another model is the so-called water bridging-cluster model, that, based on thermodynamics, assigns the interaction to depend on organized elongated water clusters between the hydrophobic surfaces.75
2.2.2.3 Hydrodynamic force
The hydrodynamic force as caused by expulsion of water from the volume between the surfaces during approach has also been suggested as a possible mechanism behind the interactions.76,77 However, this is opposed by studies showing that the range and magnitude of the interactions are not affected by the approach or retract speed of the interacting surfaces.54,68
2.2.2.4 Contaminations from hydrophobic species
When using adsorbed surfactants, silanes, thiols or other types of molecules to make a surface hydrophobic, it has been suggested that these molecules can dissolve and affect the measured interactions.78 This theory is contradicted by studies in which also inert surfaces are shown to give rise to the long-range interactions.79 In conclusion, the subject of contamination is definitely an issue and thorough cleaning of the surfaces and other materials/equipment involved is a prerequisite to avoid uncertainties.
2.2.2.5 Surface structure influence on forces between hydrophobic surfaces
For smooth hydrophobic surfaces, the attractive forces have been found to increase with an increase in hydrophobicity as measured by the water

15
contact angle.80,81 When the interacting surfaces instead exhibit an intrinsic roughness, the resulting forces are no longer that easy to predict. Serro and Saramago found an increased adhesion force when changing from a smooth surface to a surface with a four times higher average roughness and attributed this to presence of nanobubbles in the rough features.82 Wallqvist and co-workers investigated two surfaces with nanoparticles of two different sizes disorderly distributed on the surfaces and provided the explanation of less restrictions for cavity growth on the smaller roughness length scale, hence giving forces of longer range and greater magnitude.55 In a third study, Jung and Bhushan argue that the difference in adhesion force between nanostructures and microstructures is mainly due to the difference in contact area.83 Previous findings in combination with the results obtained in this work lead to the following conclusions: If cavities are not formed, the adhesion force decreases with an increase in surface roughness/contact area. If the cavity is allowed to grow to its optimal size, the adhesion is independent of the surface roughness. If cavities form, but is restricted in their growth, the adhesion is less compared to a surface with very low roughness.
2.2.3 Adhesion
Cohesion and adhesion are two intimately connected terms where the first describes the internal energy needed to separate two bodies of the same material while the latter depicts the situation when two bodies of different materials in an intervening medium is to be separated. The work of adhesion can be calculated using
(2-16)
where γA, γB are the surface energies of two materials and γAB is the interfacial energy for the two materials in contact.84 This equation describes the ideal case when the surfaces are perfectly smooth and in equilibrium. For real systems, parameters like roughness, humidity and surface charges make the situation more complicated. The measured adhesion can therefore be a combination of contributions from different types of forces such as van der Waals forces, chemical or hydrogen

16
bonding, capillary forces and steric forces, making interpretation very difficult. In this study, the observed adhesion between the surfaces is mostly explained by capillary forces but it cannot be excluded that other forces, like the van der Waals forces, have an influence as well. Several different theories, developed from contact mechanics, describing the elastic deformation of samples exist. They can also be used to explain adhesion forces in colloidal systems. One of them is the Johnson-Kendall-Roberts (JKR) theory predicting
3π (2-17).85
Fadh is the adhesion force between the surface and the probe and γint is the interfacial tension. The JKR theory can be applied to systems with a large probe, a soft sample and with large adhesion between the surfaces.
2.3 Friction Friction is an important phenomenon occurring between all surfaces moving relative to each other. As early as in the 15th century, Leonardo da Vinci performed studies demonstrating that the friction force, Ff, is proportional to the applied load, FN, and independent of the macroscopic contact area. This was later rediscovered by Guillaume Amontons86 leading to the empirical law of Amontons
μ (2-18)
where μ is the friction coefficient, which was later further developed by Charles-Augustin de Coulomb87 who stated that the frictional force is also independent of sliding velocity. These, apparently simple, discoveries have proven very successful in predicting and studying friction between a range of different materials used in many applications. In general, smooth surfaces show a good correspondence with Amontons’ law also on a microscopic or nanoscopic level.88-90 For rough surfaces, the situation is more complicated and, as Bowden and Tabor pointed out, the true area of contact between two surfaces significantly differs from the apparent

17
area.91 Recently, several studies have addressed the question whether these rules developed for macroscopic surface could be applied for surfaces exhibiting roughness length scales in the nano- or micrometer range. Several of them also found good correlations with the model law of Amontons.92-97 However, for surfaces exhibiting strong adhesive forces, Amontons’ rule is no longer valid. In a load versus friction plot, high adhesive forces are often seen as large hysteresis between the loading and unloading regime as well as a high force offset value, F0. Derjaguin suggested that Amontons’ law should instead read
μ (2-19)
in order to also account for the adhesive forces.27 Several studies have tried to relate the measured friction to either adhesion hysteresis or the adhesion itself, but due to humidity and surface roughness effects it has proven challenging to obtain exact results.98-101
2.4 Wetting The wettability, that is the behavior of a liquid on a solid substrate, is an important phenomenon both in nature and in many technical applications. As previously mentioned, plants and animals often exhibit special wetting behaviors such as the self-cleaning properties of a lotus leaf or the water-repellent wings of a butterfly. The wettability is often discussed in terms of the contact angle at which a liquid droplet meets the solid-vapor interface. A surface with a water contact angle below 90° is termed hydrophilic, above 90° it is hydrophobic and, as previously stated, above 150° it is termed superhydrophobic. In general, a more hydrophobic surface also has a lower surface energy while on a surface with high surface energy, the liquid spreads to a thin film. Young established the connection between the contact angle, θ, and the surface tensions of the solid-liquid, γsl, solid-gas, γsg, and liquid-gas, γlg, interfaces through
cos (2-20)
as can be seen in Figure 2-4.102

The YouFor a rothe appapredict aCassie-B
Figure 2-displayedpenetratiothe right,hidden un
2.4.1 W
The Wenpenetratewetting surface, angle on
where tharea anda hydropcreated comparethe oppo
ung equationugh surface,arent contacand explain
Baxter model
-4. To the leftd. In the middon of the surfa, with a watenderneath, sho
Wenzel stat
nzel regime es the space of the surfacan, accord
n a flat surfac
he roughnesd the correspophobic surfacby the rou
ed to a smooosite with a d
n is valid for , the real cont angle. Thewetting on
ls.
ft, parameters dle, a water dface features iler droplet restows the Cassie
e
is describedbetween thece (Figure 2
ding to the Wce, θflat, by,
cos
s factor, r, gonding projece, energy is
ugh structureoth surface. Fdecrease in co
18
liquid droplentact angle mere exist tw
n a rough su
relevant for Ydroplet on a rllustrates the Wting on top oe-Baxter state
d as the cond roughness f
2-4). The conWenzel mod
cos
gives the ratected surface needed to wes, hence inFor a hydropontact angle
ets on a smoomay significa
wo main theourface; the
Young’s equatrough hydrophWenzel state wf the surface
e.
dition wherefeatures resulntact angle,
del, be relate
atio between e area of a flwet the increancreasing thphilic surfacefor a rough s
oth solid surantly differ fories on howWenzel and
tion (Eq. 2-20hobic surface while the imastructure wit
e the liquid lting in compθreal, on a ro
ed to the con
(2
the real surat surface.103
ased surface he contact ae, the situatiosurface.
face. from w to
d the
0) are with
age to th air
fully plete ough ntact
2-21)
rface 3 For area
angle on is

19
2.4.2 Cassie-Baxter state
In the Cassie-Baxter regime, air is trapped in the rough/heterogeneous surface features causing the liquid droplet to rest on top of an air layer as shown in Figure 2-4. This regime is associated with superhydrophobic surfaces exhibiting large roughness in combination with very low surface energy. The high interfacial energy between water and air leads to a higher contact angle on the rough than on the smooth surface. The contact angle of a heterogeneous surface with patches of different chemistry or wetting behavior can, according to the Cassie-Baxter model, be described by,
cos cos (2-22)
where f1 and f2 are the area fractions of the two types of patches.104
2.4.3 Transitions between Wenzel and Cassie – Intermediate situations
In reality, surfaces often exhibit wetting behavior intermediate to those of the Wenzel and Cassie-Baxter models with partial liquid penetration of the rough structure. Also, studies have shown how transitions between the two clearly defined states are possible by, for example, simply changing the method with which the droplet is added to the surface105 or by increasing the amount of ethanol in a water/ethanol mixture.106 Another method is to put physical pressure on the droplet while it rests on the surface.107 Clearly, the activation energy for transition between the states is low enough for this to occur.
2.4.4 Validity of the assumptions underlying the Wenzel and Cassie-Baxter models
An on-going debate, which had an upswing when Gao and McCarthy published their paper with the provocative title “How Wenzel and Cassie were wrong”,108 discusses the validity of the Wenzel and Cassie-Baxter models. Several previous experiments had already shown how the Wenzel or Cassie-Baxter models failed to correctly predict the contact angle on many surfaces.109-113 This seems to be the case when the droplet

20
covers chemical or topographical heterogeneities but still has its three-phase contact line over a homogeneous area. Recent studies have confirmed these observations suggesting that it is the nature of the surface at the three-phase contact line that decides the value of the contact angle making the situation beneath the droplet insignificant,114,115 while others argue that the debate is all a consequence of incomplete interpretation of the equations or failure in performing the experiments correctly.116-119

21
3 Experimental
In this chapter, the main instruments and techniques used to perform the scientific studies reported in the thesis are presented.
3.1 Atomic force microscopy The atomic force microscope (AFM) was introduced in 1986 by Binnig and co-workers.120 At first, it was mainly used to image the topography of samples at a resolution of nanometer down to atomic scale, by moving a sharp tip in lateral direction over the surface. By the development of the colloidal probe technique, where a spherical probe or another object with a defined geometry is used to map the surface, force and friction measurements between surfaces using the AFM became increasingly used.121,122 Lately, an increased interest to extract more parameters from the force curves resulting from every tip-surface interaction, has enabled new modes in which properties like adhesion, stiffness and electrical conductivity can be quantitatively measured with high lateral resolution. The main principles of the AFM are illustrated in Figure 3-1. The sample is placed on top of a scanner which can move the sample and cantilever relative to each other in x, y and z directions by the utilization of a piezoelectric material. A laser is focused on the backside of a cantilever, which is the part that senses the sample, and reflected onto a detector, often a split photodiode. The front side of the cantilever pointing towards the sample has either a sharp tip or a probe with another geometry that interacts with the surface. The interaction, whether it is attractive or repulsive, makes the cantilever deflect which changes the position of the reflected laser beam in the detector. The voltage output signal from the detector can be translated into height changes or forces.

Figure 3focused ofurther re
3.1.1 Im
Traditionthe recorwith diftechniqudimensioexist diffthe modinformatcontact imagingtool duesamples.the surfaand softautomatifrom Bruextract mimage frparametealso fast
-1. Schematicon the back
eflected onto t
maging
nally, the AFrding of heifferences in
ue. The resoon of the smfferent imaginde can be chtion wanted.by keeping . Tapping m to its gentle. The cantileace gently. Tftware that ion. Recentluker or the P
more details from Tappingers such as aer informatio
c illustrating tside of the c
the photodiode
FM has beenght images. n height scolution of tmall tip attacng modes likhanged depe In contact the level o
ode® has, sieness, makinever is oscillThe trend in are easy toly, several nPulsed force from the forcg mode can adhesion or son compared
22
the principle cantilever withe detector.
n used to studMany differ
cales have he measuremched to the ke contact moending on thmode, the tif the detectoince long, beng it possiblelated at its reAFM imagin
o handle annew modes mode from
ce curves. Thnow be res
surface deford to before.
of the AFM th the attache
dy topographrent moleculbeen studiement is detend of the code and Taphe material ip and surfaor response
een the most e to image sesonance freng goes tow
nd provide alike the PeWitec give he previouslysolved into rmation, pro
with a laser bed probe and
hy of surfaceles and mateed through termined bycantilever. T
pping mode®and the typce are alwayconstant dupopular ima
soft and sensequency and
wards instruma high leveakForce QNthe possibiliy recorded pseveral diffe
oviding more
being then
es by erials
this y the There ® and pe of ys in uring aging sitive
taps ments el of NM®
ty to phase erent e and

3.1.2 F
Normal and the svertical in imagiforces. Tsphericato the caforce usiflat surfa
Figure 3cantileverdisplacemcomplianseparationdetector s
Raw datdeflectioregions odata intoconstant probe anthe regioregion othe concantileve Numerouthe Sade
orce
forces betwesurface can bdirection. Thing techniquThe develop
al probe, a fibantilever, hasing the Derjace interactio
3-2. To the ler deflection/v
ment in vertince and 2 the rn curve obtaisensitivity (α0
ta from a noon in voltagof the force o force as a t compliancend sample aron where nof zero force.
nstant compler spring con
us methods ter,123 Hutter
een a tip or cbe measured he poorly deues makes itpment of thber or anothes facilitated aguin approxon equations
eft, raw data voltage outpuical directionregion of zero ined from mo) and the norm
ormal force mge against sccurve need tfunction of p
e region defire in physicao force is ac The detectoliance regio
nstant, kn, to
to calibrate c& Bechhoe
23
colloidal proby moving t
efined geomet non-adequahe colloidal er object witha precise deximation (Eq.
from a normut plotted a
n. 1 indicateforce. The im
odification of mal spring con
measurementcanner displto be locatedprobe-surfacining the haral contact. Tcting on the or sensitivityon is used calculate the
cantilevers hefer124 and C
obe attached them relativeetry of the tiate for caref
probe techh a defined getermination q 2-3)27 and
mal force measas a functions the region
mage to the rigthe raw data
nstant (kn).
nt are expresslacement (Fid in order to ce separationrd wall cont
The second ocantilever,
y, α0, as giventogether w
e normal forc
have been prCleveland125
to the cantile to each othip normally ful translatiohnique, whegeometry is g
of the meassphere/cylin
surement withn of the scan of the conght displays a a using the no
sed as cantiligure 3-2). translate the
n. The first istact at whichone is definehence calledn by the slop
with the noce.
roposed of wmethods are
lever her in used
on to re a
glued sured nder-
h the anner nstant force
ormal
lever Two
e raw s the h the ed as d the pe of rmal
which e the

most widbased ona viscoufreely atobtainedcantilevedimensiofluid to motions be calibr
Figure 3in lateral reflectionmeasurem
3.1.3 Fr
As illussample cnormal lmake thadjustmethere wiretrace. frictiona
dely used. Tn the principus fluid. Durt its resona
d frequency, er is i.e. howons of the cget the normin lateral dir
rated, and thi
-3. Schematic direction wh
n of the lasement.
riction
strated in Fican be measload and mohe cantileverent in the phill be a diffeThis value
al force, Ff, u
The Sader mle that the thring calibratnce frequenf, and Q-v
w much energantilever andmal spring crection, also is is done sim
c image of a phich makes ther spots is c
igure 3-3, frsured by keeoving them inrs twist andhotodetector.erence in det
is employedusing:
24
method has behermal motioion, the can
ncy due to talue, which
gy loss that od the viscosiconstant, kn. the torsiona
milarly to wh
probe in contahe cantilever tchanged in t
riction betweeping the surn lateral dire
d change ang. By scannintector signal,d to convert
een used in on of an objentilever is allthermal motdescribes h
occurs, are usity, η, and dWhen meas
al spring conshat is describ
act with a surtwist. The insthe split pho
een a colloirfaces in conection. The fgle, resultinng the probe, ΔVf, betwet the detecto
this work anect is dampelowed to vibtion in air. how dampedsed together density, ρ, ofsuring cantilstant, kt, need
bed above.
face that is msets show howotodiode duri
idal probe anntact at a knfriction will
ng in a torsie back and feen the traceor output to
(
nd is ed by brate The
d the with f the lever ds to
moved w the ng a
nd a nown then
ional forth, and
o the
(3-1)

25
where δ is the torsional detector sensitivity and heff is the effective height, i.e. the diameter of the probe plus half the thickness of the cantilever. The friction coefficient, µ, is defined as the slope of the linear fit for friction as a function of applied load. To determine µ, the measurement is started with the probe and sample out of contact followed by a stepwise increase, and then decrease, of the load.
3.1.4 Contact angle of colloidal probe
The method of measuring the contact angle of a single particle attached to a cantilever, called microsphere tensiometry, has been developed by Preuss and Butt126,127 and the continued developments of particle-bubble interaction measurements using the AFM have been summarized by Johnson et al.128 Dynamic contact angles are measured either by recording a force curve against a water droplet in air or an air bubble in water. From the force curve between the probe with radius, R, and the water droplet, the maximum adhesion force, Fadh, gives the advancing contact angle, θa, according to
2π sin (3-2)
while the receding contact angle, θr, is given by the jump-in distance, D, from an approach force curve between the probe and an air bubble using
cos (3-3).
The advancing and receding contact angles correspond to the macroscopic contact angles described below through the movement of the three-phase contact line over the surface. When receding, less and less of the particle surface is in contact with the liquid while during advancing, the particle is pulled out of the air bubble hence having an advancing three-phase contact line.

26
3.2 Confocal Raman microscopy The combination of a confocal microscope with Raman spectroscopy gives a technique suitable for spectroscopic mapping of elements on a surface. Applications range from phase separation of liquids such as alcohol-water mixtures129,130 to analysis of paper131,132 and pharmaceutical products.133 In a confocal microscope, a lens or objective is utilized to focus a point-like light source onto a sample. The lens also focuses the image spot onto an aperture, whose size is chosen to only let the central part of the light pass through and reach the detector.134 This enables the recording of three-dimensional images and a better image contrast in comparison to conventional light microscopy. Raman spectroscopy is based on inelastic scattering of photons giving a frequency shift that provides information about vibrational, rotational or other low frequency transitions in a molecule.135 An incoming photon can either be absorbed by the molecule it encounters, which causes a change in dipole moment that can by studied by infra-red (IR) spectroscopy, or induces a polarization in the molecule, which produces an electromagnetic scattered radiation of photons away from it. Most photons that scatter from the sample have the same frequency as the incident photons, giving rise to Rayleigh/elastic scattering. However, a small fraction of the photons is scattered at different frequencies, i.e. inelastic collisions between the photon and the molecule have changed the vibrational energy of the molecule, thus causing Raman scattering.134,136 In a confocal Raman microscope, a Raman spectrometer is attached to a light microscope. By using a microscope, the light can be focused on small spots of micrometer sizes, hence increasing the resolution and the collecting efficiency. A schematic image of a confocal Raman microscope is shown in Figure 3-4. A map of the different chemical components on a surface can be created by scanning the sample in xy direction, recording a Raman spectrum in every image pixel. The best

possible and can b
where λresolutio
and is ofof Ramamaximumresolutiofunctionlocated acan be FWHM.when co
Figure 3-
resolution tbe calculated
is the laseon in vertical
ften ~500 nman spectra am (FWHM)
on for a conn given by that half the maresolved if
141 In this wovered by dif
-4. Schematic
that can be od using
r wavelengtl direction is
m.137,138 Depthalong a fixeis a term of
nfocal systemhe horizontaaximum valu
f the distanwork, it was ufferent liquid
c image of a ty
27
obtained in l
0.61 /NA
th and NA tgiven by
.
h profiles areed horizontaften used form.139,140 It isal line betweue of the curvce between used to defins.
ypical confoca
lateral direct
A
the numeric
e recorded byal axis. The r determinatis defined aseen two poive. This mea them are
ne the positio
al Raman micr
tion is ~ 200
(
al aperture.
(
y extracting full width
ion of the sp the extent ints at the cans that two larger than
on of the sur
roscope.
0 nm
(3-4)
The
(3-5)
a set half
patial of a
curve lines
the rface

28
3.3 Contact angles The sessile drop method is the most common way to measure the macroscopic contact angle of a surface. A drop is placed on the substrate of interest and its two-dimensional profile is recorded, often using a high resolution camera. The droplet baseline and shape are commonly analyzed by a program to get an exact value of the contact angle. Advancing and receding contact angles can be measured in two different ways; either by adding or removing liquid from the droplet with a syringe or by tilting the surface. Both methods depend on analyses of the contact angles when the droplet starts to move or roll over the surface. The contact angle hysteresis is given by the difference between the advancing and receding contact angles.
3.4 Surface preparation Surfaces with the desired structure and properties were a prerequisite to be able to perform interpretable and reproducible force measurements. Today, there exist numerous methods to prepare structured surfaces of different sizes, morphology, wetting behavior and surface energies. The increased interest for fabrication of superhydrophobic surfaces during the last decade has led to the development of new methods as well as improvements of older ones.
3.4.1 Langmuir-Blodgett
In order to prepare particle coated surfaces with a monolayer of particles and with the packing of particles as close to hexagonal as possible, Langmuir-Blodgett (LB) deposition was the method of choice. LB has, since long, been an established technique for deposition of amphiphilic molecules to prepare well-ordered monolayer surfaces.142-147 The principle for deposition is described in Figure 3-5. The molecules or particles to be deposited are spread on a subphase in a Langmuir trough followed by compression of the barriers until a certain deposition pressure, i.e. a compact monolayer is reached. Surface pressure versus area (π-A) isotherms give information on the collapse pressure, and

indicate be carrieeither bdirectionmoleculefrom a wprior tohydroph
Figure 3particles from the the result
3.4.2 L
Lithograetching exist to micromephotolithused in between to the sthicknes
the area withed out. The mby lowering n depends oes and substwater subphao spreading
hilic/hydroph
3-5. Principleare spread onliquid while
ting particle co
Lithography
aphy was useof pores in
create strueter range. Thography, anthis work. A the substratsubstrate thrs of a coupl
h large pressmolecules or
or raising on the hydrotrate. Deposase, demandsg in the
hobic balance
e of particle n the water sumaintaining
oated surface.
y and etchi
ed to preparea surface. S
uctures bothThe most comnd this was tA promoter e and the ph
rough spin cle of microm
29
sure changesparticles arethe substrat
ophilicity anition of hyds adsorption
trough ine and prevent
deposition uubphase, in ba constant de
ng
e a pattern tSeveral diffeh in the nanmmon for mthe method is often addotoresist laycoating to g
meters. Light
s where the de deposited ote from thend/or hydropdrophilic par
of surfactann order tot the particle
using the LBb) the substrateposition pres
that acted aserent lithogranometer as
micrometer siused to prep
ded to increayer. The photget a uniforwith varyin
deposition shonto the subse subphase. phobicity ofticles, like s
nt to the parto control es from sinkin
technique. Ite is slowly rsure and c) sh
template duaphic techniwell as in
ized structurpare the surfase the adhetoresist is apprm layer wing intensities
hould strate
The f the silica ticles their ng.
In a) aised hows
uring ques
n the res is faces esion plied ith a s and

30
at different exposure times, is then used to create the desired pattern in the surface. This is followed by etching of the areas not protected by the photoresist, hence making a pattern in the underlying substrate. Several different etching techniques are available but here, deep reactive-ion etching using the Bosch process was employed to create the structures.148 The plasma contains ions from sulfur hexafluoride (SF6) that etch the surface followed by passivation with octaflurocyclobutane (C4F8) to get a protecting chemically inert layer. The number of etching and depositing steps as well as the time of each cycle can be adjusted to get the desired depth and structure of the pores.
3.4.3 Dip coating
A fast and easy approach to prepare surfaces with deposited particles, polymers or other molecules is sometimes required. Simple dip or drop coating techniques, where the molecules are subjected to a substrate either by repeated immersion of the substrate in a suspension or putting a droplet of the suspension on the surface and let it dry, are often efficient. Superhydrophobic surfaces, where a certain disorder and/or a roughness at different length scales often are required, are easily prepared in this way but also more structured surfaces where particles assemble on a surface by lateral capillary forces can be fabricated.149,150 In this work, superhydrophobic surfaces were prepared by dip coating of glass substrates into a dispersion containing silica nanoparticles and a fluoropolymer creating a rough multilayered structure.
3.4.4 Sintering
The robustness of the surfaces was a major concern in this work, especially when using surfaces with particles that easily could be removed by touching them with an AFM tip or probe. A common way to make robust surfaces is by sintering at a temperature close to the melting temperature of, preferably, both the substrate and the deposited particles.

3.4.5 S
Hydrophhydrophgold are Howevepresent wreaction Figure 3silanizedgroup onenergy othereforelinks acrIn the owere use
Figure 3self-assem
ilanization
hobization ohobic propert
two well-estr, since surfwork, silanizof attachme
3-6. Surfacesd due to thein the silaneof the surface, a fluorocaross the surfother studiesed.
-6. The silanembly of a silan
n
of the surfacties. Plasma tablished tecfaces made zation has beent of silaness like glass, sir hydroxyl ge forming a ce, the morearbon based face, was use, mono- or
es used in thine to a glass o
31
ces was utilpolymeriza
chniques to rof silica or een the mains to an inorgsilicon wafergroups being–Si-O-Si- b
e hydrophobtrifunctional
ed to preparetrifunctional
is thesis workor silicon surfa
lized to receation151 and render a surfa
silicon wern method useganic materiar and metal og able to disbond. The lobic the surfal silane, thate superhydrol hydrocarbo
k and a schemaces.
eive the desthiolization1
ace hydrophore utilized ined. The coupal is describeoxides can aplace the alk
ower the surace becomes t can form crophobic surfaon based sil
matic figure o
sired 52 of obic. n the pling ed in all be koxy rface
and ross-aces. lanes
of the

32
4 Results
In this chapter, the main findings from the six papers included in this thesis are presented and discussed. The focus will be on summarizing the results and to create a cohesive picture of all studies. At first, the procedures utilized to prepare the three different types of surfaces, that is the particle coated surfaces, the pore array surfaces and the superhydrophobic surface, will be explained. This is followed by the results from the surface characterization process, including contact angle and confocal Raman measurements. The main part is then the summary of the results from the force measurements in which also the results from friction studies are discussed. The next section focuses on spectroscopic measurements on hydrophobic and superhydrophobic surfaces and removal of air cavities by addition of ethanol. The chapter ends by a discussion on the origin of interactions between hydrophobic surfaces, how they are affected by surface structures and different ways to predict them.
4.1 Surface preparation Surfaces with defined and controllable structures and hydrophobic properties were a prerequisite to be able to study how surface interaction forces are affected by surface structure and roughness. This is why surfaces with very ordered structures consisting of monolayers of coated particles or pore arrays were prepared. In Figure 4-1, schematic figures of the particle coated and pore array surfaces can be seen. In some cases, the difference between hydrophobic and superhydrophobic surfaces was of interest, which demanded the preparation of superhydrophobic surfaces as well.
4.1.1 Particle coated surfaces – Langmuir-Blodgett deposition
Particle coated surfaces, with silica particles having diameters of 30, 60, 90, 200, 800 and 4 000 nm, were prepared by Langmuir-Blodgett (LB)

depositioarea (π-Awhich thdifferentpacking,collapse to higherpressurehigher te
Figure 4array surfriction m
Initial departiclesshowed experimeparticlesthe solveby chlorwere remsmaller coated su
on as furtherA) isothermshe monolayert deposition, it was conpressure res
r deposition , which prevendency to ag
-1. A schemarfaces togethemeasurements.
eposition of s (200, 800, 4large aggregents reveale
s in the trougent exchangroform. By moved and wparticles. Aurface with 8
r described ins in the Langr of particles
n pressures ncluded thatsulted in a mpressures. Aviously haveggregate and
atic illustrationer with a typ.
f particles ga4 000 nm) wgates on the sd that aggregh, meaning e process wfiltration of well-ordered
An AFM im800 nm parti
33
n Paper II. Rgmuir troughs collapses. B
and compat a depositio
more defined At pressures oe been used,d deposit on t
n of the particpical colloidal
ave well-ordewhile the sma
surfaces. Dyegates were that they we
when water othe particlesurfaces co
age showingcles can be s
Recording of h gave the suBy preparingaring the reon pressure structured s
of 60 and 90%153,154 the patop of each o
cle coated surl probe used
ered structuraller particlesynamic light
present befoere most pro
or isopropanoe dispersionsould be prepag an exampseen in Figur
surface pressurface pressu surfaces at tesulting par
of 30% ofurface comp% of the collarticles showother.
rfaces and the during force
res for the las (30, 60, 90 scattering (D
fore spreadinobably formeol were repls, the aggregared also forple of a parre 4-2.
sure-ure at three rticle f the pared lapse
wed a
pore e and
arger nm)
DLS) ng of ed in aced gates r the rticle

Sinteringrobustnehydroph
Figure 4LB. 15 xparticles, show the
Figure 4-a pore dep(HRSEMimage, sc
4.1.2 P
A photocircles w
g of the suess. Silanizahobic.
-2. a) AFM ix 15 µm2 b)
which showpattern of par
-3. An examppth of 4.0 µm
M) where a) scale bar: 1 µm
ore array s
olithographic with two di
urfaces wasation, here
image of a paFourier trans
ws a clear hexrticle arrangem
ple of a pore am recorded by h
hows a top-vm.
surfaces – P
template wfferent pore
34
s performedin gas pha
article with 80sformation ofxagonal patterment on the su
array surface whigh resolutio
view, scale ba
Photolithog
as used to ce spacings,
d in order ase, rendere
00 nm particlef an AFM imrn. c) The heurface.
with pore spacon scanning elar: 10 µm, an
graphy and
create a patte1.4 and 4.0
to increase ed the surf
es deposited umage with 80exagonal mark
cing of 1.4 µmlectron microsnd b) a side-
d etching
ern consistin μm, on sil
the faces
using 0 nm kings
m and scopy -view
ng of licon

wafers. Tcreate pogive thecycles, sdifferentdifferentand 0.2, images o For the performe
Figure 4nanopartirecorded
4.1.3 Su
Repeatedparticle/fstructuredeveloperobust, fsurface eof a sup
This was folores followe
e pores a prsurfaces witht pore spacint pore depths1.0, 2.4 and
of a pore arra
pore arrayed in liquid p
4-4. A superhicle/fluoropolyby AFM imag
uperhydrop
d dip coatfluoropolyme on both ed protocol.1
followed by energy to mperhydrophob
llowed by eted by passivrotecting layh different p
ngs, 1.4 μm as; 0.3, 1.5, 4d 8.0 μm for ay surface ar
y surfaces,phase in a sil
hydrophobic symer/fluorosoging.
phobic sur
ting of glamer/fluorosolv
micro- and 55 Sintering silanization
make the surfbic surface
35
tching with vation with Cyer. By varypore depths and 4.0 μm, w.0 and 12.0 μthe latter. Te displayed i
hydrophobilane/toluene
surface prepaolvent solutio
rfaces – Dip
ass substratvent formu
nanoscale was utilized in gas phas
faces superhyis shown in
SF6 on the eC4F8 to stop ying the numcould be prwere each obμm for the f
Top-view andin Figure 4-3
ization by smixture.
ared by dip con followed
p coating
tes into a ulation cre
according to make the
se to give thydrophobic.
n Figure 4-4
exposed areathe etching
mber of etcrepared. The btained with first pore spad side-view S3.
silanization
coating in a d by silaniz
16 nm seated a roto a previo
ese surfaces mhe necessary
An AFM im. As a refer
as to and
ching two four
acing SEM
was
silica zation
silica ough ously more
low mage rence

36
surface, a glass substrate was dip coated in a fluoropolymer/fluorosolvent mixture without nanoparticles followed by silanization, thereby producing a hydrophobic surface with similar chemical composition as the superhydrophobic one.
4.2 Surface characterization Characterization of the surfaces in terms of their structure, roughness and wetting properties are crucial in order to develop an understanding of the unique situation at the different surfaces. A summary of the macroscopic water contact angles measured on all the different surfaces can be found in Figure 4-5.
4.2.1 Particle coated surfaces – Hexagonal structure and robustness
The particle coated surfaces needed to be robust and to have a defined surface roughness and structure in order to know that all parts of the surfaces behaved homogeneously during measurement series. Information about the structure was mainly provided by the recorded AFM images but also contact angle measurements were used to elucidate the particle packing. The most optimal packing for spherical particles on a surface is hexagonal close-packing. Fourier transforms of the AFM images revealed a short-range hexagonal order but disorder on a longer scale. An example of an image of a surface with 800 nm particles with an average particle to particle distance of 874 nm can be seen in Figure 4-2b. Roughness analysis of the AFM images gave experimental Ra values, which were compared to theoretical values calculated using the equations proposed by Oudrhiri-Hassani and co-workers156 and based on hexagonal packing. The theoretical values were higher than the experimental ones and the difference was larger for the smaller particles. This observation is suggested to not only be a consequence of the more disordered structure of the smaller particles, but also of the AFM tip not being sharp enough (R approx. 3 nm) to precisely probe the area between the small particles which is discussed in more detail in Paper II.

37
After hydrophobization, macroscopic water contact angles were measured on all the surfaces. As expected, the increased roughness on a particle coated surface compared to a flat glass substrate gave an increase in contact angle from 108° for the flat surface to 120-124° for the particle coated surfaces (Figure 4-5). No trend in contact angle with respect to particle size could be detected; hence the wetting degree is the same for particles in the micrometer size range as well as for nanoparticle smaller than 100 nm. The roughness factor, r, as included in the Wenzel equation (Eq. 2-21) can be calculated from the contact angle measured on a particle coated surface compared to the value measured on a flat surface. The theoretical value, r = 1.9, was calculated by combining hexagonal geometry and a hemispherical model.157 The experimental roughness factors varied between 1.62 and 1.81, i.e. again indicating short-range hexagonal order but also the occurrence of a slight longer-range disorder. To calculate r, one must assume the surfaces to be in the Wenzel wetting regime which means the surfaces would be completely wetted. This seems likely for the large open areas between the top parts of the particles. However, the narrow cavities at the bottom part of the volume between the particles could contain air pockets, which would create a small degree of Cassie-Baxter state in this area. The packing density and the theoretical roughness factor suggest that approximately 95% of the area is wetted (Wenzel state) while the remaining 5% consist of air being trapped close to the surface (Cassie-Baxter state). Hence, the experimental roughness factors could be used to conclude that also contact angle measurements suggest a local order and a long-range disorder due to slight discrepancy from the theoretical value. It has been shown that, in order to induce a complete transition in the wetting regime from Wenzel to Cassie-Baxter state for particle coated surfaces, multilayers of particles in the micrometer size range with at least one layer of nanoparticles on top, are necessary.22
To test the robustness of the surfaces after sintering, an AFM tip was moved in contact mode over the surface and AFM images were recorded on the same spot before and after testing of the robustness. The pressure at which the surfaces were tested was chosen to be 2 GPa. This was

proven tduring thseveral dorder to to start carried oparticlesis advanparticle c
Figure 4surfaces. surfaces ppore dept
4.2.2 Pline and
Macroscethanol i
o be high enhe force and different sincreate a goomelting togeout at a tem
s and the subntageous. Mocoated surfac
4-5. SummaryThe surfaces presented to tth
Pore array d water pen
copic contacin water wer
nough to tell wfriction mea
ntering tempeod robustnessether. In conmperature clbstrate, whichore informatces can be fo
y of static wtermed 30-80
the right are th
surfaces –netration in
t angles witre measured o
38
whether the asurements. Aeratures ands, both the panclusion, sinlose to the h means usintion on prep
ound in Pape
ater contact 00 nm are the he pore array
– Structurento the por
th water andon the hydro
surfaces wouAfter careful
d times it waarticles and ntering shoumelting tem
ng the same paration ander II.
angles on allparticle coatesurfaces. p =
e of three-res
d different cophobized po
uld stay the sl examinationas found thathe substrate
uld preferablmperature ofmaterial for
d analysis of
l the hydrophed surfaces an= pore spacing
-phase con
concentrationore array surf
same ns of at, in e had y be f the both f the
hobic nd the g, d =
ntact
ns of faces

39
(Figure 4-5). In comparison to a flat reference surface, the contact angles on both the surfaces with 1.4 μm and 4.0 μm pore spacing had increased. However, no trend in contact angle with respect to pore depth was found, neither for water nor ethanol droplets. The contact angles were, in general, a bit higher on the surfaces with the smaller pore spacing which could be due to the larger amount of pores and therefore a more bent three-phase contact line. Theoretical contact angles were calculated using the widely used equations by Wenzel (Eq. 2-21) and Cassie-Baxter (Eq. 2-22). However, the Wenzel equation was not possible to use due to a too large extra area provided by the pores which would give a cosine of the angle out of range. The Cassie-Baxter model gave both water and water/ethanol contact angles that were larger than the experimental values by around 5°. As mentioned in section 2.4.4, the validity of the models has been seriously questioned. Several studies have shown the insignificance of heterogeneities underneath the droplet and suggested the situation at the three-phase contact line to determine the contact angle.108,109,113 The discussion regarding this matter contains arguments in favor of the models suggesting a too small size of the liquid droplets in relation to the surface structures158 and they propose the usage of local instead of global values of the roughness ratio.116 The results from the present study confirm the need for a critical approach when using the Wenzel and Cassie-Baxter equations. Since the models did not predict an accurate result, the situation at the three-phase contact line was investigated by recording light microscopy images displayed in Figure 4-6. They revealed a jagged line with water wetting between the pores, while the 1:1 water/ethanol and the ethanol droplets behaved differently showing straight three-phase contact lines and no wetting in-between each pore. Sliding angles, that is the tilting angle at which the liquid droplet first starts to move, were also collected and the droplets were studied during sliding. No significant difference between the surfaces was noted but the sliding angles were higher, 45° compared to 35°, with 20% ethanol than with water droplets. This could be compared to a sliding angle of 15° measured on the flat reference surface. The droplet movements over the pore array surface were not smooth but more step-like. It seemed like the

front of tjump to was chan
Figure 44.0 µm adroplet anis jaggedstraightersurface cpenetrate
Even tholine are importanfurther inliquid, crecordedslide on recordedclearly surprisinand a cowas specthe poresbe silani
the droplet wthe next por
nging during
-6. Liquids onand a pore depnd b) an ethand and seems r lines. c) A tcovered with d into the por
ough the conof interest,
nce for the fonvestigate thconfocal Ramd. At first, wa
top giving d both in xy ashow water
ng since wateontact angle culated whets originatingized or inco
was pinned are. Also the g movements
n a hydrophobpth of 8.0 µmnol droplet sh
to avoid theop-view and water where
res. Scale bars
ntact angle a, the situati
forces betweehe wetting beman microsater was adda liquid filmand xz directr penetratioer should not
higher thanther this obseg either from omplete remo
40
t one side ofshape of the
s across the d
bic pore arraym. a) A light mhowing that the pores whiled) a side-viewe water is se: 5 µm
and the shapon underneaen the surfacehavior in an
scopy imageded to the surm of approxitions. The imon into the t be able to g
n 90° accordervation is dua lower amo
oval of the
f a pore folloe receding padifferent pore
y surface withmicroscopy im
he water three-e ethanol we
w confocal Raeen as yellow
pe of the thrath the dropces and a colnd above po
es and Ramrface with a mimately 10 μ
mages displaypores. Th
go into poresding to capilue to a differount of OH gC4F8 passiv
owed by a sudart of the droes.
h a pore spacinmage with a w-phase contacets the surfacaman image ow and has cl
ree-phase conplet is of mlloidal probe
ores covered an spectra wmicroscope gμm. Images wyed in Figureis is somews having thisllary theory.1
rent chemistgroups that cvation layer
dden oplet
ng of water t line ce in of the learly
ntact major e. To by a were glass were e 4-6 what size 159 It ry in
could after

41
etching, making the silanization process less efficient. To make sure the silane had access to the pores during silanization, confocal Raman images were recorded with toluene (in which the silanization procedure was carried out). The images showed that toluene could easily penetrate into the pores and that silane had indeed been in contact with the pore walls. More information on these wetting studies using water can be found in Paper V.
4.2.3 Superhydrophobic surface – Lotus effect
As already mentioned, the surface roughness, measured from AFM images, for the superhydrophobic surface was much larger, about 100 times, compared to a flat surface but also around 15 times larger than the particle coated surfaces with a monolayer of nanoparticles. This increase in roughness gave a water contact angle of around 152° on the superhydrophobic surfaces, which decreased to 105° for a 1:1 water/ethanol mixture and to 22° for pure ethanol. The surfaces exhibited the lotus effect with extremely low roll-off angles for water droplets.
4.3 Force measurements A typical force-distance curve measured between hydrophobic surfaces in aqueous solution has many characteristic features as discussed in Section 2.2.2 and an example is displayed in Figure 4-7. On approach, no interaction between the surfaces is observed until there is a sudden on-set of attraction which makes them jump together. The distance, in this case approximately 25 nm, is referred to as the jump-in distance. The shape of the approach curve can vary and both smooth and continuous curves as well as discontinuous jumps towards to the surface have been observed before.43,47,55,71 When the surfaces start separating, the maximum adhesion force is observed as a minimum in the force curve. As described in the theory section, the features of this force curve can be interpreted by formation of an air cavity causing a strong attraction between the surfaces on approach. On retraction, the cavity is extended and breaks at a certain position, called the rupture distance. In the studies presented here, the adhesion force, the jump-in distance and the rupture distance were

statisticaForce cufitted to measurealways surface tto a relia
Figure 4surface anto Eq. 2-1retract cu
4.3.1 Plength s
Forces wby LB desize simicurves mterms of the forcmechanithe norm
ally analyzedurves measuEq. 2-14 as
ments betwaccompanie
to establish table referenc
-7. An exampnd a hydropho14. The grey b
urve.
Particle coscale and e
were measureposition excilar to the prmeasured onf their shape ce curves gaisms during mal shape pr
d. In Paper ured betweenssuming capieen the strud by measthe consistene surface.
ple of a force obic colloidalbroken line is
oated surfaextremely l
red between cept the 4 00obe made m
n different sand statistica
ave indicatioa measuremresented in F
42
V, the ruptn flat hydropillary forces uctured surfurements be
ncy of the res
curve measul probe. The sthe approach
aces – Deplong-range
all the parti00 nm particleasurementsspots on theal values. Boons of the o
ment series. MFigure 4-8a,
ture force isphobic surfac
between thefaces presenetween a fsults and com
ured between asolid grey line and the black
pendence e forces
icle coated sles; their pols difficult. The surfaces woth statisticsoccurrence o
Most of the , but there w
s also discusces can oftee surfaces. F
nted below wflat hydrophmpare the va
a flat hydrophe is a theoretick broken line i
on roughn
urfaces prepydispersity ahe resulting f
were analyzeand the shapof two diffeforce curveswere also cu
ssed. n be
Force were
hobic alues
hobic cal fit is the
ness
pared and a force ed in pe of erent s had urves

displayinhundredsretract cu(Figure 4long-ranmeasureappearanreferencetype of fnor anytunusual particle from noPopulatistatistica
Figure 4particle ccolloidal hydrophorange intresembles= approac
StatisticsdisplayinFigure 4the inter
ng extremelys of nanomeurve indicati4-8b). A clo
nge force cuments with nce while the measuremforce curves thing else inbehavior. Incoated surfa
ow on referon 2 for the
al occurrence
4-8. Represencoated surface
probe. a) Sobic surfaces, teraction dists force curvesch curve, blac
s from the fong the Popu4-9. As clearaction distan
y long-range eters, ruptureing an increaoser analysisurves the sm
30 nm parhe fraction
ments with a which prov
n the experinstead, the race structure.rred to as Plong-range t
e was analyz
ntative forcee, in this cas
Shows the nohere called po
tance type ofs measured b
ck line = retrac
force measurulation 1 forcly seen, the
nces are large
43
forces with e distances inase in capilla
revealed anmaller the particles, almo
was 0.5% flat surface
ed that neithimental set-ureason behin The two difPopulation 1type, were sped separately
curves measse with 30 nmormal type oopulation 1 anf force curveetween superhct curve
rements withce curve apptrend is thater the smalle
jump-in disn the micromary volume dn increased aarticles on
ost 30% hadfor 800 nm
e displayed her the probeup was resp
nd must be ffferent types1 for the nplit into two y.
sured betweem particles aof force curvnd b) shows thes (populatiohydrophobic
h the particlepearance aret both the ader the particle
tances of sevmeter range aduring separaabundance othe surface.
d the long-rm particles. only the noe, liquid medponsible for found withins of force curnormal type
groups and
en a hydrophand a hydrophve often seenhe extremely ln 2) that closurfaces. grey
e coated surfe summarize
dhesion forcees on the sur
veral and a ation f the
For ange The
rmal dium
this n the rves, and
their
hobic hobic n for long-osely y line
faces ed in e and face.

This is tdifferencreferencecoated sucavity foroughnesthe largemore unaltered tcertain rparticlesover the
Figure 4between surfaces. general, tparticle d
Mean vaPopulatiparticle enormoudistance Also, du
true for the ce between te surface durfaces. Thi
ormation, poss is too lare particles dstable and eato find an oroughness tos also provid
surface.
4-9. Summarya hydrophobOnly values
the adhesion fdiameter on th
alues calculaon 2 showedsize. The a
usly from ovalues coul
ue to the very
30, 60 and 9the 200 and isplays valus suggests thssibly due to
rge, pinning decreases thasier to breakptimal conta
o rest on. Thdes energy b
y of statisticabic colloidal ps from Populforce and the e surface is de
ated from alld, in contrastdhesion forcne measuremld range froy few Popul
44
90 nm partic800 nm par
ues intermedhat a certain o excess air w
of the threee adhesion k. Possibly, tact angle forhe larger heibarriers for t
l values obtaprobe and thation 1 forceinteraction di
ecreased.
of the force t to Populatioce, jump-in ment to anom approximation 2 force
cles while thrticles. Inter
diate to that surface rou
within the stre-phase contforce and mthe shape of r growth if ight differenthe moveme
ained from fohe hydrophobe curves can istances are in
curves assigon 1, no trenand rupture
other. For emately 800 nme curves reco
here is very restingly, thet of the parghness promructure, but iact line betw
makes the cathe cavity cathe cavity h
nce for the laent of the ca
orce measurembic particle co
be seen herncreased whe
gned to belonnd with respee distance vaexample, rupm up to 2.5orded for sev
little e flat rticle
motes if the ween avity an be has a arger avity
ments oated e. In n the
ng to ect to aried pture μm. veral

45
of the surfaces, reliable statistics were not obtained. When discussing the reason for formation of the Population 2 force curves, the first thing that comes to mind is its similarity to force curves measured between superhydrophobic surfaces.155,160 Superhydrophobic surfaces are known to be in the Cassie-Baxter state with a large reservoir of air underneath the water droplet. As concluded from the wetting studies and mentioned in the discussion about Population 1 force curves above, the particle coated surfaces display a slight degree of Cassie-Baxter wetting with trapped air between the particles. This excess amount of air is most likely a prerequisite for Population 2 curves to form, providing an in-flux of air when retracting the probe during a measurement. Already on approach there is a profound difference between the two populations. The on-set of attraction starts at a larger separation distance for the Population 2 force curves and they often show a sharper jump to lower forces with some repulsive steps in-between. This can be interpreted as air bubbles being present on top of the roughness features and the steps are then a consequence of the deformation of the bubble during approach. This would also explain why Population 2 force curves are more frequently appearing for the smaller roughness length scales; an air bubble of around 100 nm can easily rest on top of the 30 nm particles but for the larger particles, it is more likely they will be found in the crevices between particles. Hence, air nanobubbles found on the particles in combination with the air reservoir found between and beneath the particles are the reasons this type of force curves is seen. Paper III provides further discussion about forces on the particle coated surfaces.
4.3.2 Pore array surfaces – Consequences of pores observed in the force curves
Force measurements were performed with all the different hydrophobic pore array surfaces against a hydrophobic colloidal probe by recording force curves at different spots on the surface. Again, many of the force curves displayed the normal characteristics seen in Figure 4-7, but there were also force curves showing larger rupture forces, as defined as the force at the position where the cavity breaks, and sometimes several steps in the curve during retraction were observed as illustrated in Figure 4-10.

To avoidparticle correspoforces/st
Figure 4-array surdepth of curves anforce curvin b) the break at a
Curve firadius oThis mecontact wline, the curves asurface, referencea pore. force cuvery simwith 1.4 when the4-10b capore edg
d confusion coated sur
onding to theteps in the cu
-10. Represenrface, in this cf 4.0 µm, andnd black showve, most likelcavity is tho
a large rupture
fitting of Eqf about 800ans that it iswith a pore, contact line
are thought while the Ge surface, arThis seems
urves in commilar. Group μm pore spae pores are can be explaige causing a
with the dirfaces, thesee normal typurve.
ntative force ccase a surfaced a hydropho
ws measuremely with the cavought to comee force.
q. 2-14 to G nm just bef
s sometimes and as seen does avoid tto correspon
Group 2 force interpretedlikely when
mparison to t 2 force curacing; it is le
closer togetheined by pinna distortion i
46
ifferent force curves arpe, and Grou
curves measure with a poreobic colloidalents on retractvity resting one in close con
Group 1 forcfore the starpossible forin the imag
the pores if pnd to measuce curves, whd as being men examining he area coverves are moess likely thaer. The shapening of the tin the cavity
e curves meare divided up 2 displayi
red between ae spacing of 1l probe. Greytion. a) Shown a flat part ofntact to a por
ce curves inrt of retractir the cavity tges of the thrpossible. Thuurements on
which never oeasured in cl
g the percentered by the re common at the cavitye of the forcethree-phase
y during retr
easured withinto Group
ing large rup
a hydrophobic1.4 µm and a y shows apprs a normal typf the surface wre which mak
ndicated a caon of the prto avoid beinree-phase conus, Group 1 f
a flat referoccur on thelose proximitage of Groupores whichfor the surfavoids the p
e curve in Ficontact line action. This
h the p 1, pture
pore pore
roach pe of while kes it
avity robe. ng in ntact force rence e flat ty to up 2 h are faces pores igure at a will

47
force the cavity to break at a distance where it is not fully extended, hence the large attractive force at the rupture distance. The shape of the force curves, especially the Group 2 force curves, can also give information about the situation in the pores covered by water. In some cases, the colloidal probe must be positioned precisely above a pore. If the pores had been completely filled with water, as the Raman measurements suggest they are, no air cavity could have formed. Since such cavities always were observed, small amounts of air have to be present at the bottom of the pore or around the pore walls. The statistical values extracted from the force curves from the two groups were analyzed separately, and the results are shown in Figure 4-11. For all parameters, the Group 1 curves show a closer resemblance to the reference surface but, obviously, the pores affect the measured values also when they do not change the shape of the force curve. Since measured forces are higher and interaction distances generally are larger for the reference, it seems like the pores hinder cavity formation to a greater extent than they promote it. This means they provide an energy barrier for cavity growth in a similar way as was concluded for the larger particles during measurements on the particle coated surfaces. As seen in Figure 4-11, the jump-in distance increases with a decrease in pore depth for both pore spacings. This is likely a consequence of a shorter distance for evaporated water or air inside the pores to travel to the surface, hence making it easier to assemble and form a cavity. For the rupture distance the situation is reverse, here the distance instead decreases with a decrease in pore depth. The rupture distance is, to a large extent, determined by the amount of air available in the cavity during retraction. That is why, even though the cavity has difficulties to form when the pores are deep, as soon as it is formed, the deeper pore can provide the cavity with more air as it is being extended. This parameter is the only one where values for some of the surfaces exceed that of the reference surface, which is another indication of larger amount of air leading to larger cavities. The interpretation of the trends in adhesion force is a challenge since the adhesion is affected by several different parameters such as contact area and structure around the pores or the pore wall and it
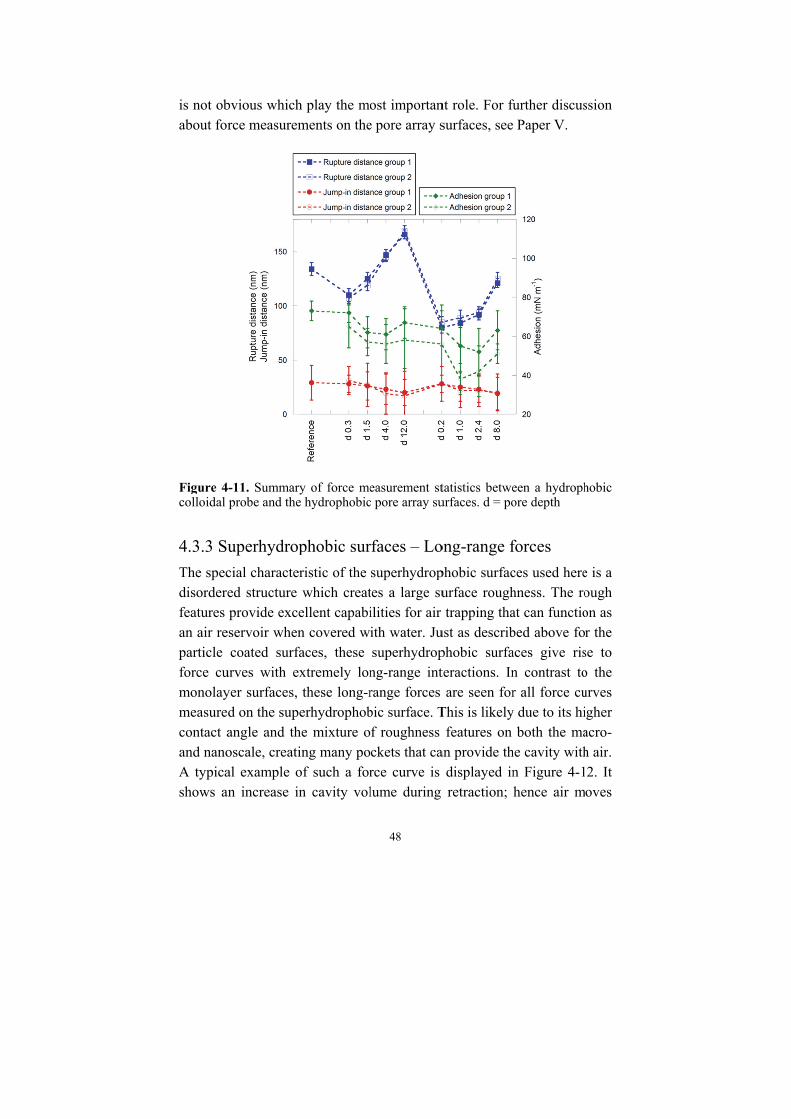
is not obabout for
Figure 4colloidal
4.3.3 Su
The specdisorderefeatures an air reparticle force cumonolaymeasurecontact aand nanoA typicashows a
bvious whichrce measurem
4-11. Summarprobe and the
uperhydrop
cial characteed structure provide exce
eservoir whencoated surfa
urves with eyer surfaces, d on the supangle and thoscale, creatial example oan increase in
h play the moments on the
ry of force mee hydrophobic
phobic sur
ristic of the which creat
ellent capabin covered wi
faces, these xtremely lonthese long-rerhydrophob
he mixture oing many poof such a forn cavity vol
48
ost importane pore array s
easurement stc pore array su
rfaces – Lo
superhydroptes a large suilities for air ith water. Jusuperhydropng-range intrange forces bic surface. Tf roughness ckets that carce curve is lume during
nt role. For fusurfaces, see
tatistics betweurfaces. d = po
ong-range f
phobic surfacurface roughtrapping tha
ust as describphobic surfateractions. Inare seen for
This is likelyfeatures on
an provide thdisplayed inretraction; h
further discusPaper V.
een a hydrophore depth
forces
ces used herehness. The roat can functiobed above foaces give risn contrast tor all force cu
y due to its hiboth the ma
he cavity withn Figure 4-1hence air m
ssion
hobic
e is a ough on as r the
se to o the urves igher acro- h air. 2. It oves

towards model dsuggestenanobubbetween the surfaconsequesurfacesline with
Figure 4surface adistances
4.4 FriFriction surfaceshydrophinfluence
the cavity andescribed aboed above thbbles. The f superhydrop
face.160 Theyence, not of . Importanceh this study.
4-12. A typicand a hydroph and the incre
iction memeasuremen
. In contrahilic surfacese of surface
nd makes it gove (Eq. 2-1hat these lfirst study phobic surfa
y did not finair, but of ev
e of surfaces
cal force curhobic colloidaeased cavity vo
easuremennts were pe
ast to the s were also structure and
49
grow. This m4) is not apong-range fshowing th
aces was alsond any andvaporation oroughness w
rve measuredl probe. Note olume during
nts erformed usiother studidone in or
d surface che
means that thpplicable to tforces are
hese long-rao looking foargued that
f confined wwas, howeve
d between a the extremelretraction (bla
ing only theies, measurerder to inveemistry.
he capillary fthis system. associated
ange interactor air bubblet cavitation
water betweener, emphasize
superhydrophy large interaack curve).
e particle coements betwestigate both
force It is with tions es on
is a n the ed in
hobic action
oated ween h the

50
4.4.1 Particle coated surfaces – Amontonian or adhesion controlled friction
The particle coated surfaces were also used in friction measurements using a hydrophilic surface against a hydrophilic probe, and a hydrophobic surface against a hydrophobic probe in aqueous solution. Measurements started with the probe out of contact and followed by an increase and later a decrease in the applied load. Raw data values with friction force as a function of measurement time clearly displayed probe motion over the particles on the surface (Figure 4-13a) which was more evident the larger the particles. For the hydrophilic surfaces, a plot of the frictional force against the applied load exhibited straight lines both on increased and decreased load as can be seen in Figure 4-13b, which is in accordance with Amontons’ empirical law (Eq. 2-18). However, the force offset value (F0), i.e. the friction at zero load, was for all particle coated surfaces a bit higher than zero which would indicate the slightly modified Amontons’ rule (Eq. 2-19), which also considers the sometimes present adhesion force, to be valid in this case. There is a weak trend of a higher F0 for larger particles on the surface. The friction coefficient, µ, was higher for the particle coated surface compared to the flat reference surface, but showed no variation with respect to particle size. Therefore, it was suggested that the relative surface geometry, i.e. the similar local asperity slope on all particle surfaces, and not the surface roughness determines the friction in this case. The change in surface chemistry from hydrophilic to hydrophobic by the addition of a silane layer was accompanied by an increase of the measured friction force. Also, the mechanisms responsible for the forces were clearly changed. On increasing load, there was still a weak linear dependence between the friction and the load. However, when the load was decreasing, the friction could sometimes increase as can be seen in Figure 4-13c. F0 values were also much larger for the hydrophobic surfaces compared to the hydrophilic ones. As previously seen in the normal force curves measured between hydrophobic surfaces, there is always a large adhesion between the surfaces which explains the high F0 value. Accumulation of air between the probe and the surface during a friction measurements cause large adhesive properties also when the load

is decreathe frictiacross thfrictiona
Figure 4surfaces 800 nm pwhich folsteeper ssurface. csurfaces woffset val
4.5 CaHere, resare higspectrosc
ased. An impion force is he surface. Pal forces.
4-13. a) Rawin aqueous sparticles. b) Fllow Amontonlope, i.e. a hc) Friction agwhere a largelue and hyster
apillary efsults related
ghlighted ancopic and fo
portant energsuggested to
Paper IV giv
w data from solution. ThisFriction againns’ law and shhigher frictiongainst load de adhesion beresis between
ffects to the pheno
nd discusserce measurem
51
gy dissipativo be shear-inves a more d
friction meass plot shows nst load datahow that the pn coefficient ata for measu
etween the surthe loading an
omena exhibed. A comments is pres
ve mechanismnduced motidetailed disc
surements beta particle co
a between hyparticle coatedcompared to urements betwrfaces are seend unloading c
ited by hydrmbination osented.
m contributinion of the ca
cussion abou
tween hydropoated surface ydrophilic surd surface exhib
the flat referween hydrophen as a large curve.
rophobic surfof results f
ng to avity t the
philic with
faces bits a rence hobic force
faces from

4.5.1 Dethanol
As furthsurfaces imaged uterms ofnormalizagainst tthe positinto the shows hosuperhydexperimewater adetectabbetween smaller sresolutio
Figure 4covered wthe FWHwater/ethdoes andhere) neidetectableliquid buethanol 8
Detection l on superh
her describedwere cover
using confocf a depth pzed intensitythe depth andtion of the su
surface or ow ethanol hdrophobic suent with a
and ethanol le. However water and etscale than onon limit (appr
4-14. Ramawith a) a wate
HM (grey line)hanol mixture d aids wettingither water dee. The peaks u
ulk to the surf70 cm-1.
of air/wahydrophobi
d in Paper I,red with wacal Raman mrofile from
y of each pead the full widurface, was depletion fr
has accumulaurface morehydrophobicin liquid
r, it is easythanol also on a superhydrox. 500 nm)
an depth proer/ethanol mix), water is cleit is evident th
g also by watepletion nor aused to decideface were for
52
ater vaporic surfaces
superhydropater or a 1:1microscopy. T
a fixed xyak collected dth half maxused to judgrom the surfated close toe than waterc surface whpenetration y to believeon the hydropdrophobic sur) of the instru
files showingxture and b) wearly depletedhat ethanol wer. For the hyaccumulation e the change inthe surface 7
r and acc
phobic and 1 water/ethaThe results wposition in from the spe
ximum (FWHge whether liface occurre
o and even per. This is inhere no difdepth into
e that there phobic surfarface and theument.
g a superhydwater. At the d from the sur
wets the surfacydrophobic suof ethanol atn intensity wh714 cm-1, wat
cumulation
flat hydrophnol mixture
were evaluatethe image.
ectra was ploHM), that defiquid penetraed. Figure 4enetrated inton contrast tofference betw
the surfacis a differ
ce, but at a merefore below
drophobic susurface definerface while foe better than wurface (not sht the surface hen going fromter 3 330 cm-
n of
hobic and
ed in The
otted fined ation
4-14a o the o an ween ce is rence much w the
urface ed by or the water hown were
m the 1 and

53
Raman measurements in pure water also showed a small penetration of liquid into the hydrophobic surface. However, for the superhydrophobic surface, water was clearly depleted from the surface leaving an interfacial volume where no or very weak Raman signals were obtained (Figure 4-14b). Since air is not dense enough to give Raman signals, capillary evaporation and accumulation of air in the rough surface features are likely reasons behind this observation. Comparing Raman spectra for bulk water to that of water in close proximity to the superhydrophobic surfaces, the peaks at 1 635 and 3 240 cm-1 turned out to be stronger for interfacial water. The peak at 3 240 cm-1 corresponds to hydrogen bonded water as shown by vibrational sum frequency spectroscopy (VSFS) which indicates more structured water close to the surface.161-163 This finding is surprising considering the limited depth resolution in confocal Raman spectra and would need further investigations to be clarified.
4.5.2 Influence of ethanol – removal of capillary forces
In order to study the removal of capillary forces and further investigate the accumulation of ethanol on hydrophobic surface, force measurements on the pore array surfaces in water/ethanol mixtures of different ratios were performed. 5, 10, 15 and 20 vol% of ethanol were studied by rinsing of water injected into the AFM liquid cell in-between every ethanol measurement. As seen in the force curve displayed in Figure 4-15a, the shape of the curves changes remarkably in presence of ethanol. The jump-in distance and the adhesion force decrease with added ethanol and the lack of cavitation makes the retract curve jump directly to zero force after detaching from the surface. Further, very small traces of ethanol, probably accumulated in the pores, were difficult to remove during water rinsing and the presence of ethanol affects the in-between measurements with water as seen in Figure 4-15b. The jump-in distance and the adhesion force display the original value measured in water before the very first addition of ethanol but the rupture distance remains at zero just like in ethanol mixtures, indicating that no cavity or a very unstable cavity that immediately ruptures, is formed. Hence, very small amounts of ethanol remaining in the pores have a profound effect on the stability of the cavity. For the flat reference surface, ethanol was easily removed

and the regained
Figure 4-array surfmeasuremmeasuremEven thomeasuremseparation
As seenhydrophsurface. not be a means thobservedpresent bforce cuforces uacross don apprattractionobtainedforce cuthe intercannot bforces o
measuremend the same ap
-15. Force curface using a pment was pments in wateough the jumment with wn. Experiment
n in previouhobic surface
The observeconsequenc
hat other typd attractive inbetween surfurves were cusing Eq. 2-9different watroach had, n distance
d by compariurve equals thractions. Thbe solely reriginating fr
nts in water ppearance as
rves obtained pore spacing oerformed in
er after previomp-in distancewater, the catal points in g
us confocal e and removeed forces meae of air cavies of forces mnteractions ifaces. To invcompared to9 and the Her/ethanol lifor all ethathan the thing the distahe spring cois informatio
esponsible forom capillary
54
after previothe very firs
from measuref 1.4 µm and
a 5% ethaous measureme and the adhavity, if anygrey is during a
Raman mees the air layasured in waty formationmust be invos van der Wa
vestigate this, theoreticall
Hamaker consquid media.
anol concenteoretical va
ance at whichonstant of theon indicatesor the measy condensati
ous measuremst measureme
ements with aa pore depth oanol solution
ments in waterhesion force y, ruptures iapproach, bla
asurements, yer close to
ater/ethanol mn between tholved. One suaals forces, w, the experimly calculatedstants for th The force ctrations, a
alues. The sh the slope oe cantilever s that van dsured interacion of ethan
ments in ethent.
a hydrophobicof 12 µm. In an and b) shr/ethanol mixtare higher inmmediately
ack during retr
ethanol wethe hydroph
mixtures can e surfaces wuggestion fowhich alway
mentally recod van der Whe silica surfcurves measlarger on-sesame result of the theoreused to mea
der Waals foctions. Capi
nol instead o
hanol
pore a) the hows tures. n the upon
ract.
ets a hobic
thus which
r the s are
orded Waals faces sured et of
was etical asure orces llary
of air

55
cavitation is suggested to be the most likely explanation for the observed forces which is further discussed in Paper VI.
4.6 General discussions about interactions between hydrophobic surfaces The evidence for air being present close to a superhydrophobic surface obtained from confocal Raman measurements is crucial for many of the conclusions from the previously presented force measurements, providing new insights on the origin of the observed forces between hydrophobic surfaces. There have been studies showing both direct and indirect evidence of air close to the surface but this study is unique in the sense that very long-range effects could be detected by spectroscopy.66,69,70 Superhydrophobic surfaces gave the most distinct effects on the interfacial liquid, displaying the most long-range forces, the largest air/water vapor layer and an accumulated layer of ethanol. It is therefore reasonable that similar interfacial events occur also at hydrophobic surfaces but that the resolution of our confocal Raman instrument is too low to detect the layer. Additionally, the thickness of air/vapor/ethanol layers probably decreases in conjunction with the hydrophobicity of the surface. The question whether it is an air layer on the hydrophobic surface or if air is present in the form of nanobubbles on the surface is often discussed in the literature on long-range force, but has not been a main focus of this project. Previous studies looking specifically for nanobubbles have either proven their existence or found no evidence for such small bubbles.58,63,67,160,164 The main controversy of the nanobubbles is their size being too small to be stable for more than a short period of time according to Laplace pressure theory. Despite this, they have been shown to exist for much longer time periods and a study by Wennerström has shown how dissolved gas can substantially prolong the lifetime of the bubbles.165 As discussed in the section on long-range force curves, the large jump-in distance and the repulsive features in the approach force curve indicated the presence of bubbles deformed by the colloidal probe.

56
However, the Raman images show a more continuous layer with very weak Raman signals, interpreted as air or water vapor, close to the surface. The resolution of the Raman image is probably the limiting factor and even though single bubbles would exist on the surface, the instrument would have difficulties resolving them. An observation favoring the theory on air layers over nanobubbles is that in-flux of air to the cavity seems to be crucial during many of the performed measurements. A continuous air layer would provide easier access if all air is connected compared to the situation where they are split into single bubbles. Another important aspect of interaction forces between hydrophobic surfaces is its dependence, or lack of dependence, on surface hydrophobicity. Several studies have provided evidence for an increase in the range and magnitude of the measured forces as a consequence of increasing the hydrophobicity of the surfaces.80,81 However, most of the previous studies have been performed on flat surfaces or on surfaces with a disordered structure. The studies in this thesis clearly show that surface hydrophobicity provide very little information about the quantitative values extracted from the force curves. Instead, there seems to be several other important factors facilitating cavity formation and growth. The free energy of the system is generally lowered by the formation of a cavity in close proximity to hydrophobic surfaces. For smaller roughness length scales or shallower pores, less water and air are required in order to form the cavity due to smaller volume and easier access to air. The surface roughness is important due to its ability to confine air within the rough features. As seen for the particle coated surfaces, with higher forces and rupture/jump-in distances on the particle coated surfaces compared to the reference, a certain roughness on the surfaces facilitates cavity growth. However, when the surface roughness is too large, it is difficult to transport air hidden between the particles to the cavity. It was not possible to determine a critical roughness at which the cavity formation is hindered instead of facilitated compared to a reference surface. The Ra roughness parameter for the 200 and 800 nm particles is much smaller than the value measured on a superhydrophobic surface, which clearly displays much longer forces and interaction distances. Instead, a mixture

57
of roughness and the ability of the surface to transport air are likely the critical parameters. Even though the contact angles are higher on the pore array surfaces compared to the reference, this is not accompanied by larger forces and the pore structures often seem to counteract cavity growth. Since the area around the pore edges is the same for all the pore array surfaces, it is reasonable to believe the qualitative influence from the pores, for the same pore spacing, is similar on all of them. Hence, the differences between the pore depths are likely due to, again, access of air. Another reason is the energy barriers presented by the pores and the height differences on the particle coated surfaces with the larger particles. These energy barriers for movement of the three-phase contact line over the surface decrease the range and magnitude of the measured forces. All the force measurements performed on the different surfaces provided valuable information on how to increase or decrease forces between structured hydrophobic surfaces. It is not possible to present a complete theory predicting exact quantitative values, but a qualitative behavior can be foreseen by looking at the following surface properties: The first to take into account is the actual structure; does it contain features able to function as air reservoirs? The access is also important, a very deep pore could certainly host large amounts of air but it might be difficult to provide it to the cavity. The length scale of the roughness features is another important parameter. As long as the surface is not superhydrophobic, the best approach is to compare this length scale to the expected diameter of the cavity. A too large roughness length scale in relation to the dimensions of the cavity would hinder formation due to the escape routes given in the structures, but also prevent movement of the three-phase contact line and cavity growth. These rules can be applied when looking at other common types of surface structures not investigated here, such as pillars or pyramidal shapes. A pillar structure of a low energy material would exhibit superhydrophobic behavior as investigated by He et al.166 and Park et al.24 This would most likely generate the long-range type of force curves previously seen for superhydrophobic surfaces. However, it has been difficult to find trends in forces and jump-in/rupture distances for this type of force curves and formation and growth seem to be completely uncorrelated events. It is not

58
possible to say whether this would be the case also for structured superhydrophobic surfaces with, for example, different spacings between the pillars as well as different heights. For pyramidal shapes, having more open structures, the length scale of the features would be critical. Large structures could disturb the formation of a cavity and create energy barriers during growth while a small length scale could possibly facilitate cavity formation just like the case for the particle coated surfaces. However, the structures might be too open to give access to a large amount of excess air. A similar approach could be applied to predict ranges and magnitudes of forces between hydrophobic surfaces also displaying other types of surface structures.
59
5 Conclusions
This thesis highlights important aspects of surface structures and properties in relation to hydrophilicity/hydrophobicity/ superhydrophobicity of the surfaces and interaction forces between such surfaces. Using confocal Raman microscopy, accumulation of air/water vapor was observed in close proximity to a superhydrophobic surface providing evidence for cavitation during force measurements between hydrophobic surfaces. This observation served as a foundation in the following studies which focused on the influence of surface structure on the forces. This required preparation of surfaces with a defined structure and, hence, surfaces with hexagonally close-packed particles were prepared. Roughness analysis and Fourier transforms of AFM images as well as contact angle measurements suggested a local order but a slight disorder on a longer length scale. It was concluded that the surfaces exhibited almost complete wetting but still with some air hidden between and beneath the particles. Surfaces with pore array structures displayed a jagged three-phase contact line and presence of water in the pores with air most likely present around the pore walls and at the bottom of the pores. Force measurements with particle coated surfaces resulted in two different populations of force curves showing very different appearances. Population 1 force curves had the normal shape most often seen for hydrophobic surfaces with a retract curve that was possible to fit to capillary force theory. Statistical analyses showed a decrease in range and magnitude of the forces with an increase in surface roughness length scale, i.e., an increase in particle size. This was attributed to easier access of air and lower energy barriers for cavity formation for the smaller particles. Force curves measured on flat reference surfaces displayed forces in-between those of the particle coated surfaces suggesting that a certain surface roughness facilitates cavitation while a too large roughness hinders it. The Population 2 force curves displayed extremely long-range forces with rupture distances exceeding micrometers and an

60
increase in cavity volume during retraction. Due to the similarity to force curves measured on a superhydrophobic surface, it was concluded that air bubbles resting on top of the particles and an in-flux of air to the cavity during separation were the explanations for this long-range force. Friction measurements between hydrophilic surfaces showed good correspondence to Amontons’ rule with a linear dependence on load both during an increase and decrease of the applied load. The calculated friction coefficients were found to increase going from a flat surface to a particle coated surface but stayed approximately the same for all particle sizes. A change in surface chemistry from hydrophilic to hydrophobic was discovered to completely change the measured friction forces with large adhesion forces being present in the hydrophobic case. The pore array surfaces also showed different force curve appearances with the possibility to directly see the influence of the pores in some of them. The normal type of force curves was sorted into Group 1 while force curves displaying large rupture forces or discontinuities in the retraction curve were assigned to belong to Group 2. Group 1 curves were suggested to have been measured on a flat part of the surface while Group 2 curves are suggested to be recorded in close proximity to pores with the pores causing sudden ruptures of the cavity or pinning of the three-phase contact line. When looking at the mean values extracted from the force curves, the jump-in distance increases with a decrease in pore depth while the situation is the reverse for the rupture distance. In a shallow pore, air is closer to the surface, hence making it easier for the cavity to form. As soon as the cavity is created, a deeper pore can provide more air which gives a longer rupture distance. When water/ethanol mixtures were used as liquid medium during force measurements on the pore array surfaces, cavitation of air did not occur, as shown by the retract curve going directly to zero force after the surfaces were separated. Instead, capillary condensation of ethanol is thought to be the main reason for the observed interactions in presence of ethanol. It could be concluded that very small amounts, even traces, of

61
ethanol were enough to remove cavitation. Accumulation of ethanol at the surface and in the pores is likely the reason behind this observation. Clearly, surface structures have a profound influence on interaction forces between hydrophobic surfaces. For structured surfaces, in contrast to smooth, it is evident that the hydrophobicity of the surfaces cannot solely be used to explain the measured forces and interaction distances. The results obtained in this project suggest that it should be possible to give qualitative theoretical predictions of the forces between structured hydrophobic surfaces with respect to the type of structure and the length scale of the structural features.

62
6 Future work
During the progress of this project many ideas on interesting experiments have been suggested. Unfortunately, there has not been enough time to invetigate all of them and therefore some of the studies with the ability to give further information in relation to the discoveries made within the context of this work, are presented in this chapter. The most obvious experiment would be to look at the summaries on how to predict forces between structured surfaces and investigate whether the predictions are correct. As discussed in the results chapter, surfaces exhibiting pillar structures or pyramidal shapes could be studied. It would be especially interesting to investigate if it is possible to find trends in the range and magnitude of the force curves for structured surfaces in the Cassie-Baxter regime. So far, it was suggested that the range and magnitudes of the long-range force curves seen for superhydrophobic surfaces are completely random. By using for example pillar structures with different heights and spacing, this could be further investigated. The study of friction was not started until the end of this project and there was not enough time to investigate the dependence on surface structure in detail. It is evident that surface structures have a huge influence on friction forces. Despite the importance of friction both in every-day life as well as in industry, there are still only a few studies done on friction at the nanoscale. Measurements between superhydrophobic surfaces in different media could give valuable information on how the supposed air layer and its removal affect frictional forces. Also, friction on the pore array surfaces would be interesting to study in order to see if they follow the traditional Amontonian behavior. Wetting and liquid penetration are two phenomena only briefly studied in this project. This could be continued using different types of liquids and also by modifying the surfaces in different ways using, for example different silanes providing charged surfaces. Particles deposited in

63
multilayers instead of a monolayer on a substrate could be used as model surfaces when studying imbibition of liquids in a porous layer. Many questions still remain regarding forces between superhydrophobic surfaces. One possible approach could be to study cavitation between superhydrophobic surfaces using the surface force apparatus (SFA). In contrast to the AFM, the SFA can be utilized to give the position of the underlying substrate as well as to visually detect air/water vapor in the cavity. This was tried very quickly using the superhydrophobic surface prepared by dip coating but it was not transparent enough to be applied in the SFA. There exist several recipes describing how to prepare transparent superhydrophobic coatings and one of them could possibly be tested. Another way to study fundamental properties of hydrophobic surfaces would be through variation of the hydrophobicity of both the surface and the colloidal probe. By using the microsphere tensiometry technique described in 3.1.4, also the contact angle of a single probe attached to the cantilever can be measured. This means that similar/different/ higher/lower contact angles of the surface in relation to the probe could be used during force measurements.

64
7 Acknowledgements
There are numerous people who have helped and supported me throughout the years and I would here like to take the opportunity to thank some of them. First, I would like to express my sincere gratitude to my supervisor Prof. Per Claesson. The inspiring attitude and the valuable scientific input you always provide have been a great help and comfort during this project. I would also like to warmly thank my second supervisor, Prof. Agne Swerin. Thank you for giving a person who, five years ago, knew very little about surface forces the opportunity to work in this project but thanks also for scientific guidance and for involving me in other projects at YKI. My unofficial third supervisor Assoc. Prof. Esben Thormann is gratefully acknowledged for patiently teaching me how to use the AFM and for always taking the time to discuss results, papers and to answer all my stupid questions. Omya Development AG is gratefully acknowledged for providing the funding for this project. Prof. Pat Gane and Dr. Joachim Schoelkopf are thanked for support, for all interesting and challenging discussions as well as for showing great enthusiasm about the project. My coauthors on all the papers are acknowledged for making the different projects possible. Lisa Skedung and Prof. Mark Rutland are thanked for good collaboration on the particle coated surfaces. I am very thankful to Yashar Hormozan and Prof. Jan Linnros for sharing your very nice pore array surfaces with us. Dr. Birgit Brandner is thanked for doing the confocal Raman measurements and Martin Wåhlander for excellent skills in developing the protocol to prepare the superhydrophobic surfaces.

65
Prof. Hans-Jürgen Butt and Dr. Michael Kappl are thanked for inviting me to come to the Max Planck Institute for Polymer research in Mainz and for teaching me the colloidal probe contact angle measurements. Of course, I would like to thank everybody at YKI who has created a nice working environment and made these last, almost five, years both enjoyable and rewarding. I would like to recognize Mikael Sundin and Rodrigo Robinson for excellent help in the lab. Dr. Viveca Wallqvist is thanked for making my life easier by doing such a great job in the first Omya funded project. All past and present Ph.D. students, but especially Anna, Carina, Christian, Lisa, Hanna, Asaf, and Lina, are thanked and remembered for lunches, after works and for pleasant discussions. A special thank you goes to Hanna, Lina and Josefina for always being willing to listen to my complaints and for all the long talks about everything that is important in life. All the people I have come in contact with at the Division of Surface and Corrosion science at KTH are thanked for help, discussions and for nice company during courses. Mina vänner utanför jobbet och alla mina släktingar förtjänar ett varmt tack för allt stöd under åren. Mamma och pappa är värda ett enormt tack för att ni alltid ordnar allt så bra, för att ni alltid hjälper till och för att ni alltid trott på mig. Mikaela och Rebecka ska ha tack för att man alltid kan höra av sig till er, för att ni (nästan) alltid är på bra humör och för att ni står ut med er besserwisser till storasyster. Mormor och morfar har en väldigt stor del i att det blev en doktorsavhandling skriven. Tack för all uppmuntran att läsa och studera samt för all tid ni ägnade åt att leka skola och alla andra konstiga lekar jag hittade på. Christian, I could go on forever thanking you for all the help with practical issues regarding this thesis and at home, for tolerating my bad mood and for always trying to cheer me up. YKI will be a very empty place without you and not seeing your green Lync dot on Monday Nov 5 will force me to fight back some tears. That day, like every other day, I will be infinitely happy and thankful that I get to meet you at home.

66
8 References
1 Barthlott, W. & Neinhuis, C. Planta 1997, 202, 1-8. 2 Neinhuis, C. & Barthlott, W. Annals Of Botany 1997, 79, 667-
677. 3 Feng, L., Zhang, Y., Xi, J., Zhu, Y., Wang, N., Xia, F. & Jiang,
L. Langmuir 2008, 24, 4114-4119. 4 Bhushan, B. & Nosonovsky, M. Philosophical Transactions of
the Royal Society A: Mathematical, Physical and Engineering Sciences 2010, 368, 4713-4728.
5 Gao, X. & Jiang, L. Nature 2004, 432, 36-36. 6 Wanasekara, N. D. & Chalivendra, V. B. Soft Matter 2011, 7,
373-379. 7 Polymenidou, M. & Cleveland, D. W. Journal of Experimental
Medicine 2012, 209, 889-893. 8 Head, M. W. & Ironside, J. W. Neuropathology and Applied
Neurobiology 2012, 38, 296-310. 9 Ma, M. & Hill, R. M. Current Opinion in Colloid & Interface
science 2006, 11, 193-202. 10 Gnedenkov, S., Sinebryukhov, S., Egorkin, V., Mashtalyar, D.,
Alpysbaeva, D. & Boinovich, L. Colloids and Surfaces A: Physicochemical and Engineering Aspects 2011.
11 Boinovich, L., Gnedenkov, S., Alpysbaeva, D., Egorkin, V., Emelyanenko, A., Sinebryukhov, S. & Zaretskaya, A. Corrosion Science 2011.
12 Kulinich, S. & Farzaneh, M. Langmuir 2009, 25, 8854-8856. 13 Tourkine, P., Le Merrer, M. & Quéré, D. Langmuir 2009, 25,
7214-7216. 14 Huang, L., Chen, K., Lin, C., Yang, R. & Gerhardt, R. A. Journal
of Materials Science 2011, 46, 2600-2605. 15 Stanssens, D., Van den Abbeele, H., Vonck, L., Schoukens, G.,
Deconinck, M. & Samyn, P. Materials Letters 2011. 16 Ma, M. L., Mao, Y., Gupta, M., Gleason, K. K. & Rutledge, G.
C. Macromolecules 2005, 38, 9742-9748. 17 Ma, M., Hill, R. M. & Rutledge, G. C. Journal of Adhesion
Science and Technology 2008, 22, 1799-1817. 18 Drelich, J., Nalaskowski, J., Gosiewska, A., Beach, E. & Miller,
J. D. Journal of Adhesion Science and Technology 2000, 14, 1829-1843.
19 Polat, M., Polat, H. & Chander, S. International Journal of Mineral Processing 2003, 72, 199-213.

67
20 Wallqvist, V., Claesson, P. M., Swerin, A., Schoelkopf, J. & Gane, P. A. C. Colloids and Surfaces A: Physicochemical and Engineering Aspects 2006, 277, 183-190.
21 Bravo, J., Zhai, L., Wu, Z., Cohen, R. E. & Rubner, M. F. Langmuir 2007, 23, 7293-7298.
22 Tsai, P. S., Yang, Y. M. & Lee, Y. L. Nanotechnology 2007, 18. 23 Ming, W., Wu, D., van Benthem, R. & de With, G. Nano letters
2005, 5, 2298-2301. 24 Park, J., Lim, H., Kim, W. & Ko, J. S. Journal of Colloid and
Interface Science 2011, 360, 272-279. 25 Martines, E., Seunarine, K., Morgan, H., Gadegaard, N.,
Wilkinson, C. D. W. & Riehle, M. O. Nano letters 2005, 5, 2097-2103.
26 Zhang, J. H. & Yang, B. Advanced Functional Materials 2010, 20, 3411-3424.
27 Derjaguin, B. Kolloid Zeits 1934, 69, 155-164. 28 Derjaguin, B. & Landau, L. Acta Physicochimica URSS 1941, 14,
633-662. 29 Verwey, E. J. W., Overbeek, J. T. G. & Van Nes, K. Theory of
the stability of lyophobic colloids: the interaction of sol particles having an electric double layer. (Elsevier New York, 1948).
30 Keesom, W. Physikalische Zeitschrift 1921, 22, 129-141. 31 Debye, P. Physikalische Zeitschrift 1920, 21, 178-187. 32 London, F. Zeitschrift für Physik 1930, 63, 245. 33 Hamaker, H. C. Physica 1937, 4, 1058. 34 Bradley, R. S. Philosophical Magazine 1932, 13, 853. 35 de Boer, J. H. Transactions of the Faraday Society 1936, 32,
0010. 36 Lifshitz, E. M. Soviet Physics JETP 1956, 2, 73. 37 Visser, J. Reports on the Progress of Applied Chemistry 1968,
53, 714. 38 Neumann, A., Omenyi, S. & Van Oss, C. Colloid & Polymer
Science 1979, 257, 413-419. 39 Israelachvili, J. N. Intermolecular and surface forces. (Academic
press, 1991). 40 Gouy, G. Journal of Physics 1910, 9, 457-467. 41 Chapman, D. L. The London, Edinburgh, and Dublin
Philosophical Magazine and Journal of Science 1913, 25, 475-481.
42 Israelachvili, J. & Pashley, R. Nature 1982, 300, 341-342. 43 Israelachvili, J. & Pashley, R. Journal of Colloid and Interface
Science 1984, 98, 500-514. 44 Pashley, R. M., McGuiggan, P. M., Ninham, B. W. & Evans, D.
F. Science 1985, 229, 1088-1089.

68
45 Christenson, H. K. & Claesson, P. M. Science 1988, 239, 390-392.
46 Rabinovich, Y. I. & Derjaguin, B. Colloids and Surfaces 1988, 30, 243-251.
47 Parker, J. L., Claesson, P. M. & Attard, P. Journal Of Physical Chemistry 1994, 98, 8468-8480.
48 Carambassis, A., Jonker, L. C., Attard, P. & Rutland, M. W. Physical Review Letters 1998, 80, 5357-5360.
49 Froberg, J. C., Rojas, O. J. & Claesson, P. M. International Journal of Mineral Processing 1999, 56, 1-30.
50 Christenson, H. K. & Claesson, P. M. Advances in Colloid and Interface Science 2001, 91, 391-436.
51 Attard, P. Advances in Colloid and Interface Science 2003, 104, 75-91.
52 Meyer, E., Rosenberg, K. & Israelachvili, J. Proceedings of the National Academy of Sciences 2006, 103, 15739.
53 Wallqvist, V., Claesson, P. M., Swerin, A., Schoelkopf, J. & Gane, P. A. C. Langmuir 2007, 23, 4248-4256.
54 Thormann, E., Simonsen, A. C., Hansen, P. L. & Mouritsen, O. G. Langmuir 2008, 24, 7278-7284.
55 Wallqvist, V., Claesson, P. M., Swerin, A., Ostlund, C., Schoelkopf, J. & Gane, P. A. C. Langmuir 2009, 25, 9197-9207.
56 Faghihnejad, A. & Zeng, H. B. Soft Matter 2012, 8, 2746-2759. 57 Mahnke, J., Stearnes, J., Hayes, R. A., Fornasiero, D. & Ralston,
J. Physical Chemistry Chemical Physics 1999, 1, 2793-2798. 58 Zhang, X. H., Zhang, X. D., Lou, S. T., Zhang, Z. X., Sun, J. L.
& Hu, J. Langmuir 2004, 20, 3813-3815. 59 Ishida, N., Inoue, T., Miyahara, M. & Higashitani, K. Langmuir
2000, 16, 6377-6380. 60 Ishida, N., Sakamoto, M., Miyahara, M. & Higashitani, K.
Journal of Colloid and Interface Science 2002, 253, 112-116. 61 Lou, S., Gao, J., Xiao, X., Li, X., Li, G., Zhang, Y., Li, M., Sun,
J. & Hu, J. Mat. Char. 2002, 48, 211-214. 62 Sakamoto, M., Kanda, Y., Miyahara, M. & Higashitani, K.
Langmuir 2002, 18, 5713-5719. 63 Simonsen, A. C., Hansen, P. L. & Klosgen, B. Journal of Colloid
and Interface Science 2004, 273, 291-299. 64 Zhang, X. H., Maeda, N. & Craig, V. S. J. Langmuir 2006, 22,
5025-5035. 65 Yang, J., Duan, J., Fornasiero, D. & Ralston, J. Journal of
Physical Chemistry B 2003, 107, 6139-6147. 66 Zhang, X. H., Quinn, A. & Ducker, W. A. Langmuir 2008, 24,
4756-4764. 67 Tyrrell, J. W. G. & Attard, P. Physical Review Letters 2001, 87,
176104.

69
68 Tyrrell, J. & Attard, P. Langmuir 2002, 18, 160-167. 69 McKee, C. T. & Ducker, W. A. Langmuir 2005, 21, 12153-
12159. 70 Steitz, R., Gutberlet, T., Hauss, T., Klosgen, B., Krastev, R.,
Schemmel, S., Simonsen, A. C. & Findenegg, G. H. Langmuir 2003, 19, 2409-2418.
71 Thormann, E., Simonsen, A. C., Hansen, P. L. & Mouritsen, O. G. ACS nano 2008, 2, 1817-1824.
72 Thomson, W. T. Philosophical Magazine 1871, 42, 448. 73 Butt, H. J. & Kappl, M. Advances in Colloid and Interface
Science 2009, 146, 48-60. 74 Eriksson, J. C., Ljunggren, S. & Claesson, P. M. Journal of the
Chemical Society, Faraday Transactions 2 1989, 85, 163-176. 75 Eriksson, J. C. & Henriksson, U. Langmuir 2007, 23, 10026-
10033. 76 Vinogradova, O. I. Langmuir 1995, 11, 2213-2220. 77 Ruckenstein, E. Journal of colloid and interface science 1997,
188, 218-223. 78 Evans, D., Craig, V. & Senden, T. Physica A: Statistical
Mechanics and its Applications 2004, 339, 101-105. 79 Vinogradova, O. I., Yakubov, G. E. & Butt, H. J. The Journal of
Chemical Physics 2001, 114, 8124. 80 Rabinovich, Y. I. & Yoon, R. H. Colloids and Surfaces A:
Physicochemical and Engineering Aspects 1994, 93, 263-273. 81 Ishida, N. & Higashitani, K. Minerals Engineering 2006, 19,
719-725. 82 Serro, A. P., Colaco, R. & Saramago, B. Journal of Colloid and
Interface Science 2008, 325, 573-579. 83 Jung, Y. C. & Bhushan, B. Nanotechnology 2006, 17, 4970. 84 Dupré, A. & Dupré, P. Théorie mécanique de la chaleur.
(Gauthier-Villars, 1869). 85 Johnson, K., Kendall, K. & Roberts, A. Proceedings of the Royal
Society of London. A. Mathematical and Physical Sciences 1971, 324, 301-313.
86 Amontons, G. Mémoires de l’Académie Royale des Sciences Paris 1699.
87 Coulomb, C. A. Mémoires de Mathématique et de Physique Paris 1785, 161-342.
88 Ruan, J. A. & Bhushan, B. Journal of Applied Physics 1994, 76, 5022-5035.
89 Berman, A., Drummond, C. & Israelachvili, J. Tribology letters 1998, 4, 95-101.
90 Gao, J., Luedtke, W., Gourdon, D., Ruths, M., Israelachvili, J. N. & Landman, U. The Journal of Physical Chemistry B 2004, 108, 3410-3425.

70
91 Bowden, F. & Tabor, D. Proceedings of the Royal Society of London. Series A, Mathematical and Physical Sciences 1939, 169, 391-413.
92 Kusy, R. & Whitley, J. Q. Journal of Biomechanics 1990, 23, 913-925.
93 Menezes, P. L. & Kailas, S. V. Journal of Tribology 2006, 128, 697.
94 Thormann, E., Yun, S. H., Claesson, P. M. & Linnros, J. ACS Applied Materials & Interfaces 2011.
95 Pilkington, G. A., Thormann, E., Claesson, P. M., Fuge, G. M., Fox, O. J. L., Ashfold, M. N. R., Leese, H., Mattia, D. & Briscoe, W. H. Physical Chemistry Chemical Physics 2011, 13, 9318-9326.
96 Koinkar, V. N. & Bhushan, B. Journal of applied physics 1997, 81, 2472.
97 Stiernstedt, J., Nordgren, N., Wågberg, L., Brumer, H., Gray, D. G. & Rutland, M. W. Journal of Colloid and Interface Science 2006, 303, 117-123.
98 Homola, A. M., Israelachvili, J. N., McGuiggan, P. M. & Gee, M. L. Wear 1990, 136, 65-83.
99 Israelachvili, J. N., Chen, Y. L. & Yoshizawa, H. Journal of Adhesion Science and Technology 1994, 8, 1231-1249.
100 Feiler, A. A., Jenkins, P. & Rutland, M. W. Journal of Adhesion Science and Technology, 19 2005, 3, 165-179.
101 Feiler, A. A., Stiernstedt, J., Theander, K., Jenkins, P. & Rutland, M. W. Langmuir 2007, 23, 517-522.
102 Young, T. Philosophical Transactions of the Royal Society of London 1805, 95, 65-87.
103 Wenzel, R. N. Industrial & Engineering Chemistry 1936, 28, 988-994.
104 Cassie, A. B. D., Baxter, S. Transactions of the Faraday Society 1944, 40, 546-551.
105 Patankar, N. A. Langmuir 2004, 20, 7097-7102. 106 Tuberquia, J. C., Song, W. S. & Jennings, G. K. Analytical
Chemistry 2011. 107 Bico, J., Marzolin, C. & Quéré, D. Europhysics Letters 1999, 47,
220. 108 Gao, L. & McCarthy, T. J. Langmuir 2007, 23, 3762-3765. 109 Pease, D. C. The Journal of Physical Chemistry 1945, 49, 107-
110. 110 Bartell, F. & Shepard, J. The Journal of Physical Chemistry
1953, 57, 455-458. 111 Chen, W., Fadeev, A. Y., Hsieh, M. C., Öner, D., Youngblood, J.
& McCarthy, T. J. Langmuir 1999, 15, 3395-3399. 112 Öner, D. & McCarthy, T. J. Langmuir 2000, 16, 7777-7782.

71
113 Extrand, C. Langmuir 2003, 19, 3793-3796. 114 Yamamoto, K. & Ogata, S. Journal of Colloid and Interface
Science 2008, 326, 471-477. 115 Erbil, H. Y. & Cansoy, C. E. Langmuir 2009, 25, 14135-14145. 116 Panchagnula, M. V. & Vedantam, S. Langmuir 2007, 23, 13242. 117 McHale, G. Langmuir 2007, 23, 8200-8205. 118 Nosonovsky, M. Langmuir 2007, 23, 9919-9920. 119 Milne, A. & Amirfazli, A. Advances in Colloid and Interface
Science 2012, 170, 48-55. 120 Binnig, G., Quate, C. F. & Gerber, C. Physical Review Letters
1986, 56, 930-933. 121 Ducker, W. A., Senden, T. J. & Pashley, R. M. Nature 1991, 353,
239-241. 122 Ducker, W. A., Senden, T. J. & Pashley, R. M. Langmuir 1992,
8, 1831-1836. 123 Sader, J. E., Chon, J. W. M. & Mulvaney, P. Review of Scientific
Instruments 1999, 70, 3967-3969. 124 Hutter, J. L. & Bechhoefer, J. Review of Scientific Instruments
1993, 64, 1868-1873. 125 Cleveland, J., Manne, S., Bocek, D. & Hansma, P. Review of
Scientific Instruments 1993, 64, 403-405. 126 Preuss, M. & Butt, H. Journal of Colloid and Interface Science
1998, 208, 468-477. 127 Preuss, M. & Butt, H. J. Langmuir 1998, 14, 3164-3174. 128 Johnson, D. J., Miles, N. J. & Hilal, N. Advances in Colloid and
Interface Science 2006, 127, 67-81. 129 Maeda, Y., Yamamoto, H. & Ikeda, I. Macromolecules 2003, 36,
5055-5057. 130 Maeda, Y., Yamamoto, H. & Ikeda, I. Langmuir 2004, 20, 7339-
7341. 131 He, P., Bitla, S., Bousfield, D. & Tripp, C. P. Applied
Spectroscopy 2002, 56, 1115-1121. 132 Vyorykka, J., Vuorinen, T. & Bousfield, D. W. Nordic Pulp &
Paper Research Journal 2004, 19, 218-223. 133 Clarke, F. C., Jamieson, M. J., Clark, D. A., Hammond, S. V.,
Jee, R. D., Moffat, A. C. Analytical Chemistry 2001, 73, 2213-2220.
134 Dieing, T., Hollricher, O. & Toporski, J. Confocal Raman Microscopy. Vol. 158 (Springer Verlag, 2011).
135 Raman, C. Indian Journal of physics 1928, 2, 387-398. 136 Schmitt, M. & Popp, J. Journal of Raman Spectroscopy 2006, 37,
20-28. 137 Tabaksblat, R., Meier, R.J., Kip, B.J. Applied Spectroscopy 1992,
46, 60.

72
138 Turell, G., Dhamelincourt, P. Micro-Raman spectroscopy (John Wiley & Sons, 1996).
139 Wilson, T. Optical aspects of confocal Microscopy (Academic press, London, 1990).
140 Vyörykkä, J., Haltunen, M., Iitti, H., Tenhunen, J., Vuorinen, T., Stenius, P. Applied Spectroscopy 2002, 56, 2.
141 Griffith, P. & Haseth, J. Fourier transform infrared spectroscopy. (John Wiley&Sons, New York, 1986).
142 Ulman, A. An introduction to Ultathin Organic Films from Langmuir-Blodgett to Self-Assembly. (Academic Press: San Diego, 1991).
143 Zasadzinski, J. A., Viswanathan, R., Madsen, L., Garnaes, J. & Schwartz, D. K. Science 1994, 263, 1726-1733.
144 Ulman, A. Advanced Materials 1990, 2, 573-582. 145 Kurthen, C. & Nitsch, W. Thin Solid Films 1990, 188, L5-L8. 146 Xu, J. & Li, H. L. Journal of Colloid and Interface Science 1995,
176, 138-149. 147 Tredgold, R. H. Journal of Materials Chemistry 1995, 5, 1095-
1106. 148 Chang, C., Wang, Y. F., Kanamori, Y., Shih, J. J., Kawai, Y.,
Lee, C. K., Wu, K. C. & Esashi, M. Journal of Micromechanics and Microengineering 2005, 15, 580.
149 Nagayama, K. Colloids and Surfaces A-Physicochemical and Engineering Aspects 1996, 109, 363-374.
150 Kralchevsky, P. A. & Denkov, N. D. Current Opinion in Colloid & Interface Science 2001, 6, 383-401.
151 Yasuda, H., Yasuda, H. K., Chemiker, J. & Chemist, J. Plasma polymerization. (Academic Press New York, 1985).
152 Baralia, G. G., Pallandre, A., Nysten, B. & Jonas, A. M. Nanotechnology 2006, 17, 1160.
153 Tsai, P. S., Yang, Y. M. & Lee, Y. L. Langmuir 2006, 22, 5660-5665.
154 Lee, Y. L., Du, Z. C., Lin, W. X. & Yang, Y. M. Journal of Colloid and Interface Science 2006, 296, 233-241.
155 Wåhlander, M. Development and Characterization of Superhydrophobic Surfaces – AFM Colloidal Probe Measurements between Superhydrophobic, Hydrophobic and Hydrophilic Surfaces in Liquid Cell M.Sc. thesis, Royal Institute of Technology, KTH, (2008).
156 Oudrhiri-Hassani, F., Presmanes, L., Barnabé, A. & Tailhades, P. Applied Surface Science 2008, 254, 5796-5802.
157 Nakae, H., Inui, R., Hirata, Y. & Saito, H. Acta Materialia 1998, 46, 2313-2318.
158 Marmur, A. & Bittoun, E. Langmuir 2009, 25, 1277-1281.

73
159 Evans, D. F. & Wennerström, H. The colloidal domain. (Wiley-VCH: New York, 1999).
160 Singh, S., Houston, J., van Swol, F. & Brinker, C. J. Nature 2006, 442, 526-526.
161 Du, Q., Freysz, E. & Shen, Y. R. Science 1994, 264, 826-828. 162 Ye, S., Nihonyanagi, S. & Uosaki, K. Physical Chemistry
Chemical Physics 2001, 3, 3463-3469. 163 Liu, W. T., Zhang, L. N. & Shen, Y. R. Journal Of Chemical
Physics 2006, 125. 164 Ljunggren, S. & Eriksson, J. C. Colloids and Surfaces A-
Physicochemical and Engineering Aspects 1997, 130, 151-155. 165 Wennerström, H. Journal of Physical Chemistry B 2003, 107,
13772-13773. 166 He, Y., Jiang, C. Y., Yin, H. X., Chen, J. & Yuan, W. Z. Journal
of Colloid and Interface Science 2011, 364, 219-229.