hygiene indicators in a fish processing establishment · pdf filehygiene indicators in a fish...
TRANSCRIPT

Final Project 2003
HYGIENE INDICATORS IN A FISH PROCESSING ESTABLISHMENT-A CASE STUDY IN A WHITE FISH PROCESSING ESTABLISHMENT.
Alberth Possinger Samakupa Email:[email protected]
Tell: +264-61-206-3111 University of Namibia, Department of Natural Resources, P/Bag 13301, Windhoek,
Namibia
Supervisors: Prof. Hjörleifur Einarsson Email: [email protected]
University of Akureyri / Norðurslóð 600 Akureyri, Iceland
Arnheiður Eyþórsdóttir Email: [email protected]
Brim Seafood Ltd. Fiskitangi-600 Akureyri-Iceland
ABSTRACT In this study bacterial indicators were investigated in a fish processing plant in order to identify their sources and routes of transmission so that they could be reduced or eliminated. Swabs on food contact surfaces as well as fish samples were taken and tested for coliforms and faecal coliforms. Present/absent tests were carried out for swabs and for fish samples. The Most Probable Number (MPN) technique as well as plate counts to isolate and enumerate coliforms and faecal coliforms were used. Coliforms were present at most steps in the processing environment, with few exceptions, whereas positive results for faecal coliforms were only obtained in the trimming area, suggesting that they may have originated from food handlers. The presence of these microorganims, although in numbers within company specifications, shows that foodhandlers were not adhering to hygiene and sanitation procedures. Knowledge of contaminations is very critical in the Good Hygienic Practices programme and effective hygiene as well sanitary procedures in food processing plants are necessary, should contamination by coliform and faecal coliform bacteria persist. Keywords: Hygiene Indicators; Swab; MPN; foodhandlers; contamination; GMP; Fish processing establishment.

Samakupa
TABLE OF CONTENT TABLE OF CONTENT.................................................................................................2 List of Figures ................................................................................................................3 List of tables...................................................................................................................3 1 INTRODUCTION .................................................................................................4 2 OBJECTIVES ........................................................................................................4 3 LITERATURE REVIEW ......................................................................................5
3.1 General introduction ......................................................................................5 3.2 Overview of sources and routes of contamination.........................................5
3.2.1 Raw material ..........................................................................................5 3.2.2 Processing equipments...........................................................................6 3.2.3 Personnel................................................................................................6 3.2.4 Pests .......................................................................................................6 3.2.5 Water......................................................................................................6
3.3 Quality assurance system...............................................................................7 3.4 Bacterial indicators ........................................................................................8 3.5 Detection of indicator organisms ...................................................................8
3.5.1 Most Probable Number (MPN) technique for coliform bacteria ...........9 3.5.2 Membrane filter technique.....................................................................9 3.5.3 Swabbing................................................................................................9 3.5.4 Contact plate ..........................................................................................9 3.5.5 Bioluminometric assay of ATP............................................................10
4 PRACTICAL WORK ..........................................................................................10 5 MATERIALS AND METHODS.........................................................................10
5.1 Sampling sites ..............................................................................................10 5.2 Sampling Procedure .....................................................................................11 5.3 Bacteriological analyses...............................................................................11
5.3.1 Swabbing..............................................................................................11 5.3.2 Fish samples.........................................................................................11
6 RESULTS ............................................................................................................12 6.1 Swabs ...........................................................................................................12 6.2 Fish Samples ................................................................................................13
7 DISCUSION ........................................................................................................14 8 CONCLUSION....................................................................................................16 9 RECOMENDATIONS ........................................................................................17 ACKNOWLEGMENTS ..............................................................................................17 REFERENCES ............................................................................................................18 APPENDIX 1: A brief description of product manufacturing at ÚA..........................22 APPENDIX 2: Flow diagram for processing of cod (Gadus morhua) (ÚA 1999). ...23 APPENDIX 3: Microbiological guideline for raw material (Gadus morhua) and potable water (ÚA 1999). ............................................................................................24 APPENDIX 4: Results for swabs (1st and 2nd sampling) taken throughout the process.......................................................................................................................................25 APPENDIX 5: Own check system of the company ÚA (ÚA 1999). ..........................26 APPENDIX 5: Own check system of the company ÚA (ÚA 1999) continued...........27 APPENDIX 5: Own check system of the company ÚA (ÚA 1999) continued...........28 APPENDIX 5: Own check system of the company ÚA (ÚA 1999) continued...........29
UNU-Fisheries Training Programme 2

Samakupa
LIST OF FIGURES Figure 1: Schematic diagram of the processing establishment showing all sampling
sites (small green spots) (ÚA 1999).....................................................................10 Figure 2: Schematic diagram of the processing establishment showing results for
swabs incubated in BGLB; positives (red) and negatives(blue). .........................12 Figure 3: Schematic diagram of the processing establishment showing results for
swabs incubated in EC; positives (red) and negatives(blue) (Source ÚA 1999). 12 LIST OF TABLES Table 1: MPN/g results for positive samples from the processing establishment. .....13 Table 2: Results for presumptive coliform. ................................................................14
UNU-Fisheries Training Programme 3

Samakupa
1 INTRODUCTION Fishery products constitute an important part of international trade, currently worth more than US$ 50 billion, indicating increasing consumer interest in the commodity. Unlike other animal products, quality of fish is often more difficult to control due to variations in species, sex, age, habitats and action of autolytic enzymes as well as hydrolytic enzymes of microorganisms on the fish muscle (Venugopal 2002). A major goal for the food processing industries is to provide safe, wholesome and acceptable food to the consumer and control of microorganisms is essential to meet this objective (Baggen-Ravn et al. 2003). However, this can be very difficult as contamination of products in a food processing environment may take place at all stages, during production (both pre and post-harvesting) and processing (Beuchat 1995, De Rover 1999). Scientific research shows quite clearly that Icelandic seafood is wholesome and nutritious (IMF 2001). Specifications for quality standards are often agreed upon between the processors and the customers. In Iceland, the Directorate of Fisheries, through two private inspection bodies, ensures that the quality standards of seafood produced by the fish processors comply with laws and regulations pertaining to the proper and safe handling of seafood (IMF 2001). Although seafood may be considered safe, wholesome and nutritious, microorganism may be present indicating the possible presence of pathogens whose presence in given numbers points to inadequate processing for safety (Mossel et al. 1995). In general, indicator microorganisms are most often used to assess food sanitation (Jay 1992). As fish and other free-swimming marine animals do not usually carry those organisms, particularly of mammalian microflora, including Escherichia coli and faecal coliform, their presence on processed seafood is a clear evidence of contamination from terrigeneous source (ICMSF 1986). Thus, the presence of these organisms may not only indicate the hygienic condition under which the processing establishment operates but also the presence of potential microorganisms that may be harmful to the consumer. The ÚA Seafood Group produces high quality seafood for demanding customers all over the world. The quality of the raw material is a key issue in this context and when combining the purity of fish products from the Icelandic fishing grounds to carefully controlled, state of the art production techniques as well as processing according to certified standards, the result is bound to be sound and wholesome products (ÚA 1999). However, the company has been sporadically experiencing an unacceptable number in hygiene indicators in a final product (fish mince). The company aims to eliminating completely or at least to fall within company specifications. 2 OBJECTIVES The main purpose of the present study is to identify contamination routes during production and processing of fresh cod (Gadus morhua). The aim of the study was to understand how coliforms and faecal coliforms are transferred onto seafood during processing. Also, the quality assurance systems such as Good Manufacturing Practice (GMP)/Good Hygienic Practice (GHP) and Hazard Analysis Critical Control Point (HACCP) will be looked at including the current methods in monitoring hygiene.
UNU-Fisheries Training Programme 4

Samakupa
Further, recommendations will be given to the processing establishment on measures to reduce the occurrence of coliform and faecal coliform bacteria. 3 LITERATURE REVIEW 3.1 General introduction In this part of the report, various aspects will be reviewed, including contamination sources and routes, as well as how the quality assurance systems in general are used to ensure safe, wholesome and nutritious food. Also the current methods used to monitor hygiene in food processing establishments will be briefly reviewed. Contamination is a very important aspect as this is the mode that most unwanted microorganisms may be transmitted onto seafood and other food products. Unwanted microorganisms may access food processing environments through raw material, personnel or mobile equipment such as forklifts, through leakage and openings in buildings, or through pests and some pathogens may even become established in the processing plant and form niches where they can survive for long periods of time (Reij et al. 2003). Many of these microorganims occur naturally in aquatic and general environments, and may be transmitted onto seafood before capture, during and after processing. Also, contamination via air can occur through dust particles or via aerosols which are formed especially when contaminated surfaces, floors or drains are sprayed with high pressure-jets, resulting in formation of droplets that can be suspended in the air (Den Aantrekker et al. 2003). Water is also a vehicle for transmission of many agents of diseases (Kirby et al. 2003). As for quality assurance, methods such as the GMP/GHP and HACCP are recommended by the Codex Alimentarius Commission for use by any food processing establishment to ensure safe, wholesome and nutritious food for human consumption. Lastly to be discussed in this part of the report are a few of the current methods used to identify microorganims in seafood. Many of these involve isolating, identifying and enumerating indicator microorganisms on food contact surfaces and raw fish. 3.2 Overview of sources and routes of contamination 3.2.1 Raw material Many pathogenic bacteria are naturally present in aquatic environments (Clostridium botulinum type E, pathogenic Vibrio sp., Aeromonas) and the general environment (C.botulinum type A and B, Listeria monocytogenes) (Huss et al. 2000). Other microorganisms are of the animal/human reservoir (Salmonella, Shigella, E.coli, enteric virus) (Huss et al. 2000). Thus, there is always a possibility that these microorganisms may be passed on to the raw material during production and processing. In general, when a healthy fish is caught, the flesh is sterile as its immune system prevents bacteria to proliferate easily whereas after death the fish’s immune system collapses allowing easy access of microorganisms into the flesh (Huss 1995). Some microorganisms have been found on the entire outer surface (skin and gills) and in the
UNU-Fisheries Training Programme 5

Samakupa
intestines of live and newly healthy caught fish (Huss 1995). Liston (1980) estimated the total number of microorganisms to vary enormously from a normal range of 105-107cfu (colony forming units)/cm2 on the skin surface, whereas counts between 103-109cfu/g on the gills and intestines were found by Shewan (1962). 3.2.2 Processing equipments Contamination of fish products through contaminated surfaces has also been observed in many cases (Reij et al. 2003). Unclean, insufficiently or inadequately cleaned processing equipment have been identified as a source of bacterial contamination in processed seafood (Reij et al. 2003). Containers, pumps or tanks used for holding or transporting unprocessed raw materials, have occasionally been used for processed products without any cleaning and disinfection (Morgan et al.1993, Evans et al.1996, Hennessy et al.1996, Llewellyn et al.1998). It is therefore necessary that equipment in the processing establishment, coming in contact with food, be constructed in such a way as to ensure adequate cleaning, disinfection and proper maintenance to avoid the contamination (CAC 1997a). 3.2.3 Personnel Transfer of microorganisms by personnel particularly from hands, is of vital importance (Chen et al. 2001, Montville et al. 2001, Bloomfield 2003). During handling and preparation, bacteria are transferred from contaminated hands of food workers to food and subsequently to other surfaces (Montville et al. 2002). Low infectious doses of organisms such as Shigella and pathogenic Escherichia coli have been linked to hands as a source of contamination (Snyder 1998). Poor hygiene, particularly deficient or absence of hand washing has been identified as the causative mode of transmission (Reij et al. 2003). Proper hand washing and disinfection has been recognized as one of the most effective measures to control the spread of pathogens, especially when considered along with the restriction of ill workers (Adler 1999, Montville et al. 2001). 3.2.4 Pests Insects, birds and rodents have been recognized as important carries of pathogens and other microorganisms (Olsen and Hammack 2000, Urban and Broce 2000). In one interesting case a Salmonella outbreak was traced back to amphibians, which had accidentally entered the production facility (Parish 1998). Beveridge (1988) and Fenlon (1983) demonstrated that some aquatic birds spread for example Salmonella and other human pathogens in the environment. GHP should be employed to avoid creating an environment conducive to pests (CAC 1997b). 3.2.5 Water Water, like food, is a vehicle for the transmission of many agents of disease and continues to cause significant outbreaks of disease in developed and developing countries world-wide (Kirby et al. 2003). In Canada, an outbreak of E.coli was reported (Kondro 2000) and in the USA Cryptosporidium affected approximately 400,000 consumers and caused 45 deaths in 1993 due to consumption of contaminated water (Kramer et al.1996, Hoxie et al. 1997). A cholera epidemic in Jerusalem in 1970 was traced back to the consumption of salad vegetables irrigated with raw waste
UNU-Fisheries Training Programme 6

Samakupa
water (Shuval et al. 1986). It is therefore important that potable water is used throughout the production process, for cleaning equipment, washing food, as well as ice making. Also there should be a monitoring program starting from the source, through treatment, distribution and storage within the factory, to ensure that the water complies with internal or legislative standards (Kirby et al. 2003). 3.3 Quality assurance system The production of safe food is based on the implementation and application of general preventative measures such as GMP (Reij et al. 2003). GMP is the overall management (organising, implementing and adhering) of procedures, processes, control and other precautions that exclude, prevent, minimize, and inhibit product failures, and consistently yield safe, suitable foods of uniform quality, according to their intended use. GHP is part of GMP concerned with general hygiene, microbial safety and product spoilage (Heggum 2001). While it is not possible to achieve zero risk under GMP, the development and use of other approaches, such as HACCP, to ensuring safe food, cannot not be omitted (Jay 1992). HACCP is a systematic approach to identification, assessment and control of hazard during production, processing, manufacturing, preparation and use of food, water or other substances (Kirby et al 2003). However, the approach by itself is not enough to secure fish products to be free of the pathogens. Thus, good hygiene, cleaning and sanitation are necessary to secure low levels of microorganism on the on the final product (Huss 1997). In practice, however, this can be very difficult and (Garland 1995) demonstrated that a very low level of Lysteria monocytogenes in final products can be obtained in products produced under hygienic conditions, but it has also been claimed as a practical experience by industry in other countries that “the more you clean the more you have” (Huss 1997). Strict hygiene during manufacture of fish products may therefore decrease the risk from some pathogens and increase the risk from others (Huss 1997). Thus, in no case is the application of good hygiene sufficient to secure safety and a second line of defence (prevention of growth) must be established (Huss 1997). On the other hand, significant specific hazards are addressed by applying the HACCP system. Factory hygiene as well as personnel hygiene and sanitation are for example CCP’s in the prevention of contamination of products with microorgansm, filth and any other foreign material during processing (Huss 1994). Limits may then be established such as microbiological criteria or guides at various steps in the production process or in the final product while monitoring the CCP’s points. Monitoring should measure accurately the chosen factors which control the CCP’s, should be simple, give quick results, and be able to detect deviations from specifications or criteria (Huss 1994). When there is a failure, corrective actions may be taken for the CCP that is not under control, followed by verification as well as documentation concerning all procedures and records according to the HACCP principles and their application (CAC 1997a). Before applying the HACCP system, any food establishment should operate according to the Codex general principles of food hygiene, the appropriate Codex Codes of practice, and appropriate food safety legislation to achieve the goal of ensuring food safety and suitability for human consumption (CAC 1997a). The system has taken on a global perspective in the production of fish and fishery products (Lima dos Santos
UNU-Fisheries Training Programme 7

Samakupa
and Sophonphong 1998). Many countries have adopted or decided to introduce HACCP in seafood production. These include, USA, Canada, Australia, New Zealand, Iceland, Thailand, Ireland, Brazil, Mexico, Venezuela, Argentina, Peru, Cuba, Morocco, Norway, Sri Lanka, Vietnam, Bangladesh, Madagascar, Tunisia, Portugal and Honduras as well as member countries of the European Union (Italy, Germany and France) while in many other countries including most African states the status of seafood HACCP is unclear (Cato 1998). Countries aiming at exporting to countries such as the EU and/or USA, must meet the requirements set up by those countries. The application of HACCP in many manufacturing or treatment processes has led to a more efficient prevention of adverse health effects associated with the consumption or use of the products (Kirby et al. 2003). For example the implementation of an industry wide HACCP programme for seafood processors in the US is thought to have averted 20-60% of the normal number of seafood borne illnesses (Birley and Lock 1998). A similar program for the prevention of food-borne listerosis in the US reduced the incidence and mortality by 44% and 46% respectively over a period of four years (Billy 1997). Thus, hazards related to contamination, recontamination or survival of biological hazard and the growth of pathogens, during processing can be controlled by applying GMP and a well designed HACCP programme (Huss et al. 2000). 3.4 Bacterial indicators Various bacteria are found in the digestive tracts and feaces of animals and humans. Some of these bacteria, i.e. faecal coliforms, E.coli (the predominant group of the faecal coliform group), and Enterococcus spp., are used as hygiene indicators (Frahm and Obst 2003). Indicator microorganisms are microorganisms or a group of microorganisms indicative for the possible presence of pathogens whose presence in given numbers points to inadequate safety in processing (Mossel et al. 1995). In general, they are most often used to assess food sanitation (Jay 1992). There is no universal agreement on which indicator microorganim(s) is most useful, nor are there federal regulations mandating a single standard for bacterial indicators. Thus, different indicators and different indicator levels identified as standards are used in different states, countries, and regions. Today, the most commonly measured bacterial indicators are total coliforms (TC), faecal coliforms (FC), and enterococci (EC). More recently, E.coli (a subset of the FC group) and EC were established as prefered indicators (Noble et al. 2003). 3.5 Detection of indicator organisms Food plants and many other institutions require sanitary conditions in order to prevent microbial contamination. The continuous evaluation of these environments is particularly important in order to assure the safety and quality of products, and the number of microbial cells contaminating food surfaces must be determined for this assessment (Yamaguchi N et al. 2003). Many methods have been developed to detect microorganisms, and although some methods of analysis are better than others, every method has certain inherent limitations associated with its use (Jay 1992). Below is a brief description of some of the methods that are currently in use.
UNU-Fisheries Training Programme 8

Samakupa
3.5.1 Most Probable Number (MPN) technique for coliform bacteria The method consists of inoculating a series of tubes with appropriate decimal dilutions of the sample. Production of gas, acid formation or abundant growth in the test tube after a certain period of time incubation at 35oC constitutes a positive presumptive reaction. Both lactose and Lauryl Tryptose broths can be used as presumptive media. All tubes with positive presumptive reaction are subsequently subjected to a confirmation test. The formation of gas in a Brilliant Green Lactose Bile (BGLB) broth fermentation tube at any time within 48 hours at 35oC constitutes a positive confirmation test. The feaecal test (using an EC medium) can be applied to determine TC that are FC (APHA 1992): the production of gas after 24 hours of incubation at 44.5oC in an EC broth medium is considered a positive result. The results are expressed as MPN (most probable number) of microorganisms present. This number is a statistical estimate of the mean number of coliforms in a sample. As a consequence, this technique offers a semi-quantitative enumeration of coliforms. The method is easy to implement but can become very tedious and laboratory intensive and necessitates a subculture stage for confirmation which can take up to a further 48 hours (Rompré et al. 2002). 3.5.2 Membrane filter technique In the membrane filter method, membranes with a pore size that will retain bacteria (0.45 µm) but allow water or diluents to pass through are used. Following the collection of bacteria upon filtering a given volume, the membrane is placed on an agar plate or an absorbent pad saturated with culture medium of choice, and incubated appropriately. After growth, colonies are enumerated (Jay 1992). The method also offers quantitative enumeration comparatively to the semi-quantitative information given by the Multiple Tube Fermentation (MTF) technique (Rompré et al. 2002). Nevertheless, since this method is not sufficiently specific, a confirmation stage is needed, which could take further 24 hours after the first incubation period on selective media (Rompré et al. 2002). 3.5.3 Swabbing Conventional methods using swabbing are the oldest and most widely used methods for the microbiological examination of surfaces in the food industry, including hospitals and restaurants (Jay 1992). By use of a sterile swab of cotton-wool, part of the disinfected surface is swabbed, and the bacteria now on the swab are transferred to a diluent for determination of colony forming units (CFU) on standard agar substrates (Huss 2003). Swabs are especially useful in places where other control methods can only be used with difficulty i.e. pockets, valves etc.(Huss 2003). 3.5.4 Contact plate In the contact plate method, direct surface contact plates, petri dishes or contact slides with selective or general purpose agar media are applied to the surface to be examined, followed by incubation and counting of colony forming units (Huss 2003). This technique can only be applied to flat surfaces, which is a limiting factor (Huss 2003). The RODAC plate has been shown to be the method of choice when the
UNU-Fisheries Training Programme 9

Samakupa
surfaces to be examined are smooth, firm, and nonporous while it is not suitable for heavily contaminated surfaces (Jay 1992). 3.5.5 Bioluminometric assay of ATP The bioluminometric assay of ATP is almost a real time method giving the answer within minutes or less than an hour. It is very sensitive and can be combined with swabbing for collection of microorganisms from surfaces. The method is rather non-specific, and it may not be able to distinguish between microorganisms and food residues. However, if applied under defined conditions it may prove useful and superior to the conventional methods because it provides the answer in minutes (Huss 2003). 4 PRACTICAL WORK Due to the unacceptable contamination of coliform and faecal coliform according to the processor, the project was designed to find the sources and routes of contamination. Swab samples were taken from surfaces and raw materials at different processing stages and analysed in the laboratory to establish where the main point of contamination is. Recommendations were be made to the processors on the necessary steps to reduce or eliminate coliforms and faecal coliforms. 5 MATERIALS AND METHODS 5.1 Sampling sites The project was carried out in the north of Iceland (Akureyri) at one of the local fish processing establishments. The layout of the processing plant is in Figure 1 and the sampling sites are shown by green spots. For swabs, spots were sampled twice. As for raw cod, spots were sampled once starting from the filleting area.
Figure 1: Schematic diagram of the processing establishment showing all sampling sites (small green spots) (ÚA 1999).
UNU-Fisheries Training Programme 10

Samakupa
5.2 Sampling Procedure Swabs and fish samples were collected on several occasions. Swabs were taken first, followed by fish samples on different days. It was decided that swabs and fish be taken at points where contamination of the raw material was likely to occur due to contact with hands of fish handlers and/or surfaces of equipment operated by fish handlers during different steps in the production process. Samples were taken at the end of the first shift during the day, before cleaning and disinfection for the next shift in order to increase the chance of finding contamination. In addition, studies of the flow chart and observations during the production process were also done. 5.3 Bacteriological analyses 5.3.1 Swabbing Sixty four samples were taken by swabbing on two occasions, 32 in each visit. A number of surfaces (equipment surfaces, conveyor belts, knifes etc.) were swabbed thoroughly with moistened (moisturized with D/E Neutralizing agar) sterile cotton swabs. The swabs were placed each in 10 ml of Lauryl Sulphate Tryptose (LST-DIFCO TM) broth and incubated at 35 oC for 48 hours. To detect the presence or absence (positive or negative) of coliform and faecal coliform, a loopful of suspension from each of the previously incubated LST samples was transferred into a test tube with Brilliant Green Lactose Bile broth (BGLB- DIFCO TM ) and (Escherichia coli broth (EC-DIFCO TM), and incubated at 35oC for 48 hours and 45.5oC for 24 hours, respectively. The positive test tubes were gently agitated and examined for gas formation or effervescence. The results were recorded as positive or negative for coliform and faecal coliform. 5.3.2 Fish samples A total number of 11 samples of raw cod (Gadus morhua) from different areas within the production process were taken, two from the filleting machines, four from the conveyor belts under the candling/trimming table, two from the candling/trimming table and two from the mincing area. To make sure that samples were taken without being contaminated, inverted plastic bags were used to collect them. The inner surface of the bag was used to touch nothing else but the sample. Samples were labelled and transported to the laboratory same day for analysis. Fish samples were minced and 25 g of each sample was weighed, and put into a sterile stomacher bag, homogenizing it with 225 ml sterile peptone water (NaCl 0.5%) in a stomacher for 60 seconds. A number of 10-fold serial dilutions (1, 10-1 and 10-2) were prepared and transferred with pipettes into test tubes containing the BGLB and EC broths, and incubated accordingly at 35oC for 48 hours and 45.5oC for 24 hours respectively. The Most Probable Number (MPN) was calculated on the basis of the proportion of confirmed gassing in the BGLB and EC broth tubes for three consecutive dilutions using tables from Blodgett (2001). Also, from the dilution 1, 0.5 and 0.1 ml were transferred with pipettes onto Petri dish with the Violet Red Bile Agar (VRBA- DIFCO TM).
UNU-Fisheries Training Programme 11

Samakupa
6 RESULTS 6.1 Swabs Most swabs throughout the processing establishment were positive for coliforms. Only six samples out of 64 were negative (Figure 2). The negatives swabs were from the beheading machines and the rest were from the processing area.
Figure 2: Schematic diagram of the processing establishment showing results for swabs incubated in BGLB; positives (red) and negatives (blue). As for faecal coliform, only a few swabs (five samples) were positive (Figure 3). Most of these are from the processing area; filleting machine, candling/trimming tables as well as the conveyors both underneath and before the candling table.
Figure 3: Schematic diagram of the processing establishment showing results for swabs incubated in EC; positives (red) and negatives(blue) (Source ÚA 1999).
UNU-Fisheries Training Programme 12
Samakupa
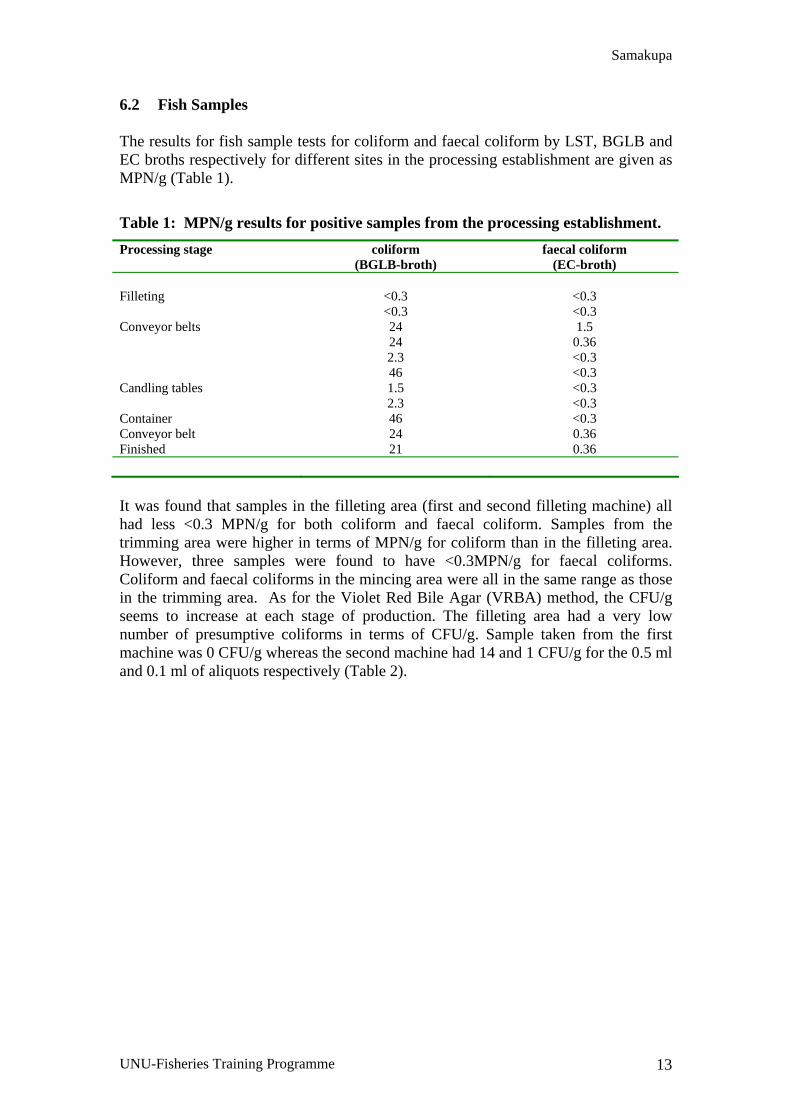
6.2 Fish Samples The results for fish sample tests for coliform and faecal coliform by LST, BGLB and EC broths respectively for different sites in the processing establishment are given as MPN/g (Table 1).
Table 1: MPN/g results for positive samples from the processing establishment. Processing stage coliform
(BGLB-broth) faecal coliform
(EC-broth) Filleting <0.3 <0.3 <0.3 <0.3 Conveyor belts 24 1.5 24 0.36 2.3 <0.3 46 <0.3 Candling tables 1.5 <0.3 2.3 <0.3 Container 46 <0.3 Conveyor belt 24 0.36 Finished 21 0.36 It was found that samples in the filleting area (first and second filleting machine) all had less <0.3 MPN/g for both coliform and faecal coliform. Samples from the trimming area were higher in terms of MPN/g for coliform than in the filleting area. However, three samples were found to have <0.3MPN/g for faecal coliforms. Coliform and faecal coliforms in the mincing area were all in the same range as those in the trimming area. As for the Violet Red Bile Agar (VRBA) method, the CFU/g seems to increase at each stage of production. The filleting area had a very low number of presumptive coliforms in terms of CFU/g. Sample taken from the first machine was 0 CFU/g whereas the second machine had 14 and 1 CFU/g for the 0.5 ml and 0.1 ml of aliquots respectively (Table 2).
UNU-Fisheries Training Programme 13

Samakupa
Table 2: Results for presumptive coliform. Processing stage CFU/g (0.5ml) CFU/g (0.1 ml) Filleting machine 0 0 14 1 Conveyor belts 39 2 28 16 100 13 70 12 Candling tables 1 5 3 21 Container 20 14 Conveyor belt 70 8 Finished product 400 23 In the trimming area, coliform showed an increase up to ca.100 CFU/g and ca. 21 CFU/g for the 0.5ml and 0.1ml aliquots respectively (Table 2). The highest recorded value was from the conveyor belts that take the fish for mincing; ca. 28 to ca.100 CFU/g. The highest value for presumptive coliform was recorded in the mincing area particularly the final product or mince; ca. 400 CFU/g for the 0.5 ml aliquot (Table 2). 7 DISCUSION A number of microbial tests of fish and fish products are used by the industry for contractual and internal purposes and by the authorities to check that the microbiological status is satisfactory. Microbial indicators are often employed to assess food safety and sanitation. In the historical use of safety indicators, however, the pathogens of concern were assumed to be of intestinal origin, resulting from either direct or indirect faecal contamination. Thus, sanitary indicators (such as coliforms) were used historically to detect faecal contamination of water and this practice was extended to foods (Jay 1992). Analysis of swabs and fish samples, shows that in general, coliforms were already present at the first sampling point (de-heading) including all other sample steps in the processing establishment, with few exceptions (Figures 2). It is possible that contamination may have taken place before the fish was brought into the factory for processing. On the other hand, one could also argue that contamination of coliforms may have taken place in the processing establishment since some processing equipment also tested positive for coliforms. That said, the results do not give a clear picture of where exactly before the receiving area or perhaps in the processing area contamination of coliforms took place or was likely to have taken place. Also, lack of data for coliform tests especially before the receiving area, makes it difficult to be certain as to whether contamination took place before or after the raw material was brought into the receiving area. However, it can be assumed that contamination took place before the raw material was brought into
UNU-Fisheries Training Programme 14

Samakupa
the receiving and subsequently contaminating food contact surfaces of equipments especially those that tested positive for coliforms. In addition, one could also assume that contamination did take place in the processing area, as this is supported by other studies. According to Venugopal (2002) contamination of fish particularly by pathogens such as Salmonella sp., Staphylococcus aureus, Campylobacter jejuni, Escherichia coli 0157:H7, Vibrio parahaemolyticus, Yersinia enterocolitica, and Listeria monocytogenes, may occur prior to harvest, during capture, processing, distribution and/or storage. Huss et al. (2000) have pointed out that some pathogenic bacteria are naturally present in the aquatic (Clostridium botulinum type E, pathogenic Vibrio sp., Aeromonas) and the general environment (C. botulinum, type A and B, Listeria monocytogenes) and may therefore be found on live or raw fish. Studies done by Vogel et al. (2001) on L. monocytogenes, indicated that contamination occurred along the processing line. Other studies dealing with different processing operations have similarly concluded that the plant and processing environment is the source of product contamination rather than the raw material. However, this does not exclude the possibility that the raw fish or material is an important initial source for contaminating processing equipment and environment (Vogel et al. 2001). Also, water, like food, is a vehicle for the transmission of many agents of diseases (Kirby et al. 2003). However, the water used in Iceland is considered to be potable therefore the possibility that water may have acted as a vehicle of transmission can be ruled out. In this view, although other studies did not involve mainly testing for coliforms, the same sources and routes of contamination presented in the literature review can be linked to the presence of coliforms in the raw material and food contact surfaces. In this case, the presence of coliforms is most likely to have been contributed by transmission from foodhandlers, be it in the vessels, auction or in the processing establishment, including ice and tubs. As for faecal coliforms the results, according to the microbiological criteria established between the processor and the customers, lie within specified limits (Table 1 and Appendix 3). Faecal coliform is a group that include Citrobacter sp., Enterobacter sp., Klebsiella sp., as well as E.coli. Some of these bacteria particularly E.coli are associated with faecal contamination. In this study positive results for faecal coliforms were found in the processing area suggesting that these bacteria may have originated from foodhandlers and not from other warmblooded animals such as seabirds as they were absent. Beveridge (1988) and Fenlon (1983) demonstrated that some seabirds spread for example Salmonella and other human pathogens in the environment. That could be another possibility of transferring faecal coliforms to the raw material. The fact that tests for coliforms were positive in the trimming area rules out the possibility of faecal coliforms to have originated from seabirds. Thus, it is safe to say that positive results as well as low numbers of faecal coliforms found on fish samples and food contact surfaces in processing environment; filleting machine and conveyor belts before and underneath the trimming/candling table, were transferred to the fish by food handlers. It is possible that faecal coliforms were transmitted onto the raw material and subsequently to food contact surfaces and/or vice versa by hands. Many studies such as the one done by Montville et al. (2002) have similarly concluded that, during handling and preparation, bacteria may be transferred from contaminated hands of food workers to food and subsequently to other surfaces (including food contact surfaces). Snyder (1998) also found that low infectious doses from organisms such as Shigella and the
UNU-Fisheries Training Programme 15

Samakupa
pathogen E.coli were linked to hands as a source of contamination. Other studies such as done by Reij et al. (2003), attributed poor hygiene, particularly deficient or absence of hand washing as the causative mode of transmission. Also, contamination of fish products through contaminated surfaces has been observed in many cases and unclean, insufficiently or inadequately cleaned processing equipment have been identified as a source of bacterial contamination in processed seafood (Reij et al. 2003). Containers, pumps or tanks used for holding or transporting unprocessed raw material, have occasionally been used by many processors for processed products without any cleaning and disinfection (Morgan et al.1993, Evans et al.1996, Hennessy et al.1996, Llewellyn et al.1998). Also according to observations that were done, foodhandlers in the trimming area had placed their feet very close to the conveyor belts under the trimming tables making the transmission of faecal coliform possible. All the above may be possibilities, and there are always bacteria on the hands of foodhandlers, these bacteria may be transferred onto fish and subsequently to processing equipment through touching the raw material. As for the quality system, particularly the GMP/GHP, which deals with matters pertaining to hygiene and sanitation, the processor has such a system in place as recommended by many organisations such as the Codex Alimentarius. The whole quality system has been summarised in what is termed as the own check system of the company which is a much simpler way of quality checking (Appendix 5). In this system there are a number of parameters which are controlled and monitored, including contamination which is the main subject of this study, by responsible personnel. It is believed that this is a good system and it is expected to work accordingly, by maintaining the level of microbial contamination at a minimum or within specifications established by the processor. Having such a system in place, problems such as unacceptable microbial level may arise if procedures laid out in the manuals for hygiene and sanitation are not adhered to from time to time by personnel. According to the results, microorganisms are being transferred onto the raw material and the food contact surfaces. The only way to avoid or eliminate these microorganisms is by applying proper cleaning and sanitation procedures. It is therefore safe to say that foodhandlers are not practicing proper hygiene and sanitation or perhaps they are ignorant. The quality system may be good but if personnel do not adhere to what is laid out in the quality manual, then problems of this nature are likely to take place. Also, if necessary, the knowledge of personnel with regard to contamination should be increased through training. It may be very difficult to get rid of these microorganisms from fish products and processing equipments when they originate from foodhandlers (humans) who handle the fish from capture to packaging of finished products. For a processor to maintain the number below or within exactly specified limits a GMP/GHP needs to be applied properly to get good results. 8 CONCLUSION The results, particularly for coliform, don’t give a clear picture of where exactly before the receiving area and/or in the processing area the contamination of coliforms is likely to take place. However the most likely source of contamination is the foodhandlers as these are the only sources of coliform in contact with the raw
UNU-Fisheries Training Programme 16

Samakupa
material. One can conclude that these bacteria were transferred by personnel to the raw material and subsequently to the food contact surfaces and/or vice versa. The same can be said about faecal coliform as to have originated from foodhandlers and subsequently transferred to the raw material. The processor has a very good quality system in place. This system should work as expected and if not then this is because the personnel don’t adhere to hygienic and sanitation procedures. 9 RECOMENDATIONS Coliforms and faecal coliforms may be transferred onto the raw material as described in the literature review, however foodhandlers could be the most important source for contaminating the raw material and processing equipment. Since the presence of these microorganims may give an impression of the hygienic conditions under which the plant is operating, to reduce or eliminate these microorganisms there is a need for proper application of hygiene and sanitation procedures. Also, if necessary, the knowledge of personnel with regard to contamination should be increased through training. However, it may be very difficult to consistently produce fish products with a number of microorganims within the limits specified by the processor. The processing establishment should not worry much about the problem of coliform and faecal coliform as these microorganisms are not hazards. In addition to that, normal cooking procedures will eliminate the risks from these organisms particularly pathogens leaving the safety concern to the consumption of raw shellfish or raw fish dishes such as sushi (Huss et al. 2000). ACKNOWLEGMENTS First of all, the UNU/FTP particularly Dr. Tumi Tomasson, Mr. Thor Asgeirsson and Ms. Sigríður Ingvarsdóttir are thanked for the opportunity to attend this programme. The UNU/FTP is also gratefully acknowledged for all the arrangements and support during stay in Iceland. Also my sincere thanks to my supervisors; Prof. Hjörleifur Einarsson and Arnheiður Eyþórsdóttir as well as all staff at The Marine Research Institute, Icelandic Fisheries Laboratories as well as the University of Akureyri, are acknowledged for their support in terms of teaching and assistance where necessary. Last but not least, the Quality manager, Elvar Thorarensen as well as all staff at ÚA is hereby thanked for making this study possible.
UNU-Fisheries Training Programme 17

Samakupa
REFERENCES Adler, K. 1999.Recommendation on bare-hand contact with ready-to-eat foods by micro committee. Food Chemistry. News 41 (33): 9. American Public Health Association (APHA). 1992. Compendium of Methods for the Microbiological Examination of Foods, 3 Edition. Washington, DC. Bagge-Ravn, D., Ng, Y., Hjelm, M., Christiansen, N.J., Johansen, C .and Gram, L. 2003. The microbial ecology of processing equipment in different fish industries-analysis of the micro flora during processing and following cleaning and disinfection. International Journal of Food Microbiology. 87: 239-250. Berveridge, M.C.M. 1988. Problems caused by birds at inland waters and fresh water fish farm. In Welcome Prevention and control of bird predation in aquaculter and fisheries FAO Fisheries Report. 51: 34-73. Rome. Beuchat, L.R. 1995. Pathogenic microorganisms associated with fresh produce. Journal of Food Protection. 59: 204-216. Billy, T.J. 1997. HACCP and food safety-Application in a mandatory environment. Food safety and Inspection Service, United States Department of Agriculture, Washington, DC. Birley, M.H., and Lock, K.1998. The Health impacts of Peri-urban natural resource development. Liverpool, England. Liverpool School of Tropical Medicine. Blodgett, R. 2001. Bacteriological Analytical Manual (BAM). 8th edition. Appendix 2, Most Probable Number from Serial Dilutions. U.S. Food & Drug Administration (FDA) USA (http:/www.cfsan.fda.gov/~ebam/bam-a2.html 20.11.2003) Bloomfield, S.F. 2003. Home Hygiene: a risk approach. International Journal of Hygiene and Environmental Health. 206: 1-8. CAC (Codex Alimentarius). 1997a. Hazard Analysis and Critical Control Point (HACCP)-System and Guidelines for its Application. Codex Alimentarius Commission CAC/RCP 1-1969, Rev. 3, Rome. CAC (Codex Alimentarius).1997b. Recommended international code of practice General Principles of Food Hygiene.CAC/RCP1-1969, Rev 3. Rome. Cato, J. 1998. Seafood Safety - Economics of Hazard Analysis and Critical Control Point (HACCP) programmes. Food Agriculture Organisation (FAO).Fisheries Technical paper 381. Rome: FAO. Chen, Y.H., Jackson, K.M., Chea, F.P. and Schafftner, D.W. 2001. Quantification and variability analysis of bacterial cross contamination rates in common food service tasks. Journal of Food Protection. 64: 72-80. De-Roever, C. 1999. Microbiological safety evaluations and recommendations on fresh produce. Food Control. 9: 321-347.
UNU-Fisheries Training Programme 18

Samakupa
Den Aantekker ED, Boom RM, Zwietering MH, van Schothorst M. 2003. Quantifying recontamination through factory environments --a review. Laboratory of Food Microbiology, Wageningen University, P.O. Box 8129, 6700 EV Wageningen. Fenlon, D.R. 1983. A comparison of Salmonella serotypes found in the faeces of gulls feeding at sewage works with serotypes in sewage. Journal of Hygiene. 41: 47-52. Frahm, E. and Obst, U. 2003. Application of the fluorogenic probe technique(TaqMan PCR) to the detection of Enterococcus spp. And Escherichia coli in water samples. Journal of Microbiological Methods. 52: 123-131. Garland, CD. 1995. Microbiological quality of aquaculture products with special reference to Listeria monocytogenes in Atlantic salmon. Aquahealth, Univ. Tasmania, GPO Box 252C, Hobart 7001, Tasmania. Food Australia [Food Aust.], vol.47, no12, pp.559-563, Dec 1995. Hennessy, T.W., Hedberg, C.W., Slutsker, L., White, K.E., Besserwiek, J.M. and Moen, M.E.1996. National Outbreak of Salmonella enteritis infections from ice cream. National English Journal of Medicine. 334: 1281-1286. Heggum, C. 2001. Trends in hygiene management-the diary sector example. Food Control.12: 241-246. Hoxie, N.J., Davis, J.P., Vergeront, J.M., Nashold, P.D., and Blair, K.A. 1997. Cryptosporidiosis-associated mortality following a massive waterborne outbreak in Milwaukee, Wisconsin. American Journal of Public Health. 87: 2032-2035. Huss, H.H. 2003. Assessment and management of seafood safety and quality. Food Agriculture Organisation (FAO). Fisheries Technical Paper 444.Rome: FAO. Huss, H.H., Reilly, A. and Embarek, P.K.B. 2000. Prevention and control of hazards in seafood. Food Control 11: 149-156. Huss, H.H. 1997. Control of indigenous pathogenic bacteria in seafood. Food Control. 8: 91-98. Huss, H.H. 1995. Quality and quality changes in fresh fish. Food Agriculture Organisation (FAO). Fisheries Technical Paper 348. Rome: FAO. Huss, H.H. 1994. Assurance of seafood quality. Food Agriculture Organisation (FAO). Fisheries Technical Paper. No. 334. Rome: FAO. Icelandic Ministry of Fisheries (IMF) 2001. Responsible fisheries-Seafood utilization and processing and markets. Reykjavík. (15.01.2004) < www.fisheries.is >. International Commission on Microbiological Specifications for Foods (ICMSF). 1986. Microorganisms in Foods 2: Sampling for Microbiological Analysis: Principles and Specific Applications. Black well Scientific Publications.
UNU-Fisheries Training Programme 19

Samakupa
Lima dos Santos, C.A. and Sophonphong, K. 1998. Fish inspection and HACCP: An overview. In Proceedings of workshop on seafood inspection. AGR/FI/RD (98)22. Paris, Organization for Economic Cooperation and Development. Liston.J.1980. Microbiology in fishery science. Inst. Food Sci. Technol.,Coll. Fish., University. Washington. Seattle, WA, USA. The Jubilee Conference of the Torry Research Station, Aberdeen (UK), 23th July 1979. Jay, J.M. 1992. Modern Food Microbiology. Microbiological Indicators of food safety and quality, Principles and Quality control, and microbiological criteria. New York: Van Nostrand Reinhold. Kirby, R.M., Bartram, B., and Carr, R. 2003. Water in food production and processing-Quality and quality concerns. Food Control. 14: 283-299. Kondro, W. 2000. E. coli outbreak deaths spark judicial inquiry in Canada. The Lancet. 355: 2058. Kramer, M.H., Herwaldt, B.L., Calderon, R.L. and Jurannek, D.D. 1996. Surveillance for waterborne-disease outbreaks-United States, 1993-1994. CDC surveillance Summaries MMWR Week Report. 45:1-33. Lipp, E.K., and Rose, J.B. 1997. The role of seafood in food-borne diseases in the US of America. Revue Scientifique er Technique Office International des Epizooties. 16: 620-640. Llewellyn, L.J., Evans, M.R. and Palmer, S.R. 1998. Use of sequential case-control studies to investigate a community Salmonella outbreak in Wales. Journal of Epidemiology and Community Health. 52: 272-276. Montville, R., Chen, Y., and Schaffner, D.W. 2002. Risk assessment of hand washing efficacy using literature and experimental data. International Journal of Microbiology. 73: 305-313. Montville, R., Chen, Y., and Schaffner, D.W. 2001. Determination of bacterial cross-contamination rates from hand to food through a glove barrier. Journal of Food Protection. 64: 845-849. Morgan, D., Newman, C.P., Hutchingson, D.N., Walker, A.M., Rowe, B. and Majid, F. 1993. Verotoxin producing of yoghurt. Epidemiology and Infection. 111: 181-187. Mossel David.A.A., Corry Janet E.L., Struijk Corry B., Baird Rosamund M. 1995. . Essentials of the Microbiology of Foods: A Textbook of Advanced Studies. London, John Wiley & Sons, 1995. Noble, R.T., Moore, D.F., Leecaster, M.K., McGee, C.D. and Weisberg, S.B. 2003. Comparison of total coliform, feacal coliform, and enterococcus bacterial indicator response for ocean recreational water quality testing. Water Research. 37: 1637-1643.
UNU-Fisheries Training Programme 20
Samakupa
Olsen, A.R. and Hammack, T.S. 2000. Isolation of Salmonella spp.from the housefly, Musca domestica L., and the damp fly, Hydrotea aenescens, at caged layer houses. Journal of Food Protection. 63: 958-960. Parish, M.E. 1998. Coliforms, Escherichia coli and Salmonella serovars associated with a citrus-processing facility implicated in a salmonelosis outbreak. Journal of Food Protection. 61: 280-284. Reij, M.W., Den Aantrekker, E.D. and ILSI Europe Risk Analysis in Microbiology Task Force 2003. Recontamination as a source of pathogens in processed foods. International Journal of Food Microbiology. Article in press. Rompré, A., Servais, P., Baudart, J., De-Roubin, R.M. and Laurent, Patrick. 2002. Detection and Enumeration of coliforms in drinking water :current methods and emerging approaches. Journal of Microbiological Methods. 49: 31-54. Shewan, J.M. 1962. “The bacteriology of fresh and spoiling fish and some related chemical changes”. In Hawthorn, J. and Leitch, M. eds. Recent advances in food science.1:167-193. Shuval HI, Yekutiel P, Fattal B. 1986. Epidemiological Evidence for Helminth and Cholera Transmission by vegetables irrigated with waste-water-Jerusalem – A case-study. Water Science and Technology 17 (4-5): 433-442 1985. . Snyder, O.P. 1998. Hand washing for retail food operations-a review. Diary Food Environment Sanitation. 18: 149-162. Útgerðarfélagi Akureyringa(ÚA) 1999. Parent Company Quality Handbook. Akureyri: ÚA Seafood Group. (19.01.2004) < http://www.ua.is > Urban, J.E. and Broce, A. 2000. Killing of flies in electrocuting insects traps releases bacteria and viruses. Current Microbiogy. 41: 267-270. Venugopal, V. 2002. Biosensors in fish production and quality control. Biosensors and Bioelectronics. 17: 147-157. Vogel BF, Huss HH, Ojeniyi B, et al. 2001. Elucidation of Listeria monocy togenes contamination routes in cold-smoked salmon processing plants detected by DNA-based typing methods. Applied and Environmental Microbiology 67 (6): 2586-2595 JUN 2001. Yamaguchi N, Ishidoshiro A, Yoshida Y, Saika T, Senda S, Nasu M. 2003. Development of an adhesive sheet for direct counting of fabteria on solid surfaces. Journal of Microbiological Methods 53 (3): 405-410 Jun 2003.
UNU-Fisheries Training Programme 21

Samakupa
APPENDIX 1: A BRIEF DESCRIPTION OF PRODUCT MANUFACTURING AT ÚA. The company obtains its raw material from fish trawlers as well as auctions. The fish is bled, gutted, washed properly and iced before transport to the factory. At the factory, the fish is kept in a cooler in the receiving area at 0-4oC in plastic boxes and totes. Before heading and size grading, the fish is emptied into a hopper with an incline steel conveyor belt and washed with a steady overflow of potable water. The head cutting, filleting and removal of skin are done by commercial machines. The fillets are checked on a candling table for number of defects. All bones except pin bones, visible parasites, blood spots, bruisers, skin spots as well as black membrane including any foreign objects are removed from fillets. The trimmed fillets are portioned either manually or automatically before they are quick frozen at -24oC. They are also sprayed with potable water for glazing percentage when necessary. The fish and fish products are weighed and packed directly into plastic bags, cartons and boxes according to specifications, in an area separate from where they are processed. Some of the fish are packed into plastic envelopes and eventually into cartons while blocks (fillets/piece/mince) are packed directly into block cartons. All finished products are labelled according to specifications and frozen in plate freezers for about 2.5 -3 hours or until the core temperature has reached a minimum temperature of -24oC. After freezing, the cartons are depanned and packed. A complete cleaning and disinfecting procedure is carried out on all equipment, machines and conveyor belts at the end of each production session, fulfilling the requirements for Good Manufacturing Practices. Sodium hypochlorite is used as a sanitizing agent. Palletized products are kept in frozen storage at a minimum temperature of -24oC. They are taken for shipping directly from frozen storage to freezer container at -24oC.
UNU-Fisheries Training Programme 22

Samakupa
APPENDIX 2: FLOW DIAGRAM FOR PROCESSING OF COD (GADUS MORHUA) (ÚA 1999).
Raw material(cooler)
Washing
Heading,filleting and skinning
Trimming/Portioning Mincing
Packaging / Cooling
Packaging/Cooling(Ice)
Cutting Weighing
Mixing/Forming/IQF
CCP Metal detector
Casing/Labelling/Palletizing
Frozen /Shipping
UNU-Fisheries Training Programme 23

Samakupa
APPENDIX 3: MICROBIOLOGICAL GUIDELINE FOR RAW MATERIAL (GADUS MORHUA) AND POTABLE WATER (ÚA 1999). Good Defective Reject Raw material TPC,30°C <150,000 150,000 - 350,000 >350,000 Coliforms, MPN/g <100 100 – 200 >200 E.coli, MPN/g <0,3 0,3 – 4 >4 Staphylococcus / g <10 10 – 100 >100 Listeria in 25 g Absent Present Potable water Coliforms, MPN/100 ml Absent Present E.coli,MPN/100 ml Absent Present
UNU-Fisheries Training Programme 24

Samakupa
APPENDIX 4: RESULTS FOR SWABS (1ST AND 2ND SAMPLING) TAKEN THROUGHOUT THE PROCESS. Processing Stage
Coliform (BGLB-35oC)
Faecal Coliform (EC-45.5oC)
1st sampling 2ndsampling 1st sampling 2ndsampling De-heading 1 + + - - 2 - + - - Filleting machine 1 + + - - 2 + + - - 3 + * - * 4 + + + - Conveyor 1 + + - - 2 + + - - Before cutting 1 + + - - 2 - + - - Candling table 1 + + - - 2 - + + - 3 + + - - 4 + + - - 5 + + - - 6 + + - - Conveyor 1 + + - - 2 + + - - 3 + + - - 4 + + - + Collection 1 + + - - 2 + * - * Container 1 - + - - Knifes 1 + - - - 2 + - - - Plastic door 1 - + - - Container 1 - + - - 2 + + - - Working table 1 + + - - 2 + + - - * The LST broth leaked and therefore samples could not be incubated further.
UNU-Fisheries Training Programme 25

Samakupa
APPENDIX 5: OWN CHECK SYSTEM OF THE COMPANY ÚA (ÚA 1999). Production Stage Monitoring
frequency Control measures
Control limits Actions Reference Responsible person
Receiving area Overall quality of raw material Temperature
record. Use of ice, sensory evaluation (each lot)
Chilling of raw material on board vessels, General rules of handling on board.
Raw material assessed as acceptable or better. Ice visible.Temp. of raw material (0-4oC) no contamination.
Raw material chilled in iced water, decomposed and contaminated raw material destroyed.
Raw material purchasing rules.
Forman in reception, production manager and quality manager
Check labelling (traceability) All containers labelled
Correct labelling of catch board vessel
None Unlabelled raw materialevaluated carefully.
Raw material purchasing rules.
Forman in reception, production manager
Chiller
Temperature ofchiller monitored continuously
Raw material iced, chilled door closed all time, sanitation according to plan
Temp in raw material (0-4oC)
Raw material chilled in ice water, sensory evaluation, decomposed raw material destroyed.
Quality manual.
Forman in reception , production manager
Heading/Filleting/Skinning Evaluation of 10 whole fish and 20 fillets
Handling and good conditions
Score of 3 or higher on a 5 point scale
Defects reported to the quality manager/production manager.
Specifications. Quality controller,production manager/quality manager
UNU-Fisheries Training Programme 26

Samakupa
APPENDIX 5: OWN CHECK SYSTEM OF THE COMPANY ÚA (ÚA 1999) CONTINUED. Production Stage Monitoring
frequency Control measures Control limits Actions Reference Responsible
person Trimming
Temp. of filletschecked every two hours.
Sanitation according to plan.
Temp. of raw material not above 4oC.
Defects reported to the quality manager/production manager
Code of practice. production manager and quality manager
Trimming Continuous check. Tanning of staff. According to specifications
Increase inspection, re-processing of raw material
Specifications. quality controller,production manager and quality manager
Cutting/forming Continuousmonitoring of nuggets
Training staff. Making sure that enough forming material is in machine.
No misshapen nuggets. should not lie together.
Remove misshapen and pieces which lie together.
Quality manual. quality controller foreman in breading area
Batter and breading Pick-up, viscosity checked every hour, breading defects 15 min
Training of staff, Adjust machinery. Sanitaion according to plan.
According to specifications.
Notify foreman in breading area who will adjust the machinery.
Quality manual. quality controller, foreman in breading area
UNU-Fisheries Training Programme 27

Samakupa
APPENDIX 5: OWN CHECK SYSTEM OF THE COMPANY ÚA (ÚA 1999) CONTINUED. Production Stage Monitoring
frequency Control measures Control limits Actions Reference Responsible person
Prefrying Temperature andtime, every hour. Color of product every 15 min.
Check oil level, circulation and temperature before using the fryer.
Temp 195-200 oC, golden colour
Notify foreman in breading area to adjust machine.
Specifications. Quality controller,foreman in breading area.
IQF Continuous monitoring of IQF/Every two hours.
Keep door closed Temp < -18oC Slow down IQF, increase cooling.
Quality manual. Quality controller, foreman in breading area
Glazing Everyday for each production number
Training of staff check temperature of water used
According to inspection
Notify foreman to adjust temp. of water
Quality manual. Quality controller, foreman in freezing area
Packing Every hour Time in freezer correct
Temp. in product not higher than -18oC when placed in cold store
Adjust temp of flow and temp. of freezer.
Quality manual. Quality controller
Weighing
Bags/case/block andcase closure(Every hour)
Training staff Grader correctly adjusted
According to specifications
Calibrate scale Specification. Quality controller production manager and quality manager
Metal detector Continuously Calibrated three times/day with >2mm silver metal
>2 mm in length Report to the foreman or quality manager
Quality manual. Quality controller
UNU-Fisheries Training Programme 28

Samakupa
APPENDIX 5: OWN CHECK SYSTEM OF THE COMPANY ÚA (ÚA 1999) CONTINUED. Production Stage Monitoring
frequency Control measures Control limits Actions Reference Responsible person
Labelling Labels inspected oneach product number.
Adjust printer, check the info on label and compare them to inspectec and ISI production almanac
None Labelling not correct then re-label all packs.
Specification. Quality controller.
Cold store Continuous recording of temp. in cold store.
Temp. <-25 oC Limit time doors are opened. De-ice regularly.
Temp <-18oC Adjust temp. in cold store.
Quality manual. Foreman at cold store.
Transport
Temp <-25 oC limit time doors are open. Ice regularly.
Temp of product <-20
oC Evaluate the fitness of product for transport with transport company
Quality manual, Transport company code of practice
Foreman at cold store, Production manager.
UNU-Fisheries Training Programme 29