hyndman michael thesis - ttu-ir.tdl.org
TRANSCRIPT

Reduced Daily Temperature Range Influences the Magnitude of Soil Microbial
Activity in a Creosotebush Bajada in the Chihuahuan Desert in Big Bend National Park
by
Michael Lee Hyndman, B.S.
A Thesis
In
Biology
Submitted to the Graduate Faculty of Texas Tech University in
Partial Fulfillment of the Requirements for
the Degree of
MASTER OF SCIENCES
Approved by
John Zak Chair of Committee
Jennifer Moore-Kucera
Tigga Kingston
Mark Sheridan Dean of the Graduate School
December, 2015

Copyright 2015, Michael Lee Hyndman

Texas Tech University, Michael Hyndman, December 2015
ii
ACKNOWLEDGEMENTS I would like to recognize and thank my committee chair, John Zak. He
brought me into his lab as a senior undergraduate student and gave me the opportunity
to explore the world as a scientist. I could not have asked for a better mentor during
my time at Texas Tech University. My deepest appreciation and thanks goes out to
the rest of my committee: Jennifer Moore-Kucera, who let me use her laboratory's Li-
Cor 8100A equipment, and Tigga Kingston, who helped me to better understand the
scope of ecology as it applies to microbiology. While working on my thesis, I had the
honor of learning from our post-doctorate and doctorate fellows Heath Grizzle,
Natasja van Gestel, and Nirmala Dhungana. They were all generous and patient in
passing down their experience and knowledge in conducting scientific research. One
cannot get far in life without the help of friends and colleagues. Trevor Mason, Diana
Vargas-Gutierrez, Neha Kumari, and Kholoud Ghanem all helped me during the
research process either by getting dirty in the field or working diligently in the lab.
There is no way that I could have done all the hard work alone. Special thanks go to
Joe Sirotnak as our liaison at Big Bend National Park; he kept us in great housing
during our trips to Big Bend. I would also like to thank both the National Parks
Services and Cotton Incorporated for their financial assistance.
My deepest, heartfelt thanks go to my mother, Olivia Barraza, and my father,
Jerry Hyndman for cultivating a love of learning and discovery at a young age and for
their continued support as I pursued my academic goals. I would also like to
acknowledge my step-mother, Judith and my step-father, Jorge who have both cheered
me on while I conducted my research. Thanks to my sisters Krystal and Lisa for
being great roommates while I was at Texas Tech and for embracing my geeky side.
Finally, I would like to thank Karen Bishop for being the catalyst for completing my
work.
Texas Tech University, Michael Hyndman, December 2015
iii
TABLE OF CONTENTS
ACKNOWLEDGEMENTS .................................................................................. ii
ABSTRACT .......................................................................................................... iv
CHAPTER I - INTRODUCTION ....................................................................... 1
CHAPTER II - METHODOLOGY ..................................................................... 6
Site Description ........................................................................................... 6 Li-Cor 8100A .............................................................................................. 8 Microbial Biomass of Carbon ..................................................................... 9 FungiLog ..................................................................................................... 9 Soil Nutrient Content ................................................................................ 10 Statistical Analyses ................................................................................... 11
CHAPTER III - RESULTS ................................................................................ 13
Abiotic Observations ................................................................................. 13 Microbial Biomass of Carbon ................................................................... 14 FungiLog ................................................................................................... 15 Soil Nutrients ............................................................................................ 17 CO2 Respiration, Daily Temperature Range, and Precipitation ................ 22 Daily Temperature Range and Daily Mean CO2 Flux .............................. 27 Redundancy Analysis ................................................................................ 30
CHAPTER IV - DISCUSSION .......................................................................... 31
LITERATURE CITED ....................................................................................... 37
APPENDIX A - FIGURES ................................................................................. 43
APPENDIX B - TABLES ................................................................................... 62

Texas Tech University, Michael Hyndman, December 2015
iv
ABSTRACT Global climate change models for desert ecosystems not only predict an
increase in mean temperatures but also an increase in the daily low temperatures,
resulting in a decrease in daily temperature range (DTR). While soil moisture and
antecedent precipitation regimes are considered in current models for desert ecosystem
functioning, these models are limited in understanding the role of temperature and
seasonal variability, specifically the daily temperature range and the response of soil
microbial communities to available soil moisture during different times of the year.
This study seeks to utilize new automated soil gas monitoring technology and solar
shading, altering the DTR by increasing nightly low temperatures and decreasing daily
high temperatures, to measure soil microbial community respiration activity in
response to reduced DTR compared with unaltered soil temperature dynamics in
control plots. The research was conducted in a creosotebush bajada in the Chihuahuan
Desert in Big Bend National Park. Over the course of a year of with observations
beginning in November 2012 and ending in December 2013, the soil monitoring
equipment recorded hourly temperatures and CO2 emissions from the top 15 cm of
soil. Soil sampling over the study period was conducted to determine levels of
microbial biomass of carbon (MBC), fungal substrate activity (FSA), fungal substrate
richness (FSR), extractable soil ammonia (NH4-N) and nitrate (NO3-N), extractable
phosphorus (P), available potassium (K), soil organic matter (SOM), and soil pH. For
some of the experimental parameters there was no significant difference between
treatments on individual sampling dates, but there was an observed difference between
treatment groups for some parameters across the whole time period of the study.
Texas Tech University, Michael Hyndman, December 2015
v
Reduced DTR plots experienced an increase 7.7% in CO2 flux, an increase of 28.9%
in MBC, a 32% increase in FSA, and a 26% increase in FSR. These results indicate
that in addition to the pattern of rain events and levels of soil moisture, soil microbial
activity in arid and semi-arid regions is governed in some way by soil temperatures
over the day. Reductions in DTRsoil appear to ultimately allow soil microbial
communities to respond to rain events more robustly than previously predicated by
moisture responses alone. Thus, DTRsoil changes the magnitude of the response but
not the overall seasonal timing of the response. Even when soil moisture is optimal,
microbial activity as measured by CO2 efflux was reduced when DTR soil was high.
The incorporation of DTR response in microbial communities in desert soils will help
to fully understand and predict the impact of further climate change in regions that are
already sensitive to variable climate and precipitation.

Texas Tech University, Michael Hyndman, December 2015
1
CHAPTER I - INTRODUCTION Temperature regulates and controls many chemical reactions in both physical
and biological systems, including most ecosystem processes (Hobbie, 1996; Pregitzer
& King, 2005; Lin et al., 2010). Soil nutrient dynamics and organic matter
decomposition respond to soil temperature, which also regulates the activity of soil
microbes that facilitate these vital processes (Wardle, 2004; Bardgett, 2005). Our
understanding of how soil temperatures affect microbial activity and functional
diversity is greatly lacking, and in the midst of global climate change it is imperative
that we better understand the magnitude of this process to help manage and protect our
natural resources and develop sustainable agricultural practices under increasing
climate variability.
Global climate change studies have shown that global temperatures have
increased 0.74 °C since the previous century and temperatures are projected to
increase to as much as 6.4 °C within the next decade (IPCC, 2007). While the
implications of this increase in daily maximum air temperature, Tmax, are troubling,
another discovery in climate studies is an increase in daily minimum air temperatures,
Tmin. This increase in Tmin has been shown to be increasing at a rate greater than that
of Tmax (Vose et al., 2005; Zhou et al., 2009). This unbalanced change in temperature
patterns has resulted in a reduction of the daily temperature range for air, DTRair (Vose
et al., 2005; Zhou et al., 2009).
Air temperatures have a strong influence on soil temperatures, and the resultant
reduction in DTRair will likely have an effect on the daily temperature range of the

Texas Tech University, Michael Hyndman, December 2015
2
soil, DTRsoil (Nobel & Geller, 1987; Kemp et al., 1992; van Gestel et al., 2011; van
Gestel et al. 2015). The current reduction in DTRsoil has been shown to be 43% more
pronounced in arid and semiarid ecosystems when compared to other ecosystems
(Zhou et al., 2009). Lower vegetation density and greater heat-holding capacity of
soils in arid and semiarid ecosystems appears to be the prevailing factor in
determining soil temperatures at shallow depths based on air temperatures (Parton,
1984; Kemp et al., 1992; Pregitzer & King, 2005; Zhou et al., 2007).
Bacteria and fungi are the primary decomposers of soil organic matter and are
essential to the mineralization of nitrogen and phosphorus in terrestrial ecosystems
(Wardle, 2004; Bardgett, 2005; Paul, 2007). Soil microbes produce the critical
cellulose-, chitin-, and lignin-degrading enzymes, which are responsible for recycling
organic matter and associated nutrients back to primary producers (Conant et al.,
2011; Wallenstein et al., 2011) under a given set of abiotic conditions that is optimal
for all terrestrial ecosystems. These enzymes, and the microbes that produce them, do
respond to different temperatures regimens; however, understanding what aspects of
soil temperature (min, max, average, or range) actually regulates microbial activity is
needed (Conant et al., 2011; Tibbett et al., 1999). When soils in a Chihuahuan Desert
creosotebush bajada were subjected to an experimental reduction of DTRsoil, microbial
biomass carbon and increased irrespective of any change in soil moisture, with a
reduction in extractable NO3-N caused by the increased activity of soil microbes as the
temperature stress of a high DTRsoil was lowered (van Gestel et al., 2011).

Texas Tech University, Michael Hyndman, December 2015
3
Soil microbial activity in response to temperature variation can also be
analyzed by monitoring CO2 emissions. Soil respiration data can also allow for a
greater understanding of how soil temperatures may affect carbon sequestration or
carbon dynamics in semiarid ecosystems under increasing climate variability. Karhu
et al (2014) in a study across multiple ecosystems showed that the magnitude of the
response of soil microbes to temperature increases remains uncertain, as the response
of soil microbial communities to changing temperatures has the potential to either
decrease or increase warming-induced carbon losses through increased respiration.
Until recently, most data on soil respiration was limited to short time frames (weeks to
a month), but with current technologies, observation times can be extended to full
seasons or years (Li-Cor, Inc., 2013). Understanding how CO2 emission levels change
over time under different DTRsoil will improve our knowledge on what effects climate
change may have on the amount of carbon soil microbes take up and how much they
release back into the environment.
Impacts of soil temperatures can have a seasonal component that is responsible
for much of the microbial activity observed within ecosystems. Bell et al (2009)
showed that fungal activity was regulated by soil temperatures for a mid-elevation
sotol-grassland in the Chihuahuan Desert, while bacterial activity was regulated by
soil moisture irrespective of soil temperatures. Using a combination of FAME and
DGGE analyses along with BioLog and FungiLog methods to characterize functional
capabilities, Clark et al (2009) examined microbial community structure and function
along an elevation gradient in the Chihuahuan Desert at Big Bend National Park.

Texas Tech University, Michael Hyndman, December 2015
4
They concluded from this study that the changes in the magnitude of precipitation
events and temperatures predicted for the region on soil microbial structure and
function for bacteria and fungi were site specific along the elevation gradient. The soil
bacterial communities in the mid-elevation sotol-grassland location was most
vulnerable to changes in precipitation size and frequency while fungal community
structure was most venerable in the low desert scrub sites (Clark et al., 2008).
Working in a precipitation manipulation experiment in a grassland ecosystem in
California, Hawkes et al. (2011) found that the response of soil fungi to altered rainfall
was due in large part to how the alterations related to current rainfall patterns.
Changes in precipitation will also have impacts on seasonal patterns in soil
temperatures and indirect consequences to soil microbial dynamics.
Temperature along with soil moisture also influences the mineralization of soil
nitrogen (Agehara & Warncke, 2005). Specifically, a proportional relationship
between temperature and production of soil nitrate (NO3-N) in incubated soils that
could be linked to the activity of soil microbes as long as sufficient soil moisture is
available. Carbon to nitrogen ratios (C:N), also show dependence on soil temperature
as the activity of soil microbes that facilitate the process of mineralization can be
limited by extreme high and low temperature (MacDonald et al., 1994; van Gestel et
al., 2011).
This study focused on the effects of DTRsoil on microbial activity and
associated nitrogen dynamics as evaluated by microbial biomass production,
functional diversity, and CO2 evolution in a Chihuahuan Desert creosotebush bajada at

Texas Tech University, Michael Hyndman, December 2015
5
Big Bend National Park. The study builds upon the information previously collected
at the site by van Gestel et al (2011); van Gestel et al 2015 and Dhurgana 2013. The
core experimental hypothesis for this study is that reduced DTR in creosotebush
bajada soils will result in an increase in soil microbial community activity. The
predictions that I will use to evaluate the hypothesis are that 1) a reduction in DTRsoil
will increase soil respiration during the summer, 2) The increase in soil respiration is
attributed to an increase in soil microbial biomass and functional capabilities on
carbon compounds, and 3) CO2 respiration levels will be negatively related to soil
nitrogen availability by influencing the immobilization and mineralization patterns of
nitrogen in soil microbes.

Texas Tech University, Michael Hyndman, December 2015
6
CHAPTER II - METHODOLOGY
Site Description The second largest desert in North America, the Chihuahuan Desert straddles
the US and Mexican border as it runs from the central and northern regions of Mexico
into southwestern Texas and southern parts of New Mexico and Arizona. Sheltered by
the Sierra Madres, the Chihuahuan Desert can boast as one of the most biologically
diverse arid regions in the world (Dinerstein et al., 2000 and Olson & Dinerstein,
1998). Big Bend National Park occupies the central extents of the desert that crosses
over southwest Texas.
This study was conducted within a creosotebush bajada (Rice Tank location)
within the Pine Canyon Watershed (N 29°13’43” latitude, W 103°10’12” longitude,
962 m elevation) in Big Bend National Park, Chihuahuan Desert (Figure 1). Soil at the
site is a gravelly, fine sandy loam of the Chilicotal series (loamy-skeletal, mixed,
superactive, thermic Ustic Haplocalcids) (Cochran & Rives, 1985) with a pH of 8.1.
The dominant vegetation includes Larrea tridentata (creosote bush), Agave
lechuguilla (shin dagger), Leucophyllum frutescens (ceniza) and Opuntia sp. (prickly
pear) (van Gestel et al., 2011; Dhungana, 2013). Based on data recorded by the
National Oceanic and Atmospheric Administration (Weather Service, 2014) for
Panther Junction, located in the central region of Big Bend National Park, annual
climate patterns for Rice Tank typically consist of hot summers, mild autumn and
springs, and cool winters with some freezing events that occur overnight.
Precipitation is sparse for most of the year except for the summer months when

Texas Tech University, Michael Hyndman, December 2015
7
monsoonal rains move across the area. There are intermittent rainfall events in the
spring and little to no rain during the winter months. Total annual rainfall has
averaged 357 mm per year over the last ten years for this part of Big Bend National
Park (Weather Service, 2014).
To reduce the daily temperature range of soil of the experimental plots, solar
shading nylon cloth was employed following the experimental manipulation employed
by van Gestel et al (2011), and Dhungana (2013). The shade cloth used reduces the
amount of solar radiation reaching the soil surface under the experimental plot by
50%, thus reducing the daily high temperature of the soil surface. The shade cloth
also acts as an insulator, keeping the soil slightly warmer at night. Due to their loosely
woven design, these shade cloths would also allow rainfall to pass through. The nylon
shade cloth was suspended, using a PVC support frame, half-meter over the soil
surface so that the shade cloth would not interfere with the Li-Cor automatic soil
respiration chambers. The 3x3 meter experimental shade plots were set up in an
alternating radial pattern with control plots with the main control and power unit for
the Li-Cor 8100A soil monitoring equipment in the center (Figure 2). Initially two
plots were established for each treatment and then one month later, the study plots
were expanded to four as additional chambers were obtained. Plots were established
such that they did not contain creosote bush shrubs or other larger plants which would
be impacted by the implementation of the DTR reduction. All plots were fenced off
with chicken wire fastened to rebar to keep animals out of the plots.

Texas Tech University, Michael Hyndman, December 2015
8
Soil sampling was conducted during each season, from November 2012
through December 2013. Specifically samples were collected in December 2012,
March 2013, May 2013, July 2013, November 2013, and then December 2013 by
taking two random samples to a depth of 15 cm to produce a composite soil sample
from each plot. Composite sampling was used to attain enough soil for analysis while
minimizing disturbance to the plot in one location. During sampling dates, data and
basic maintenance and repairs to the Li-Cor 8100A soil monitoring equipment was
also performed.
Li-Cor 8100A Monitoring sites for the Li-Cor 8100A gas analyzer were selected within the
shade and control plots based on the relative proximity shrubs adjacent to the plots.
We wanted the readers to be close vegetation outside of the plots because to capture
potential CO2 derived from rhizosphere dynamics.
After soil collar rings were installed, the difference in the distances from the
soil surface to the tip of the collar ring and the base frame of the reader to the top of
the collar ring was calculated and inputted into the monitoring software to correct for
the differences in monitored soil volume that would result in variations in the depths
of the collar rings for each plot..
Gas measurements were programmed to occur every hour continuously.
Measurements were taken with a 30 second pre-purge of the air in the tubing leading
up into the main gas analyzer, a 60 second recording phase, and then a 30 second post-
reading purge. Values for carbon dioxide flux and surface soil temperature were

Texas Tech University, Michael Hyndman, December 2015
9
averaged among treatment (shaded soils) and control (exposed soils) groups. The
daily temperature range was then plotted alongside the mean carbon dioxide flux
values.
Microbial Biomass of Carbon The chloroform-fumigation and extraction method (Vance et al., 1987) was
used to estimate microbial biomass carbon (MBC). From each soil sample, two
duplicate sets of subsamples (5 g dry-weight equivalent) were obtained with one set
chloroform-fumigated and another set non-fumigated. Both sets were incubated under
vacuum in a moist environment for 48 hours. Total C in each sample was extracted
using a 0.5 M K2SO4 solution and the amount of soluble C was estimated
spectrophotometrically at 280 nm (Nunan et al., 1997) for each subsample with a
correction factor of 0.45 (Vance et al., 1987). The amount of soluble carbon from the
non-fumigated set of subsamples was subtracted from the corresponding set of
fumigated subsamples before the amount of MBC was calculated (Nunan et al., 1997).
Soil samples were processed within a week when returning from sampling and stored
at 4 ºC. Sampling for MBC occurred on December 2012, March 2013, May 2013,
July 2013, and November 2013.
FungiLog FungiLog provides an indication of fungal community functional capabilities
based on the metabolism of 95 different carbon sources within a 96-well microtiter
array (Sobek & Zak, 2003). Based on how many (Substrate Richness) carbon sources

Texas Tech University, Michael Hyndman, December 2015
10
are metabolized, and the total activity associated with a sample (Substrate Activity)
comparisons between fungal communities functional diversity can be made
FungiLog preparation begins with preparing soil samples of 50-75 grams of
mesothrophic soils; however 125-150 grams of arid soils were typically used to
account for the extremely low levels of organic matter present in those samples. The
remaining steps were followed in the protocol outlined by Dobranic, Sobek, and Zak
(1999 & 2003). Absorbance readings at 590 nm were taken at 48, 72, and 120 hours
after inoculation (Dobranic & Zak, 1999; Sobek & Zak, 2003).
Substrate activity was determined by summing the wells on the microtiter array
that had absorbance values greater than the control well. This value would indicate
how many carbon sources could be metabolized by at least one member of the fungal
community in the sample. Substrate richness was determined by counting all the wells
on the microtiter array that had absorbance values greater than the control well by at
least 0.1 absorbance reading. The slope of a linear line of best fit with the y-intercept
set as zero was used to compare substrate activity and richness across sampling dates
and treatments as the slope indicates the rate of substrate use by members of the soil
fungal community. Sampling for fungal substrate activity and richness occurred in
December 2012, March 2013, July 2013, and November 2013.
Soil Nutrient Content Soil samples will be sent to Water’s Agricultural Laboratories, Inc.
(Owensboro, KY, USA) for the evaluation of the levels of extractable NO3-N and
NH4-N, available Phosphorus, Exchangeable Potassium, Soil pH (water and buffer),

Texas Tech University, Michael Hyndman, December 2015
11
and Soil Organic Matter. Sampling for soil nutrient content were sent to Water's
Agricultural Laboratories, Inc in November 2012, December 2012, March 2013, Jul
2013, and December 2013.
Statistical Analyses Microbial biomass carbon values were first analyzed using a one-way ANOVA
for each separate date and treatment combination to test for homogeneity using the
Levene’s Test as the assessment (IBM SPSS version 22). Microbial biomass of carbon
values were square-root transformed to obtain homogeneous variances. Differences
across treatments and season were subsequently analyzed using a Repeated Measure
ANOVA to determine both within and between subject effects of time, experimental
treatment independent of time, and experimental treatment dependent on time.
The same approach was used to assess the effects of DTRsoil reduction on the
slope values for FungiLog substrate activity and substrate richness, on the collective
slopes for substrate activity and substrate richness on the FungiLog plates, extractable
NO3-N and NH4-N, available phosphorus, exchangeable potassium, soil pH, and
percentage Soil Organic Matter Based on the results of the Levene's test for
homogeneity, values for nitrate, ammonia, phosphorus, and potassium were all log
transformed before running the Repeated Measures ANOVA while the values for
SOM were transformed by the arcsine square root of the value. The values for pH
were not transformed. Significant differences among sample dates, when significant
were evaluated using the aposteriori Tukey test (IBM SPSS version 22).

Texas Tech University, Michael Hyndman, December 2015
12
Redundancy analyses (RDA; ‘rda’ function) in R (assistance provided by N.
van Gestel) to determine whether the relationship between environmental conditions
(DTRsoil, soil moisture) and microbial and soil nutrient responses differed between
DTR plots and control plots. To compensate for when the instruments were running
the daily mean temperature range for the five days following sampling was used for
the RDA. Data were centered and scaled prior to running the RDA to account for
differences in units and ranges (van Gestel et al., 2015).
All statistical tests were performed using IBM SPSS version 22, and the R
statistical software package, and graphs were produced using SigmaPlot 11.2 and R.

Texas Tech University, Michael Hyndman, December 2015
13
CHAPTER III - RESULTS
Abiotic Observations During the observational period from November 2012 to December 2013, there
was a combined 34.93 cm of rainfall. Temperatures ranged from a high of 39.39 °C on
June 1st, 2013 to a low of -5.0 °C on December 8th, 2013. Average high daily
temperature for the period of the experiment was 25.15 °C and average low daily
temperature for the period of the experiment was 12.40 °C (Figure 3). During the
observational time of the experiment, small rain events occurred in November and
December of 2012 with most of the annual precipitation arriving during August and
September of 2013, and then smaller rainfall events occurring during November 2013
(Figure 3). Total accumulated rainfall for the fall of 2012 was 3.81 mm, 48.51 mm for
the winter of 2012 to 2013, 58.93 mm for the spring of 2013, 99.57 mm for the
summer of 2013, 130.30 mm for the fall of 2013, and 8.13 mm for the first part of the
winter of 2013 to the end of the calendar year.
Percent soil moisture (gravimetric soil moisture) ranged from a low of 1.60%
the control plots sampled in May 2013 to a high of 9.02% for the December 2013
sample period with an average of 3.82% for the period of the study (Figure 4). For the
reduced DTR plots the lowest level of percent soil moisture, 1.47%, was observed
during July 2013 and the highest value, 8.04%, was observed during December 2013
with an average of 3.12% for the period of the study. For both the control and reduced
DTR treatment plots seasonal variability remained similar from November 2012 to
May 2013, until July 2013 when the control plots experienced 59% higher percent soil
moisture compared to the reduced DTR plots.

Texas Tech University, Michael Hyndman, December 2015
14
The average gravimetric soil moisture (%) across all sample dates was 3.82%
for the control plots and 3.12% for the reduced DTR plots. Across all sample dates,
soil moisture in the control plots were 18.5% higher than the reduced DTR plots. The
Repeated Measures ANOVA did not indicate a significant time effect for percent soil
moisture across the duration of the experiment irrespective of the treatments (Figure 4
and Table 1). Nor was there a significant interaction of time and treatment indicating
that manipulation of the DTR by way of soil shading did not influence the abiotic and
biotic factors that affect soil moisture levels significantly on the basis of each
individual sampling period. There was a significant difference between the reduced
DTR plots and the control plots with all of the dates combined (Table 1).
Microbial Biomass of Carbon Microbial Biomass Carbon (MBC) ranged from a low of 21.16 µg/g dry wt. of
soil for the control plots sampled in March 2013 to a high of 95.51 µg/g dry wt. of soil
for the November 2013 sample period (Figure 5). For the reduced DTR plots the
lowest MBC levels of 44.86 µg/g/dry wt. of soil were observed during May and July
2013 with the highest values observed during November 2013 (89.54 µg/g/dry wt. of
soil). For the control plots, Microbial Biomass Carbon dynamics did not show as
much seasonal variability as did the reduced DTR plots except for the final sampling
period when Microbial Biomass Carbon increase by three times between the July
sample date and November 2013.
The average Microbial Biomass Carbon for the reduced DTR plots across all
sample dates was 62.4 µg/g/dry wt. of soil while the average MBC amount for the
control plots was 44.4 µg/g/dry wt. of soil. Across the period of observation a

Texas Tech University, Michael Hyndman, December 2015
15
reduction in DTR through shading increased MBC by 28.9% (Figure 5). Statistical
analysis did not indicate a significant time effect for MBC across the duration of the
experiment irrespective of the treatments (Table 1). There was also no significant
interaction of time and treatment on MBC indicating that manipulation of DTR did not
alter the pattern of microbial biomass response to environmental control on the basis
of each individual sampling period. The between-subjects effects for treatment did
find a significant higher level of MBC in the reduced DTR plots compared with the
controls with all dates combined (Table 1).
FungiLog The slope of linear line of best fit from the origin of a five day fungal
enzymatic substrate activity array ranged from a low of 0.1931 for the control plots
sampled in November 2013 to a high of 0.2741 for the March 2013 sample period
(Figure 6). For the reduced DTR plots, the lowest value for the slope of a linear line
of best fit from the origin of a five day enzymatic substrate activity array was 0.3371
during the March 2013 sampling period with the highest slope of 0.3811 occurring
during the November 2013 sampling period. Seasonal variability for both the reduced
DTR plots and the control plots was not observed, however during the November
2013 observation period there was a dramatic reduction in the slope of a line of best fit
for FungiLog substrate activity of the control plots compared to the activity of the
reduced DTR plots for that same time.
The average slope of a line of best fit for fungal enzymatic substrate activity
for the control plots was 0.245 and 0.358 for the reduced DTR plots, an average
difference of 32% between the two groups (Figure 6). These differences indicate that

Texas Tech University, Michael Hyndman, December 2015
16
the rate of substrate activity (slope of the line) was higher for the reduced DTR plots
even though soil moisture was slightly lower as a consequence of treatment. The
Repeated Measures ANOVA did not indicate a significant time effect on the slope of
fungal substrate activity across the sampling dates irrespective of treatment; there was
also no significant interaction of time and treatment. Test of between-subjects effect
did find a significant difference between the control plots and reduced DTR plots over
the course of the observations combined (Table 1).
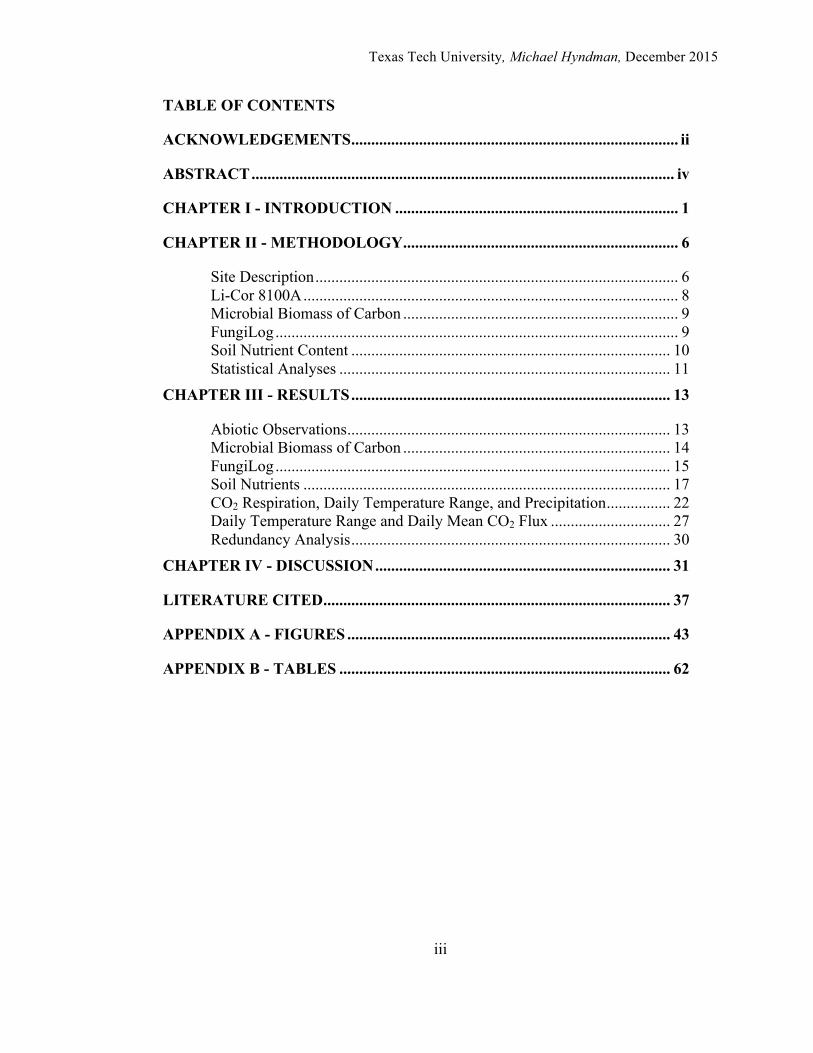
The slope of the linear line of best fit from the origin over the five day
assessment of fungal substrate richness for the control plots ranged from a low of
0.3874 for the control plots sampled in November 2013 to a high of 0.6040 for the
July 2013 sample period (Figure 7). For the reduced DTR plots, the lowest value for
the slope of a linear line of best fit from the origin over the five day assessment of
fungal substrate richness array was 0.5542 during the March 2013 sampling period
with the highest slope of 0.7139 occurring during the July 2013 sampling period.
Seasonal values of the mean slope for fungal enzymatic substrate richness were
increased in the reduced DTR plots in December 2012 and November 2013 when
compared to the mean slopes for fungal enzymatic substrate richness of the control
plots. The steeper slopes for the reduced DTR plots indicated that soil fungi in these
plots were using a increasing greater number of substrates over the five day period as
compared with the control plots.
The average slope of a line of best fit for fungal enzymatic substrate richness
for the control plots was 0.473 and 0.633 for the reduced DTR plots, an average
difference of 26% between the two groups (Figure 7). Statistical analysis did not

Texas Tech University, Michael Hyndman, December 2015
17
indicate a significant time effect on the slope of fungal enzymatic substrate richness
across the sampling dates irrespective of treatment and there was no interaction of
time and treatment on the slope of fungal enzymatic substrate richness indicating that
the reduction of DTR did not alter the abiotic or biotic factors that regulate fungal
enzymatic substrate richness (Table 1). Test of between-subjects effect did find a
significant difference between the control plots and reduced DTR plots over the course
of the observations combined.
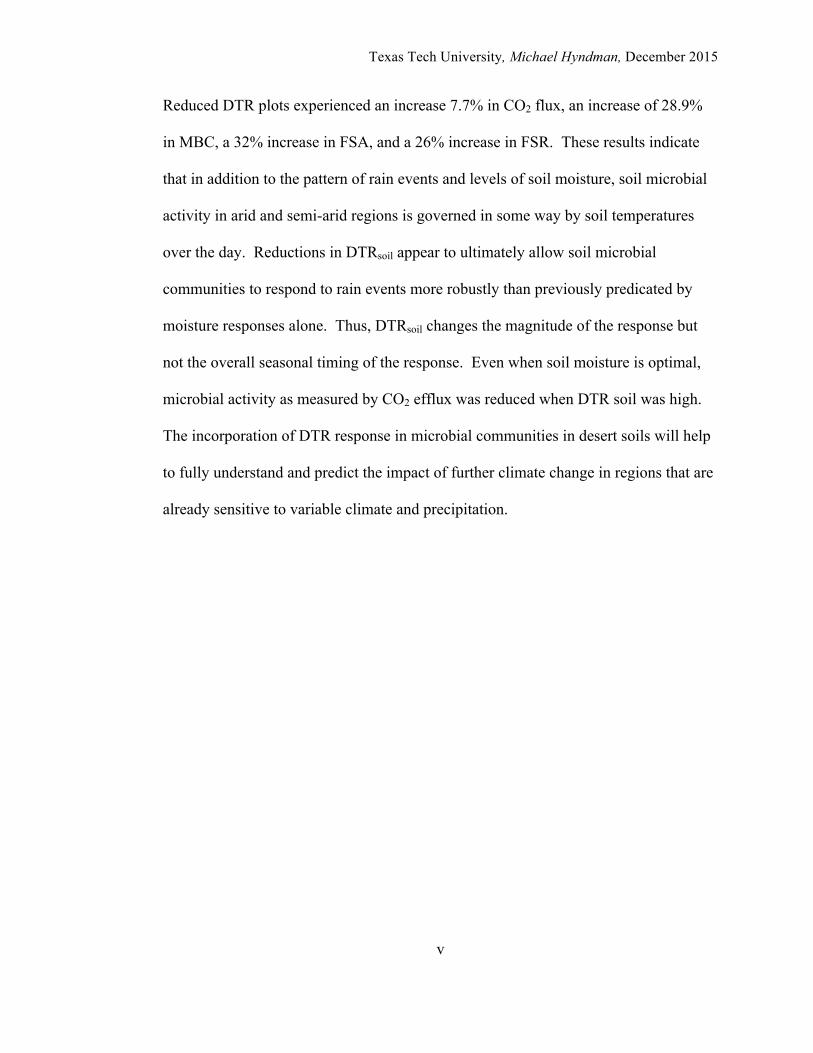
Soil Nutrients Extractable soil ammonia (NH4-N) levels ranged from a low of 1.74 mg/kg dry
wt. of soil for the control plots sampled in March 2013 to a high of 2.98 mg/kg dry wt.
of soil for the December 2013 sample period (Figure 8). For the reduced DTR plots
the lowest NH4-N levels of 1.16 mg/kg dry wt. of soil was observed during the July
2013 sample period. The highest average level (3.29 mg/kg dry wt. of soil) was
obtained during the December 2013. Levels of extractable soil NH4-N did not show
much seasonal variability for the reduced DTR and the control plots for the November
2012, December 2012-2013, and March 2013 sampling periods. During the July 2013
sampling period variability increased for the control plots dramatically, while the
reduced DTR plots stayed relatively similar to what was observed for the other sample
dates. In December of 2013 both the reduced DTR and control plots had their highest
observed values of extractable soil NH4-N during the entire experiment with similar
variability in both groups.
The average level of extractable soil NH4-N for the reduced DTR plots across
all samples dates was 1.95 mg/kg dry wt. of soil while the average level of extractable

Texas Tech University, Michael Hyndman, December 2015
18
soil NH4-N for the control plots was 2.05 mg/kg dry wt. of soil (Figure 8). The
Repeated Measures ANOVA indicated a significant time effect on extractable soil
NH4-N across the sampling dates irrespective of treatment (Table 1). Post-hoc Tukey
analysis showed two homogeneous subsets of sample dates for extractable soil NH4-N,
with the November 2012, December 2012, March 2013, and July 2013 as one subset
(p = 0.245) and the December 2013 sample period as the second subset (p = 1.000)
(Table 2). There was no significant interaction of time and treatment on extractable
soil NH4-N levels indicating that the reduction of DTR did not alter how abiotic or
biotic factors regulate extractable soil NH4-N pool sizes. Nor was there a significant
between-subjects effect between the reduced DTR plots and the control plots with all
dates combined (Table 1).
Extractable levels of soil nitrate (NO3-N) ranged from a low of 3.36 mg/kg dry
wt. of soil for the control plots sampled in December 2013 to a high of 5.99 mg/kg dry
wt. of soil for the July 2013 sample period (Figure 9). For the reduced DTR plots the
lowest average level NO3-N of 2.74 mg/kg dry wt. of soil, was observed in December
2013. The highest average level, for the reduced DTR treatment, 8.64 mg/kg dry wt.
of soil, was found for the March 2013 sample period. The level of extractable soil
NO3-N in the reduced DTR plots was much greater than the levels in the control plots
during the November 2012 sampling period and much less than the control plots
during the March 2013 sampling period. The seasonal variability of extractable soil
NO3-N remained consistent during the November 2012, December 2012, and March
2013 sampling periods. During the July 2013 sampling period the variability of

Texas Tech University, Michael Hyndman, December 2015
19
extractable soil NO3-N increased and then decreased to its lowest level during the
December 2013 sampling period.
Across all sample dates the average level of extractable NO3-N for the control
plots was 5.12 mg/kg dry wt. of soil and 5.43 mg/kg dry wt. of soil for the reduced
DTR plots, with an average difference of 6% between the two groups over the
duration of the experiment (Figure 9). Statistical analysis did not indicate a significant
time effect on extractable soil NO3-N across the sampling dates irrespective of
treatment, no significant interaction of time and treatment, nor was there a difference
between the two treatments across all dates combined (Table 1).
Extractable soil phosphorus (P) ranged from a low of 43.5 mg/kg dry wt. of
soil for the control plots sampled in December 2012 to a high of 54.3 mg/kg dry wt. of
soil for the July 2013 sample period (Figure 10). For the reduced DTR plots the
lowest average level of P was 44.0 mg/kg dry wt. of soil during the November 2012
sample period and reached its highest level of 53.0 mg/kg dry wt. of soil on the
December 2013 sample period. Soil P levels did not show any seasonal variability
during the observation period of the experiment between the control treatment and the
reduced DTR treatment.
Across all sample dates the average level of soil P was 48.95 mg/kg dry wt. of
soil for the control plots and 47.95 mg/kg dry wt. of soil for the reduced DTR plots,
with an average difference of 5% between the two groups over the period of the
experiment (Figure 10). The Repeated Measures ANOVA did not indicate a
significant time effect on extractable soil P across the sampling dates irrespective of

Texas Tech University, Michael Hyndman, December 2015
20
treatment, no significant interaction of time and treatment, and no significant effect of
treatment across all sampling dates (Table 1).
Extractable soil potassium (K) ranged from a low of 593.5 mg/kg dry wt. of
soil for the control plots sampled in December 2013 to a high of 690.3 mg/kg dry wt.
of soil during the November 2012 sample period (Figure 11). For the reduced DTR
plots the lowest average level of K was 543.3 mg/kg dry wt. of soil in November 2012
and the highest level of K was 604.5 mg/kg dry wt. of soil during the March 2013
sampling period. Soil K levels for the control and the reduced DTR treatments did not
show any seasonal variability during the experimental period, except for the first
observation during November 2012 when the average level of soil K for the control
plots was 22% greater than the reduced DTR treatment group.
Across all sample dates the average level of soil K was 636.0 mg/kg dry wt. of
soil for the control plots and 582.4 mg/kg dry wt. of soil for the reduced DTR
treatment group, with an average difference of 9% between the two groups over the
period of the experiment (Figure 11). Statistical analysis did not indicate a significant
time effect on extractable soil K across the sampling dates irrespective of treatment,
no significant interaction of time and treatment, and no significant between-subjects
effect with all sampling dates combined (Table 1).
Soil pH ranged from a low of 7.83 for the control plots sampled in July 2013
and December 2013 and a high of 8.23 during the December 2012 sample period
(Figure 12). For the reduced DTR plots the lowest average pH level of 7.83 for March
2013 and a high of 8.1 for the December 2012 sampling period. Soil pH levels for the
control and the reduced DTR treatments did not show any seasonal variability during

Texas Tech University, Michael Hyndman, December 2015
21
the observational period and remained fairly consistent for most of the experiment
except for a slight increase in both treatment groups during the winter of 2012.
Across all sample dates the average soil pH for the control plots was 7.97 and
7.92 for the reduced DTR treatment plots, with an average difference of 1% between
the two groups over the period of the experiment (Figure 12). Statistical analysis did
not indicate a significant time effect on soil pH across the sampling dates irrespective
of treatment, no significant interaction of time and treatment, and no significant
between-subjects effect with all sampling dates combined (Table 1).
Soil organic matter (SOM) (%) ranged from a low of 0.65% for the control
plots sampled in December 2013 and a high of 1.03% during the July 2013 sample
period (Figure 13). For the reduced DTR plots the lowest average of 0.62% in
December 2013 and a high of 0.97% at the March 2013. SOM levels for both the
control and reduced DTR plots did not exhibit any seasonal variability during the
course of the experiment except for the last sampling date in December 2013 where
both experimental groups experienced a sharp reduction in percent SOM levels.
Across all sample dates the average SOM level for control plots was 0.892%
and 0.847% for the reduced DTR plots, with an average difference of 6% between the
two groups over the course of the experiment (Figure 13). The Repeated Measures
ANOVA did indicate a significant time effect on percent SOM levels across the
sampling dates irrespective of treatment (Table 1). Post-hoc Tukey analysis showed
two homogeneous subsets of sample dates for SOM, with the November 2012,
December 2012, March 2013, and July 2013 as one subset (p = 0.431) and the
December 2013 sample period as the second subset (p = 1.000) (Table 2). There was

Texas Tech University, Michael Hyndman, December 2015
22
no significant interaction of time and treatment on percent SOM levels indicating that
the reduction of DTR did not alter abiotic and biotic factors that influence SOM.
There was also no significant difference between treatments irrespective of sampling
date.
CO2 Respiration, Daily Temperature Range, and Precipitation Across all of the observational periods the total difference of soil surface
carbon dioxide flux between the reduced DTR treatment and the control treatment
plots was 1.44 mmol/m2/s. Considering all observations of temperature, the solar
shading treatments plots experienced an average reduction of 1.58 °C over all of the
temperature recordings, an average reduction of 8.16% for the reduced DTR
treatments. The first period of observations monitoring the soil surface carbon dioxide
flux (CO2 flux), surface daily temperature range (DTR), and daily total precipitation
started on November 4th, 2012 and ended on December 9th, 2012. For the reduced
DTR plots, the average DTR was 17.94 °C with the largest DTR occurring on
December 2nd, 2012 at 24.56 °C and the smallest DTR of 8.91 °C on November 23rd,
2012 (Figure 14). The control plots had an average DTR of 19.85 °C, with the largest
DTR occurring on December 2nd, 2012 at 26.58 °C and the smallest DTR of 10.28 °C
on November 23rd, 2012. Across the observation period for this time there was a 10%
difference between the control DTR and the reduced DTR plots. During this time a
total of 3.81 mm of precipitation was recorded for the area with the most rainfall
occurring on November 22nd, 2012.
The daily mean CO2 flux of the reduced DTR plots ranged from a low of -
0.0488 mmol/m2/s on November 27th, 2012 to a high of 0.1608 mmol/m2/s on

Texas Tech University, Michael Hyndman, December 2015
23
November 4th, 2012 (Figure 14). For the control plots, the CO2 flux ranged from a
low of -0.1179 mmol/m2/s on November 12th, 2012 and a high of 0.1358 mmol/m2/s
on November 22nd, 2012. Average daily CO2 flux for the reduced DTR plots during
this time was 0.0760 mmol/m2/s and 0.0342 mmol/m2/s for the control plots, with an
average difference of 55% during the observation period.
The next observations on soil surface CO2 flux, DTR, and daily total
precipitation started on January 20th, 2013 and ended on January 29th, 2013. The
reduced DTR plots had an average DTR of 19.99 °C with the largest DTR occurring
on January 24th, 2013 at 22.66 °C and the smallest DTR of 13.65 °C on January 29th,
2013 (Figure 15). The control plots had an average DTR of 21.84 °C, with the largest
DTR occurring on January 24th, 2013 at 24.64 °C and the smallest DTR of 14.74 °C
on January 29th, 2013. Across the observation period for this time there was an 8.5%
difference between the control DTR and the reduced DTR plots. During this time
there was no precipitation recorded.
The daily mean CO2 flux for the reduced DTR plots ranged from a low of
0.126 mmol/m2/s on January 20th, 2013 to a high of 0.2044 mmol/m2/s on January
26th, 2013 (Figure 15). For the control plots, the CO2 flux ranged from a low of
0.0843 mmol/m2/s on January 21st, 2013 and a high of 0.174 mmol/m2/s on January
26th, 2013. Average daily CO2 flux for the reduced DTR plots during this time was
0.1633 mmol/m2/s and 0.1067 mmol/m2/s for the control plots, with an average
difference of 34.7% during the observation period.
The April 2013 observations on soil surface CO2 flux, DTR, and daily total
precipitation started April 4th, 2013 and ended on April 23rd, 2013. The reduced DTR

Texas Tech University, Michael Hyndman, December 2015
24
plots had an average DTR of 22.98 °C with the largest DTR occurring on April 22nd,
2013 at 29.34 °C and the smallest DTR of 11.78 °C on April 18th, 2013 (Figure 16).
The control plots had an average DTR of 24.82 °C, with the largest DTR occurring on
April 16th 2013 at 31.58 °C and the smallest DTR of 13.48 °C on April 18th, 2013.
Across the observation period for this time, there was a 7.40% difference between the
control DTR and the reduced DTR plots. There was only one day of recorded
precipitation of 1.27 mm on April 14th, 2013.
The daily mean CO2 flux for the reduced DTR plots ranged from a low of
0.0497 mmol/m2/s on April 21st, 2013 to a high of 0.1724 mmol/m2/s on April 14th,
2013 (Figure 16). For the control plots, the CO2 flux ranged from a low of 0.1181
mmol/m2/s on April 19th, 2013 to a high of 0.2351 mmol/m2/s on April 22nd, 2013.
Average daily CO2 flux for the reduced DTR plots during this time was 0.115
mmol/m2/s and 0.1855 mmol/m2/s for the control plots, with an average difference of
39.9% during the observation period.
The observations that started on May 12th, 2013 and ended on June 7th, 2013
had an average DTR for the reduced DTR plots of 14.85 °C with the largest DTR
occurring on May 25th, 2013 at 28.09 °C and the smallest DTR of 0.54 °C on July 6th,
2013 (Figure 17). The control plots had an average DTR of 15.68 °C, with the largest
DTR occurring on May 25th, 2013 at 28.38 °C and the smallest DTR of 0.23 °C on
July 6th, 2013. Across the observation period for this time, there was a 5.30%
difference between control DTR and the reduced DTR plots. There was a total of
14.99 mm of precipitation for this time, with the largest rainfall event occurring on
May 15th, 2013.

Texas Tech University, Michael Hyndman, December 2015
25
The daily mean CO2 flux for the reduced DTR plots ranged from a low of -
0.0026 mmol/m2/s on June 2nd, 2013 to a high of 0.1948 mmol/m2/s on May 24th, 2013
(Figure 17). For the control plots, the CO2 flux ranged from a low of -0.016
mmol/m2/s on May 20th, 2013 to a high of 0.4335 mmol/m2/s on May 14th, 2013.
Average daily CO2 flux for the reduced DTR plots during this time was 0.0530
mmol/m2/s and 0.0782 mmol/m2/s for the control plots, with an average difference of
32.3% during the observation period.
The observations that started on July 21st, 2013 and ended on August 9th, 2013
had an average DTR for the reduced DTR plots of 18.66 °C, with the largest DTR
occurring on August 6th, 2013 at 22.78 °C and the smallest DTR of 12.68 °C on July
21st, 2013 (Figure 18). The control plots had an average DTR of 20.56 °C, with the
largest DTR occurring on August 6th, 2013 at 25.55 °C and the smallest DTR of 14.42
°C on July 21st, 2013. Across the observation period, there was a 9.22% difference
between the control DTR and the reduced DTR plots. There was a total of 39.12 mm
of precipitation for this time, with the largest rainfall event occurring on July 27th,
2013.
The daily mean CO2 flux for the reduced DTR plots ranged from a low of
0.0583 mmol/m2/s on July 25th, 2013 to a high of 0.2684 mmol/m2/s on August 7th,
2013 (Figure 18). For the control plots, the CO2 flux ranged from a low of 0.0523
mmol/m2/s on July 24th, 2013 to a high of 0.3996 mmol/m2/s on August 7th, 2013.
Average daily CO2 flux for the reduced DTR plots during this time was 0.1055
mmol/m2/s and 0.1687 mmol/m2/s for the control plots, with an average difference of
37.5% during the observation period.

Texas Tech University, Michael Hyndman, December 2015
26
The next observations started on August 14th, 2013 and ended on August 18th,
2013. The reduced DTR plots had an average DTR of 19.15 °C with the largest DTR
of 21.04 °C on August 16th, 2013 and the smallest DTR of 17.51 °C on August 15th,
2013 (Figure 19). The average DTR for the control plots was 20.72 °C with the
greatest DTR of 22.92 °C on August 16th, 2013 and the smallest DTR of 18.78 °C on
August 14th, 2013. Across the observational period, there was a 7.56% difference
between the control DTR and the reduced DTR plots. There was no precipitation
recorded during this time.
The daily mean CO2 flux for the reduced DTR plots ranged from a low of
0.3446 mmol/m2/s on August 16th, 2013 to a high of 0.4327 mmol/m2/s on August
14th, 2013 (Figure 19). For the control plots, the CO2 flux ranged from a low of
0.3898 mmol/m2/s on August 17th, 2013 to a high of 0.4909 mmol/m2/s on August
14th, 2013. Average daily CO2 flux for the reduced DTR plots during this time was
0.3759 mmol/m2/s and 0.4273 mmol/m2/s for the control plots, with an average
difference of 12.1% during the observation period.
The last observation period started on September 15th, 2013 and ended on
September 17th, 2013. The reduced DTR plots had an average DTR of 11.22 °C with
the largest DTR of 16.18 °C on September 15th, 2013 and the smallest DTR of 8.42 °C
on September 17th, 2013 (Figure 20). The average DTR for the control plots was
12.23 °C with the largest DTR of 16.80 °C on September 15th, 2013 and the smallest
DTR of 9.66 °C on September 17th, 2013. Across the observational period, there was
a 8.24% difference between the control DTR and the reduced DTR plots. There was
0.51 mm of precipitation on September 17th, 2013.

Texas Tech University, Michael Hyndman, December 2015
27
The daily mean CO2 flux for the reduced DTR plots ranged from a low of
0.1467 mmol/m2/s on September 16th, 2013 to a high of 0.2256 mmol/m2/s on
September 15th, 2013 (Figure 20). For the control plots, the CO2 flux ranged from a
low of 0.1317 mmol/m2/s on September 17th, 2013 to a high of 0.2271 mmol/m2/s on
September 15th, 2013. Average daily CO2 flux for the reduced DTR plots during this
time was 0.1896 mmol/m2/s and 0.1746 mmol/m2/s for the control plots, with an
average difference of 7.8% during the observation period.
Daily Temperature Range and Daily Mean CO2 Flux Seasonal daily temperature range (DTR) from the Li-Cor 8100A Infrared Gas
Analysis soil surface monitoring chambers and the daily mean CO2 flux for both the
reduced DTR plots and the unaltered control plots were plotted together to examine
how CO2 flux across all data collections was influenced by DTRsoil. A quadratic line
of best fit was calculated for the reduced DTR plots and the control plots and an r-
squared (r2) and p-values calculated to describe how close to the line of best fit the
individual values were in relation to that line. I used the quadratic line of best fit as it
appeared to fit the assumption that CO2 flux values would reduced with low and high
DTR and because it had a greater r2 value than linear and exponential lines of best fit.
The DTRsoil and CO2 flux were evaluated by season to better understand the
magnitude of the relationship.
The fall 2012 observations were recorded from the beginning of the
experiment on November 4th, 2012 and ended on December 9th, 2012. The average
DTR was 17.94 °C for the reduced DTR plots and 19.85 °C for the control plots

Texas Tech University, Michael Hyndman, December 2015
28
(Figure 21). The average daily mean CO2 flux was 0.0758 mmol/m2/s for the reduced
DTR plots and 0.0342 mmol/m2/s for the control plots. A quadratic line was the best
fit for the relationship for both the reduced DTRsoil and control plots. For the reduced
DTR plots peak CO2 flux occurred around a max DTR of 15-17 ºC. With higher
DTR, CO2 flux declined. For the control plots, the highest CO2 flux occurred with a
DTRsoil range of 16-20 °C. The peak level of activity where DTR was favorable for
soil CO2 flux with the line for the reduced DTR plots was located higher up along the
y-axis and closer to the zero coordinate on the x-axis when compared to the control
plot. However the trend line analysis indicated that for the fall period there was not a
strong relationship was not (r2 = 0.0531, p = 0.407) for the control and (r2 = 0.0736, p
= 0.283) for the reduced DTRsoil plots.
The winter 2012-2013 observations were recorded from January 20th, 2013 to
January 29th, 2013. The average DTR was 19.99 °C for the reduced DTR plots and
21.84 °C for the control plots (Figure 22). The average daily mean CO2 flux was
0.1633 mmol/m2/s for the reduced DTR plots and 0.1067 mmol/m2/s for the control
plots. The quadratic line of best fit for each treatment plot indicated a peak level of
activity where DTR was favorable for soil CO2 flux with the line for the reduced DTR
plots (r2 = 0.1118, p = 0.661) located higher up along the y-axis and closer to the zero
coordinate on the x-axis when compared to the control plot (r2 = 0.197, p = 0.646).
The trend line for the Reduced DTRsoil plots indicated that during the winter period
CO2 flux peaked at a max DTRsoil around 18 ºC and 20 ºC for the control plots. In
both treatments higher DTRsoil was associated with lower CO2 flux.

Texas Tech University, Michael Hyndman, December 2015
29
The spring 2013 observations were recorded from April 14th, 2013 to June 7th,
2013. The average DTR was 17.05 °C for the reduced DTR plots and 18.15 °C for the
control plots (Figure 23). The average daily mean CO2 flux was 0.0688 mmol/m2/s
for the reduced DTR plots and 0.1073 mmol/m2/s for the control plots. The quadratic
line of best fit for each control plot indicated a larger increase of CO2 flux as DTR
increases for the treatment plots (r2 = 0.4531, p = <0.0001) when compared to the
reduced DTR plots (r2 = 0.3311, p = 0.001) as CO2 flux values did not reach the same
levels during this observation period. For the control plots in 2013, the trend line
indicated that CO2 flux in the spring increased as DTR increased.
The summer 2013 observations were recorded from July 21st, 2013 to
September 17th, 2013. The average DTR was 17.95 °C for the reduced DTR plots and
19.70 °C for the control plots (Figure 24). The average daily mean CO2 flux was
0.4133 mmol/m2/s for the reduced DTR plots and 0.3886 mmol/m2/s for the control
plots. The quadratic line of best fit for each treatment plot indicated an increase in
CO2 flux values as DTR increased, but there is a drop off in soil respiration
documented for the control plots at the largest values of DTR (r2 = 0.2974, p = 0.012).
The reduced DTR plots experienced the same extreme DTR values as the control plot
(r2 = 0.1376, p = 0.157). For the control plots, DTR peaked at a DTR of 20 to 23 ºC
and then declined with higher DTR levels. Within the Reduced DTRsoil plots during
the summer of 2013, DTR increased initially and then dropped off with higher levels
of DTR at around 17 to 19 °C.

Texas Tech University, Michael Hyndman, December 2015
30
Redundancy Analysis The Redundancy Analysis (RDA) indicated that CO2 flux and extractable
levels of NO3-N during the summer were related to changes in DTR (Figure 25).
Moreover, the overall responses of the control plots were directly opposite of the
shade plots indicating that a reduction in DTR did alter microbial responses.
Microbial Biomass Carbon was highly related to conditions in the Reduced DTR plots
with one the longest vectors in the analysis. Soil NH4-N levels were also related to
MBC levels and Reduced DTR plot conditions but not strongly. Control plot
responses for microbial and nutrient dynamics were related primarily to soil moisture
in the winter and spring.

Texas Tech University, Michael Hyndman, December 2015
31
CHAPTER IV - DISCUSSION In support of the first hypothesis, I found that a reduction in daily temperature
range of the soil (DTRsoil) had a positive effect on soil respiration during the summer.
I also found that across the observational timeframe of the experiment, the total CO2
flux from the reduced DTRsoil treatments was greater than the total CO2 flux of the
unaltered control plots by 7.7% (Figure 26). This pattern supports the hypothesis that
temperature induced metabolic stress by way of large variability of daily soil
temperatures may impact the ability of microorganisms to carry out decomposition
and mineralization through production exo-enzymes. The increased metabolic activity
under reduced DTRsoil which contribute to the increased soil CO2 flux observed in this
study. Previous studies have shown a relationship between environmental stress in
response to temperatures and subsequent metabolic activities (Petersen & Klug, 1994;
Zogg et al., 1997).
The observed increased soil respiration should also be in response to increased
microbial biomass production under the less stressful DTRsoil conditions. Support of
the second hypothesis where an increase in soil respiration should be accompanied by
an increase in microbial biomass of carbon (MBC) was supported using Redundancy
Analysis (RDA). The average amount of MBC across the year was increased in the
reduced DTR plots when compared to the MBC of the control plots by 28.9%. Van
Gestel (2011) also showed a similar increase in MBC with a reduction in DTRsoil at
the same location. Recently van Gestel et al (2015) reported that MBC responses to
changes in DTRsoil were seasonal with the greatest response in the summer than in the
other seasons.

Texas Tech University, Michael Hyndman, December 2015
32
It is also important to consider the precipitation patterns during this time as
biological activity is typically water limited in arid ecosystems (Reynolds et al., 2004;
Bell et al., 2008; Collins et al., 2008). However the response to these rainfall events
may be magnified with less variable temperature ranges. Direct evidence to this
proposed pattern can be seen in Figure 17 where following a precipitation event where
antecedent soil moisture conditions were favorable, the reduced DTR plots responded
with a greater magnitude of CO2 production when compared to the control group.
Other parameters like MBC, fungal substrate activity, fungal substrate richness both
showed greater responses from the reduced DTR plots. Another example of this
pattern was observed on September 17th, 2013, where following a rain event soil CO2
flux responded sooner than the control plots. Further support for this magnifying in
the seasonal response to reduced DTR in the summer as the RDA shows that the
predicting variable of DTR influences CO2 flux and corresponds with the summer
sampling period.
Increased soil respiration was also found to accompany increased enzyme
production in soil fungal communities during the summer as fungal substrate activity
and substrate richness increased in the reduced DTRsoil treatments. By reducing
DTRsoil the subsequent reduction in temperature-related metabolic stress could have
allowed the soil fungal community produces greater amounts and varieties of exo-
enymes. The increased fungal substrate activity and substrate richness could have also
resulted from a change in fungal species composition. Bell et al (2009) had shown
that fungal activity in a Sotal-Grassland at Big Bend National Park was regulated by
soil temperatures rather than by soil moisture.

Texas Tech University, Michael Hyndman, December 2015
33
This study found that extractable NH4-N levels were lower in the reduced DTR
plots compared to the control plots in the summer while previously; van Gestel et al
had also shown an 18% reduction in NH4-N only for one year. There was also a
difference in extractable NH4-N levels in December 2013 compared to the sampling
dates that occurred during the first portion of the experiment. Unlike the van Gestel
results earlier for the same site the current study did not find any changes in soil levels
of extractable NO3-N, while they had shown a 16% reduction in extractable soil NO3-
N with a reduction in DTRsoil. Van Gestel et al (2015) also recently reported no long-
term positive or negative trends in extractable NO3-N in response to decreased DTRsoil
for the period 2009 to 2013 at the same location in Big Bend despite increases in
microbial biomass carbon and microbial biomass nitrogen. Differences in seasonal
moisture patterns and total amount of moisture received could account for the
differences observed across years at this creosotebush bajada site in the Chihuahuan
Desert at Big Bend National Park. The period over which this study was conducted
had below average rainfall.
As the magnitude of DTRsoil is not uniform across the growing season (van
Gestel et al., 2015) and as microbial activity is water regulated one would expect that
soil respiration and DTRsoil should exhibit a relationship that is linked to seasonal
moisture and temperature patterns. During the spring, reduced DTRsoil plots did have
an increased CO2 flux values when compared to the control plots but MBC, fungal
substrate activity and substrate richness levels, and soil nutrient levels remained
similar to each other. The higher CO2 flux in the DTR plots and not similar increases
in MBC in the spring suggests that differences in carbon use efficiency or the bacterial

Texas Tech University, Michael Hyndman, December 2015
34
fungal ratio could account for this response. How temperature or moisture impacts
microbial carbon use efficiency is not well understood (Allison et al., 2010; Dijkstra et
al., 2011), however as Bell et al (2009) had previously shown that soil fungi in a
Chihuahuan Desert Sotal-Grassland in Big Bend respond to cooler soil temperatures,
the higher CO2 flux with reduced DTR without attendant changes in MBC might
simply reflect a greater metabolic activity of the soil fungal mycelium that was
currently present.
This study indicates that reducing DTRsoil does increases the total enzymatic
activity and richness of soil fungi in desert soils as the slopes of FungiLog substrate
activity and substrate richness were steeper in the reduced DTR plots versus soils
under ambient conditions. This relationship between reduced DTR and soil fungal
enzymatic activity could contribute to an increase in nutrient immobilization in desert
soils, as seen with the reduction of extractable soil ammonia in reduced DTR plots. If
reduction of temperature variability occurs with adequate pulses of precipitation, this
temperature trend could have a magnifying effect on the activation of dormant soil
communities (Nielsen & Ball, 2014). In turn, this amplification of precipitation pulse
response with optimum DTR could increase soil respiration to higher levels than
would be expected for soil moisture responses alone. Considering the work of Bell et
al (2009) and the impact temperature has on fungal populations, further work in
developing models for desert ecosystem functioning and response to climate change
ought to include parameters that account for the role soil fungal communities occupy
in response to soil temperature and the DTR experienced by those soils.

Texas Tech University, Michael Hyndman, December 2015
35
While water availability remains the dominate determinant factor in controlling
soil microbial activity in desert ecosystems (Reynolds et al., 2004; Bell et al., 2008;
Collins et al., 2008), the role of temperature to this point has yet to be fully integrated
into existing models of ecosystem functioning for these arid systems. Daily
temperature range appears to influence desert soil microbial functioning as an
amplifier of rain pulse responses or as a limiting factor to soil microbial response.
Even with ample soil moisture, high DTRsoil will dampen the capability of the soil
microflora to utilize the soil moisture window (Zak et al., 1995) for growth and
function. Moreover, if DTRsoil is low, even small rain events could have a greater
microbial response than predicted by moisture responses alone. The seasonal
responses of MBC and CO2 flux observed in this study indicate that DTRsoil is a
modifier of microbial response to soil moisture in arid ecosystems. The ability of
DTRsoil to enhance or dampen soil CO2 flux from different moisture pulses across the
season could account for the differences observed by Cable et al. (2010) in addressing
temperature responses of soil respiration within seven deserts. Cable et al. (2013)
attributed the differences to antecedent moisture conditions accounting for the
differences. Importantly, Cable et al (2010) found that soil respiration peaked
between 20 to 30 ºC which would suggest that these soil temperatures would also have
the most moderate DTR ranges. As with this study, as soil temperatures increase
above 30 ºC, DTRsoil likewise soil respiration increases significantly.
The relationship between soil temperature range and soil moisture should be
considered in providing accurate models for desert ecosystem functioning as the
predicted influence to ambient temperatures are applied to arid soil management.

Texas Tech University, Michael Hyndman, December 2015
36
Consideration should also be made in regards to the projected precipitation regimes
that are predicted in the 2013 IPCC as reduced frequency and increased intensity of
rain events will impact desert systems in their own manner (IPCC, 2013; Finch &
Collins, 2012; Lioubimtseva & Adams, 2004; Schwinning et al., 2004). Furthermore,
the possibility of being able to tailor desert ecosystem models such as the pulse
paradigm (Ogle & Reynolds, 2004) to the predicted regional average high and average
low temperatures from will provide better guides for land managers and researchers
for understanding soil nutrient cycling and carbon dynamics and soil microbial
dynamics as they impact soil health.

Texas Tech University, Michael Hyndman, December 2015
37
LITERATURE CITED Agehara, S., and D. D. Warncke. "Soil Moisture and Temperature Effects on Nitrogen
Release from Organic Nitrogen Sources." Soil Science Society of America Journal: 2005. Print.
Allen, Michael F., and Michael G. Boosalis. "Effects Of Two Species Of V A
Mycorrhizal Fungi On Drought Tolerance Of Winter Wheat*." New Phytologist 93.1 (1983): 67-76. Print.
Allison, Steven D., Matthew D. Wallenstein, and Mark A. Bradford. "Soil-carbon
Response to Warming Dependent on Microbial Physiology." Nature Geoscience Nature Geosci (2010): 336-40. Print.
Apple, Martha E., Christina I. Thee, Vickie L. Smith-Longozo, Crystal R. Cogar,
Christina E. Wells, and Robert S. Nowak. "Arbuscular Mycorrhizal Colonization of Larrea Tridentata and Ambrosia Dumosa Roots Varies with Precipitation and Season in the Mojave Desert." Symbiosis 39 (2005): Print.
Bardgett, RD. "A Temporal Approach to Linking Aboveground and Belowground
Ecology." Trends in Ecology and Evolution 20 (2005): 634-41. Print. Bell, Colin, Nancy Mcintyre, Stephen Cox, David Tissue, and John Zak. "Soil
Microbial Responses to Temporal Variations of Moisture and Temperature in a Chihuahuan Desert Grassland." Microb Ecol Microbial Ecology (2008): 153-67. Print.
Bell, Colin W., Veronica Acosta-Martinez, Nancy E. Mcintyre, Stephen Cox, David T.
Tissue, and John C. Zak. "Linking Microbial Community Structure and Function to Seasonal Differences in Soil Moisture and Temperature in a Chihuahuan Desert Grassland." Microb Ecol Microbial Ecology (2009): 827-42. Print.
Bond-Lamberty, B. & Thomson, "Temperature-associated increases in the global soil
respiration record." Nature 464, 579-582 (2010). Cable, Jessica M., Kiona Ogle, Richard W. Lucas, Travis E. Huxman, Michael E.
Loik, Stanley D. Smith, David T. Tissue, Brent E. Ewers, Elise Pendall, Jeffrey M. Welker, Therese N. Charlet, Meagan Cleary, Alden Griffith, Robert S. Nowak, Matthew Rogers, Heidi Steltzer, Patrick F. Sullivan, and Natasja C. Van Gestel. " The temperature responses of soil respiration in deserts: a seven desert synthesis" Biogeochemistry (2010).
Cable, Jessica M., Kiona Ogle, Greg A. Barron-Gafford, Lisa P. Bentley, William L.
Cable, Russell L. Scott, David G. Williams, and Travis E. Huxman.

Texas Tech University, Michael Hyndman, December 2015
38
"Antecedent Conditions Influence Soil Respiration Differences in Shrub and Grass Patches." Ecosystems (2013): 1230-247. Print.
Clark, Jeb S., James H. Campbell, Heath Grizzle, Veronica Acosta-Martìnez, and John
C. Zak. "Soil Microbial Community Response to Drought and Precipitation Variability in the Chihuahuan Desert." Microb Ecol Microbial Ecology (2008): 248-60. Print.
Cochran, Rex, and Jerry Rives. "Soil Survey of Big Bend National Park: Part of
Brewster County, Texas." National Agricultural Library (1985): n. pag. Web. Collins, Scott L., Robert L. Sinsabaugh, Chelsea Crenshaw, Laura Green, Andrea
Porras-Alfaro, Martina Stursova, and Lydia H. Zeglin. "Pulse Dynamics and Microbial Processes in Aridland Ecosystems." Journal of Ecology (2008): 413-20. Print.
Conant, Richard T., Michael G. Ryan, Göran I. Ågren, Hannah E. Birge, Eric A.
Davidson, Peter E. Eliasson, Sarah E. Evans, Serita D. Frey, Christian P. Giardina, Francesca M. Hopkins, Riitta Hyvönen, Miko U. F. Kirschbaum, Jocelyn M. Lavallee, Jens Leifeld, William J. Parton, Jessica Megan Steinweg, Matthew D. Wallenstein, J. Å. Martin Wetterstedt, and Mark A. Bradford. "Temperature and Soil Organic Matter Decomposition Rates - Synthesis of Current Knowledge and a Way Forward." Global Change Biology 17.11 (2011): 3392-404. Print.
Dijkstra, Paul, Scott C. Thomas, Paul L. Heinrich, George W. Koch, Egbert Schwartz,
and Bruce A. Hungate. "Effect of Temperature on Metabolic Activity of Intact Microbial Communities: Evidence for Altered Metabolic Pathway Activity but Not for Increased Maintenance Respiration and Reduced Carbon Use Efficiency." Soil Biology and Biochemistry (2011): 2023-031. Print.
Dinerstein, E., Olson, D., Atchley, J., Loucks, C., Contreras-Balderas, S., Abell, R.,
Iñigo, E., Enkerlin E., Williams, C. and G. Castilleja. 2000. Ecoregion-Based Conservation in the Chihuahuan Desert: A Biological Assessment.
Dobranic, J.K., and J. Zak. “A microtiter plate procedure for evaluating fungal
functional diversity.” Mycologia (1999) 91:756-765. Finch, Deborah M., and Colo Collins. Climate Change in Grasslands, Shrublands, and
Deserts of the Interior American West a Review and Needs Assessment. Fort Collins, CO: U.S. Dept. of Agriculture, Forest Service, Rocky Mountain Research Station, 2012. Print.
Gestel, Natasja C., Dylan W. Schwilk, David T. Tissue, and John C. Zak. "Reductions
in Daily Soil Temperature Variability Increase Soil Microbial Biomass C and

Texas Tech University, Michael Hyndman, December 2015
39
Decrease Soil N Availability in the Chihuahuan Desert: Potential Implications for Ecosystem C and N Fluxes." Global Change Biology 17.12 (2011): 3564-576. Print.
Gestel, Natasja C. Van, Nirmala Dhungana, David T. Tissue, and John C. Zak.
"Seasonal Microbial and Nutrient Responses during a 5-year Reduction in the Daily Temperature Range of Soil in a Chihuahuan Desert Ecosystem." Oecologia (2015). Print.
Havstad, Kris, Laura F. Huenneke, and William H. Schlesinger. "Structure and
Function of Chihuahuan Desert Ecosystem." (2006). Print. Hawkes CV, SN Kivin, JD Rocca, V Huguet, MA Thomsen, and KB Suttle. Fungal
responses to precipitation. Global Change Biology. 17: 1637-1645. (2011). Hobbie, SE. "Temperature and Plant Species Control over Litter Decomposition in
Alaskan Tundra." Ecological Monographs 66 (1996): 503-22. Print. IBM Corp. Released 2013. IBM SPSS Statistics for Windows, Version 22.0. Armonk,
NY: IBM Corp. IPCC. Climate Change 2007: The Physical Science Basis. Contribution of Working
Group 1 to the Fourth Assesment Report of the Intergovernmental Panel on Climate Change. Ed. S. Solomon and D. Qin. New York: Cambridge UP, 2007. Print.
IPCC. Climate Change 2013: The Physical Science Basis. Contribution of Working
Group I to the Fifth Assessment Report of the Intergovernmental Panel on Climate Change [Stocker, T.F., D. Qin, G.-K. Plattner, M. Tignor, S.K. Allen, J. Boschung, A. Nauels, Y. Xia, V. Bex and P.M. Midgley (eds.)]. Cambridge University Press, Cambridge, United Kingdom and New York, NY, USA, (2013) 1535 pp, doi:10.1017/CBO9781107415324.
Kemp, Paul R., Joe M. Cornelius, and James F. Reynolds. "A Simple Model For
Predicting Soil Temperatures In Desert Ecosystems1." Soil Science 153.4 (1992): 280???287. Print.
Li-Cor, Inc. "Applications." Why Multiplex? Li-Cor, n.d. Web. 15 Apr. 2013. Lin, DL, JY Xia, and SQ Wan. "Climate Warming and Biomass Accumulation of
Terrestrial Plants: A Meta-analysis." New Phytologist 188 (2010): 187-98. Print.

Texas Tech University, Michael Hyndman, December 2015
40
Lioubimtseva, E., and J. M. Adams. "Possible Implications of Increased Carbon Dioxide Levels and Climate Change for Desert Ecosystems." Environmental Management (2004). Print.
MacDonald, Neil W., Donald R. Zak, and Kurt S. Pregitzer. "Temperature Effects on
Kinetics of Microbial Respiration and Net Nitrogen and Sulfur Mineralization." Soil Science Society of America Journal (1994): 233. Print.
National Park Service. "Average Temperature and Rainfall." National Parks Service.
National Parks Service, 27 Jan. 2013. Web. 31 Jan. 2013. Nielsen, Uffe N., and Becky A. Ball. "Impacts of Altered Precipitation Regimes on
Soil Communities and Biogeochemistry in Arid and Semi-arid Ecosystems." Glob Change Biol Global Change Biology (2014): 1407-421. Print.
Nobel, PS, and GN Geller. "Temperature Modeling of Wet and Dry Desert Soils."
Journal of Ecology 75 (1987): 247-58. Print. Nunan, N., M.A. Morgan, and M. Herlihy. “Ultraviolet absorbance (280nm) of
compounds released from soil during chloroform fumigation as an estimate of the microbial biomass.” Soil Biology & Biochemistry (1998) 30:12 pp. 1599-1603.
Ogle, Kiona, and James F. Reynolds. "Plant Responses to Precipitation in Desert
Ecosystems: Integrating Functional Types, Pulses, Thresholds, and Delays." Oecologia (2004): 282-94. Print.
Olson, D. M. and E. Dinerstein. 1998. The Global 200: A representation approach to
conserving the earth's most biologically valuable ecoregions. Conservation Biology 3:502-512.
Parton, William J. "Predicting Soil Temperatures In A Shortgrass Steppe." Soil
Science 138.2 (1984): Print. Paul, Eldor Alvin. Soil Microbiology, Ecology, and Biochemistry. Amsterdam:
Academic, 2007. Print. Perry, R.A., and David W. Goodall. Introduction. Arid Land Ecosystems: Structure,
Functioning, and Management, Volume 1. Cambridge: Cambridge UP, 1979. 1-3. Print.
Peterson, Soren, and Michael Klug. "Effects of Sieving, Storage, and Incubation
Temperature on the Phospholipid Fatty Acid Profile of a Soil Microbial Community." Appl. Environ. Microbiolgy 60.7 (1994): 2421-430. Print.

Texas Tech University, Michael Hyndman, December 2015
41
Pregitzer, KS, and WH Schlesinger. "Effects of Soil Temperature on Nutrient Uptake." Nutrient Acquisition by Plants: An Ecological Perspective (2005): 277-310. Print.
R Development Core Team (2008). R: A language and environment for statistical
computing. R Foundation for Statistical Computing,Vienna, Austria. ISBN 3-900051-07-0, URL http://www.R-project.org.
Reynolds, James F., Paul R. Kemp, Kiona Ogle, and Roberto J. Fernández.
"Modifying the ‘pulse–reserve’ Paradigm for Deserts of North America: Precipitation Pulses, Soil Water, and Plant Responses." Oecologia (2004): 194-210. Print.
Schwinning, Susan, Osvaldo E. Sala, Michael E. Loik, and James R. Ehleringer.
"Thresholds, Memory, and Seasonality: Understanding Pulse Dynamics in Arid/semi-arid Ecosystems." Oecologia (2004): 191-93. Print.
SigmaPlot Version 11.2. SigmaPlot (Systat Software, San Jose, CA), URL
http://www.sigmaplot.com. Sobek, E., and J. Zak. “A microtiter plate method for evaluating soil fungal functional
diversity.” Mycologia (2003) 95:590-602. Tibbett, M., F. Sanders, J. Cairney, and J. Leake. "Temperature Regulation of
Extracellular Proteases in Ectomycorrhizal Fungi (Hebeloma Spp.) Grown in Axenic Culture." Mycological Research 103.6 (1999): 707-14. Print.
Vance, E.d., P.c. Brookes, and D.s. Jenkinson. "An Extraction Method for Measuring
Soil Microbial Biomass C." Soil Biology and Biochemistry (1987): 703-07. Print.
Vose, RS, DR Easterling, and B. Gleason. "Maximum and Minimum Temperature
Trends for the Globe: An Update through 2004." Geophysical Research Letters 32.L23822 (2005): n. pag. Print.
Wardle, D. A. "Ecological Linkages Between Aboveground and Belowground
Biota." Science 304.5677 (2004): 1629-633. Print. "Climate Big Bend National Park." U.S. Climate Data. Weather Service, 2014. Web. 6
May 2014. Zhou, L., R. E. Dickinson, Y. Tian, R. S. Vose, and Y. Dai. "Impact of Vegetation
Removal and Soil Aridation on Diurnal Temperature Range in a Semiarid Region: Application to the Sahel." Proceedings of the National Academy of Sciences 104.46 (2007): 17937-7942. Print.

Texas Tech University, Michael Hyndman, December 2015
42
Zhou, LM, AG Dai, YJ Dai, and R. Vose. "Spatial Dependence of Diurnal
Temperature Range Trends on Precipitation from 1950 to 2004." Climate Dynamics 32 (2009): 429-40. Print.
Zogg, Gregory P., Donald R. Zak, David B. Ringelberg, David C. White, Neil W.
Macdonald, and Kurt S. Pregitzer. "Compositional and Functional Shifts in Microbial Communities Due to Soil Warming." Soil Science Society of America Journal (1997): 475. Print.

Texas Tech University, Michael Hyndman, December 2015
43
APPENDIX A - FIGURES
Figure 1: The location of the creosotebush bajada site at Rice Tanks (red star) in Big Bend National Park. Map courtesy of the National Parks Services.

Texas Tech University, Michael Hyndman, December 2015
44
Figure 2: Images of the shaded (A) and exposed experimental plots with the Li-Cor 8100A Gas Analyzer and soil monitoring chambers installed (B) at the Rice Tanks site in a creosotebush bajada of the Chihuanhuan Desert in Big Bend National Park. Images courtesy of Natasja van Gestel, 2012.
B
A

Texas Tech University, Michael Hyndman, December 2015
45

Texas Tech University, Michael Hyndman, December 2015
46
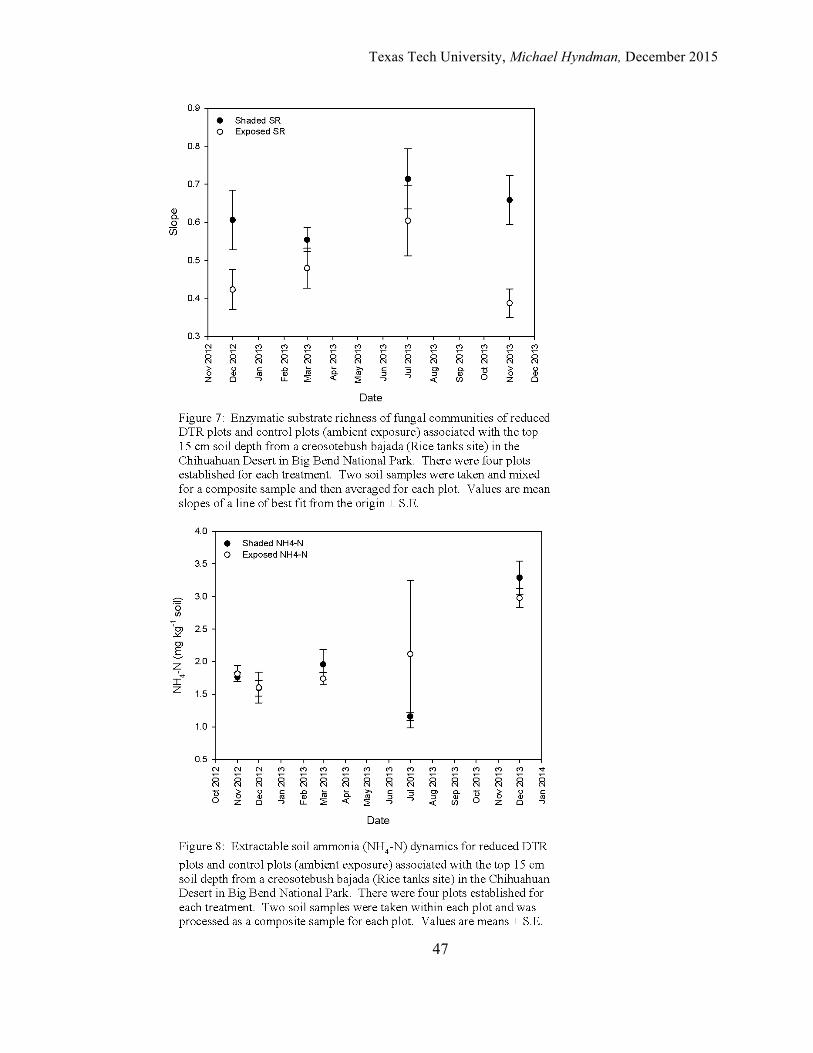
Texas Tech University, Michael Hyndman, December 2015
47

Texas Tech University, Michael Hyndman, December 2015
48

Texas Tech University, Michael Hyndman, December 2015
49

Texas Tech University, Michael Hyndman, December 2015
50
Texas Tech University, Michael Hyndman, December 2015
51

Texas Tech University, Michael Hyndman, December 2015
52

Texas Tech University, Michael Hyndman, December 2015
53

Texas Tech University, Michael Hyndman, December 2015
54

Texas Tech University, Michael Hyndman, December 2015
55

Texas Tech University, Michael Hyndman, December 2015
56

Texas Tech University, Michael Hyndman, December 2015
57

Texas Tech University, Michael Hyndman, December 2015
58

Texas Tech University, Michael Hyndman, December 2015
59

Texas Tech University, Michael Hyndman, December 2015
60
Figure 25: Redundancy analysis bi-plot for soil microbial and nutrient dynamic responses to control and reduced DTR conditions established in a creosotebush bajada from the Rice Tanks site in the Chihuahuan Desert in Big Bend National Park. The discrete predictors (blue arrows) are dtr (Daily Temperature Range - determined by taking the daily mean temperature range for the five days following sampling) and vwc (volumetric water content) associated with the reduced DTR (shade) and ambient DTR (control) over three seasons (winter, spring, and summer). The response variables indicated with the solid black arrows are Microbial Biomass Carbon (mbc), mean daily carbon dioxide soil flux (co2flux), extractable soil ammonia (NH4-N), and extractable soil nitrate (NO3-N). The angle and direction of the arrows indicates the status of the relationship between the variables and the explanatory variables. Arrows in the same direction indicate a positive relationship, opposite direction indicate a negative relationships and arrows at right angles no relationship. The strength of the relationship is indicated by the arrow length.

Texas Tech University, Michael Hyndman, December 2015
61
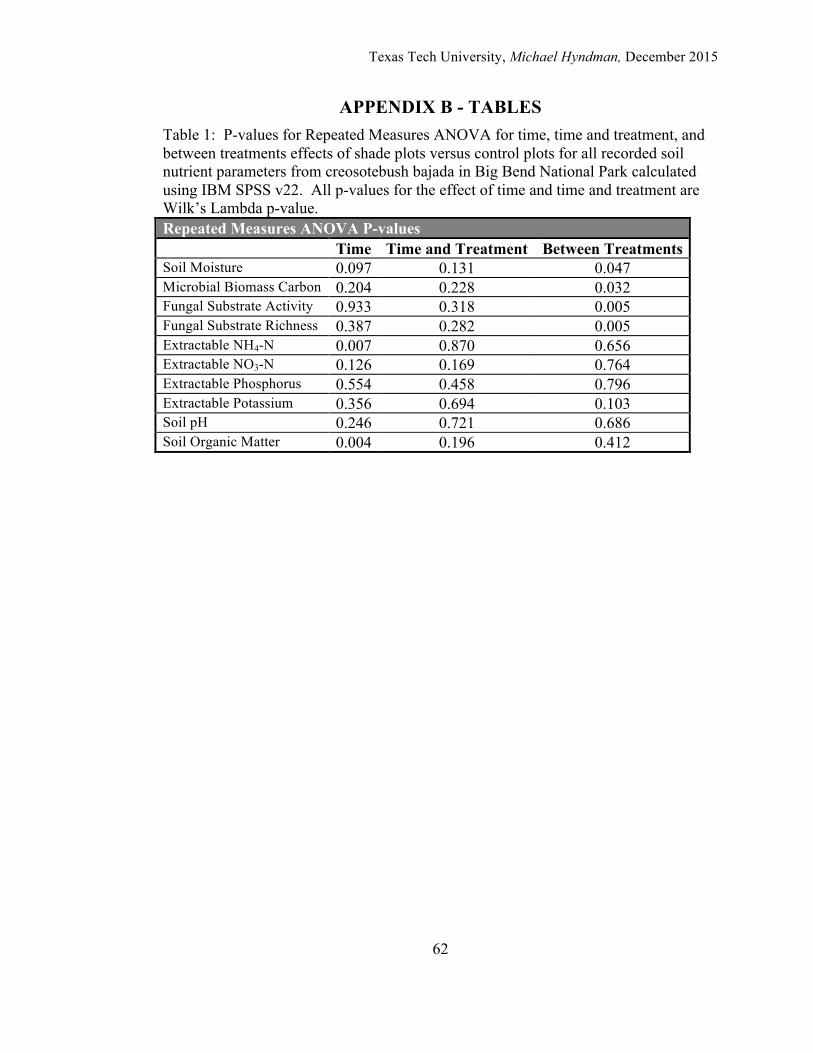
Texas Tech University, Michael Hyndman, December 2015
62
APPENDIX B - TABLES Table 1: P-values for Repeated Measures ANOVA for time, time and treatment, and between treatments effects of shade plots versus control plots for all recorded soil nutrient parameters from creosotebush bajada in Big Bend National Park calculated using IBM SPSS v22. All p-values for the effect of time and time and treatment are Wilk’s Lambda p-value. Repeated Measures ANOVA P-values Time Time and Treatment Between Treatments Soil Moisture 0.097 0.131 0.047 Microbial Biomass Carbon 0.204 0.228 0.032 Fungal Substrate Activity 0.933 0.318 0.005 Fungal Substrate Richness 0.387 0.282 0.005 Extractable NH4-N 0.007 0.870 0.656 Extractable NO3-N 0.126 0.169 0.764 Extractable Phosphorus 0.554 0.458 0.796 Extractable Potassium 0.356 0.694 0.103 Soil pH 0.246 0.721 0.686 Soil Organic Matter 0.004 0.196 0.412

Texas Tech University, Michael Hyndman, December 2015
63
Table 2: Seasonal dynamics for microbial and soil parameters associated with a creosotebush bajada soil from the Rice Tanks site in the Chihuahuan Desert in Big Bend National Park with treatments combined to evaluate main effects of season on designated parameters (ns superscript indicates non-significant effect of time irrespective of treatment and a/b superscript indicates Tukey homogeneous subsets). Dashes indicate dates where the soil parameter was not recorded. Seasonal Sampling Period Nov '12 Dec '12 Mar '13 May '13 Jul '13 Dec '13 Soil Moisture (%)
- 2.89ns 1.83ns 1.61ns 2.45ns 8.94ns
Microbial Biomass Carbon (µg/g dry wt. of soil)
- 66.57ns 41.97ns 38.35ns 49.56ns 74.89ns
Fungal Substrate Activity (slope)
- 0.30ns 0.31ns - 0.31ns 0.29ns
Fungal Substrate Richness (slope)
- 0.51ns 0.52ns - 0.66ns 0.52ns
Extractable NH4-N (mg/kg)
1.79a 1.60a 1.85a - 1.64a 3.13b
Extractable NO3-N (mg/kg)
4.55ns 5.38ns 6.78ns - 6.18ns 3.05ns
Extractable Phosphorus (mg/kg)
45.88ns 46.50ns 46.25ns - 51.13ns 52.50ns
Extractable Potassium (mg/kg)
616.75ns 611.75ns 604.13ns - 627.00ns 586.38ns
Soil pH 8.00ns 8.14ns 7.85ns - 7.84ns 7.89ns Soil Organic Matter (%)
0.88a 0.87a 0.98a - 0.99a 0.64b