hyper industrial feasibility study - esasci2.esa.int/hyper/docs/hyp-9-04_v10.pdfphilippe bouyer...
TRANSCRIPT

File: HYP-9-04_v10.doc Date: 25.06.2003
HYPER Industrial Feasibility Study
Executive Summary / Final Report
Document Number HYP-9-04
Authors: Dr. Walter Fichter, Dr. Ulrich Johann
Date: 25 June 2003
Astrium GmbH Page 2
File: HYP-9-04_v10.doc Date: 25.06.2003
Distribution List
Name Company
Giorgio Bagnasco ESA/ESTEC
Phil Airey ESA/ESTEC
Ruediger Reinhard ESA/ESTEC
Ernst Maria Rasel IQO, Uni Hannover
Philippe Bouyer IOTA, Paris
Arnaud Landragin SYRTE, Paris
Ulrich Johann Astrium GmbH
Walter Fichter Astrium GmbH
Steve Kemble Astrium Ltd
Giovanni Cherubini Galileo Avionica
Stephan Theil ZARM
Astrium GmbH Page 3
File: HYP-9-04_v10.doc Date: 25.06.2003
Change Record
Issue Date Change Description
1.0 25.06.2003

Astrium GmbH Page 4
File: HYP-9-04_v10.doc Date: 25.06.2003
Table of Contents
1. INTRODUCTION 6
1.1 SCOPE AND BACKGROUND 61.2 SCIENTIFIC OBJECTIVE AND MEASUREMENT PROCESS 61.2.1 OBJECTIVE 61.2.2 MEASUREMENT PROCESS 7
2. SYSTEM REQUIREMENTS 9
2.1 PERFORMANCE BREAKDOWN 92.2 CRITICAL REQUIREMENTS AND FUNCTIONAL INTERCONNECTION 10
3. ORBIT SELECTION 12
4. PAYLOAD MODULE 14
4.1 OPTICAL BENCH 144.1.1 REQUIREMENTS 144.1.2 DESIGN AND ANALYSIS RESULTS 154.2 PRECISION STAR TRACKER 174.2.1 REQUIREMENTS 174.2.2 PST DESIGN FEATURES 174.2.3 MEASUREMENT ERROR ANALYSIS 184.2.4 GUIDE STAR SELECTION 194.3 PAYLOAD-PLATFORM INTERFACE 204.3.1 THERMAL INTERFACE 204.3.2 MECHANICAL INTERFACE 22
5. SECONDARY AOCS 24
5.1 REQUIREMENTS AND PHASE DISTURBANCE REJECTION 245.2 DESIGN CONCEPT 255.2.1 DISTURBANCE FORCES AND TORQUE, AND CONTROL BANDWIDTH 255.2.2 SECONDARY AOCS ARCHITECTURE 275.3 SIMULATION RESULTS 295.3.1 SIMULATION PROCEDURE OUTLINE 295.3.2 STEADY STATE PERFORMANCE RESULTS 305.3.3 FURTHER RESULTS AND IMPLICATIONS 325.4 COMPONENT TECHNOLOGY 335.4.1 DRAG-FREE SENSOR 335.4.2 MICRO-PROPULSION 33
6. CONFIGURATION, MASS, AND POWER 34
6.1 CONFIGURATION 346.2 BUDGETS 34

Astrium GmbH Page 5
File: HYP-9-04_v10.doc Date: 25.06.2003
6.2.1 MASS 346.2.2 POWER 35
7. ON-GROUND TESTING 36
8. PROGRAMMATICS 37
Astrium GmbH Page 6
File: HYP-9-04_v10.doc Date: 25.06.2003
1. Introduction
1.1 Scope and Background
Cold Atom Interferometry is an emerging field with great interest in the physics community. It can beapplied for extremely precise measurements of angular rates and linear accelerations. In order to fullyexploit its potential it was recently proposed to apply this technique in space, where the limitationsdue to the 1-g environment are eliminated. Therefore, the European Space Technology Center(ESTEC) together with a science team led by the “Institut für Quantenoptik” (University of Hannover)started a project for hyper-precision cold atom interferometry in space (HYPER). The first industrialfeasibility study was carried out by a consortium led by Astrium GmbH. The major results are reportedin this executive summary.
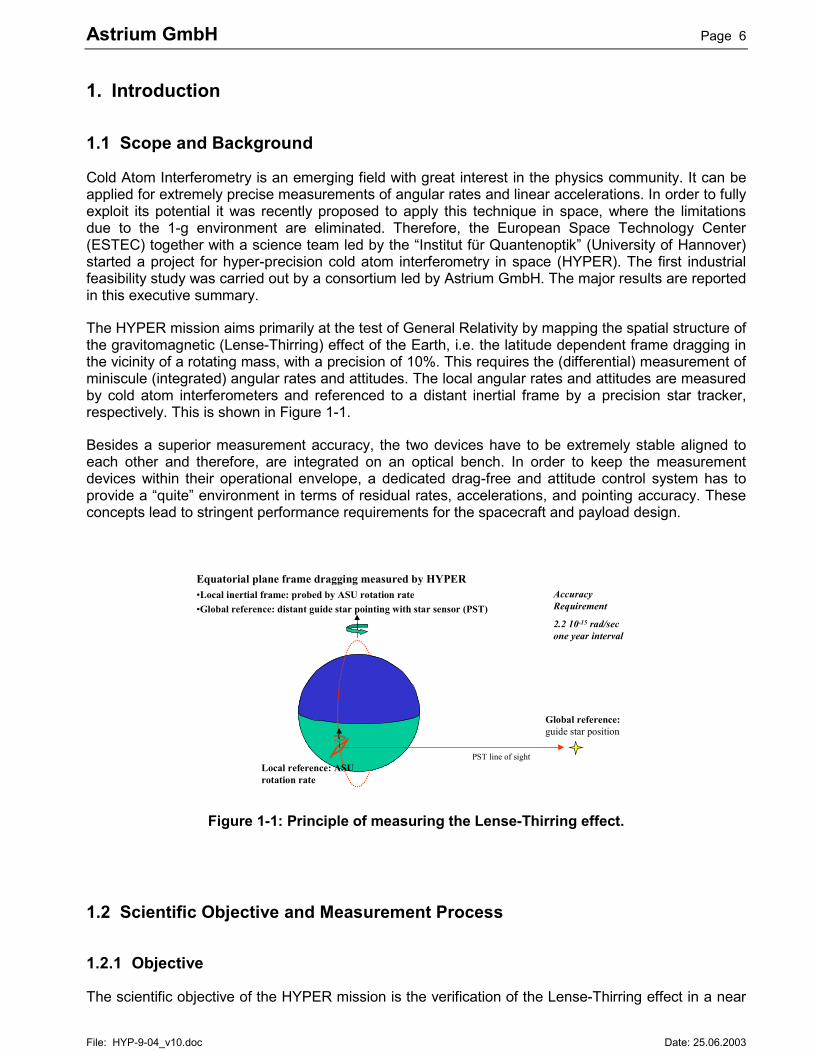
The HYPER mission aims primarily at the test of General Relativity by mapping the spatial structure ofthe gravitomagnetic (Lense-Thirring) effect of the Earth, i.e. the latitude dependent frame dragging inthe vicinity of a rotating mass, with a precision of 10%. This requires the (differential) measurement ofminiscule (integrated) angular rates and attitudes. The local angular rates and attitudes are measuredby cold atom interferometers and referenced to a distant inertial frame by a precision star tracker,respectively. This is shown in Figure 1-1.
Besides a superior measurement accuracy, the two devices have to be extremely stable aligned toeach other and therefore, are integrated on an optical bench. In order to keep the measurementdevices within their operational envelope, a dedicated drag-free and attitude control system has toprovide a “quite” environment in terms of residual rates, accelerations, and pointing accuracy. Theseconcepts lead to stringent performance requirements for the spacecraft and payload design.
PST line of sightLocal reference: ASUrotation rate
Equatorial plane frame dragging measured by HYPER•Local inertial frame: probed by ASU rotation rate•Global reference: distant guide star pointing with star sensor (PST)
Global reference:guide star position
AccuracyRequirement
2.2 10-15 rad/secone year interval
Figure 1-1: Principle of measuring the Lense-Thirring effect.
1.2 Scientific Objective and Measurement Process
1.2.1 Objective
The scientific objective of the HYPER mission is the verification of the Lense-Thirring effect in a near
Astrium GmbH Page 7
File: HYP-9-04_v10.doc Date: 25.06.2003
Earth orbit by means of an atomic Sagnac unit (ASU) and a precision star tracker (PST).
The 3��accuracy of the differential measurement between the precision star sensor and the atomicSagnac unit over lifetime (i.e. after one year of signal integration) shall be at least 10 percent of thepeak value over one orbit.
The LT effect occurs at double orbit frequency. For the presently selected 1000 km orbit, the peakvalue is 2.2 10-14 rad/sec. Therefore, for this altitude the 3� measurement accuracy shall be less than2.2 10-15 rad/sec.
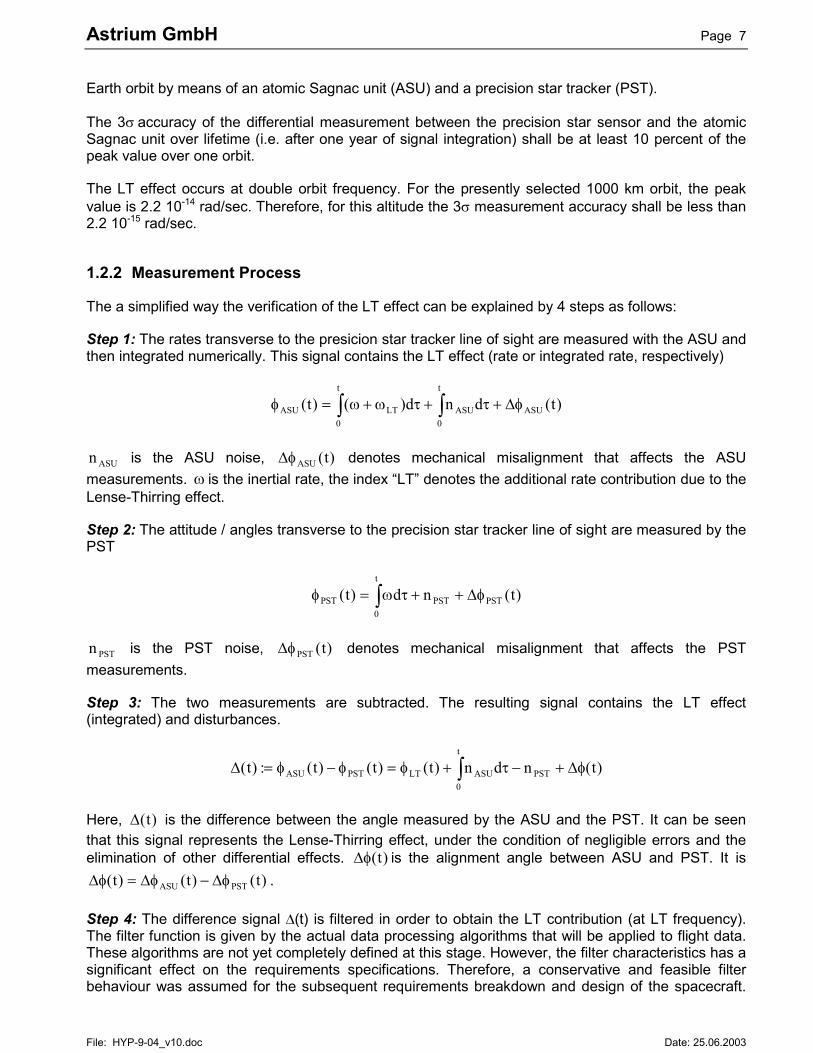
1.2.2 Measurement Process
The a simplified way the verification of the LT effect can be explained by 4 steps as follows:
Step 1: The rates transverse to the presicion star tracker line of sight are measured with the ASU andthen integrated numerically. This signal contains the LT effect (rate or integrated rate, respectively)
)t(dnd)()t( ASU
t
0ASU
t
0LTASU ����������� ��
ASUn is the ASU noise, )t(ASU�� denotes mechanical misalignment that affects the ASUmeasurements. � is the inertial rate, the index “LT” denotes the additional rate contribution due to theLense-Thirring effect.
Step 2: The attitude / angles transverse to the precision star tracker line of sight are measured by thePST
)t(nd)t( PSTPST
t
0PST �������� �
PSTn is the PST noise, )t(PST�� denotes mechanical misalignment that affects the PSTmeasurements.
Step 3: The two measurements are subtracted. The resulting signal contains the LT effect(integrated) and disturbances.
)t(ndn)t()t()t(:)t( PST
t
0ASULTPSTASU ������������� �
Here, )t(� is the difference between the angle measured by the ASU and the PST. It can be seenthat this signal represents the Lense-Thirring effect, under the condition of negligible errors and theelimination of other differential effects. )t(�� is the alignment angle between ASU and PST. It is
)t()t()t( PSTASU �������� .
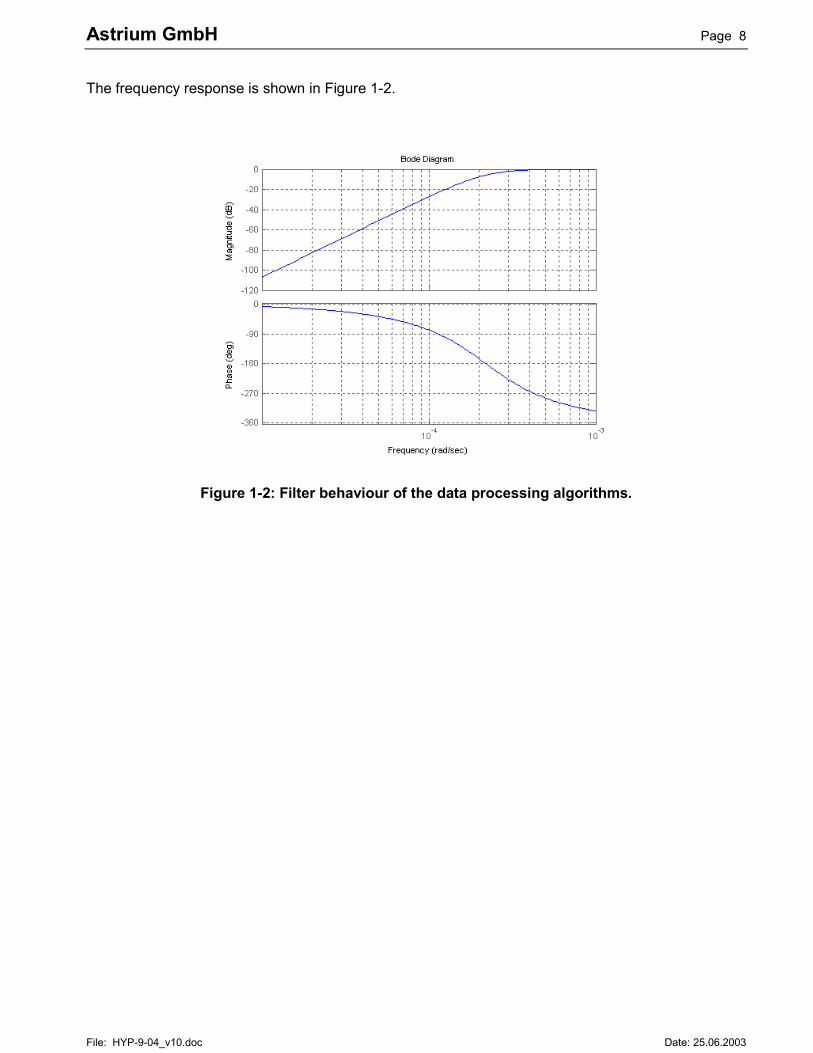
Step 4: The difference signal �(t) is filtered in order to obtain the LT contribution (at LT frequency).The filter function is given by the actual data processing algorithms that will be applied to flight data.These algorithms are not yet completely defined at this stage. However, the filter characteristics has asignificant effect on the requirements specifications. Therefore, a conservative and feasible filterbehaviour was assumed for the subsequent requirements breakdown and design of the spacecraft.
Astrium GmbH Page 8
File: HYP-9-04_v10.doc Date: 25.06.2003
The frequency response is shown in Figure 1-2.
Figure 1-2: Filter behaviour of the data processing algorithms.
Astrium GmbH Page 9
File: HYP-9-04_v10.doc Date: 25.06.2003
2. System Requirements
2.1 Performance Breakdown
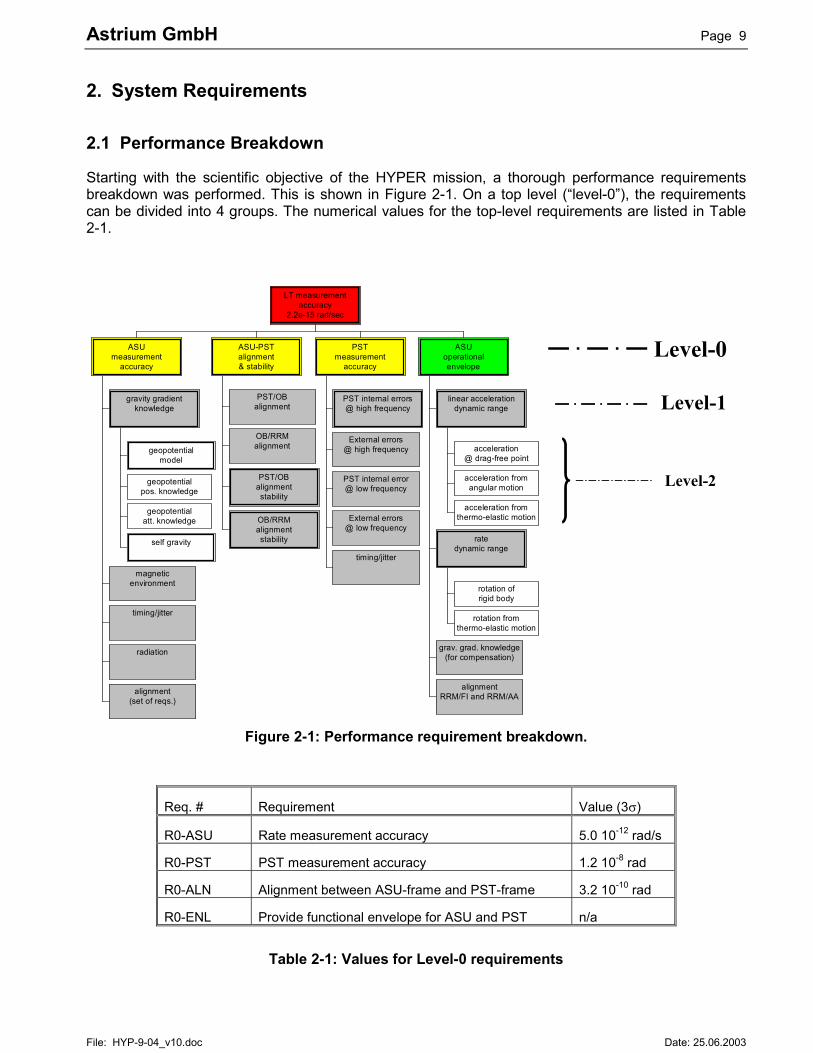
Starting with the scientific objective of the HYPER mission, a thorough performance requirementsbreakdown was performed. This is shown in Figure 2-1. On a top level (“level-0”), the requirementscan be divided into 4 groups. The numerical values for the top-level requirements are listed in Table2-1.
Level-0
Level-1
Level-2
geopotentialmodel
geopotentialpos. knowledge
geopotentialatt. knowledge
self gravity
gravity gradientknowledge
magneticenvironment
timing/jitter
radiation
alignment(set of reqs.)
ASUmeasurement
accuracy
PST/OBalignment
OB/RRMalignment
PST/OBalignmentstability
OB/RRMalignmentstability
ASU-PSTalignment& stability
PST internal errors@ high frequency
External errors@ high frequency
PST internal error@ low frequency
External errors@ low frequency
timing/jitter
PSTmeasurement
accuracy
acceleration@ drag-free point
acceleration fromangular motion
acceleration fromthermo-elastic motion
linear accelerationdynamic range
rotation ofrigid body
rotation fromthermo-elastic motion
ratedynamic range
grav. grad. knowledge(for compensation)
alignmentRRM/FI and RRM/AA
ASUoperationalenvelope
LT measurementaccuracy
2.2e-15 rad/sec
Figure 2-1: Performance requirement breakdown.
Req. # Requirement Value (3�)
R0-ASU Rate measurement accuracy 5.0 10-12 rad/s
R0-PST PST measurement accuracy 1.2 10-8 rad
R0-ALN Alignment between ASU-frame and PST-frame 3.2 10-10 rad
R0-ENL Provide functional envelope for ASU and PST n/a
Table 2-1: Values for Level-0 requirements

Astrium GmbH Page 10
File: HYP-9-04_v10.doc Date: 25.06.2003
2.2 Discussion of Requirements and Functional Interconnection
The Level-0 requirements are briefly discussed in the following and the most critical lower levelrequirements are addressed.
ASU measurement requirements.
The rate measurement accuracy of the ASU is not directly part of the study, but represents a“constraint” to the rest of the performance requirements breakdown. However, in order to obtainaccurate measurements, precise knowledge of the gravity gradient is required.
This leads to stringent requirements for the modelling precision of the geo-potential and to self gravitygradient requirements.
Precision Star Tracker measurement requirements.
The required star tracker accuracy requirement is extremely stringent. There are two maincontributors to the error budget: the centroiding error and the noise equivalent angle.
This leads to a challenging start tracker design
ASU-PST Alignment requirement.
Any alignment variation between the ASU and the PST that occurs with LT frequency mimics a LTeffect. Therefore, the alignment has to be extremely stable at double orbit frequency.
This requirement leads to a challenging design of theoptical bench, together with a thermal controlsystem.
ASU Operational envelope requirements.
In order to obtain unambiguous interferometric measurement (i.e. remain in the central fringe), theresidual accelerations and rates must be kept within a range that corresponds to about 1/10 of thecentral fringe.
This leads to a challenging drag-free and attitude control system.
In Figure 2-2 the main components of the HYPER spacecraft are shown and their interdependence interms of function and performance is outlined.

Astrium GmbH Page 11
File: HYP-9-04_v10.doc Date: 25.06.2003
Precision StarTracker (3) Orbit (1)
Configuration,Mass, andPower (6)
SecondaryAOCS (4)
Micro-Propulsion &Drag-Free Sensor (4)
Optical Bench(2)
Payload/PlatformInterface (5)
ASU
sensor configuration
gravitygradientmodelmeasurement
accuracy
mech. designalignmentstability
measurement andcontrol accuracy
launcher
mass/power
force, torquedisturbances
phase disturbancerejection
ThermalSubsystem (5)
technology
thermal/mechanical
thermal interface
Figure 2-2: Performance interconnection between components.
Astrium GmbH Page 12
File: HYP-9-04_v10.doc Date: 25.06.2003
3. Orbit Selection
3.1 Orbit Altitude Trades and Requirements
The orbit shape and orientation of the orbit is basically determined by the mission: In order to obtain asignature of the Lense-Thirring effect, the orbit is required to be near-polar. A stable thermalenvironment requires a Sun-synchronous orbit. Thus, the only free parameter to be selected is theorbit altitude. The following effects drive the orbit altitude selection:
� Higher altitude leads to� degradation of Lense-Thirring effect� increased radiation� smaller launch mass
� Lower altitude leads to� increased aerodynamic disturbances for drag-free control� increased gravity gradient model error
Moreover, the launch cost impose a constraint on the orbit altitude. Assuming an affordable Rockotlaunch, the limitation for a 1000 kg satellite is an altitude of about 1000 km.
Of all the above effects, the gravity gradient model error is most driving. Investigations have shownthat for an altitude of 1000 km the
gravity gradient error requirements of 2.4 10-11 1/s2 on ground, 3.4 10-8 1/s2 on board
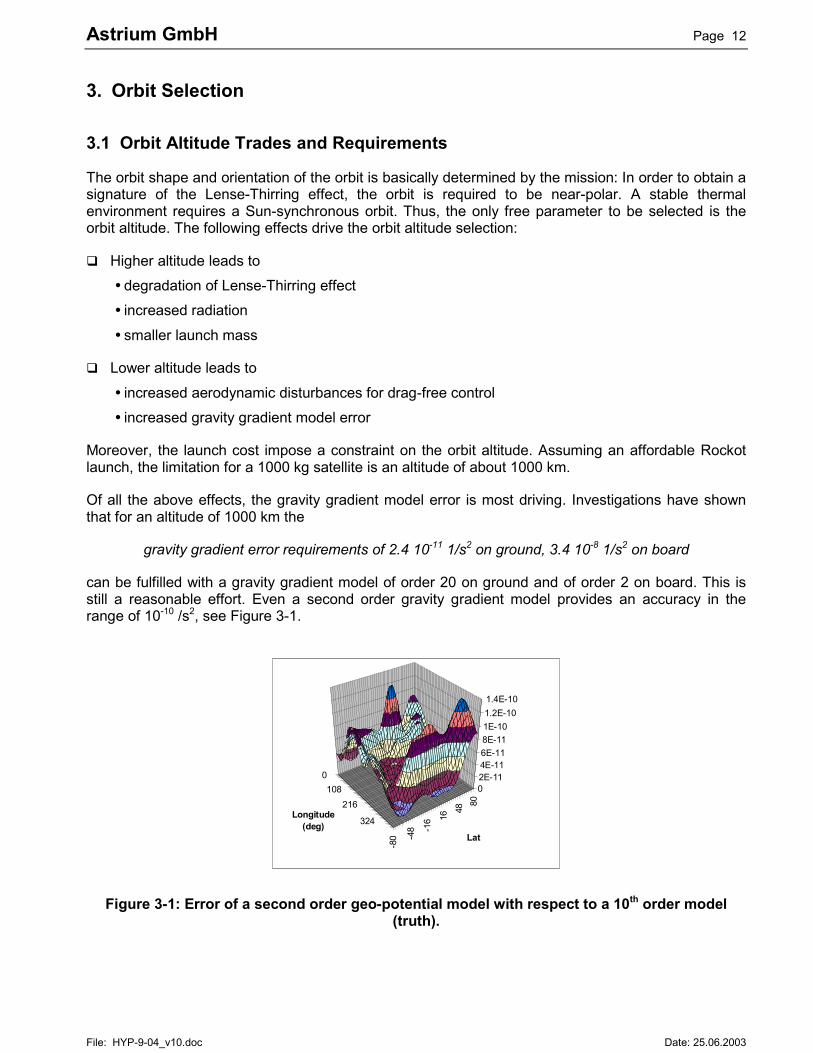
can be fulfilled with a gravity gradient model of order 20 on ground and of order 2 on board. This isstill a reasonable effort. Even a second order gravity gradient model provides an accuracy in therange of 10-10 /s2, see Figure 3-1.
0108
216
324
-80 -4
8 -16 16
4880
02E-114E-116E-118E-111E-101.2E-101.4E-10
Longitude (deg)
Lat
Figure 3-1: Error of a second order geo-potential model with respect to a 10th order model(truth).
Astrium GmbH Page 13
File: HYP-9-04_v10.doc Date: 25.06.2003
3.2 Implications of the Increased Orbit Altitude
In summary, the baseline altitude of 1000 km has the following impact.
� Positive implications� The gravity gradient can be modelled accurately enough with reasonable complexity, as
explained above.� The aerodynamic disturbance become relatively small. “High frequency” aerodynamic noise
disturbances need not to be actively controlled.� The observation time increases by 10 percent, due to less observation day with eclipses. This is
good.
� Negative implications� The magnitude of the Lense-Thirring effect degrades by about 12 percent. This is still
acceptable.� The radiation is still within acceptable limits, i.e. no exceptional electronics has to be used.
The launch mass limitation is 1000 kg, which is a number that can be met, see mass budget below. Inorder to obtain a Sun-synchronous orbit at altitude 1000 km, the inclination has to be 99.5 deg.

Astrium GmbH Page 14
File: HYP-9-04_v10.doc Date: 25.06.2003
4. Payload Module
4.1 Optical Bench
4.1.1 Requirements
The optical bench is one of the most challenging components of the HYPER spacecraft. The majorrequirements for the optical bench can be summarised as follows.
ASU-PST alignment stability
An alignment stability between the ASU and the PST of 3.2 10-10 rad (3�) is required, in the frequencyrange from 3.5 10-5 Hz to 0.15 Hz. This corresponds to a spectral density of 2.75 10-10 rad/sqrt(Hz) inthis frequency range. At lower frequencies, the stability is relaxed according to a 4th order filter. Theconstant misalignment (zero frequency) shall be better than 1 arcsec.
This is the crucial requirement. It is verified by detailed thermo-elastic analysis based on a finiteelement (FE) model
Minimise mass
The optical bench is one of the major mass contributions. The mass minimisation is in contradiction tothe alignment stability.
Accommodation of drag-free sensors
Accommodate two drag-free sensors with its connection line (“DFS axis”) coincident with theintersection line of the two ASU planes. In this case any angular acceleration around the PSTboresight (which is controlled by a conventional star tracker) leads to linear accelerationsperpendicular to the ASU planes, see Figure 4-1. These do not have any impact on the ASUoperational envelope and thus, the system is robust with respect to the control system around thePST boresight.
ASU plane 1
ASU plane 2
DFS1/2
PX
TZ TX
TY
PY
PZ
ASU Plane 1 rz=0
ASU Plane 2 ry=0
Drag-Free Point
DFS1
DFS2
acceleration dueto angular X motion
� not criticald�x/dt
Figure 4-1: Accommodation of drag-free sensors.

Astrium GmbH Page 15
File: HYP-9-04_v10.doc Date: 25.06.2003
4.1.2 Design and Analysis Results
Baseline Design
The baseline configuration of the optical bench is shown in Figure 4-3. The bench itself consistsbasically of 4 modular elements plus the precision star tracker, see Figure 4-2. The followingelements are connected to the optical bench:
� Atom preparation benches
� Drag-free sensors
� Precision star tracker
� Fiber injectors
� Retro-reflecting mirrors
BenchModular
Architecture
Figure 4-2: Modules of optical bench.
Three mounting points (interface pads) are foreseen for the mechanical support interface. The lengthof the optical bench is about 700 mm. The dimensions of the whole assembly are shown in Figure4-4.
The optical bench structure itself is the vacuum enclosure for the ASU drift tube. This eliminates theimplementation of mirrors.
For high alignment stability the need for extremely low CTE values are required. Moreover, the massminimisation requirement leads to the need of a low density of the optical bench material. This led tothe selection of ULE material as a baseline.

Astrium GmbH Page 16
File: HYP-9-04_v10.doc Date: 25.06.2003
Figure 4-3: Optical bench configuration.
Figure 4-4: Optical bench dimensions.
Mass
The total mass of the optical bench and precision star tracker including a margin of 10 % is 275 kg.This value excludes the mass of atomic assemblies (denoted “ASU” in Figure 4-3), drag-free sensors(“DFS”), and laser benches.
Astrium GmbH Page 17
File: HYP-9-04_v10.doc Date: 25.06.2003
Alignment Stability
The alignment stability was analysed with a detailed FE model. The following thermal interfaces wereused for this analysis:
� Radiation: The optical bench is considered de-coupled with respect to radiation from theenvironment. “De-coupled“ means a temperature variation of less than 1 mK.
� Conduction: A temperature variation of � 0.1 K with orbit frequency is assumed at the mechanicalinterfaces (mounting pads) of the optical bench.
The validity of these interface assumptions is verified in a separate analysis of the thermal controlsystem, which is outlined further below.
With the above assumptions, the alignment analysis results in a maximum misalignment angle of 6.210-10 rad over one orbit which is a factor of 2 larger than the requirement (3.2 10-10 rad). Since there isa linear relation between temperature variation and misalignment, the interface temperature variationhas to be about half of the above value in order to meet alignment requirement. This means thethermal control system has to guarantee a temperature variation of � 0.05 K. Then the alignmentrequirement is met.
4.2 Precision Star Tracker
4.2.1 Requirements
Besides the optical bench also the precision star tracker has to meet stringent performancerequirements. The most severe performance requirement is the following:
The measurement accuracy within the frequency range of 3.5 10-5 Hz and 5 Hz shall be < 1.2 10-8 rad= 2.5 marcsec (3�) @ 10 Hz sampling frequency.
This requirement can be further divided according to the following major contributors:
� Errors originated by the PST
� Centroiding error, requirement: 1.7 10-3 arcsec (3�)
� Noise Equivalent Angle, requirement: 1.4 10-3 arcsec (3�)
� Errors originated externally� Aberration, approximately v/c [rad], where v [m/sec] is the spacecraft’s velocity and c [m/sec] isthe speed of light. The aberration will not be treated within the error budget as explained below.
4.2.2 PST Design Features
The PST design features are summarised in Table 4-1.

Astrium GmbH Page 18
File: HYP-9-04_v10.doc Date: 25.06.2003
� Optical configuration: Ritchey-Chretien telescope� Focal length 36 m� F number 190� FOV ±25 arcsec� CCD number of pixels 1024x1024� CCD pixel size 13 micron� IFOV 0.074 arcsec� Integration time 100 ms, jitter < 1 ms� magnitude range 2 � V � 4� Centroid algorithm Based on a 17x17 pixels tracking window
Table 4-1: Summary of PST baseline configuration.
4.2.3 Measurement Error Analysis
Noise Equivalent Angle and Centroiding Error
A detailed error analysis was carried out for the assessment of the PST measurement performance.The results for the major error contributions. the centroiding error and the noise equivalent angleerror, are plotted over one pixel in Figure 4-5 and Figure 4-6, respectively, for different start colours.
It can be seen that the requirements are fulfilled and that the major contributor, the centroiding error,is linear over one pixel. Linearity is very important since in this case a Gaussian error distribution,which is the basis for the overall performance breakdown, is not destroyed by any non-linearity. Thisleads to the requirement for the attitude control system to keep the star spot always within the centralpixel of the CCD.
Figure 4-5: Centroiding error over one pixel.

Astrium GmbH Page 19
File: HYP-9-04_v10.doc Date: 25.06.2003
Figure 4-6: Noise equivalent angle over one pixel.
1 pixel
Figure 4-7: Non-linearity of centroiding error over several pixels.
Aberration
The angular measurement error due to the orbit velocity of the spacecraft (“aberration”) is in the orderof v/c, where v is the spacecraft velocity and c is the speed of light. This yields a measurement errorwith an amplitude of about 4.5 arcsec, at orbit frequency. Clearly, this value is much larger than onepixel size and therefore, aberration must not be considered for spacecraft control purposes.
Instead, the star spot is always centred in the central pixel, as it is required from the considerationgiven above. This introduces rate oscillations which are measured by the ASU. However, the rateoscillations are still within the limits tolerable by the ASU.
4.2.4 Guide Star Selection
A guide star catalogue was composed of 48 stars with magnitude between 2 and 4. In Figure 4-8, thedirection of the guide stars are plotted. The declination range correspond to the orbit geometry andthe smallest angular separation in right ascension is 26.4 deg (requirement: < 30 deg).
The latter is the maximum slew angle that has to be performed when changing the guide star.

Astrium GmbH Page 20
File: HYP-9-04_v10.doc Date: 25.06.2003
Figure 4-8: Guide stars as a function of right ascension and declination.
4.3 Payload-Platform Interface
4.3.1 Thermal Interface
Thermal Concept
The thermal concept is based on a de-coupling of payload and platform as far as possible: the sidewalls are MLI covered and the anti-Sun side is used as radiator. The central cylinder is activelycontrolled by heaters and in addition a “inner” shield is implemented to further de-couple the payloadfrom temperature variations at the central cylinder. Optionally, coolong straps could be added toremove dissipated heat from the atom preparation boxes (denoted “ASU” in the figure) however,analysis showed that this is not necessary. In fact, the thermal system is feasible and simpler whenthis option is dropped.

Astrium GmbH Page 21
File: HYP-9-04_v10.doc Date: 25.06.2003
Figure 4-9: Thermal control concept.
Analysis Approach and Results
Two steps were carried out for the thermal analysis.
1. Thermal balancing of radiator to find design drivers.
2. Analysis based on a simple thermal model of the payload (several nodes) in order to assessdamping effects and thus, verify the thermal interface assumption that were used for thethermo-elastic FE analysis, and to assess box temperatures.
Using the nominal area of the anti-Sun side as radiator results in a radiator temperature of about 20degC. With an “extended” are as large as the solar array, the resulting radiator temperature is about 8degC. For the second analysis step a “mean” radiator temperature of 15 deg C was selected.

Astrium GmbH Page 22
File: HYP-9-04_v10.doc Date: 25.06.2003
Figure 4-10: Temperature levels and temperature variations.
The results of the second analysis step are shown in Figure 4-10, for a temperature variation “input”of 0.5 K from thermal control
A realistically achievable performance of the temperature control of �0.05 K at the central cylinderleads to the following results:
� A temperature variation of �0.73 mK at the optical bench. This is compliant with the assumption of“radiation de-coupled” that was used for thermp-elastic analysis.
� A temperature variation of �0.67 mK at the drag-free sensor. This is complaint with the drag-freesensor specification.
� A temperature variation of �0.05 K at the mechanical support interfaces of the optical bench (asassumed for the optical bench thermo-elastic analysis) does not require any thermal dampingfrom the mounts itself. Therefore, this is a conservative result.
� Temperature levels of the ASU and DFS of about 30 deg C and 27 deg C, respectively, seeFigure 4-10. This is still within reasonable and feasible limits.
An important point for the ASU design is that sufficient radiation area is kept in future designmodifications. Any changes will lead to different temperature levels.
4.3.2 Mechanical Interface
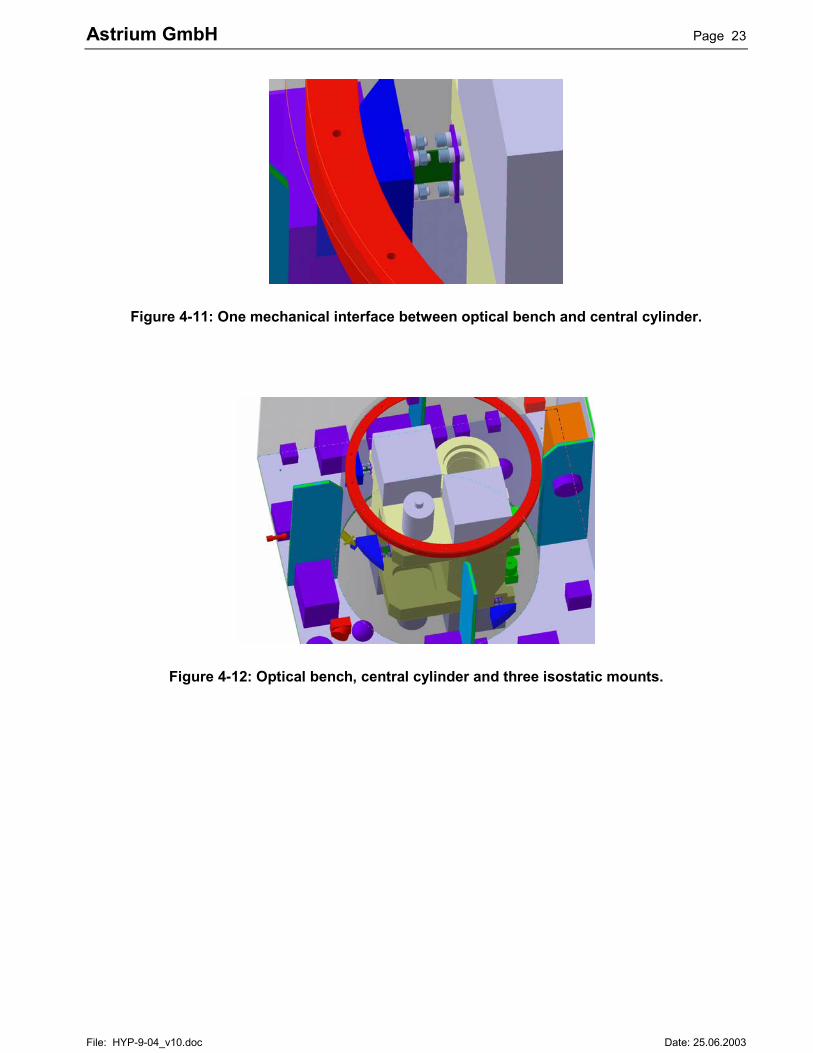
The optical bench is supported on the central cylinder with isostatic mounts. One of the interfaces isshown in Figure 4-11. It supports two translation degrees of freedom and is flexible along the thirddegree of freedom. Thus, three mounts are required for a 6 degree of freedom support, which isdepicted in Figure 4-12.
Astrium GmbH Page 23
File: HYP-9-04_v10.doc Date: 25.06.2003
Figure 4-11: One mechanical interface between optical bench and central cylinder.
Figure 4-12: Optical bench, central cylinder and three isostatic mounts.
Astrium GmbH Page 24
File: HYP-9-04_v10.doc Date: 25.06.2003
5. Secondary AOCS
5.1 Requirements and Phase Disturbance Rejection
In order to obtain unambiguous phase measurements from the ASU, an operational envelope in termsof rotational rate, and linear and angular acceleration has to be maintained. This envelope is definedby the following performance requirements for residual rates and accelerations (3�):
� Linear acceleration < 1.2 10-8 m/sec2
� Angular acceleration < 2.4 10-8 rad/sec2
� Rotation rate < 4.3 10-8 rad/sec
� Rotation around boresight < 10-6 rad/sec
The requirements are comparable to the requirements of the GOCE spacecraft.
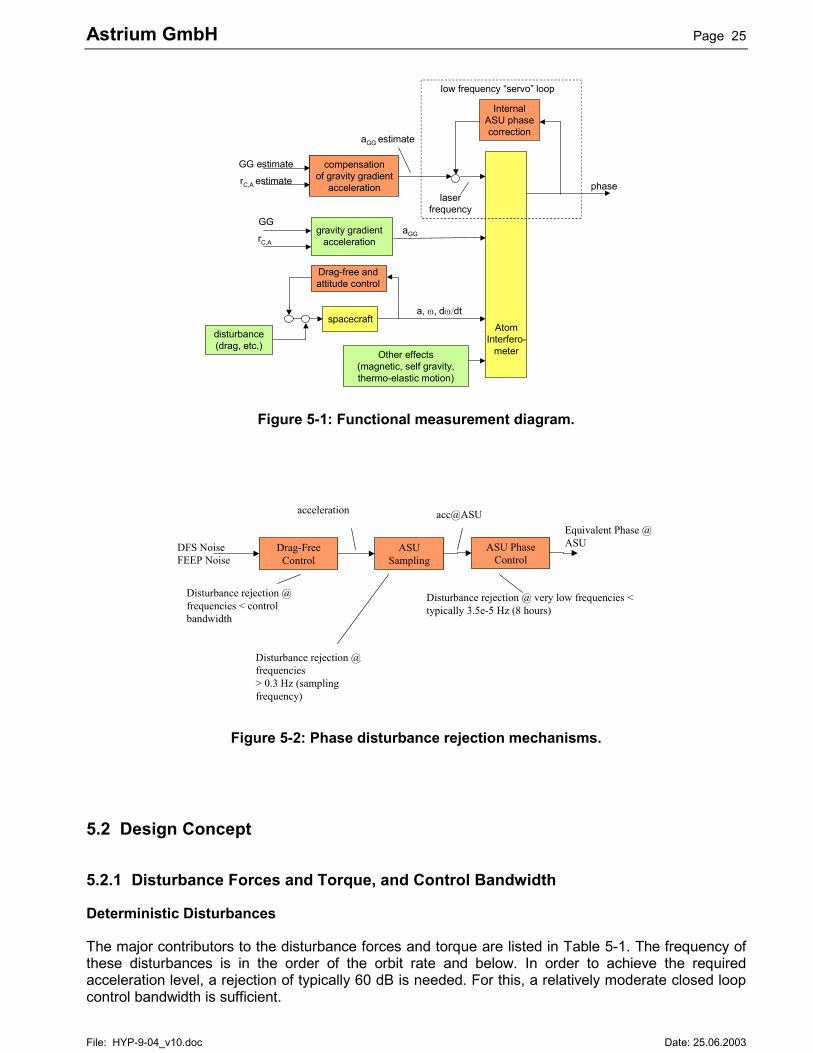
The phase measurement scheme, the disturbance sources, and the rejection mechanisms aresketched in Figure 5-1. There are 3 major mechanisms that attenuate and/or reject phasemeasurement disturbances:
1. The ASU itself acts as a low pass, since it is operated as a sampled device with a sampling(“corner”) frequency of 0.3 Hz.
2. The ASU has to have a built-in phase correction mechanism that rejects low frequencydisturbances. Here, low frequency means time constants of 8 h or more. This is actually thesame mechanisms that is required to acquire the central fringe of the measurement.
3. There is a drag-free control loop that rejects phase disturbances in the range between 8 hoursand 0.3 Hz in order to meet the above requirements.
The three mechanisms are shown in Figure 5-2, together with the frequency ranges where they areeffective.
Astrium GmbH Page 25
File: HYP-9-04_v10.doc Date: 25.06.2003
AtomInterfero-
meter
InternalASU phasecorrection
compensationof gravity gradient
acceleration
gravity gradientacceleration
Drag-free andattitude control
spacecraft
GG estimate
GG
rC,A estimate
rC,A
Other effects(magnetic, self gravity,thermo-elastic motion)
a, ���d��dt
aGG
phaselaser
frequency
disturbance(drag, etc.)
aGG estimate
low frequency “servo” loop
Figure 5-1: Functional measurement diagram.
ASUSampling
DFS NoiseFEEP Noise
ASU PhaseControl
Drag-FreeControl
Equivalent Phase @ASU
acc@ASU
Disturbance rejection @frequencies < controlbandwidth
Disturbance rejection @frequencies> 0.3 Hz (samplingfrequency)
Disturbance rejection @ very low frequencies <typically 3.5e-5 Hz (8 hours)
acceleration
Figure 5-2: Phase disturbance rejection mechanisms.
5.2 Design Concept
5.2.1 Disturbance Forces and Torque, and Control Bandwidth
Deterministic Disturbances
The major contributors to the disturbance forces and torque are listed in Table 5-1. The frequency ofthese disturbances is in the order of the orbit rate and below. In order to achieve the requiredacceleration level, a rejection of typically 60 dB is needed. For this, a relatively moderate closed loopcontrol bandwidth is sufficient.
Astrium GmbH Page 26
File: HYP-9-04_v10.doc Date: 25.06.2003
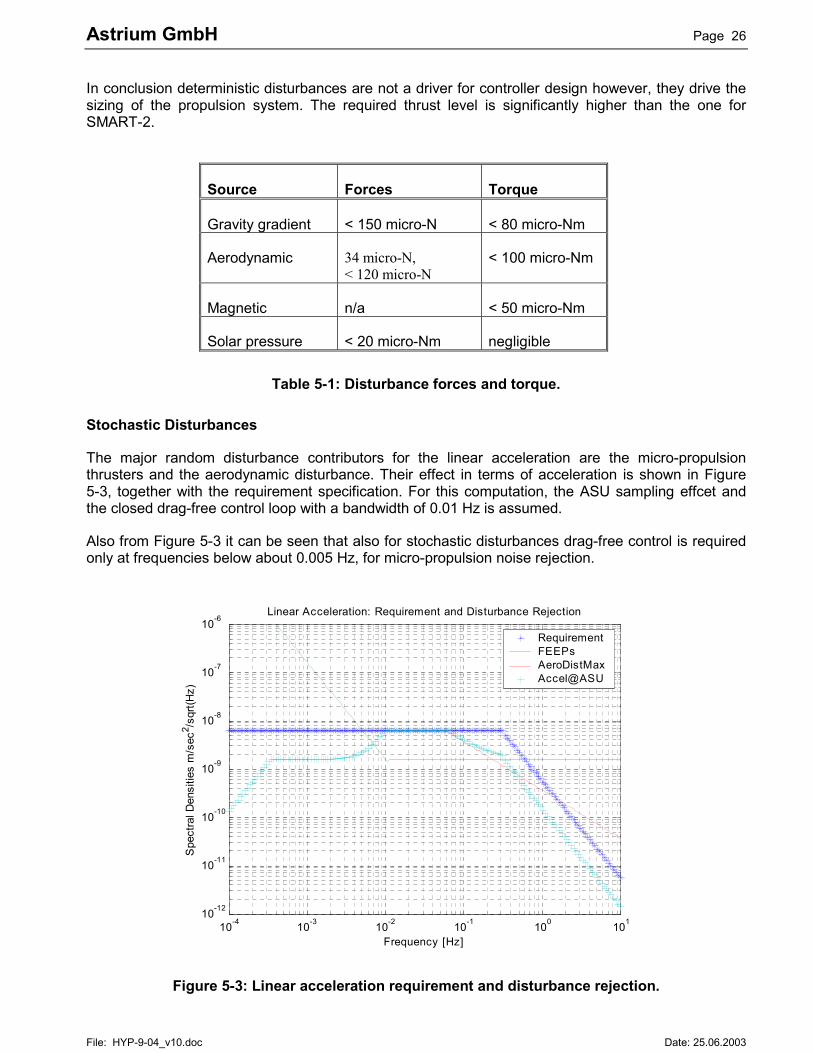
In conclusion deterministic disturbances are not a driver for controller design however, they drive thesizing of the propulsion system. The required thrust level is significantly higher than the one forSMART-2.
Source Forces Torque
Gravity gradient < 150 micro-N < 80 micro-Nm
Aerodynamic 34 micro-N,< 120 micro-N
< 100 micro-Nm
Magnetic n/a < 50 micro-Nm
Solar pressure < 20 micro-Nm negligible
Table 5-1: Disturbance forces and torque.
Stochastic Disturbances
The major random disturbance contributors for the linear acceleration are the micro-propulsionthrusters and the aerodynamic disturbance. Their effect in terms of acceleration is shown in Figure5-3, together with the requirement specification. For this computation, the ASU sampling effcet andthe closed drag-free control loop with a bandwidth of 0.01 Hz is assumed.
Also from Figure 5-3 it can be seen that also for stochastic disturbances drag-free control is requiredonly at frequencies below about 0.005 Hz, for micro-propulsion noise rejection.
10-4 10-3 10-2 10-1 100 10110-12
10-11
10-10
10-9
10-8
10-7
10-6
Frequency [Hz]
Spe
ctra
l Den
sitie
s m
/sec
2 /sqr
t(Hz)
Linear Acceleration: Requirement and Disturbance Rejection
RequirementFEEPsAeroDistMaxAccel@ASU
Figure 5-3: Linear acceleration requirement and disturbance rejection.
Astrium GmbH Page 27
File: HYP-9-04_v10.doc Date: 25.06.2003
5.2.2 Secondary AOCS Architecture
Functional Diagram
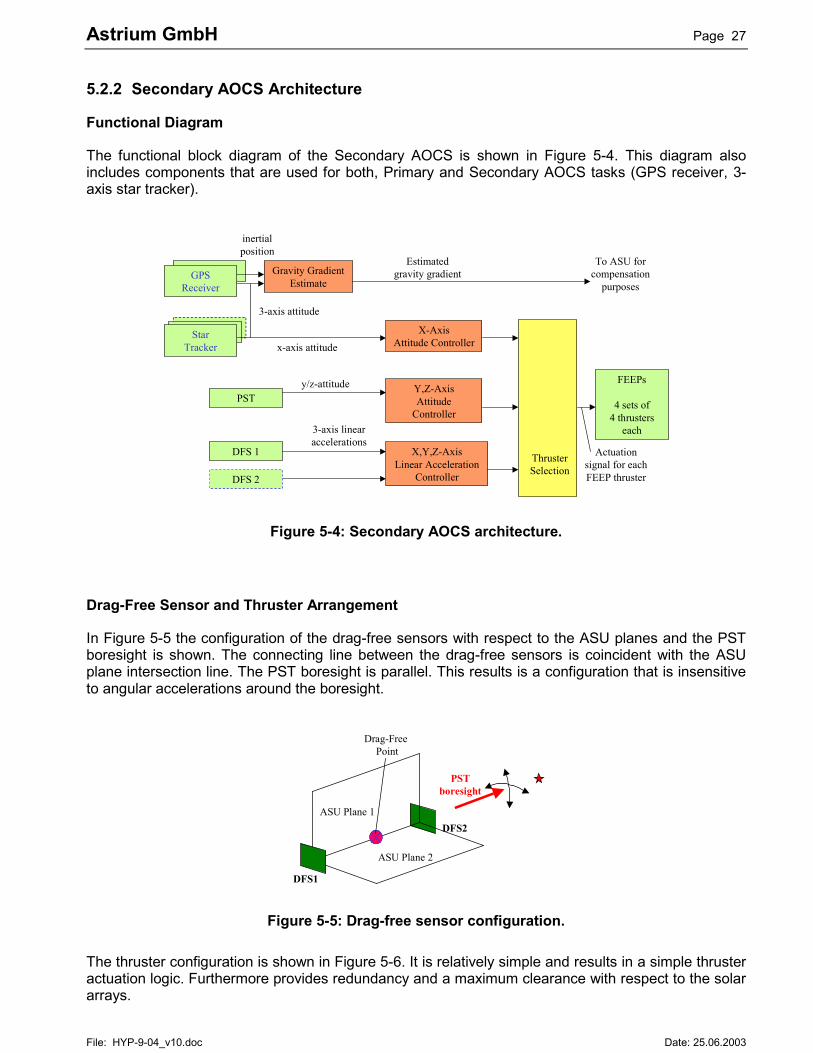
The functional block diagram of the Secondary AOCS is shown in Figure 5-4. This diagram alsoincludes components that are used for both, Primary and Secondary AOCS tasks (GPS receiver, 3-axis star tracker).
ThrusterSelection
DFS 1
Gravity GradientEstimate
X,Y,Z-AxisLinear Acceleration
Controller
X-AxisAttitude Controller
Y,Z-AxisAttitude
ControllerPST
Actuationsignal for eachFEEP thruster
StarTracker
GPSReceiver
To ASU forcompensation
purposes
3-axis attitude
inertialposition
y/z-attitude
3-axis linearaccelerations
DFS 2
FEEPs
4 sets of4 thrusters
each
x-axis attitude
Estimatedgravity gradient
Figure 5-4: Secondary AOCS architecture.
Drag-Free Sensor and Thruster Arrangement
In Figure 5-5 the configuration of the drag-free sensors with respect to the ASU planes and the PSTboresight is shown. The connecting line between the drag-free sensors is coincident with the ASUplane intersection line. The PST boresight is parallel. This results is a configuration that is insensitiveto angular accelerations around the boresight.
ASU Plane 1
ASU Plane 2
Drag-Free Point
DFS1
DFS2
PSTboresight
Figure 5-5: Drag-free sensor configuration.
The thruster configuration is shown in Figure 5-6. It is relatively simple and results in a simple thrusteractuation logic. Furthermore provides redundancy and a maximum clearance with respect to the solararrays.

Astrium GmbH Page 28
File: HYP-9-04_v10.doc Date: 25.06.2003
21
Solar Array
24
23
22
3
13
414
122
11
1
YZ X
Figure 5-6: Thruster arrangement.
Modes, Sensor Acquisition, and Re-Orientation Duration
The following Secondary AOCS modes are foreseen:
� Inertial Pointing Mode. In this mode the DFS and PST have to be initialised.� The DFS acquisition is driven by the gravity gradient and the maximum range is in the
order of 10-6 m/sec2.� The misalignent between 3-axis star tracker and PST is about 50 arcsec. The PST field of
view is �25 arcsec. Thus, a scan strategy for the guide star is necessary.
The inertial pointing mode includes also re-orientation manoeuvres.
� Science Mode. In this modes science measurements are taken.� Hold Mode. Control with respect to star spot at initialisation.� Control Mode. Control star spot at zero position and keep it there.
The duration of a re-orientation manoeuvre is composed of
1. time needed for the slew manoeuvre itself and
2. settling time to achieve steady state conditions.
The time for the slew manoeuvre itself is plotted in Figure 5-7. A typical 30 deg slew takes about0.37h. As a conservative estimation, the total manoeuvre including settling takes typically less thanone hour.
The maximum rate and acceleration during the manoeuvre is 4.5 10-4 rad/sec and 2.9 10-7 rad/sec2,respectively. This means, that both, drag-free sensor and 3-axis star tracker can remain switched on/operational during the slew.

Astrium GmbH Page 29
File: HYP-9-04_v10.doc Date: 25.06.2003
0 5 10 15 20 25 30 35 400
0.05
0.1
0.15
0.2
0.25
0.3
0.35
0.4
0.45
Slew Angle [deg]
Tim
e [h
]
Figure 5-7: Slew time as a function of slew angle.
5.3 Simulation Results
5.3.1 Simulation Procedure Outline
A detailed simulation campaign of the closed loop drag-free and attitude control system was carriedout. About 20 different sets of test cases were executed. The purpose of the simulation campaign wastwo-fold:
� Tuning, evaluation and validation of drag-free and attitude control
� Confirmation of the PST measurement error distribution
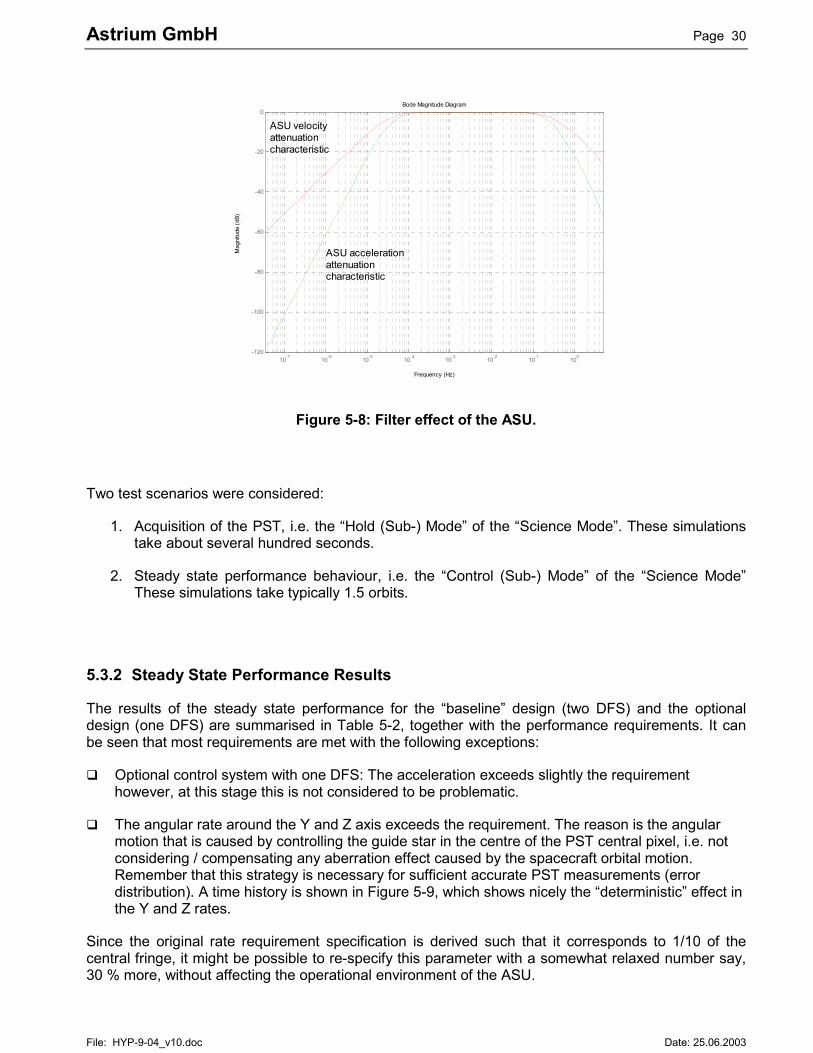
In order to take into account the filtering effect of the ASU phase control mechanism (< LT-frequency/10) and the ASU sampling effect (> 0.3 Hz), the simulated data was post processed with a“bandpass” with a frequency characteristics as shown in Figure 5-8.
For the nominal simulations a small drag-free sensor bias of 10-9 m/sec2 was assumed. Theconclusions for realistic drag-free sensor biases is given below.
Simulation runs were performed for the “baseline” control system that relies on two drag-free sensors,and an “optional” control system that is based on only one of the nominally accommodated drag-freesensors.
Astrium GmbH Page 30
File: HYP-9-04_v10.doc Date: 25.06.2003
Bode Magnitude Diagram
Frequency (Hz)
Mag
nitu
de (d
B)
10-7 10-6 10-5 10-4 10-3 10-2 10-1 100-120
-100
-80
-60
-40
-20
0
ASU accelerationattenuationcharacteristic
ASU velocityattenuationcharacteristic
Figure 5-8: Filter effect of the ASU.
Two test scenarios were considered:
1. Acquisition of the PST, i.e. the “Hold (Sub-) Mode” of the “Science Mode”. These simulationstake about several hundred seconds.
2. Steady state performance behaviour, i.e. the “Control (Sub-) Mode” of the “Science Mode”These simulations take typically 1.5 orbits.
5.3.2 Steady State Performance Results
The results of the steady state performance for the “baseline” design (two DFS) and the optionaldesign (one DFS) are summarised in Table 5-2, together with the performance requirements. It canbe seen that most requirements are met with the following exceptions:
� Optional control system with one DFS: The acceleration exceeds slightly the requirementhowever, at this stage this is not considered to be problematic.
� The angular rate around the Y and Z axis exceeds the requirement. The reason is the angularmotion that is caused by controlling the guide star in the centre of the PST central pixel, i.e. notconsidering / compensating any aberration effect caused by the spacecraft orbital motion.Remember that this strategy is necessary for sufficient accurate PST measurements (errordistribution). A time history is shown in Figure 5-9, which shows nicely the “deterministic” effect inthe Y and Z rates.
Since the original rate requirement specification is derived such that it corresponds to 1/10 of thecentral fringe, it might be possible to re-specify this parameter with a somewhat relaxed number say,30 % more, without affecting the operational environment of the ASU.

Astrium GmbH Page 31
File: HYP-9-04_v10.doc Date: 25.06.2003
Table 5-2: Drag-free and attitude control simulation results.
Figure 5-9: Simulation time histories.
Astrium GmbH Page 32
File: HYP-9-04_v10.doc Date: 25.06.2003
5.3.3 Further Results and Implications
Transitions from Primary to Secondary AOCS
With initial conditions of 1 arcsec/sec and 15 arcsec in rate and attitude, the transition from thePrimary AOCS to the Secondary AOCS was demonstrated. The initial rate is a factor of 5 larger thantypical steady state rates of the Primary AOCS, based on a 3-axis star tracker. The PST field of viewis �25 arcsec.
Drag-Free Sensor Usage
It is shown that attitude control can be implemented based on PST attitude information only. Drag-freesensor information is not required for attitude control (angular acceleration).
Number of Drag-Free Sensors
Simulations demonstrated that the drag-free control is possible with only one drag-free sensor, usinga gravity gradient model to place the drag-free point. This gives a potential for either mass savings orredundancy.
Normal PST Measurement Distribution
Evaluation of the simulation time histories shows that the PST error remains approximately normallydistributed (with guide star controlled to the centre of the CCD). This validates the assumption appliedfor the overall performance breakdown.
Rate Error due to Aberration
The orbital motion creates an “inertial” rate that exceeds the requirement specification. The latter hasto adapted in the future. This change of the operational envelope should have no impact on the ASUfunction and performance.
Robustness
The control system shown insensitive behaviour to parameter uncertainties such as:� mass properties, including products of inertia� 10 % thruster mismatch, which leads to coupling between linear and angular motion� environment disturbances and spacecraft magnetic dipole directions� variation of the distance between spacecraft CoM and drag-free point (5 – 10 cm)� maximum PST centroiding error
Drag-Free Sensor Bias
The drag-free control with a bias of 10-5 m/sec2 is not feasible, since thruster saturation “weakens” theattitude control in the Y and Z axes.
A bias of 10-7 m/sec2 is feasible technologically and from a control point of view. It adds another 50micro-N force demand per thruster (in one axis only, since the bias is caused by the gold wirenecessary for discharge).
Optionally, in order to avoid additional force demand (maximum thrust), low frequency accelerationbiases can be “filtered out” in the closed loop control system. This means that low frequencies will notbe controlled by drag-free control, but by the ASU phase correction mechanism. However, this leads

Astrium GmbH Page 33
File: HYP-9-04_v10.doc Date: 25.06.2003
to an initialisation problem of the drag-free control filters and long transients.
5.4 Component Technology
Two elements of the Secondary AOCS that are most demanding from a technological point of view:the drag-free sensor and the micro-propulsion system. The requirements for these components withrespect to the HYPER specific application are compared with the requirement specifications formissions currently under development (GOCE and SMART-2).
5.4.1 Drag-Free Sensor
The GRADIO sensor to be flown on the GOCE mission meets all requirements with the following twoexceptions:
� No data for launch load data was available
� The constant bias part must be improved in order to minimise the maximum thrust demand. Avalue in the range of 10-7 m/sec2 seems to be achievable. It is limited by the gold wire necessaryfor the test mass discharging.
5.4.2 Micro-Propulsion
Both, Indium and Caesium FEEPs could be applied for the HYPER mission considering specificationsof these systems. Minor modifications with respect to GOCE and SMART-2 are necessary, such asdifferent thruster arrangement and slight increase of thruster actuation frequency. However, this is notconsidered to be an issue.
In order to assess the performance results rather than dealing with specifications, lifetime tests andqualification programs of the FEEP options have to be monitored at suitable intervals.

Astrium GmbH Page 34
File: HYP-9-04_v10.doc Date: 25.06.2003
6. Configuration, Mass, and Power
6.1 Configuration
The complete spacecraft configuration is sketched Figure 6-1. Moreover, it can be seen that it iscompliant with a Rockot fairing.
Figure 6-1: Spacecraft configuration and Rockot fairing.
6.2 Budgets
6.2.1 Mass
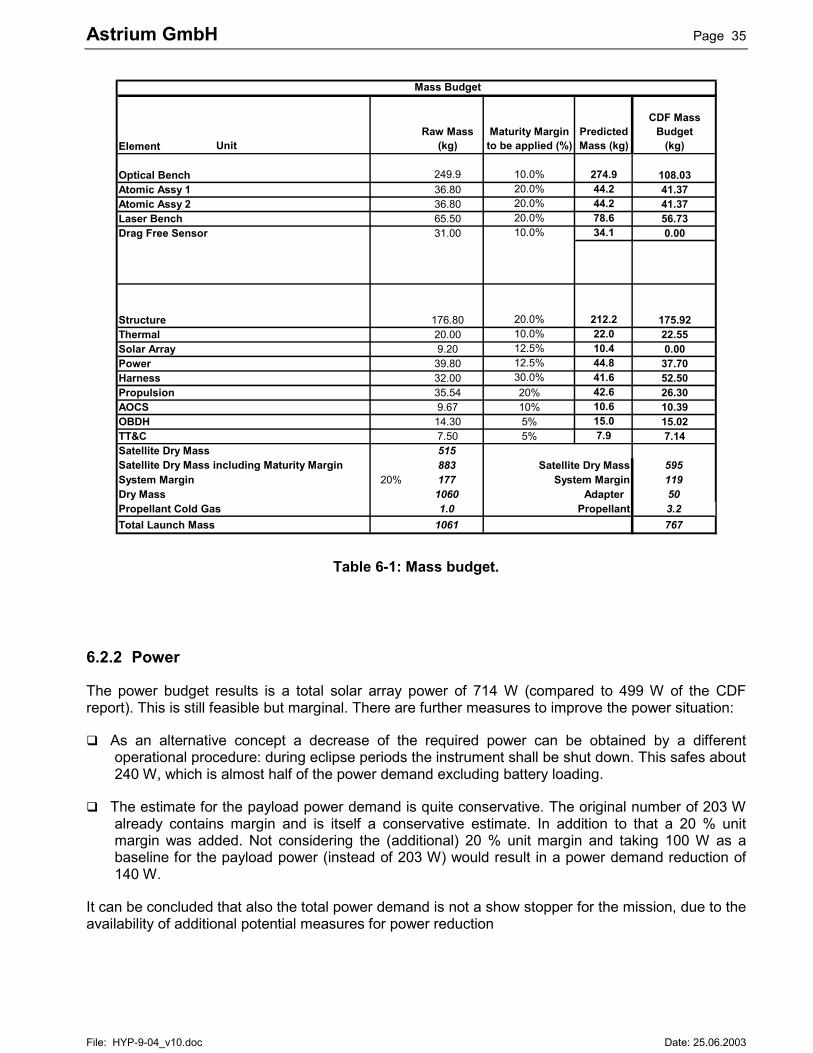
A condensed mass budget is shown in Table 6-1. Margins are applied to the different elements aswell as an additional system margin of 20 % is used.
The total mass of 1061 kg represents a slightly negative margin. However, considering the uncertaintyof the data at this stage and the safety factors applied for the compilation of the mass budget, it canbe concluded that total mass is not a show stopper for the mission.
Astrium GmbH Page 35
File: HYP-9-04_v10.doc Date: 25.06.2003
Mass Budget
Element UnitRaw Mass
(kg)Maturity Margin
to be applied (%)Predicted Mass (kg)
CDF Mass Budget
(kg)
Optical Bench 249.9 10.0% 274.9 108.03Atomic Assy 1 36.80 20.0% 44.2 41.37Atomic Assy 2 36.80 20.0% 44.2 41.37Laser Bench 65.50 20.0% 78.6 56.73Drag Free Sensor 31.00 10.0% 34.1 0.00
Structure 176.80 20.0% 212.2 175.92Thermal 20.00 10.0% 22.0 22.55Solar Array 9.20 12.5% 10.4 0.00Power 39.80 12.5% 44.8 37.70Harness 32.00 30.0% 41.6 52.50Propulsion 35.54 20% 42.6 26.30AOCS 9.67 10% 10.6 10.39OBDH 14.30 5% 15.0 15.02TT&C 7.50 5% 7.9 7.14Satellite Dry Mass 515
883 Satellite Dry Mass 595System Margin 20% 177 System Margin 119Dry Mass 1060 Adapter 50Propellant Cold Gas 1.0 Propellant 3.2Total Launch Mass 1061 767
Satellite Dry Mass including Maturity Margin
Table 6-1: Mass budget.
6.2.2 Power
The power budget results is a total solar array power of 714 W (compared to 499 W of the CDFreport). This is still feasible but marginal. There are further measures to improve the power situation:
� As an alternative concept a decrease of the required power can be obtained by a differentoperational procedure: during eclipse periods the instrument shall be shut down. This safes about240 W, which is almost half of the power demand excluding battery loading.
� The estimate for the payload power demand is quite conservative. The original number of 203 Walready contains margin and is itself a conservative estimate. In addition to that a 20 % unitmargin was added. Not considering the (additional) 20 % unit margin and taking 100 W as abaseline for the payload power (instead of 203 W) would result in a power demand reduction of140 W.
It can be concluded that also the total power demand is not a show stopper for the mission, due to theavailability of additional potential measures for power reduction
Astrium GmbH Page 36
File: HYP-9-04_v10.doc Date: 25.06.2003
7. On-Ground Testing
For HYPER the following items are considered critical with respect to verification and testing:
� Secondary AOCS validation
� PST performance validation
� ASU-PST internal alignment stability validation
A possible approach for the alignment determination is to route a fraction of the Raman laserlight to the CCD of the PST. Such a built-in system could be maintained to be operatedduring flight in order to monitor alignment changes.
� ASU functional verification
Under a 1 g environment the ASU shows a completely different behaviour than in space. Afast drift mode has to be implemented / considered in the ASU design in order to allowfunctional testing on ground.
� ASU initialisation and calibration mode
The initialisation and calibration mode is virtually the same mechanism that has to be usedfor ASU internal phase correction at low frequencies (time constants > 8h).
The first two items can draw heritage from drag-free space missions under advanced preparation(Gravity Probe B, GOCE), while the latter three items are HYPER payload specifics, which shall betackled in the frame of a payload development program.
Astrium GmbH Page 37
File: HYP-9-04_v10.doc Date: 25.06.2003
8. Programmatics
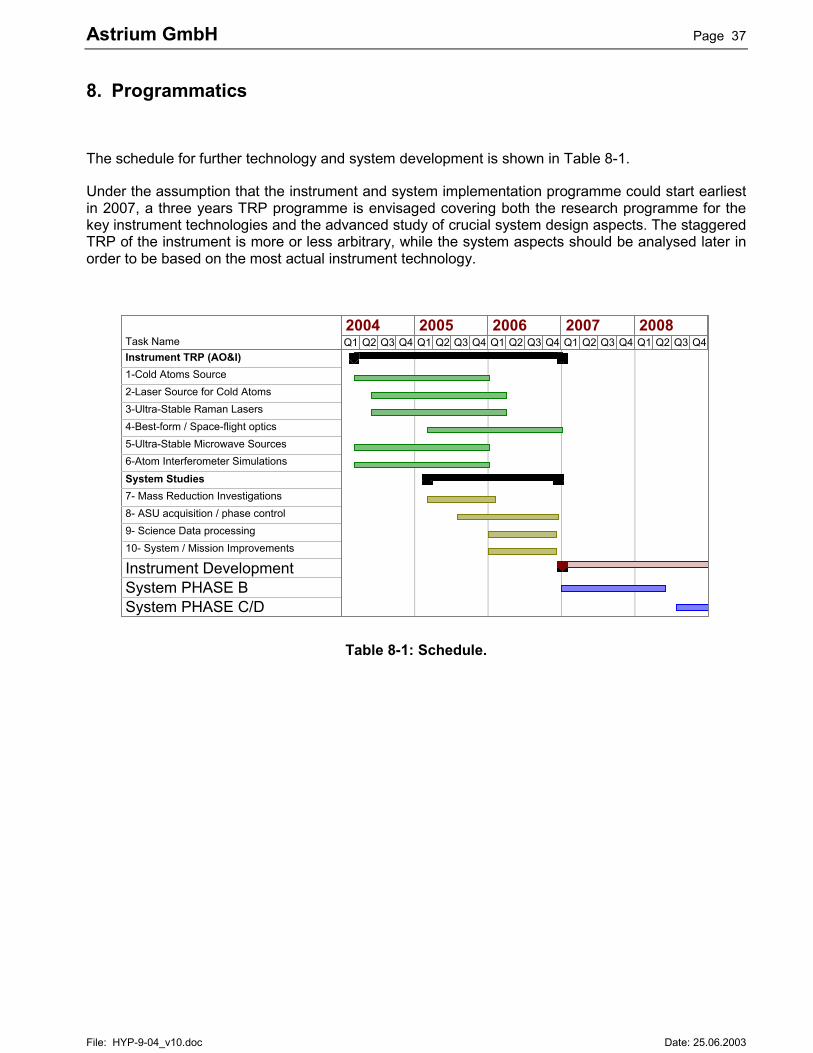
The schedule for further technology and system development is shown in Table 8-1.
Under the assumption that the instrument and system implementation programme could start earliestin 2007, a three years TRP programme is envisaged covering both the research programme for thekey instrument technologies and the advanced study of crucial system design aspects. The staggeredTRP of the instrument is more or less arbitrary, while the system aspects should be analysed later inorder to be based on the most actual instrument technology.
Task NameInstrument TRP (AO&I)1-Cold Atoms Source2-Laser Source for Cold Atoms3-Ultra-Stable Raman Lasers4-Best-form / Space-flight optics5-Ultra-Stable Microwave Sources6-Atom Interferometer SimulationsSystem Studies7- Mass Reduction Investigations8- ASU acquisition / phase control 9- Science Data processing 10- System / Mission Improvements
Instrument DevelopmentSystem PHASE BSystem PHASE C/D
Q1 Q2 Q3 Q4 Q1 Q2 Q3 Q4 Q1 Q2 Q3 Q4 Q1 Q2 Q3 Q4 Q1 Q2 Q3 Q42004 2005 2006 2007 2008
Table 8-1: Schedule.