hyperbolic discount functions, undersaving, and...
TRANSCRIPT

NBER WORKING PAPER SERIES
HYPERBOLIC DISCOUNT FUNCTIONS,UNDERSAVING, AND SAVINGS POLICY
David I. Laibson
Working Paper 5635
NATIONAL BUREAU OF ECONOMIC RESEARCH1050 Massachusetts Avenue
Cambridge, MA 02138June 1996
This work has been supported financially by the National Science Foundation (SBR-95- 10985)and the Alfred P. Sloan Foundation. I am grateful to Joshua S, White for excellent researchassistance. I have benefitted from conversations with Robert Barre, Roland Benabou, OlivierBlanchard, Casey Mulligan, Richard Zeckhauser and seminar participants at Boston College,Dartmouth, Harvard, Johns Hopkins, Ohio State, NBER, NYU, University of Arizona, andUniversity of Michigan. This paper is part of NBER’s research program in Asset Pricing. Anyopinions expressed are those of the author and not those of the National Bureau of EconomicResearch.
O 1996 by David I. Laibson, All rights reserved, Short sections of text, not to exceed twoparagraphs, may be quoted without explicit permission provided that full credit, including @notice, is given to the source.

NBER Working Paper 5635June 1996
HYPERBOLIC DISCOUNT FUNCTIONS,UNDERSAVING, AND SAV~GS POLICY
Studies of animal and human behavior suggest that discount functions are approximately
hyperbolic (Ainslie, 1992). I analyze an economy with complete markets which is populated by
hyperbolic consumers. I identify two ways in which this economy can be distinguished from an
exponential economy. First, hyperbolic discounting predicts the empirical regularity that the
elasticity of intertemporal substitution is less than the inverse of the coefficient of relative risk
aversion. Second, hyperbolic discounting explains many features of the policy debate about
undersaving. The calibrated hyperbolic economy matches Bemheim’s (1994) survey data on self-
reported undersaving, and predicts pro-savings government interventions like capital-income
subsidies and penalties for early withdrawal from retirement accounts. Hyperbolic consumers
are willing to sacrifice 9/10 of a year’s worth of income to induce the government to implement
optimal revenue-neutral saving incentives.
David I. LaibsonDepartment of EconomicsHarvard UniversityLittauer M- 14Cambridge, MA 02138and NBER

1 Introduction
Many governments are currently engaged in a policy debate about, savings.
This paper contributes to this discussion by developing and calibrating a
model which explores the role that self-control problems play in eli(:it,ing
suboptimal savings levels.
Self-control is an important source of undersaving. Individuals report
overwhelmingly that they save much less than they feel they should given th~’
private incentives they face (Bernheim, 1994). This kind of undersaving can
not be explained by capital taxation models (Charnley, 1986) or moral hazard
models (Hubbard et al, 1995) since these models assume that individuals
save optimally conditional on the private intent ives they face, For example, a
classical economic actor in an economy with inefficiently high capital taxation
rates might reason, “If the government lowered the tax rate on capital I would
accumulate more capital and I would be better off. But,, given th(’ inefi(:i[~nt,
tax environment that, I face, my capital accumulation plans are optimal.” By
contrast the sophisticated saver in my model would report, “R,f’gardlcss of
which tax regime the goverment adopts, I expect to experience a large gap
between my actual saving level and my normative saving level.” .Analysis
of this self-control problem provides a (luantitativ(: framework in whi(:h to
discuss both the normative and positive aspects of savings policy.
The centerpiece of my analysis is the hyperbolic discount function. R,e-
search on animal and human behavior has led psychologists to conclude (see
Ainslie (1992) and Loewenstein and Prelec (1992)) that discount functions
are generalized hyperbolas: events r periods away are discounted with factor
2

(1 + ar)-ylm, with a, ~ > 0. Such discount, functions imply a rnonotorli-
cally falling discount rate. This discount structure sets up a conflict between
t oday’s preferences and the preferences which will be held in the future,
implying that, preferences are dynamically inconsistent,. For cxarnplc, from
today’s perspective, the discount rate between two far off periods, t and t+ 1,
is a long-term low discount rate. However, from the time t perspective, the
discount rate between t and t + 1 is a short-term high discount rate. This
type of preference “change” is reflected in many common experiences. For
example, today I may desire to quit smoking next year, but when next year
actually roles around my taste at that time will be to postpone any sacrifices
another year.
Hyperbolic discount functions generate a preference structure which is a
special case of the general class of dynamically inconsistent preferences: i. {~.,
preferences which imply a conflict between the optimal contingent plan from
today’s perspective and the optimal decision from tomorrow’s perspective.
Robert Strotz (1956) was the first economist to study dynamically in(’orlsis-
tent preferences. Pollak (1968), Peleg and Yaari (1973), Goldman (1980),
and Schelling (1988) have extended Strotz’s work, arguing that when pref-
erences are dynamically inconsistent, dynamic decisions should be mo(lelled
as an intra-personal game among different temporal selves (i. e., today’s self
is rnodelled as a different player from tomorrow’s self).
Despite the availability of this analytic framework, and the substantial
body of evidence supporting hyperbolic discounting, few economists have
studied the implications of hyperbolic discount functions. 2 Phelps ~Ild Pol-
2Some economists have explained self-control problems \]sing mllltiple-self rnorlels which
3

lak (1968) analyze an inter-generational game in which each generation has
a discount function which I will argue below proves to be approxil~lat,[?ly
hyperbolic. Zeckhauser and Fels (1968) provide an alt,rusim-ba.scd micro-
foundation for the Phelps and Pollak preferences. Akerlof (1991) analyzt’s
the behavior of decision-makers who place a special premium on effort, made
in the current, period. Such a premium can be interpreted as a reflection
of hyperbolic discounting although Alkerlof interprets these
a salience effect,. Akerlof’s analysis is inconsistent with the
game approach as his decision-makers act myopically; they
the preference “changes” described above. Loewenstein and
preferences as
intra-personal
fail to foresee
Prelec (1992)
also analyze the choices of myopic decision-makers with hyperbolic discount
functions. Finally, George Ainslie, a psychiatrist, has studied the behavior of
sophisticated hyperbolic decision-makers (Ainslie (1992)), although his work
is primarily qualitative. My past work (Laibson 1995) and the analysis bc-
low formalizes, quantifies, and extends Ainslie’s analysis. This paper focusses
on the relationship between hyperbolic discount functions, undersaving, and
savings policy.
The paper is divided into six sections, including this introduction. Sec-
tion two lays out the formal model, describing the specific intra-persona,l
game of interest. Section two presents an approximately hyperbolic discount
function which includes the standard exponential discount structure as a
special case. Sect ion three characterizes the equilibrium path, discusses ob-
servational equivalence with an exponential economy, analyzes the relat,ion-
are not based on hyperbolic discollnting -- e.g., Thaler and Shefrin (1981), and Sch(:lling
(1984).
4

ship between risk aversion and intertemporal substitution, and calibrates t,h~’
model for consistency with Bernheim’s (1994) undersaving results. Section
four presents a menu of policies which address the undersaving problem. Sec-
tion five analyzes the welfare benefits of implementing these policies. Section
six concludes.
2 An individual’s consumption problem.
I model an individual as a composite of autonomous temporal selves, follow-
ing Strotz (1956), Pollak (1968), Peleg and Yaari (1972), Goldman (1980),
and Schelling (1984). These selves are indexed by their respective periods of
control, (t = O,1, 2, . . . , T), over a consumption decision. During its period
of control, self t observes all past consumption levels (CO,(:1,Cz, . . . . {:t_I), and
the current level of human and financial wealth W7~.(The wealth measure,
Wt, represents the sum of current financial wealth and the present value of
the stream of labor income.) Self t chooses a consumption level for period t,
which satisfies the restriction,
o<c~<w~.
Self t+ 1 then “inherits” wealth equal to,
w~+~ = R “(w~ – c~) (2)
where R is the gross real return on wealth, which is assumed to be fixed. q
The game continues, with self t+l in control. Finally, not{’ that in this game
(1)
3An ~ar]ier “er~ion of this paper allowed R to be chos~n
proved to be qualitatively and quantitatively little differentwith a fixed R.
endogenously. The r[?sultsfrom the results that, aris(’
5

the commitment solution discussed by Strotz (1956) is implicitly ruled out;
i.e., the current self can not commit future selves to a particular consump-
tion path. From the perspective of the time zero self, commitment, would
be optimal. However, commitment may not, be possible. The capacity to
commit depends on the contracting environment. If contracts are written at
period zero and there exist no opportunities to write new contracts (or spot,
markets on which to trade contractual obligations), then commitment, is pos-
sible. By contrast, if contracts can be renegotiated or traded in spot, markets
commitment will not be possible. Commitments I make today will be r(’nr-
gotiated by future selves who wish to undo those commitments. Moreover.
commitments can be unwound using third parties. For example, if I give all
my assets to bank A and instruct, it, to make payments to me on an annu-
ity basis, my future selves can use that stream of payments as collateral to
borrow from bank B, thereby undoing my initial commitment. With consid-
erations like this in mind, commitment is effectively impossible, motivating
the absence of commitment in the model.
Now it only remains to specify the payoffs of the “players)’ of this game.
Player t receives payoff
(3)
where d and ~ are discount parameters, and u(c) is a member of the class of
CRRA utility functions (with relative risk aversion coefficient p E (0, m)):
cl–p _ 1
u(c) = ‘l–p “
There are two reasons to focus on the preferences
motivation is that if u is in the CRRA class and @=
6
in e(luation 3. The first
1, the model reduces to
the familiar case of exponential discounting with time-additive hornothetic
preferences. Hence the @ # 1 case may be thought of as a perturbation to
the “standard” preferences used in macroeconomic models. If we care about
robustness we probably want to know what, happens when such perturbed
preferences are considered.
The second motivation is more important. There is a large body of evi-
dence that discount, functions are closely approximated by generalized hyper-
bolas: events ~ periods away are discounted with factor (1 + a~) ‘~/m, with
a, ~ >0.4 This observation was first made by Chung and Herrnstein (1961)
in relation to animal behavior experiments. s Their conclusions were later
shown to apply to human subjects as well (see Ainslie (1992) for a survey).
Hyperbolic discount ~unctions imply discount, rates that decline as the
discounted event is moved further away in time (Loewenstcin and Prelec,
1992). Events in the near future are discounted at a higher implicit discount,
rate then events in the distant future.
Given a discount function, ~(~), the instantaneous discount rate at time
~ is defined as,-f’(T)
f(r) “
Hence, an exponential discount function, J’ is characterized by a constant
discount rate, log(~), while the generalized hyperbolic dis(’ount function is
4See Loewenstein and Prelec (1992) for an axiomatic derivat,iorr of this discount,function.
‘Chung and Herrnstein claimed that the appropriate discount function is an exact,
hyperbola: events r periods away are discounted with factor ~. This corresponds to thelimiting case a = ~ + m.
7

characterized by an instantaneous discount, rate that, falls as ~ rises:
7l+~T”
Psychologists and economists ----notably Ainslie (1975, 1986, 1992), Prelcc
(1989), and Loewenstein and Prelec (1992) believe that such declining dis-
count rates play an important role in generating problems of s{:lf-rf:glllatiilrl.
When O < @ < 1 the discount, structure in Equation 3 mimics th[’
qualitative property of the hyperbolic discount function, while maintaining
most, of the analytical tractability of the exponential discount function. I
call the discount structure in Equation 3 “quasi-hyperbolic.” Note that the
quasi-hyperbolic discount function is a discrete tinlt~ function with values
{1, [Jd, @d’, @d’,...}. Figure 1 graphs the exponential discount function (as-
suming J = .97, ), the generalized hyperbolic discount function (assuming
a = 105, and ~ = 5 “103), and the quasi-hyperbolic discount function (with
P = .6 and 6 = .99). The points of the discrete-time quasi-hyperbolic fllnc-
tion have been connected to generate the smooth curve in Figure 1.
The preferences in Equation 3 were first analyzed by Phelps and Pollak
(1968). However, their choice of this structure was motivated in a differcut
way. Their game is one of imperfect intergenerational altruism, so the player-s
are non-overlapping generations of a dynasty. I assume that t,h[>diffcr(’nt
players are temporally distinct selves of a single per-son. My set-up also
differs because I assume the horizon is finite. Phelps and Pollak assuru(: an
infinite horizon which admits a continuum of equilibria (Laibson (1994)).
8

. 1’
0s
13ti
9P
bb
Zb
Ob
8&
9C
PC
ZE
0s
82
92 ;al
bZ >
22
02
91
91
til
21
OL
8
9
b
z
o

3
3.1
An Euler Equation, Intertemporal Substi-tution, and Undersaving
Equilibrium
In this subsection, I show that there is a unique subgame perfect equilibrium
in the finite-horizon game. I characterize that equilibrium and consider its
limiting properties as the horizon goes to infinity.
Proposition 1: FOR ANY FINITE-HORIZON GAME, THERE EX-ISTS A UNIQUE SUBGAME-PERFECT EQUILIBRIUM, THIS EQUI-LIBRIUM IS MARKOV PERFECT AND IS CHARACTERIZED BYTIME-DEPENDENT CONSUMPTION RULES WHICH ARE LINEARIN WEALTH.G
Proposition 1 is proven by applying a backwards indll(’tion argument.
(All proofs are consigned to the appendix.) Since the unique subgame perfect
equilibrium is a sequence of Markov strategies, we can write the equilibrium
strategy of self t in a T-horizon game as, ct (Wt, T). Proposition 1 also impli~~s
that Ct(Wt, T) is differentiable. Using these basic results, it is possible t,o
derive a generalized Euler equation which applies in the hyperbolic economy.
The following development is heuristic. Formal propositions follow.
The marginal benefit of postponing A % Ollnits of consumption generates
a stream of utility perturbations ~ron~,the perspecti~)e of self t. At time t,
A . u’(c~)
6Markov perfect ~qui]ibria have the property that equilibriuIn strategies depeIlci OI1lY~11
payoff-relevant state variables. See Fudenberg and Tirole, chpt. 13, for a formal definition.
9

utils are lost. At time t + 1
p.6.*Owt+l.R . A ‘ lfj’(c~+,)
utils are gained. Note that ~~,~j is the marginal consumption rate at period
t + j. At time t+2,
P.6’.$. (1-%)”R’. A - ?,J’(c,+’)
utils are gained, etc . . . . The net effect sums to,
Setting this expression equal to zero and dividing by 2
R’AI~’(Ct+i) . (4)
yields an Elllcr ~qlla-
tion.
.(ct)=PgJ*[~(l-* )]~.(.t+i)
Consider the analogous Euler equation for period t + 1:
(3)
Substitution of Equation 6 into Equation 5 yields the generalized Elder equa-
tion in Proposition 2.
Proposition 2: CONSIDER A T-HORIZON GAME. THE FOL-LOWING EULER EQUATION HOLDS ON THE UNIQUE EQUILIB-RIUM PATH.
[ (act+] (Wt+l, T) + ~ _ d(:t+,(w,,+,,T)u’(c~) = R6u’(c~+L) (j . aw,+~ aw,+, )1 (7)
10

This equation reduces to the standard Euler Equation when ~ = 1. iVhen
[j <1 the RHS of Equation 7 is greater than ~JRLf’(C,+l ), as the bracketed
term 011the RHS of Equation 7 is a weighted average of ~j < 1 and 1. H(IIICC
the “standard” Euler equation intuition on the cquilihrium consumption
path marginal utility today is equal to the gross interest rate multiplied by
discounted marginal utility tomorrow --- does not apply when preferences
are dynamically inconsistent. The breakdown of the intuition behind the
“standard” Euler equation occurs because on the equilibrium path self t gets
more marginal utility from incremental consumption in the distant fut)urc
than from incremental consumption in the near future. This arises because
the “overconsumption” of self t+ 1-- from the perspective of self t lowers
marginal utility at time t + 1 relative to marginal utility in future periods.
Proposition 3: THE EQUILIBRIUM CONSUMPTION RULE IS:ct(Wt, T) = ~~–tWt, WHERE THE SEQUENCE {~~}~0 1S GIVENBY THE RECURSION,
Aa+l =A~
[dR1-~(A2(@-1)+ 1)]:+ A,’(8)
WITH Jo = 1.
Proposition 4: As T + 00, CL(W,T) CONVERGES POINTWISETO THE FUNCTION ~*W, WHERE ~“ 1S THE UNIQUE SOLUTIONTO THE NON-LINEAR EQUATION:
A* = 1– (JR1-~)t [A*(p–l)+l]i (9)
11

Note that A* is also an equilibrium consumption rate in the infinite-
horizon game (Phelps and Pollak (1968)). However, it, is not the uniqllc
equilibrium consumption rate in that, game (Laibson (1994)).
Proposition 3 implies ac’+~~~” ‘T) = ~~-(~+1). Combining this observa-
tion with Proposition 2 implies that the generalized Euler Equation can be
expressed as:
U’(et) = R(5u’(et+,) [AT-(L+I)((~– 1) + I] . (lo)
Proposition 4 implies that as the horizon gets arbitrarily large (T ~ m),
this generalized Euler Equation converges to
u’(c~)= Rbu’(c~+~) [A*(O– 1) + 1] (11)
3.2 An Observational Equivalence Result
Equation 11 is closely related to the standard Euler equation in exponential
discounting models. Consider an economy populated by consumers with—
exponential discount factor 6. The Euler equation in this economy is:
u’(c~) = RFu’(ct+l).
Consider the inference problem of a misinformed econornetrician. ThcI
econometrician lives in the hyperbolic world analyzed above. But the ccono-
metrician believes that she is living in the exponential world introduced in
this subsection. The econometrician uses the data available to hcr to infer ~.
12

She calculates
5=—=IL’(et) 1
(–)
Ct+1 P
Ru’(c~+l) E “ c~(12)
The econometrician will not realize that she is estimating the wrong model,
since the hyperbolic world induces a constant value for ~. For exanl-fiu’(ci+l)
pie, if p = 3, C = .6, J = .99, and R = exp{r} = exp{.04}, (and the
econometrician independently observes the true p and R values), then our
econometrician will estimate
~ = u’(c~)Ru’(ct+l)
– 6[A*(~– 1) + 1] = .977
The second equality in the previous equation follows from Equation 11. The
estimated discount factor, ~ = .977, sharply contrasts with the actual onc-
period discount factor of P6 = (.6) . (.99) = .59. The economctrician will
radically misconstrue the preferences of the actors that, she is observing
With the exception of my choice of@ -- which is explained in subsection
3.3 -– I chose the parameter values listed above on a priori grounds. Th~:
coefficient of relative risk aversion, p is usually estimated to lie between 1
and 5, so I fixed p = 3. Survey respondents are approximately indifferent
between reward dates in the distant future, so I fixed 6 = .99 (see Barskey et
al 1995). In a Cobb-Douglas economy with capital share .36, capital-incornc
ratio 3, and depreciation rate .08, the competitive equilibrium int crest rate
is log R. = .04. These parameter values will be used to generate examples
throughout the paper. I refer to this as the benchmark calibration.
13

Benchmark Calibration1 1
~
p coefficient of relatlve risk aversion
For readers interested in exploring the implications of choosing other cali-
bration combinations, I have included a series of tables in an appendix. TalJlcI
1 presents values of ~ associated with a range of calibration choices. For all of
these calculations, I assume that, the econometrician can independently con-
firm the true value of R and p. The technology variable R is set to exp{ .04}.
Calibration values for the preference parameters ~ and J are listed in the
margins of the table. The table has three panels, corresponding to p valu~’s
one, three, and five.
The results of this subsection imply that the hyperbolic world with dis-
count parameters @ = .6 and J = .99 is “observationally equivalent” to
the exponential world with discount, factor ~ = .977. In this context obser-
vational equivalence means that an econometrician with consumption path
data could not determine whether the hyperbolic or exponential economy
generated that data. The rest of the paper explores some special propcrt,ics
of the two economies that would enable an economist to tell them apart.
3.3 Risk aversion and intertemporal substitution.
So far I have assumed that the economy under study exhibits no variability
in interest rates, either across time or across agents. Let’s jettison the latter
half of this assumption. We can then estimate the elasticity of interternporal
14

substitution (EIS) by measuring how the slope of the consumption path varies
as the interest rate r varies. Note that all of this variation is across agents.
Assume, for example, that we have a cross-section of countries with differ~?ut
capital taxation policies and hence different after-t ax ratf?s of return. 7
In the standard exponential economy described above, the elasticity of
intertemporal substitution is the inverse of the coefficient of relative risk
aversion. Specifically,
E1~ ~ dlog (~) 1
ar = ;“(13)
This well-known theoretical relationship is contradicted weakly by the avail-
able empirical evidence (see Hall (1988) and Carroll and Summers (1991) ).
Most empirical analysis suggests that the EIS is smaller than the inverse of
the coefficient of relative risk aversion.8 The hyperbolic economy is consis-
tent with this empirical regularity. Using Equation 11 to derive the EIS in
the hyperbolic model yields:
(14)
Note that when [j = 1 the EIS is equal to ~ which is the standard case
described above. However, when ~ < 1 the one-to-one link bc?twc[?n the
elasticity of substitution and p is broken.
7The results of this subsection would need to he modified if we identified the EIS off of
intertemporal variation in the interest rate, particularly if that variation were characterizedby high frequency transitory shifts in the level of the interest, rate. By contrast, the resultsof this subsection would continue to hold if we identified the EIS off of intertempor-alvariation characterized by relatively persistent changes in the level of the interest rate.
~This claim is somewhat controversial, If the coefficient of relative risk aV~rS~OIIisgreater than 10, then the data is consistent with the relationship EIS = ~. However,simple thought experiments suggest that risk aversion of that magnitude is problematic(Mankiw and Zeldes, 1991).
15

The first step in evaluating the EIS is to calculate ~ by totally differ-
entiating Equation 9. Substituting this into Equation 14 yields,
slog (~)~+~
[
(1 - p)(l - A“)
~r ‘p p 1-(~~-1)(1- A*)-p(A”([~-1) + 1) ‘~j - 1)” ’15)
Note that the numerator and the denominator of the bracketed term are
negative if p > 1.
Proposition 5: IN THE HYPERBOLIC MODEL,
EIS < ; IF p>l.
Proposition 6 provides a limiting result on the EIS.
Proposition 6: IF p >1, limfl+O EIS = 0.
Hence, if p >1, EIS can be made arbitrarily close to zero by choosing a low f~
value. By contrast, in the standard exponential model the EIS is insensitive>
to changes in the value of the discount function,
Finally, consider the benchmark calibration values introduced in the pre-
vious subsection: p = 3, (~ = .6, J = .99, and R = exp{r} = cxp{. [14}. Giv(’n
these parameters, EIS = .23 < ~ = ~. Table 2 (ill Appendix) considers a
range of calibration values. Note that Table 2 has two panels, corresponding
to p values three, and five. Other tables in this paper also include a pan~’1
for p = 1. This panel is excluded from Table 2 as p = 1 implies EIS = 1 (se~l
Equation 15).
16

3.4 Target Savings Rate
Phelps and Pollak (1968) analyze an economy with identical preferences (al-
though the actors in their economy are generations of a dynasty rather than
intra-personal selves). They find that the equilibrium savings rate is Par[’to-
dominated by savings rates that are marginally higher. Specifically, all dy-
nastic generations would be made better off if they would all perturb their
savings rates up. Equivalently, a multi-self interpretation of these preferences
would imply that all selves would be made better off if they would all perturb
their savings rates up.
I extend Phelps and Pollak’s analysis by asking how big these upward
perturbations should be. To do this I consider two normative savings rates for
the hyperbolic economy and contrast these savings rates with th~~equilibrium
savings rate,
For large T, the equilibrium savings rate in the hyperbolic economy is
s*=(~–l)–A*~R–1
(16)
Note that income in period t is (R – 1) . ~t_ ~, and consumption in period t
is A*. R. ~t_l. In this subsection, I compare the savings rate in Equation 16
to two normative definitions of target savings.
Definition I: NORMATIVE SAVINGS RATE I IS THE LIFETIMESAVINGS RATE TO WHICH SELF O WOULD COMMIT ITSELF ANDALL FUTURE SELVES.
Note that choosing a lifetime savings
lifetime consumption rate A. Equation 16
17
rate is isomorphic to choosing a
implies a one-t, o-one relationship
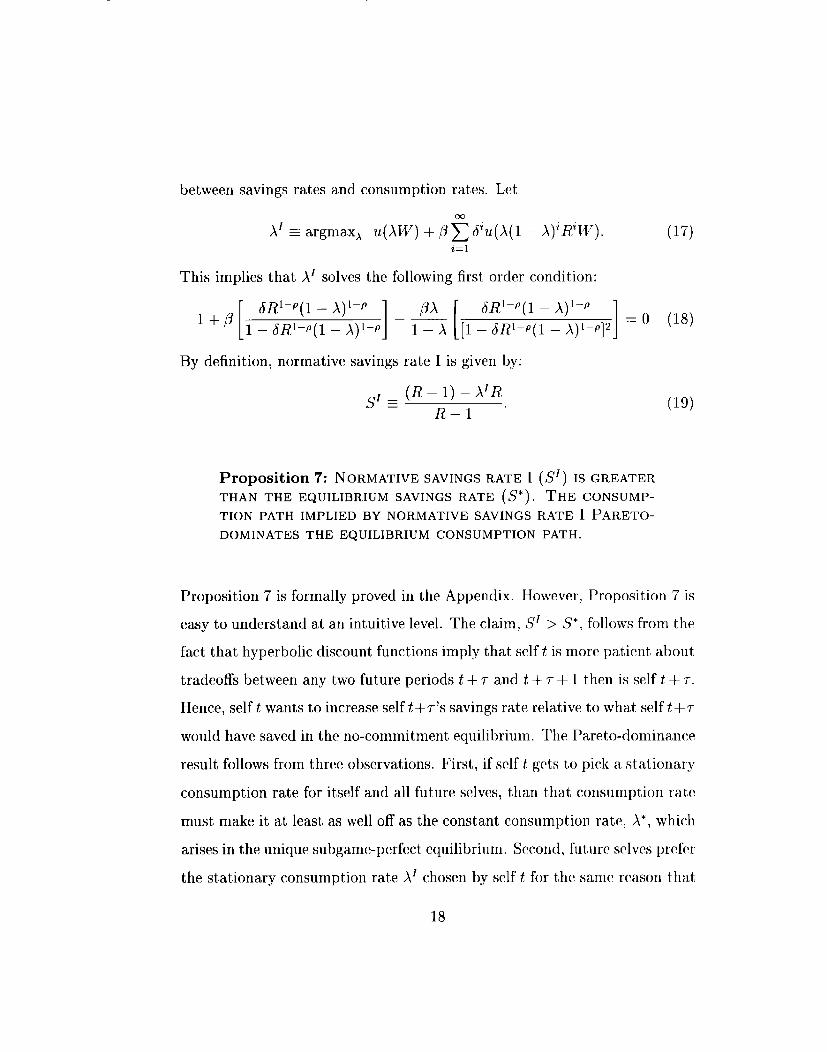
between savings rates and consumption rates. Let
(17)
This implies that ~{ solves the following first order condition:
By definition, normative savings rate I is given by:
S~=(R–l)–~~RR–1 “
(19)
Proposition 7: NORMATIVE SAVINGSRATE I (S]) IS GREATERTHAN THE EQUILIBRIUM SAVINGS RATE (S*). THE CONSUMP-TION PATH IMPLIED BY NORMATIVE SAVINGSRATE I PARETO-DOMINATES THE EQUILIBRIUM CONSUMPTION PATH.
Proposition 7 is formally proved in the Appendix. However, Proposition 7 is
easy to understand at an intuitive level. The claim, S1 > S*, follows from the
fact that hyperbolic discount functions imply that self t is more patient about
tradeoffs between any two future periods t + ~ and t + ~ + 1 then is self t + ~.
Hence, self t wants to increase self t+~’s savings rate relative to what self t+r
would have saved in the no-commitment equilibrium. The Pareto-dominance
result follows from three observations. First, if self t gets to pick a stationary
consumption rate for itself and all future selves, than that consumption rate
must make it at least, as well off as the constant consumption rate, A*, which
arises in the unique subgarne-perfect equilibrium, Second, future selves pr-ef(’r
the stationary consumption rate AI chosen by self t for the same rc?ason that,
18

self t preferred it. The future selves benefit additionally because they inherit
more wealth on the path associated with A’ since ~~ < A“.
Below, I consider a second normative savings rate, which turns out to be
close in value to normative savings rate I. Normative savings rate II is mor(’
analytically tractable than normative savings rate I and will be used in the
policy analysis contained in section 4 of the papc?r.
Definition II: NORMATIVE SAVINGS RATE II IS THE SAVINGSRATE TO WHICH SELF O WOULD COMMIT ALL FUTURE SELVES.
Let
(20)A1l = argmax~ $5 biu(~(l – J)i-l RiU”).‘2=1
It is straightforward to show that Ail = 1 – (JR~-o) ~. By definition, norma-
tive savings rate II is given by:
~11 = (~ – 1) – ~llR—R–1
(21)
Proposition 8: NORMATIVE SAVINGSRATE II (S1~) IS GREATER.THAN NORMATIVE SAVINGSRATE I (S~). IF ~~IS SUFFICIENTLYCLOSE TO ONE, THE CONSUMPTION PATH IMPLIED BY NOR-MATIVE SAVINGS RATE 11 PARETO-DOMINATES THE EQUILIB-RIUM CONSUMPTION PATH. IF ~ IS SUFFICIENTLY CLOSE TOZERO, THE CONSUMPTION PATH lMPLIED BY NORMATIVE SAV-INGS RATE II DOES NOT PARETO-DOMINATE THE EQUILIBRIUMCONSUMPTION PATH.
The benchmark
sir = .246. Hence,
calibration values imply S* = .133, S[ = .241, and
the gaps between the normative savings rates and tht’
19

actual savings rate are S1 – S* = .108 and SIJ – S* = .113. Proposi-
tion 7 implies that the consumption path associated with normative savings
rate I Pareto-dominates the equilibrium consumption path. Moreover, it,
is easy to quantitatively confirm that for the benchmark calibration values
the consumption path associated with normative savings rate II also Parcto-
dominates the equilibrium consumption path. This is not surprising given
the similar values that S~ and Srr take for the benchmark calibration.
Bernheim (1994) finds that, the median gap between U.S. baby boomf>rs’
self-reported “target” savings rate and their “actual” savings rate is ten p[:r-
centage points. 9 This reported savings gap matches approximately the sav-
ings gap predicted to arise in the calibrated hyperbolic economy. The match
resulted from the following procedure. First, I used a priori arguments to
fix 6 = .99, p = 3, and R = exp{.04}. Then I chose $ = .6 to generat[~ the
desired ten percentage point (.10) difference between SE and the two norma-
tive savings rates. Finally, note that ~ = .6 is consistent with experimental
evidence on one-year discount rates (see Ainslie (1992)). Table 3 num(?rically
evaluates the three savings rates -– S*, S1, and Sir -- for a range of other
calibration values.
gThe actual questions that Bernheim analyzes are:
What percentage of your annual household income do you think you should save forretirement? (“Target saving” )
What percentage of your annual household income are you now saving for retirement?(“Actual saving”)
These questions were posed to 1209 randomly selected individuals between the ages of 29
and 47.
20

4 Public policy
In this section I propose revenue neutral policy measures that implement, the
consumption path implied by savings rate S1l. I focus on implementation of
Sri because of analytical tractability. Little generality is lost as a result, of
this focus, given that S~ and S’rl are almost idt?nt,ical in value over the range
of reasonable calibration values,
The consumption path associated with S1l is expressed most naturally in
terms of the associated consumption rate J‘1. This consumption rate impli~’s,
Ct = A1lW’ and Ct+l = A~~R(l – ~~[)~. Hence, the slope of the consumption
path is given by,Ct+1— = R(I – A~~) (22)
Ct
I seek to implement the consumption path which 1) has slope R (1 – A’r),
and 2) is binding with respect to the economy’s budget constraint. I’ll refer
to this as the normative consumption path.
4.1 Delays
The normative consumption path can be implemented by requiring that con-
sumers choose their consumption level one-period before the consumption
actually takes place. Under this scheme, self t would be bound to a con-
sumption level Ct chosen at period t — 1. However, self t would be free to
choose any feasible consumption level for period t + 1. This scheme would
work like a bank account that requires advance notification for withdrawals.
Formally, this set-up is another intra-personal game. The only diffcrf’ncf’
between this game and our original game is that self t chooses consumption
21

for period t + 1 instead of choosing consumption for period t. I will refer to
this as the Advance Notification Game.
Proposition 9: IN THE ADVANCE NOTIFICATION” GAME, THE(UNIQUE) Asymptotic EQUILIBRIUM CONsuMPT1ON RATE 1s
4.2 Interest Subsidies and Penalties
The normative consumption path can also be implemented by a combinf’d
policy that penalizes over-consumption and subsidizes the rate of interest.
Any net, costs of this policy are assumed to be financed by a norl-clist(Jrti{~llary
tax. Consider the following specific scheme. The government penalizes agents
who dissave more than Awt, where A is set by the government. Assume that
the penalty is equal to p multiplied by the amount of excess dissaving (i. e.,
dissaving in excess of Awt ). Also assume that consumers face a subsidized
interest rate ~. > R. The government chooses A, p, and ~, to satisfy the
following three goals:
G1 The equilibrium consumption path coincides with the normative con-
sumption path.
G2 In equilibrium, Ct = ~W’t, implying that the penalty is never invoked on
the equilibrium path.
G3 It is impossible to lower p without either raising fi or violating conditions
one and two.
22

Condition two implies,Ct+l— = R(I –A).
Ct
Combining this with condition one implies,
R(l – J) = R(l - A’~).
This equality expresses ~ as a function of R (and the two known parameters
R and ~~f.) To evaluate the triplet {J, p, ~} it, is therefore sufficient to
identify the new parameters p and R.
The generalized Euler equation can be used to derive t,hc values of p and
~. In the presence of a penalty and a subsidized interest rate the generalized
Euler equation for period t becomes:
‘-t i act+z(1 -p)u’(et) = p ~ 6 ~
Consider the analogous Euler equation
i—1
H(~ _ ac~+.j
aw’~+j)]““(Ct+i) (23)
j=l
for period t + 1:
Substituting the latter equation into the former yit?lds:
[ ( W’t+l)l’25)(1 - p)u’(c,) = JRU’(C,) B*+ (1 - p) 1- *
Note that c1 = AW, C2= A(I –A)fiW, * = A, and R(1 –A) = R(l –Ail).
Proposition 10 follows by substituting these relationships into Equation 25
and simplifying the resulting expression.
23

l?rOPOSitiOn 10: G1-G3 ARE SATISFIED IF AND ONLY IF p
AND ~ ARE CHOSEN TO SATISFY,
Proposition 10 implies that the interest subsidy is decreasing in ~j and
decreasing in p. As @rises to unity, the self-control problem is mitigated and
the magnitude of the required interest subsidy falls. As p rises the penalty
alone becomes increasingly sufficient to solve the self-control problcm and
the magnitude of the required interest subsidy falls.
Assume that the government chooses a penalty of. 10 (the current, penalty
which applies to early withdrawals from most retirement accounts in the
U.S.). Then under the benchmark calibration, Proposition 10 implies that
to implement the normative consumption path the government needs to select
an interest rate subsidy of R – R = .015.
This combination of penalty and interest subsidy matches the penalty and
interest subsidy associated with existing U.S. ret iremerrt savings inst,rum~’nt,s
like 401K’s, IRA’s, and 403 B’s.1° All of these accounts have an explicit 10
percent penalty for early withdrawal, and these accounts generate an implicit
interest subsidy of approximately .0175 for a representative U.S. consumer.
To see this, consider the following intertemporal consumption transformation
10Note however t,hat there are important differences bet,ween the mechanism pr~p~sed
in this paper and savings inst,rllments like 401 K’S. First, the hypothetical savings schernt~s
proposed in this paper have no contribution caps. Second, while withdrawals from 401K’Sare penalized, failures to deposit an “appropriate” amount into the account, in the firstplace do not generate a penalty. The need to elicit deposits may explain tbc popularity ofprograms in which employers match the contributions of their employees.
24

which uses a tax-deferred retirement account, as the investm~?nt vehicle. A
consumer at time t cuts consumption by (1 —~) to fund a 401K investment,
of $1, assuming that r is the marginal tax rate. ]1 At, the end of T years, the
consumer withdraws the accrued value of that investment, exp{ (r + n) T},
where m is the inflation rate. The consumer then pays taxes of ~ cxp{ (r +
n) T}, and can therefore consume (1 —~) exp{ (r + n) T}, which has real vallle
(1 – ~) exp{rT}. Hence, the real rate of intertemporal transformation is:
; log(
(1 -~) exp{rT}
(1 -T) )= T.
By contrast, the real rate of intertemporal transformation when using a non-
tax-advantaged investment vehicle is:
~log(exp{(r+fl)(l – ~)T – TT}) = T(1 – ~) – m~.
Hence, the implicit interest subsidy is:
‘F – (T(l – T) – 7rT) = (T+7r)T.
If ~ = .25, r = .04, and n = .03 then the interest subsidy associated with
existing tax-deferred savings instruments like 401K’s is approximately .0175,
close to the optimal subsidy implied by the model, .015.
of course, other models explain why governments may want to “sub-
sidize” the after-tax return on savings. For example, Charnley (1986) has
shown that in an infinite horizon economy the optimal long-run tax rate on
capital income is zero. ‘2 My analysis provides an additional reason for in-
creasing the after-tax return on capital. In a general model which subsumes
11A $1 investment into a 401K plan generates a tax rebate of ~ dollars. Hence, to fund
a $1 investment, the consumer need only cut consumption by (1 – ~).1ZAiYagari (19g,5) argues that in an economy with incomplete markets, Charnley’s r~sults
are weakened.
25

both my arguments and those of Charnley, opt,imality requires a ne,gati~~e
long-run tax rate on capital income (i. e., a capital income subsidy). This
suggests that 401K’s insufficient y subsidize the return to capital, since t,hey
effectively implement a zero tax rate on capital incornc.
Proposition 10 has two natural corollaries. First, if the government
chooses to have no interest subsidy (i. e., ~ = R.), then p = 1 – [j. Sec-
ond, if the government, chooses to have no penalty (i. e., p = 0), then
R – ~ = ~-l (1 – ~)~~’~. For the benchmark calibration the interest subsidy
(in the absence of a penalty) is ~ – R = .021, Tabl[’ 4 evaluates the interest,
subsidy in the absence of a penalty for a range of calibration values.
5 Welfare analysis
In the analysis above I have proposed two normative savings rates, and shown
how public policy can (and perhaps partially does in the U. S.) implement,
these savings rates. In this section I evaluate the welfare benefits of inl-
plementing these policies. In the game-theoretic framework adopted in this
paper, welfare must be evaluated from the perspective of all s[?lves.
5.1 A welfare measure
My thought experiment considers the permanent adoption ---- starting at
time zero -- of one of the revenue-neutral policies described in the previous
section. I will refer to this as the intervention scenario. Recall that all of t,he
proposed policies implement the AI1 savings rate. Because I assume that, the
policy begins to take effect at time zero, the equilibrium path which arises
in the intervention scenario is equivalent to the consumption path induced
26

by fixing the consumption rate of all selves (including self 0) to ~~~.
Let Ut (W. [intervention) represent the utility of self t under the interven-
tion scenario, conditional on time zero wealth 1$70.Let ~t(~o Ino intervt?ntion)
represent the utility of self t under the no int[?rvention scenario, conditional
on time zero wealth W70.Note that under the no intervention scenario, I
assume that the schemes discussed in the previous section will not be im-
plemented by private actors. This market failure arises because the schcmcs
are vulnerable to t bird party arbitrage: any consumer who is engaged in
one of these schemes will have an incentive to use a third party to unwind
the scheme or arbitrage against the scheme unless the government ~?xplicitly
forbids such third party contracting. 13 If the legal environment, is set up to
prevent such arbitrage, then I will assume that the government is effectively
implementing the scheme. Define ~t such that:
~t (WOIno intervention) = ~t (WO . (1 – ~t) lintervention) (27)
Hence, Kt represents Self t’s willingness to pay (aS a pcrcent,agc of time zero
wealth) for the intervention policy.
Corollary to Proposition 8: IF ~ IS SUFFICIENTLY CLOSE TOONE, THEN ~t >0 FOR ALL t.
Proposition 11: THE SEQUENCE {tit}~o IS MONOTONICALLYSTRICTLY lNCREASING AND llmt+~ Kt = 1.
lslf ~ ~onsumer faces a penalty for early withdrawal from a retirement accollnt, the
consumer may borrow from a third party to facilitate immediate consumption therebyescaping the penalty. Likewise, if a consumer has access to a subsidized interest rate, theconsumer may borrow from a third party to exploit the subsidy.
27

Recall that ~t is a measure of self t’s welfare gains from intervention.
Proposition 11 implies that the welfare gains to self O are smaller than the
welfare gains to all future selves. Hence, whatever weighting function the
social planner uses, the welfare gains from the perspective of the social plan-
ner are bounded below by the welfare gains to self O. The remainder of this
section focuses on this lower bound.
5.2 Evaluating the lower bound.
Assume that an individual consumes at rate A and begins life with w(?alth
stock ~. Then the utility of self O is given by
Substituting for u(”) and simplifying yields,
(Aw)’-”
l–p [
1+
This implies that ~0 is equal to:
(28)
(29)
(30)
Dividing ~. . ~ by (R – 1) . ~ standardizes the consum[?r’s willingness
to pay by representing it as a fraction of current income. For the benchmark
case this normalized willingness to pay is quite large: .90. This implies that,
consumers are willing to forego ~ of a year’s worth of income to induce the
government to undertake the proposed revenue-neutral intervention. Table
5 evaluates fi for a range of parameter values.
28

6 Conclusion
Recall the benchmark calibration values: p = 3, ~~ = .6, J = .99, and
R = exp{ .04}. This paper considered several attributes of this “hyperbolic:”
economy. A few of these are reviewed here.
1) The slope of the consumption path of this economy is equal to the slept’
of the consumption path in a parallel economy with identical technology and
identical coefficient of relative risk aversion, but with exponential discounting
with discount factor .977. Hence a naive econornetrician might mistake the
hyperbolic economy for an exponential economy in which consumers have
relatively low rate of time preference: l-.977=.023.
2) The EIS in the hyperbolic economy is .233< ~ = ~. Hence, the hyperbolic
economy is consistent with the finding that the EIS is less than the inverse
of the coefficient of relative risk aversion.
3) The savings rate in the hyperbolic economy (S*) is .133 which is approx-
imately 11 percentage points below the target savings rate (Srr) which is
.246. Hence, the hyperbolic economy is roughly consistent with Bcrnheim’s
(1994) survey results, which find that there is a ten p[?rcentagc point gap
between actual savings rates and target savings rates.
4) A benevolent government could implement the target consumption path
by creating a system which penalized excess consumption and subsidized the
return on capital. Specifically, if the penalty were p = .1(1 of the amount of
29

excess consumption, then the interest subsidy would need to be ~ – R = .015
(assumed to be financed with non-distortionary taxes).
5) A benevolent government could implement the target consumption path
by ignoring the penalty altogether, and creating just an interest subsidy:
~ – R = .021 (assumed to be financed with non-distortionary taxes).
6) All selves would be willing to pay ~ of one year’s income (above and lJf’-
yond the non-distortionary taxes mentioned above) to induce the government
to implement one of the proposed savings schemes.
30

Appendix: Proofs and Tables
Before presenting the proofs, it is useful to establish some notation. Let
Ht be the set of feasible histories of the consumption game at, time t. An
}LtE Ht history is a t + l-element vector, (W’0, CO, CI, CZ, . . . . et-I) E Rt. Let,
H; represent the set of feasible histories at time t. Let H*” ht~ the s~?tof all
feasible histories. Let ~ : HF + [0, m) be the map from feasible histories
to asset stocks, such that ~(~o, co, cl, C2,. . . . Ct–l ) = R’w~ – ~~:j R’-~(:7.
Hence, ~(ht) is wealth available to self t after history ht. Represent the pure
strategy space of self t as,
Define the joint strategy space S s ~~0 St. Let Sp represent the set of
subgame-perfect equilibria of the consumption game. Finally, let ~J(s, t, 1)1)
represent the continuation payoff of self t, after history h,t, when strategy ,s
is played from time ~ forward.
Proof of Proposition 1: Let s: be a point in the strategy space of self t
T “ Hf~ + O,m). Suppose that, the T-horizonin a game with horizon T. So s,, . [
game has a unique perfect equilibrium. Also suppose that this cquilibriurn
has strategies of the form: s~(ht) = ~T_t~Tt, for all selves t E {0, 1,. ... T}.
Finally, assumeo < ~T-~ <1 forallt E {(),1,2,.. ., T–l}. Let, V(A,T+l) ~
~d~~=06tu(~~_t~t), where ~0 = A, and the rest of the JV, sequence is built
up recursively: ~~+1 = R(l – ~~–~)~t. It is easy to show 1~~(A, T+ 1) >0 and
VAA(A, T+l) <0 V A E (O,m), and liInA+O VA(A, T+l) = m. Now consider
31

the behavior of self O in a game with horizon T + 1. Since there is a unique
subgame perfect equilibrium in the sub.game that arises after self O’s choice,
self O chooses a consumption level to maximize, t~(co)+ V(R(WO – co), T + 1),
subject to the restriction O s co s ~.. The properties of ~f,(”)and V(, T + 1)
imply that this problem has a unique interior solution. It, is easy to show that
the chosen consumption level is proportional to, but less than, 14’~.HeIlco,
there exists a number A, O < ~ <1 such that CO= Awo VW70.Set AT+] ~ A.
The proof proceeds by induction. To start the induction, simply observe that
Ao=l. n
Proof of Proposition 2: Continuing the argument from the proof of Propo-
sition 2, note that in equilibrium the following condition holds for all t :
Note that V(~t+l, T – t) can be reexpressed, V(lt’~+l, T – t) =
~6u(c,+,(w,+,,T)) + JV(R(W,+,- c,+,(u~,+,,T)), T-(t + 1))
Taking a partial derivative, yields, VA(M’t+l, T– t) =
Finally substitute u~(ct+l ) for RVA (W’L+2,T–(t + 1))to get, the required result.
❑
Proof of Propositions 3 and 4: Recall that the proof of Proposition 1
shows that in a game with horizon T, the unique perfect equilibrium strategy
32

of self t is to consume at rate ~T_t. Given this observation, it is possible to
use Proposition 2 to characterize the consumption of self t in a T+l-horizon
game.
Note that Proposition 2 implies that the following eql~ation holds on the
unique equilibrium path of any finite horizon sl~bgame:
[
ac~(wt,~) j 1) + 1u’(c~–1)= R(5u’((:~) ~wt (/ - 1
Assume that the game has horizon T. Substitute in for U(), replace cl, with
~~-t~rt, and replace the partial derivative with J~_t. Solving for et_, yields,
c~–1 = A~_(t_l)P1’t_L,
whereA~-~
A~-(~_l) = (32)[6R1-~(A~_,(~ -1)+ 1)]:+ AT,
This implies that in a finite horizon game it is possible to calculate the equi-
librium consumption rate of today’s self from the equilibrium consumption
rate of tomorrow’s self. Another way of thinking about this is to say that, it
is possible to calculate self t’s equilibrium strategy in the T+ l-horizon game
if we know self t’s equilibrium strategy in the T-horizon game.
So far I’ve noted the following properties. First ct(~t, T) = A~_tJVt, both
on and off the equilibrium path, Second, the sequence of consumption rates
{~~}~0, follows the recursion,
AT+~= $(A,) =A,
[(5R’-~(Ar(p- 1) + 1)]+ + A,
Hence, to prove the Theorem it is sufficient to show that A, + J’.
33

In the argument which follows I’ll use the following properties of j(-),
which are straightforward to confirm.
● f(o)= o.
● j(.) differentiable on [0, 1].
● ~’(0) >1 (using technology assumption dRt’-~J < 1).
● ,)’(z) >0 on [0, 1].
● j(l) <1.
Let ~ = sup{~ I J E [0, 1], A = ~(~)}. There is at least one fixed point at
zero, so ~ exists. In fact, it is possible to show that ~ is strictly gr{?ater than
zero, This follows from the properties j(0) = 0, ,f’(0) > 1, j(. ) continuous,
j(1) < 1, and by application of the Intermediate Value Theorem. Finally,
~, + Xsince ~’(z) >0 on [0, 1], ~(l) <1, and AO= 1.
It only remains to show that ~ = J“. Recall that, ~ = ,~(~). Both sid~:s
of this equation can be divided by ~ since it has been shown that ~ > ().
Transforming the resulting equality it is easy to show that
This equation has a unique solution. ❑
Proof of Proposition 5: See text.
Proof of Proposition 6: If p >1, then
lim A’ = 1 – (6RL-P)fi <1.0+0
34

This result follows from Equation 9. Now, recall Equation 15.
slog (~):+~
[
(1 - p)(l - A*)
ar ‘p p 1-(8-1)(1-A*)-p(A*([J - 1)+1) (~~- 1)”
Since limc+o(l – A“) = (6R1-~) ~, the numerator and the denominator of
the bracketed term in Equation 15 both have finite, non-zero limits. Hence,
which simplifies to the required result. ❑ .
Proof of Proposition 7: Let
$(A) = U(A)+ DEJ’U(A(l - A)’R’),a=l
and let
g(A) = U(A)+ ~ 6ZU(A(1– A)~R~).2=1
Since, U(Z) = ~, j(~) can be represented,
j(A) = U(A)+ BAR’-’(1 - A)’-’g(A).
The first step in the proof of Proposition 7 is to show g’(~) <0 for all A
such that, A“ s ~ < ~ where ~ = sup{ ~lg(~) > –m}. To sign this derivative
over this domain it is helpful to note the following properties of g(.). First,
.90 has a unique local (and hence global) maximum at A = 1 – (dR1 ‘~) ~.
Second, since g(. ) is differentiable, ,9’(A) <0 if 1 – (6R1 ‘P) ~ < A < ~. Third,
1 – (JR1-@) ~ < J“. (This third point, is shown by noting: (a) the partial
derivative of the RHS of Equation 9 with respect to A is less than one; (b)
35

evaluating the RHS of Equation 9 at A = 1 – (dR1–fl) ~ yields a value which
is greater than 1 – (6R1-fl) t.) Combining observations yields, g’(A) < 0 if
A*< A<I.
The next step in the proof of Proposition 7 is to show
U’(A) – (1 – p)p6R1-f’(1 – A)-~g(A)<0
if J* < A < ~. First, note that ~~’(~)– (1 –p)~JR1-fl(l – ~)-flg(~) = O iff } =
A“. (This first point is shown by noting: (a) A’ is the unique linear symmetric
Markov equilibrium in the infinite-horizon game (Phelps and Pollak (1968));
(b) t~’’(~)– p(l – p)@6R1-P(l – J)-p-lg(x) <0, for all A, z; (c) the concavity
property stated in b) implies, u’(~) – (1 – p)~fiRL-fl(l – ~)-Pg(J) = O iff J
supports a linear symmetric Markov equilibrium.) Second, note that u’(A) –
(1 – p)~dR1-p(l – A)-”g(A) <0 if A* < ~ <~. (This second point is shown
by noting limx+X u’(~) – (1 – p)~dR1-~(l – ~) ‘fig(J) <0. Application of the
Intermediate Value Theorem implies that u’(~) – (1 – p)@JR’-o(l – ~)-flg(~)
can take on a positive value somewhere in the interval (A*,~) only if ?~’(~) –
(1 – p)~6R1-~(1 – ~)-~g(~) = O at some point in that interval. But,, this has
already been ruled out. )
Combining results yields,
f’(A) = U’(A) -(1 - p)[~JR1-’(l - A)-”g(A) + [jJR]-’(l - A)’-’,(A)A)<0
if A* s A < ~. This demonstrates A1 < A“. Pareto-dominance follows from
the fact that all future selves are made better off in two ways. First they
prefer the sequence of low A values that applies to their current and fu-
ture consumption choices, and second they prefer inheriting greater levels of
wealth as implied by the sequence of previous low ~ values. ❑
36

Proof of Proposition 8: Using the implicit function theorem it is possible
to show that equation 18 implies,
~<o.ap
Also note that when [~= 1 equation 18 implies,
This is sufficient to show that normative savings rate I is less than normative
savings rate II.
To show the Pareto-dominance result, I introduce the following notation.
Let U(A) represent the utility of self O, given that all selves (including self O)
consume at rate ~. I seek to show f(~) ~ ~(~~~) – U(A* (~)) > 0 when /~ is
close to unity. This notation is used to emphasize that, ~(~’ (~)) depends on
{~in two ways. First, ~ is a discount rate, so changes in ~~affect the valu~j of
future consumption. Second, [j is in the implicit equation which determines
~’. Note that ~ only influences U(A1l) through the former mechanism as ~~f
does not depend on ~.
The body of this proof characterizes the value of j(”) in a neighborhood
of @= 1. First, j(l) = O since A’(l) = Arz. To evaluate ~() at [j values just
below unity, I consider j’(l) and j“(l).
au(~JJ)f’(~) = a~ - a~$”) - a~~”) ~
Note that j’(l) = O, as wij.l = ~ ~j.l, and, ~ o.( = ~ [j.1 =
O. Tedious algebraic manipulations reveal that
j“(l) = :( A’’)-”(l - A“)(l - 2A”),
37

which is positive by (recall that ~~~ = 1 – (6R1-~)1/~). Given that ,~(1) = 0,
,f’(1) = O, and j“(l) >0, there exists an interval (@,1) such that j(~~) > ()
V ~ E (~, 1). Hence, for sufficiently large ~ <1, ~(~) is positive. This shows
that self Ois made better off by switching to the A1l path. Pareto-ciorrlirlanc:f’
follows from the fact that, all future selves are mad~? better off in two ways.
First they prefer the sequence of ~~~ values that applies to their current, and
future consumption choices, and second they prefer inheriting greater levels
of wealth as implied by the sequence of past Arr values. ❑
Proof of Proposition 9: Apply analogous arguments to the arguments
used to prove Propositions 1-4. First, let s: be a point in the strategy space
~ “ HL~l + [0, m), Suppose that,of self t in a game with horizon T. So St .
the T-horizon game has a unique perfect, equilibrium. Also suppose that
this equilibrium has strategies of the form: .s~(h,t) = ~T–(~+l)~’~”’~+l,for all
selves t E {O, 1, . . . . T – 1}. Finally, assume O < AT_(L+l) < 1 for all t ●
{0,1,2,... ,T – 2}. Let V(A, T+ 1) = ~d~~=l 6t~(~T-f~~), where i~’l = A,
and the rest of the ~t sequence is built, up recursively: ~~+1 = R,(I –AT_f )lVl,.
It is easy to show V,(A, T+ 1) >0 and V~~(A,T+ 1) <0 V A E (O, m),
and limA+O VA(A, T + 1) = 00. Now consider the behavior of self O in a game
with horizon T + 1. Since there is a unique subgame perfect equilibrium in
the subgame that arises after self O’s choice, self O chooses a consumption
level to maximize, ~~du(cl) + V(R(W1 – c1), T + 1),subject to the restriction
O ~ c1 ~ ~1. The properties of u(. ) and V(, T + 1) imply that, this problem
has a unique interior solution. It is easy to show that the chosen consumption
level is proportional to, but less than, WI, Hence, there exists a number A,
38

O < A < 1 such that c1 = AM71V~l. Set AT s A. The proof proce[?ds by
induction. To start the induction, simply observe that AO= 1. ❑ Note that
in equilibrium the following condition holds for all t :
ptiu’(c,) = Rv~(w’,+,,T-t).
Note that V(Wt+l, T – t) can be reexpressed, V(~~+l, T – t) =
pa’u(c,+,(wt+,, T))+ 6V(R(W,+,- C,+, (w,+,, T)), T-(t + 1))
Taking a partial derivative, yields, LL(~t+l, T– t) =
act+lOa’u’(ct+l)dw,+l
[ %1— +~RvA(~(~t+l–C~+I), ~–(t+ 1)) 1 –
Finally substitute @6u’(ct+l ) for RVA (Wt+2, T – (t + 1)) to find:
u’(c~)= JR74’(c~+l) .
Substitute in for u(”), replace et with ~~-t~t, and replace the partial deriva-
tive with A~_t. Solving for et-l yields,
c~–1 = A~_(~_l)wt_l,
where
(33)
Using the same types of arguments introduced in the proof of Propositions
3-4, it can be shown that limt+m ~T-~ = 1 – (6R1-~)~. •l
Proof of Proposition 10: See text.
39

Proof of Proposition 11: By Equation 29, Ut (WOIno intervention) =
(Aw,(l – A*)’R’)’-’ ~+ ~ 6R’-’(1 - A’)’-”l–p [ 1l–JRl-P(l–~*)1-P ‘
and Ut(~o(l – ~t)lintervention) =
(Aw,(l– K,)(l– Af~)’R’)’-’ l+D JR’-”(l– AJ~)’-”
l–p [ 1l–JR1-P(l–~rr)l-p
Tosolvefor~t set
Ut(~~lno intervention) =Ut(~o(l –~t)lintervention).
Tosolvefor~t+l set
Ut+l(~Olno intervention) =Ut+l(~o(l –~L+l)lintervention).
Dividing this last equation bythe previous one, yields,
(1 - A*) (1- K,)
(1 - A“) = (1 - K,+,)”
Since, A* < Ail (Proposition 8), ~t < ~t+l. ❑

Table 1: Valuesof~
Panel A: p = 1.
@ = .25 B = .50 p = .75 ~=1.oo
(5= .95 .826 .905 .934 .9506 = .97 .890 .942 .960 .970d = ,99 .961 .980 .987 .990
Panel B: p = 3.
~ = .25 p = .50 p = .75 /3= 1.00-
6 = .95 .910 .926 .939 .9506 = .97 .935 .949 .960 .9706 = .99 .961 .973 .982 .990
Panel C: p = 5.
b = .25 0 = .50 p = .75 @=l.oo
b = .95 .916 .928 .940 .950d = .97 .938 .950 .960 .970b = .99 .961 .972 .981 .990

Table 2: Elasticity of Intertemporal Substitution
Panel A: p = 3.
~ = .25 ~ = .50 p = .75 @=l.oo
6 = .95 .116 .204 .275 .3336 = .97 .115 .204 .275 .333h = ,99 .114 .203 .274 .333
Panel B: p = 5.
P = .25 p = .50 p = .75 [j= 1.00
J = .95 .061 .114 .159 .200J= .97 .061 .113 .159 .2006= .99 .061 .113 .159 .200

Table 3: SE, SI, S,[.
Panel A: p = 1
~ = .25 [~= .50 p = .75 [j= 1.00
(5= .95 -3.44,-.46,-.28 -1.43,-.34,-.28 -.67,-.30,-.28 -.28,-.28,-.2815= ,97 -1.81,,17,.23 -,49,.21,.23 -.01,.23,.23 .23,.23,.23(5= ,99 .01,.74,.74 .50,.74,.74 .66,.74,.74 .74,.74,.74
Panel B: p = 3
@ = .25 p = .50 [)= .75 p = 1.00 [d = .95 -.44,-.13,-.09 -.30,-.11, -.09 -.19, -.10, -.09 -.09, -.09, -.09
6 = .97 -.22, .05, .08 -.10, .07, .08 -.00, .07, .08 .08, .08, .08(5= .99 .00, .23, .25 .10, .24, .25 .18, .24, .25 .25, .25, .25
Panel C: p = 5
~ = .25 ~ = .50 [)= .75 [~= 1.00
d = .95 -.24,-,08,-,06 -.17,-.06,-.06 -.11,-.06,-.06 -.06,-.06,-.06(5= .97 -.12,.03,.05 -.06,.04,05 -.00,.04,.05 .05,.05,.05(5= ,99 .00,.13,.15 .06,.14,.15 .10,.15,.15 .15,.15,.15

Table 4: ~ – R
Panel A: p = 1
P = .25 B = .50 p = .75 p=l.~o
b = .95 .156 .052 .017 06 = .97 .094 .031 .010 0d = .99 .031 .010 .003 0
Panel B: p = 3
P = .25 p = .50 p = .75 p=l.oo
b = .95 .134 .045 .015 0d = .97 .113 .038 .013 06 = .99 .092 .031 .010 0
Panel C: p = 5
D= .25 p = .50 p = .75 p= 1.OCI“
(5=.95 .129 .043 .014 0h = .97 .117 .039 .013 0b = .99 .104 .035 .012 0

Table 5: fi
Panel A: p = 1
P = .25 p = .50 @ = .75 ,#=1.oo[
6 = .95 6.45 2.88 0.70 06 = .97 7.10 3.12 0.75 0b= .99 7.78 3.36 0.80 0
Panel B: p = 3
0 = .25 p = .50 p = .75 p=l.oo q
d = .95 4.78 1,51 0.32 0
6 = .97 4.89 1.54 0.31 0
6 = .99 4.99 1.57 0.27 0
Panel C: p = 5
P = .25 p = .50 [)= .75 p= 1.00
6 = .95 2.80 0.87 0.15 06= .97 2.81 0.87 0.15 0
6 = .99 2.86 0.93 0.21 0

References
Ainslie, George W. (1975) “SpeciousReward: ABehavioral Theory of Im-
pulsiveness and Impulsive Control.” Psychological Bulletin, 82, 463-96.
Ainslie, George W. (1986) “Beyond Macroeconomics, Conflict Among Inter-
ests in a Multiple Self as a Determinant of Value. ” in ,Jon Elster, cd.,
The Multiple Self, Cambridge: Cambridge University Press, 133-175.
Ainslie, George W. (1992) Picoeconomics, Cambridge: Cambridge Univer-
sity Press.
Aiyagari, S. Rae. (1995) “Optimal Capital Income Taxation with Incom-
plete Markets, Borrowing Constraints, and Constant Discounting,”
Journal of Political Economy, 103 (6), pp. 1158-1175.
Akerlof, George A. (1991) “Procrastination and Obedience.” American Eco-
nomic Revieu~, AEA Papers and Proceedings, 1-19.
Barsky, Robert B., F. Thomas (Juster, Miles S. Kimball, Matthew D. Shapiro
(1995) “Preference Parameters and Behavioral Heterogen(?ity: An Ex-
perimental Approach in the Health and Retirement Survey,” NBER
working paper.
Bernheim, B, Douglas. (1994) “Do Households Appreciate their Financial
Vulnerabilites? An Analysis of Actions, Perceptions, and Public Pol-
icy.” Mimeo, Princeton University.
46

Carroll, Christopher D. and Lawrence H. Summers. (1991) “Consumption
Growth Parallels Income Growth: Some New Evidence)” in B. Douglas
Bernheim and John B. Shoven eds., National Saving and Eco71,07nic
Performance, Chicago: Chicago University Press for NBER, 1991, 305-
43.
Charnley, Christopher. (1986) “optimal Taxation of Capital Income in Gen-
eral Equilibrium with Infinite Lives. ” Econometric 54: 607-622.
Chung, Shin-Ho and Richard J. Herrnstein. (1961) “Relative and Absolute
Strengths of Response as a Function of Frequ[:ncy of Reinforcement .“
Journal of the Experimental Analysis of Animal Behavior, 4, 267-72.
DeVilliers, P., and Richard .J. Herrnstein (1976) “Toward a Law of R,[Ispons~J
Strength.” Psychological Bulletin, 83, 1131-53.
Fudenberg, Drew and Jean Tirole (1991) Game Theory, Cambridge: MIT
Press.
Goldman, Steven M
ies, 47, 533-37.
(1980)“Consistent Plans.” Revie~u {~fEconomic Stud-
Hall, Robert E. (1988) “Intertemporal Substitution in Consumption.” JolLr-
nal of Political Economy, 96, 339-357.
Hubbard, Glenn R., Jonathan Skinner, Steve Zcldt?s. (1995) “Precautionary
Saving and Social Insurance.” Journal of Political Economy, 103, 360-
399.
47

Laibson, David I. (1993a) “Golden Eggs and Hyperbolic Discounting.” MIT
mimeo.
Laibson, David I. (1993b) “Mental Accounts, Self-Control, and an Intra~J-
ersonal Principal-Agent Problem.” MIT mimeo.
Loewenstein, George, and Drazen Prelec. (1992) “Anomalies in Intertem-
poral Choice: Evidence and an Interpretation.” Q~f,arterly ,Jo?LTrLal of
Economics, 57:2, 573-598.
Mankiw, N. Gregory and Stephen P. Zeldes. (1991) “The Consumption of
Stockholders and Nonstockholders.” Journal of Financial Economics,
29, 97-112.
Peleg, Bezalel, and Menahem E. Yaari, (1973) “On the Existence of a
Consistent Course of Action when Tastes are changing,” Revie?ll of
Economic Studies, 40, 391-401.
Phelps, E. S., and R. A, Pollak. (1968) “On Second-best, National Saving
and Game-equilibrium Growth. ” Revieu~ of Economic Stljdies, 35, 185-
199.
Pollak, R. A. (1968) “Consistent Planning.” Revie~L]of Economic SitLdies,
35, 201-208.
Prelec, Drazen. (1989)“Decreasing Impatience: Definition and Conse-
quences.” Harvard Business School Working Paper.
Schelling, Thomas C. (1984) “Self-Command in Practice, in Policy, and in
48

a Theory of Rational Choice,” AEA Papers and Proceedings. 74 (2),
pp. 1-11.
Strotz, Robert H. (1956) “Myopia and Inconsistency in Dynamic Utility
Maxim ization.” Review of Economic Studies, 23, 165-180.
Thaler, Richard H., and H. M. Shefrin, (1981) “An Economic Theory of
Self-Control,” Journal of Political Economy, 89 (2), pp. 392-406.
Zeckhauser, Richard and Stephen Fels (1968) “Discounting for proximity
with perfect and tot al altruism ,“ Harvard Institute of Economic R,e-
search, Discussion paper 50.
49