hypercam: hyperspectral imaging for ubiquitous computing ...€¦ · hypercam: hyperspectral...
TRANSCRIPT
HyperCam: Hyperspectral Imaging for Ubiquitous Computing Applications
Mayank Goel1,2, Eric Whitmire1, Alex Mariakakis1, T. Scott Saponas2, Neel Joshi2, Dan Morris2, Brian Guenter2, Marcel Gavriliu2, Gaetano Borriello1, Shwetak N. Patel1,2
1CSE, DUB Group University of Washington
Seattle, WA (USA) {mayankg, emwhit, atm15, gaetano,
shwetak}@uw.edu
2Microsoft Research Redmond, WA (USA)
{ssaponas, neel, dan, bguenter, v-marceg}@microsoft.com
ABSTRACT Emerging uses of imaging technology for consumers cover a wide range of application areas from health to interaction techniques; however, typical cameras primarily transduce light from the visible spectrum into only three overlapping components of the spectrum: red, blue, and green. In contrast, hyperspectral imaging breaks down the electromagnetic spectrum into more narrow components and expands coverage beyond the visible spectrum. While hyperspectral imaging has proven useful as an industrial technology, its use as a sensing approach has been fragmented and largely neglected by the UbiComp community. We explore an approach to make hyperspectral imaging easier and bring it closer to the end-users. HyperCam provides a low-cost implementation of a multispectral camera and a software approach that automatically analyzes the scene and provides a user with an optimal set of images that try to capture the salient information of the scene. We present a number of use-cases that demonstrate HyperCam’s usefulness and effectiveness.
Author Keywords Multispectral imaging; computer vision; sensing
ACM Classification Keywords H.5.m. Information interfaces and presentation (e.g., HCI): Miscellaneous.
INTRODUCTION Consumer-electronics devices are increasingly integrating different imaging sensors. As a result, cameras have become the go-to sensor in the research community, with many applications, e.g., health sensing [9,34], gesture recognition [26], augmented reality [1], etc. Despite the versatility of typical RGB cameras, they are still not always suitable for
certain applications; cameras are impacted by lighting, resolution, occlusion, etc. Consequently, the last decade has seen researchers looking to augment RGB cameras with non-visible imaging modes such as depth and thermal imaging. However, there is still information in the visual spectrum that is underutilized.
The human eye and RGB cameras divide visible light into three bands of color (although with slightly different spectral responses). When two materials look similar to the human eye, it only means that they share similar spectral properties when analyzed by the human trichromatic color vision system. They can still have very different spectral properties in some other part of the spectrum. Consequently, information in other bands spread throughout and beyond the visible spectrum remains indistinguishable to the human eye and RGB cameras. Hyperspectral imaging provides more dimensions that could enhance the utility of cameras as a general-purpose sensor. In fact, hyperspectral imaging is already being used in the food and agriculture industries [3,23,24], astronomy [16], and surveillance [33] because of its ability to expose features of an object difficult or
Permission to make digital or hard copies of all or part of this work for personal or classroom use is granted without fee provided that copies are not made or distributed for profit or commercial advantage and that copies bear this notice and the full citation on the first page. Copyrights for components of this work owned by others than ACM must be honored. Abstracting with credit is permitted. To copy otherwise, or republish, to post on servers or to redistribute to lists, requires prior specific permission and/or a fee. Request permissions from [email protected]. UbiComp '15, September 7-11, 2015, Osaka, Japan. Copyright 2015 © ACM 978-1-4503-3574-4/15/09…$15.00. http://dx.doi.org/10.1145/2750858.2804282
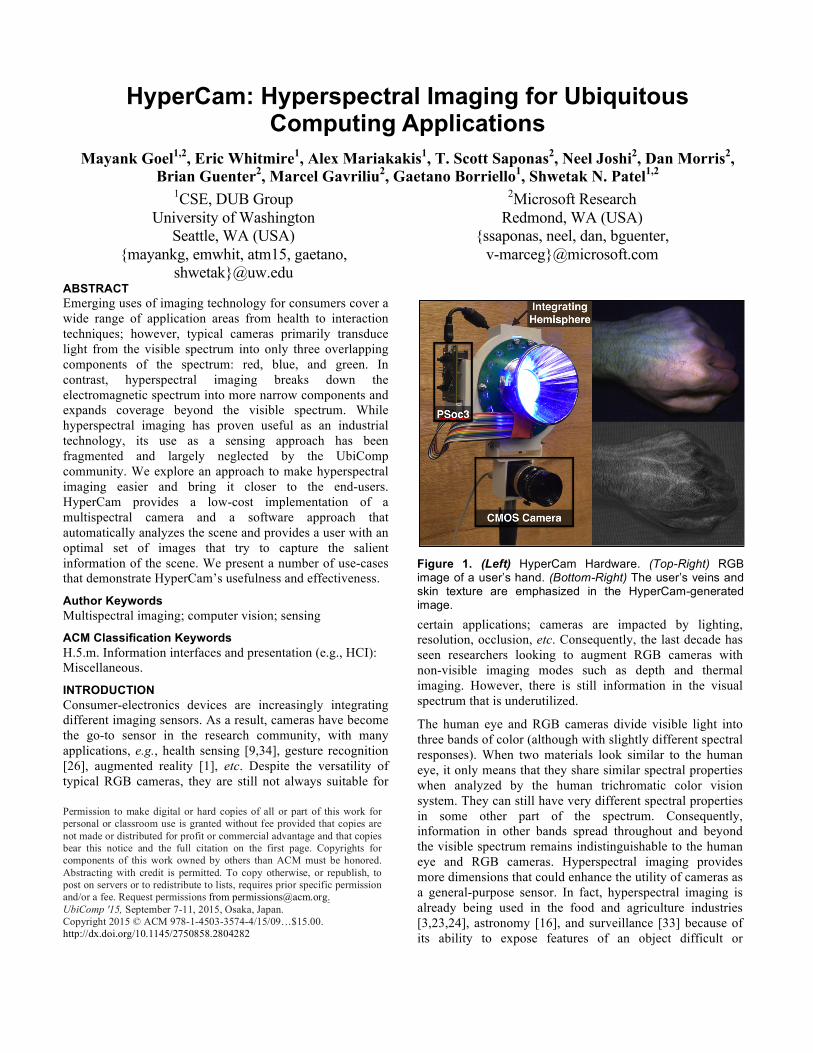
Figure 1. (Left) HyperCam Hardware. (Top-Right) RGB image of a user’s hand. (Bottom-Right) The user’s veins and skin texture are emphasized in the HyperCam-generated image.
impossible to detect with the human eye. One of the most common uses of hyperspectral imaging is in geological mapping [16]. Although hyperspectral imaging can “expose secrets of the universe” [5], detect hidden diseases [21], predict ripeness and probably even sweetness of fruits [3,23,24], the use of hyperspectral imaging has been highly fragmented. Furthermore, there has been very little exploration of hyperspectral imaging in the UbiComp community as a sensing technique.
In this paper, we present HyperCam, an approach that makes hyperspectral imaging easier to explore and implement. Specifically, we demonstrate a low-cost hardware implementation of a hyperspectral camera using time-multiplexed illumination and a software system that makes it substantially easier for the user to find the salient pieces of information for a particular scene. Since multispectral imaging inherently provides an expanded view of the spectrum, it can lead to an arbitrarily high number of spectral images for each scene. Digesting this much information becomes difficult and impedes the process of analyzing a scene. In such a situation, the user can benefit from HyperCam, as it automatically highlights salient aspects of a scene to provide a starting point for further exploration.
HyperCam first captures the relationships between different wavelengths of light by using a set of transformation techniques, including PCA and normalized linear combinations of the collected sequence of spectral images. The system then automatically analyzes this new set of images to determine what results would be “interesting” to the user. We define “interesting” images as ones that show information not visible in RGB alone. The system automatically adapts to each scene and requires minimal input from the user. Depending on whether the user is looking for spatial or temporal changes in a scene, HyperCam modifies its output accordingly. In the end, HyperCam provides the user with an optimal set of images that try to best capture the variability in the scene. For example, when a user places his or her hand in front of the camera, the system produces an image like Figure 1 (Bottom-Right). This image accentuates the user’s skin texture and vein patterns, which are not seen as prominently in the RGB image.
We demonstrate the utility of HyperCam on a few example applications: helping a user estimate the ripeness of certain foods and an interaction system that identifies users of a multi-user interface by analyzing the texture and venous structure of their hands. Finally, we discuss some challenges and limitations of our approach and multispectral imaging in general.
The specific contributions of this paper are:
1. A low-cost hardware implementation of hyperspectral imaging.
2. A software approach that makes it easy to find hidden aspects of different scenes.
3. A demonstration of our hardware and software through a couple of applications in different domains; and an overview of the opportunities and challenges of multispectral imaging for ubiquitous computing.
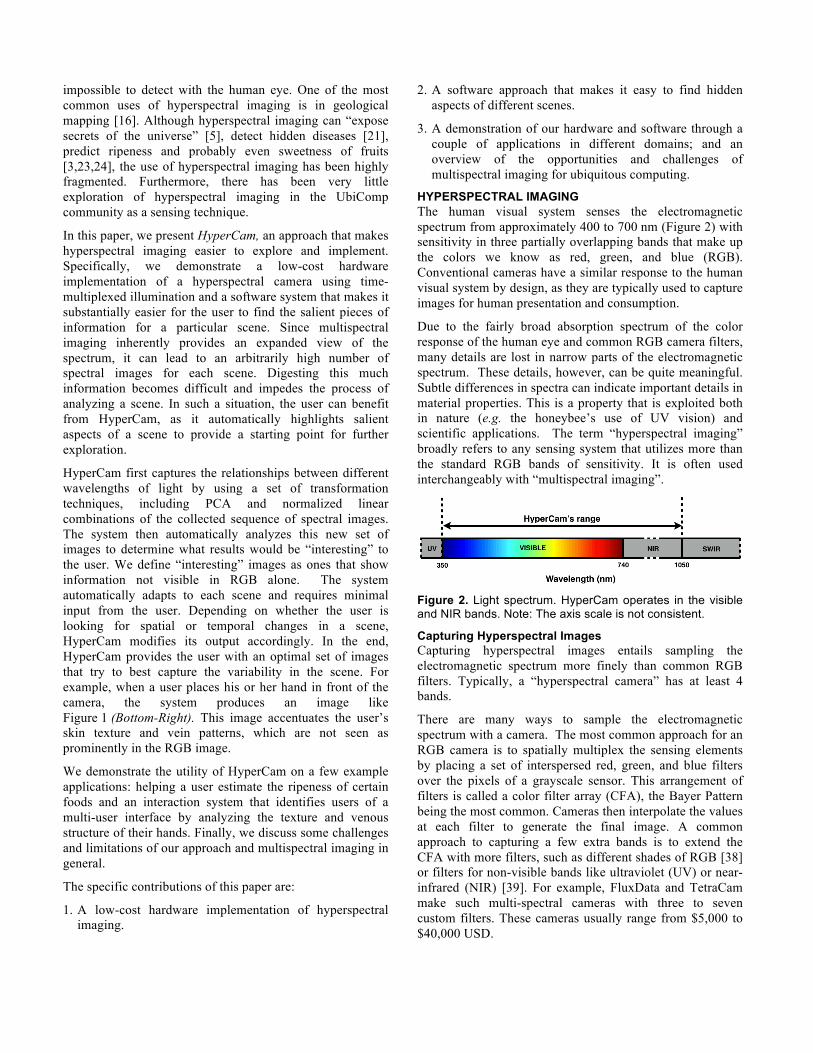
HYPERSPECTRAL IMAGING The human visual system senses the electromagnetic spectrum from approximately 400 to 700 nm (Figure 2) with sensitivity in three partially overlapping bands that make up the colors we know as red, green, and blue (RGB). Conventional cameras have a similar response to the human visual system by design, as they are typically used to capture images for human presentation and consumption.
Due to the fairly broad absorption spectrum of the color response of the human eye and common RGB camera filters, many details are lost in narrow parts of the electromagnetic spectrum. These details, however, can be quite meaningful. Subtle differences in spectra can indicate important details in material properties. This is a property that is exploited both in nature (e.g. the honeybee’s use of UV vision) and scientific applications. The term “hyperspectral imaging” broadly refers to any sensing system that utilizes more than the standard RGB bands of sensitivity. It is often used interchangeably with “multispectral imaging”.
Figure 2. Light spectrum. HyperCam operates in the visible and NIR bands. Note: The axis scale is not consistent.
Capturing Hyperspectral Images Capturing hyperspectral images entails sampling the electromagnetic spectrum more finely than common RGB filters. Typically, a “hyperspectral camera” has at least 4 bands.
There are many ways to sample the electromagnetic spectrum with a camera. The most common approach for an RGB camera is to spatially multiplex the sensing elements by placing a set of interspersed red, green, and blue filters over the pixels of a grayscale sensor. This arrangement of filters is called a color filter array (CFA), the Bayer Pattern being the most common. Cameras then interpolate the values at each filter to generate the final image. A common approach to capturing a few extra bands is to extend the CFA with more filters, such as different shades of RGB [38] or filters for non-visible bands like ultraviolet (UV) or near-infrared (NIR) [39]. For example, FluxData and TetraCam make such multi-spectral cameras with three to seven custom filters. These cameras usually range from $5,000 to $40,000 USD.
Often in hyperspectral imaging, one wants a much wider and finer sampling of the electromagnetic spectrum. This is difficult to achieve with CFAs, as it is hard to make narrow bandwidth color gels. The most common ways to acquire many dense spectral samples are to use diffraction gratings, prisms, time-sequenced narrowband filters, or time-sequenced illumination.
The first two approaches are the most basic and use a different form of spatial multiplexing than CFAs. A diffraction grating or prism will split an incoming ray of light such that the spectral components are physically separated in one dimension. To use this approach in a camera, the grating or prism is placed such that one dimension of the sensor samples one spatial dimension while the orthogonal dimension captures the spectral information [40]. This type of camera is called a line-scan camera, as it can only image one line at a time. To capture an image, one would sweep such a camera across the scene to get a 2D image.
While line-scan cameras have their uses and benefits, such as very dense spectral sampling, they are not ideal for applications that need to acquire 2D images rapidly and accurately. The most common approach for capturing 2D images is to time-multiplex the spectral sensing. This can be done in two ways, passively and actively.
The passive approach is to capture images through a set of narrow filters that are changed over time. This is typically done by spinning a wheel using a servomotor [7]. The active approach is to use multiple narrowband illumination sources and switch between them as required [22].
There are various trade-offs between the two approaches. The precision and speed with filter-wheels and servomotors in passive approaches can be limited by the RPM and the precision of the motor. Such systems are also harder to miniaturize. However, the biggest concern that is often overlooked is that the spectral response of narrowband filters varies with the angle of incidence of light, which is not constant in typical camera systems unless specifically designed with special optics [13]. In contrast, the active approach is limited by the intensity of the ambient illumination and the power needed to overcome it. It is also challenging to create very narrowband illumination, thus reducing spectral precision. In addition, using different light sources requires careful alignment to ensure even illumination and prevent inconsistent shadows and highlights.
Recently, Apple® has started using two time-multiplexed light sources, a white LED and a “skin-tone” LED, on their smartphones to accurately reproduce skin colors in low-light conditions. It serves as a demonstration of how multiple light sources can be aligned properly in a consumer product and ensure consistent scene reproduction.
There has been recent interest in multi-spectral imaging on mobile devices. Eigen Imaging Inc.1 modifies off-the-shelf mobile devices to remove the camera’s infrared (IR) filter. The company provides different narrowband filters that the user can put in front of their cameras to explore the UV or IR aspects of a scene.
RELATED WORK
Applications of Hyperspectral Imaging Hyperspectral imaging has largely been used for remote sensing, surveillance, and industrial applications, where the spectral signatures are used to differentiate between materials. Remote sensing is one the most popular uses of hyperspectral imaging. GLIMS uses satellite imagery to analyze glaciers’ extent and changes [16]. Researchers have also used hyperspectral data from satellites to predict landslides [33]. They monitor vegetation and land cover from hyperspectral images and then make models to robustly predict the landslide susceptibility of an area. In areas where the vegetation covers less than 40% of the area, soils and rocks make it hard for traditional imaging techniques to accurately predict vegetation cover [31]. Hyperspectral imaging helps in such situations because green vegetation has a distinct reflectance spectrum in the visible as well as the near-infrared (NIR) region.
Another very popular area for the use of hyperspectral imaging is non-invasive analysis of works of art [2]. It can be used to infer the painting techniques of different artists and detect forgeries. Relatively recently, NIR imaging and spectroscopy has also gained popularity for applications in physiological sensing. For example, biomedical researchers are working on imaging approaches to accurately measure blood glucose levels [10,18].
Infrared-Imaging-based HCI and UbiComp Systems A number of camera-based gesture detection systems have used NIR to illuminate the scene for effective detection and segmentation of a user’s hands. The reason such systems use IR light is because IR is invisible to the user and does not hamper the experience. Such a technique is common for rear projected vision systems such as HoloWall [25], PlayAnywhere [36], and Digits [17]. Numerous HCI projects around novel user interfaces have used skin’s higher reflectance to segment a user’s hands from rest of the scene [30]. While it has proved to be very useful, there are many objects around us that have high reflectance in the NIR region. One of the advantages of hyperspectral imaging is better image segmentation. A hyperspectral imaging system generates more than three data points for each pixel. It generates a spectral power distribution for each pixel of the scene. Therefore, the system has more data and potentially higher probability of finding differences between different objects in a scene. One way the confusion between hands and other objects can be avoided is by leveraging the fact
1 www.eigenimaging.com
that almost all human skin has a reflectance dip around 970 nm [14]. This information can improve the performance of hand segmentation systems significantly. This is just one example of the kind of advantages a hyperspectral imaging system can provide to ubiquitous computing and human-computer interaction systems.
Apart from using NIR, many interactive systems have used the far-infrared (FIR) spectra as well, a technique known as thermal imaging. HeatWave [20] used thermal and depth imaging to enable gestures on arbitrary surfaces. It also enabled hover and pressure-based gestures. Shirazi et al. [30] have explored the thermal reflectivity of different surfaces for interaction with arbitrary projected surfaces. Researchers have also used thermal imaging for illumination-invariant facial recognition [19]. More recently, thermal imaging has also been used in the UbiComp community for disaggregating energy usage [11].
HARDWARE DESIGN For most multispectral imaging applications, it is desirable to have a high spatial resolution hyperspectral camera that can take 2D images. There are surprisingly few off-the-shelf hyperspectral cameras; the ones that exist are quite expensive (upwards of $5,000 USD) and usually do not have a high spatial resolution. Thus, we decided to build our own high resolution, time-multiplexed multispectral imaging system.
HyperCam (Figure 1) is a general-purpose hyperspectral imaging system for visible and NIR wavelengths. We chose to use the PointGrey Flea3 FL3-U3-13Y3M CMOS camera. It is sensitive from 350 nm to 1080 nm, with peak quantum efficiency at 560 nm. This camera has a frame-rate of 150 FPS and a maximum resolution of 1280×1024. Considering we time-multiplex the spectral bands, we can capture between 9-150 FPS, depending on the number of wavelengths used. HyperCam currently has 17 different bands of spectrum, so if an application needs all 17 bands, then the effective frame-rate for the camera is 150÷17 ≈ 9 frames per second.
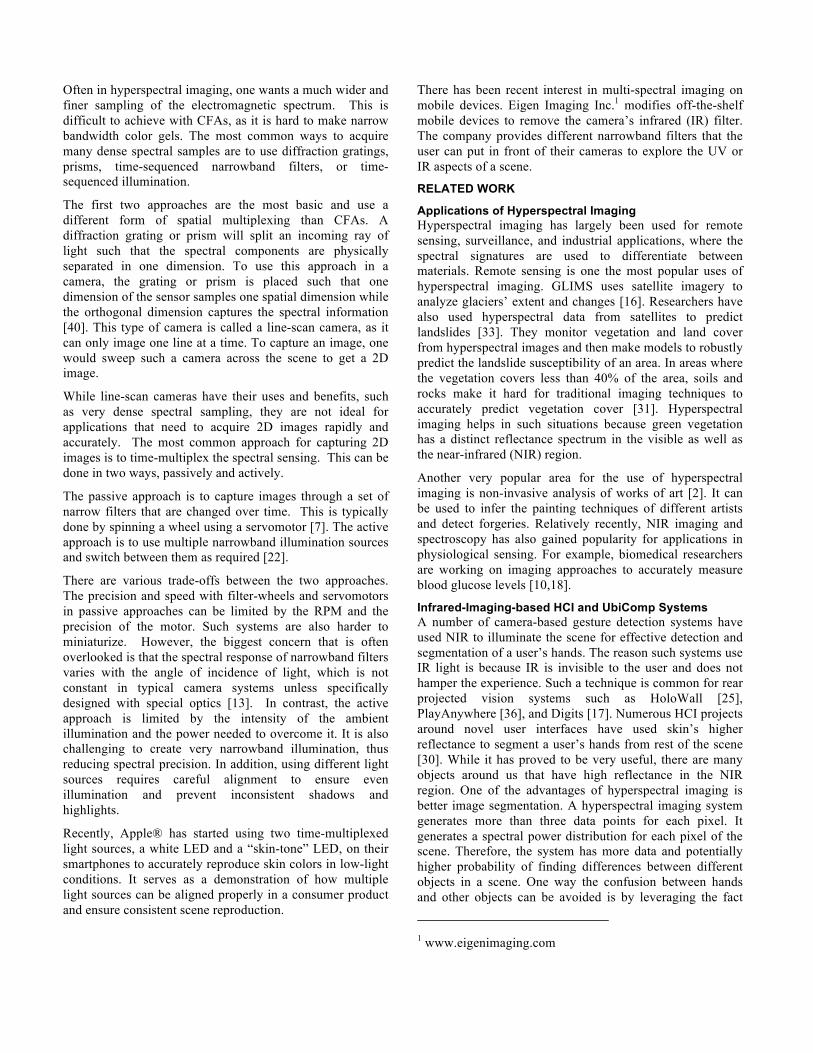
Figure 3. Power spectral distribution for the LEDs on HyperCam. The color of the curve corresponds to the color of the wavelength. Black color denotes the infrared wavelengths.
We use 17 different spectral bands that are created using narrow band LEDs. The wavelengths for these LEDs vary from 450 to 990 nm. These are off-the-shelf LEDs,
empirically selected to cover the camera’s sensitivity range. Figure 3 shows the power spectral distribution for the selected LEDs. Ideally, each response would be narrow in order to capture the reflectance of only a single band of color. However, there is a tradeoff between LED response width, sampling density, and light efficiency. Additionally,
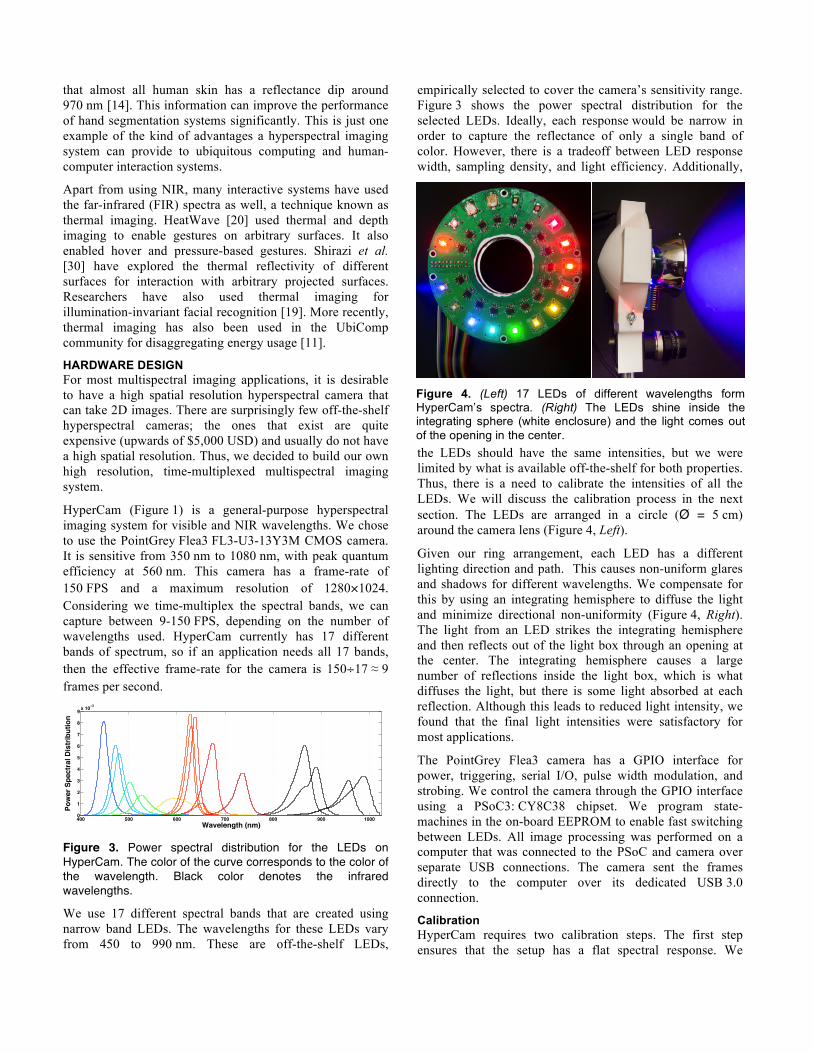
the LEDs should have the same intensities, but we were limited by what is available off-the-shelf for both properties. Thus, there is a need to calibrate the intensities of all the LEDs. We will discuss the calibration process in the next section. The LEDs are arranged in a circle (Ø = 5 cm) around the camera lens (Figure 4, Left).
Given our ring arrangement, each LED has a different lighting direction and path. This causes non-uniform glares and shadows for different wavelengths. We compensate for this by using an integrating hemisphere to diffuse the light and minimize directional non-uniformity (Figure 4, Right). The light from an LED strikes the integrating hemisphere and then reflects out of the light box through an opening at the center. The integrating hemisphere causes a large number of reflections inside the light box, which is what diffuses the light, but there is some light absorbed at each reflection. Although this leads to reduced light intensity, we found that the final light intensities were satisfactory for most applications.
The PointGrey Flea3 camera has a GPIO interface for power, triggering, serial I/O, pulse width modulation, and strobing. We control the camera through the GPIO interface using a PSoC3: CY8C38 chipset. We program state-machines in the on-board EEPROM to enable fast switching between LEDs. All image processing was performed on a computer that was connected to the PSoC and camera over separate USB connections. The camera sent the frames directly to the computer over its dedicated USB 3.0 connection.
Calibration HyperCam requires two calibration steps. The first step ensures that the setup has a flat spectral response. We
400 500 600 700 800 900 10000
1
2
3
4
5
6
7
8
9 x 10⁻³
Wavelength (nm)
Pow
er S
pect
ral D
istr
ibut
ion
Figure 4. (Left) 17 LEDs of different wavelengths form HyperCam’s spectra. (Right) The LEDs shine inside the integrating sphere (white enclosure) and the light comes out of the opening in the center.
calibrated the intensities of all the LEDs by looking at the spectral reflectance response of the camera for a MacBeth color chart at each wavelength. Ideally, this is a one-time calibration, but LEDs can slowly become dimmer over their lifetime. Hence, it is advisable to recalibrate the system after extended use. The second calibration step is to account for different lighting conditions. In practice, ambient lighting can vary, so HyperCam needs to adapt dynamically. Before each session, we capture an ambient lighting image, i.e., an image without any LEDs switched on. The system then subtracts this image from all the subsequent images for that session.
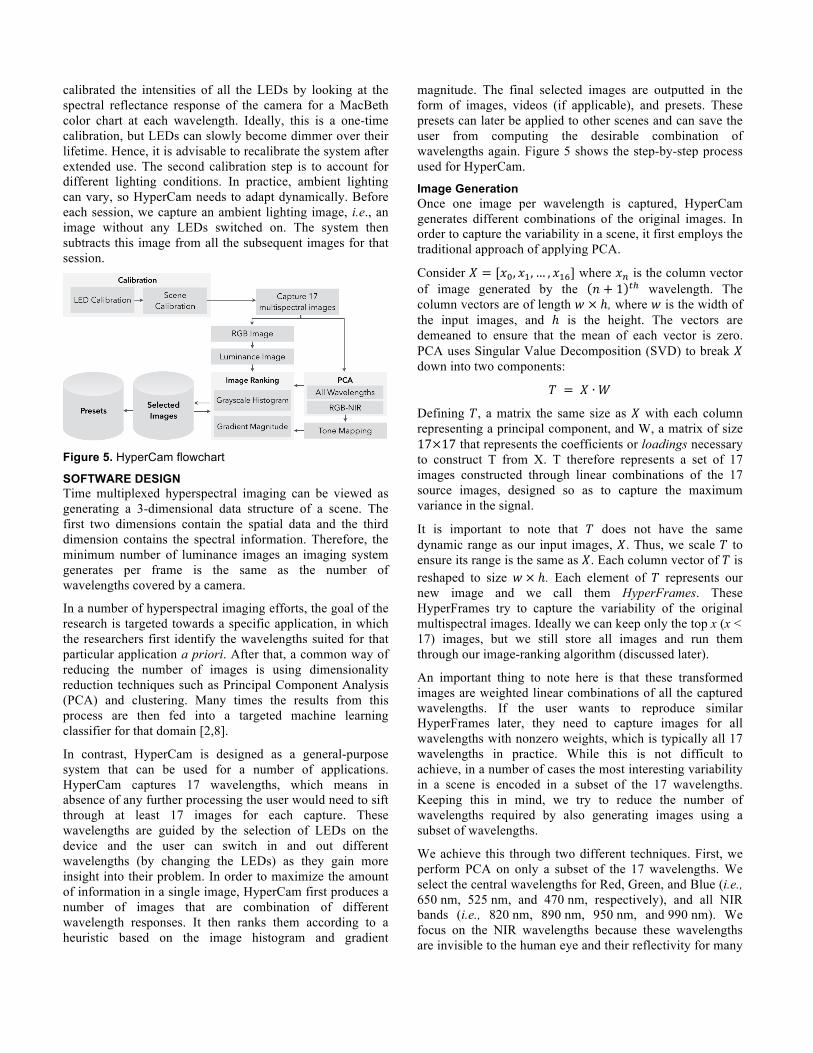
Figure 5. HyperCam flowchart
SOFTWARE DESIGN Time multiplexed hyperspectral imaging can be viewed as generating a 3-dimensional data structure of a scene. The first two dimensions contain the spatial data and the third dimension contains the spectral information. Therefore, the minimum number of luminance images an imaging system generates per frame is the same as the number of wavelengths covered by a camera.
In a number of hyperspectral imaging efforts, the goal of the research is targeted towards a specific application, in which the researchers first identify the wavelengths suited for that particular application a priori. After that, a common way of reducing the number of images is using dimensionality reduction techniques such as Principal Component Analysis (PCA) and clustering. Many times the results from this process are then fed into a targeted machine learning classifier for that domain [2,8].
In contrast, HyperCam is designed as a general-purpose system that can be used for a number of applications. HyperCam captures 17 wavelengths, which means in absence of any further processing the user would need to sift through at least 17 images for each capture. These wavelengths are guided by the selection of LEDs on the device and the user can switch in and out different wavelengths (by changing the LEDs) as they gain more insight into their problem. In order to maximize the amount of information in a single image, HyperCam first produces a number of images that are combination of different wavelength responses. It then ranks them according to a heuristic based on the image histogram and gradient
magnitude. The final selected images are outputted in the form of images, videos (if applicable), and presets. These presets can later be applied to other scenes and can save the user from computing the desirable combination of wavelengths again. Figure 5 shows the step-by-step process used for HyperCam.
Image Generation Once one image per wavelength is captured, HyperCam generates different combinations of the original images. In order to capture the variability in a scene, it first employs the traditional approach of applying PCA.
Consider 𝑋 = [𝑥!, 𝑥!,… , 𝑥!"] where 𝑥! is the column vector of image generated by the 𝑛 + 1 !! wavelength. The column vectors are of length 𝑤 × ℎ, where 𝑤 is the width of the input images, and ℎ is the height. The vectors are demeaned to ensure that the mean of each vector is zero. PCA uses Singular Value Decomposition (SVD) to break 𝑋 down into two components:
𝑇 = 𝑋 ∙𝑊
Defining 𝑇, a matrix the same size as 𝑋 with each column representing a principal component, and W, a matrix of size 17×17 that represents the coefficients or loadings necessary to construct T from X. T therefore represents a set of 17 images constructed through linear combinations of the 17 source images, designed so as to capture the maximum variance in the signal.
It is important to note that 𝑇 does not have the same dynamic range as our input images, 𝑋. Thus, we scale 𝑇 to ensure its range is the same as 𝑋. Each column vector of 𝑇 is reshaped to size 𝑤 × ℎ. Each element of 𝑇 represents our new image and we call them HyperFrames. These HyperFrames try to capture the variability of the original multispectral images. Ideally we can keep only the top x (x < 17) images, but we still store all images and run them through our image-ranking algorithm (discussed later).
An important thing to note here is that these transformed images are weighted linear combinations of all the captured wavelengths. If the user wants to reproduce similar HyperFrames later, they need to capture images for all wavelengths with nonzero weights, which is typically all 17 wavelengths in practice. While this is not difficult to achieve, in a number of cases the most interesting variability in a scene is encoded in a subset of the 17 wavelengths. Keeping this in mind, we try to reduce the number of wavelengths required by also generating images using a subset of wavelengths.
We achieve this through two different techniques. First, we perform PCA on only a subset of the 17 wavelengths. We select the central wavelengths for Red, Green, and Blue (i.e., 650 nm, 525 nm, and 470 nm, respectively), and all NIR bands (i.e., 820 nm, 890 nm, 950 nm, and 990 nm). We focus on the NIR wavelengths because these wavelengths are invisible to the human eye and their reflectivity for many
objects is not entirely intuitive. In fact, the field of near infrared spectroscopy uses NIR for applications in pharmaceuticals, medical diagnostics, etc. [4]. Therefore a PCA with the 7 wavelengths subset (3 RGB + 4 NIR) yields 7 more images that are added to our set of HyperFrames. These HyperFrames therefore consist of a linear combination of only the chosen 7 wavelengths, and future images can be constructed using only those 7 wavelengths, reducing the number of wavelengths required for a particular application.
Apart from PCA, we also employ tone mapping to generate more HyperFrames. We use tone mapping to efficiently visualize a scene’s response to different wavelengths. We ideally want to use wavelengths that contain the most information in the scene. Therefore, we use PCA to rank the 17 wavelengths and pick the top three. We employ the approach proposed by Yoon el at. [37]. Using these three wavelengths, we generate four high dynamic range (HDR) images, for all four possible combinations (𝐶!! + 𝐶!! = 4). These HDR images are then tone mapped to maximize the local contrast. We used algorithms proposed by Reinhard et al. [28] and the standard constructs of the Image Processing Toolbox of MATLAB to generate these images. Figure 11, in the Applications section, shows tone-mapped images of avocados and kiwis. The system selected 820 nm, 890 nm and 990 nm as the principal wavelengths for this scene. The images for these wavelengths were then tone mapped to generate the final HyperFrame. We use tone mapping as a tool to combine multiple images into one. These images prove to be an efficient way to visualize information because they aim to maximize the local contrast.
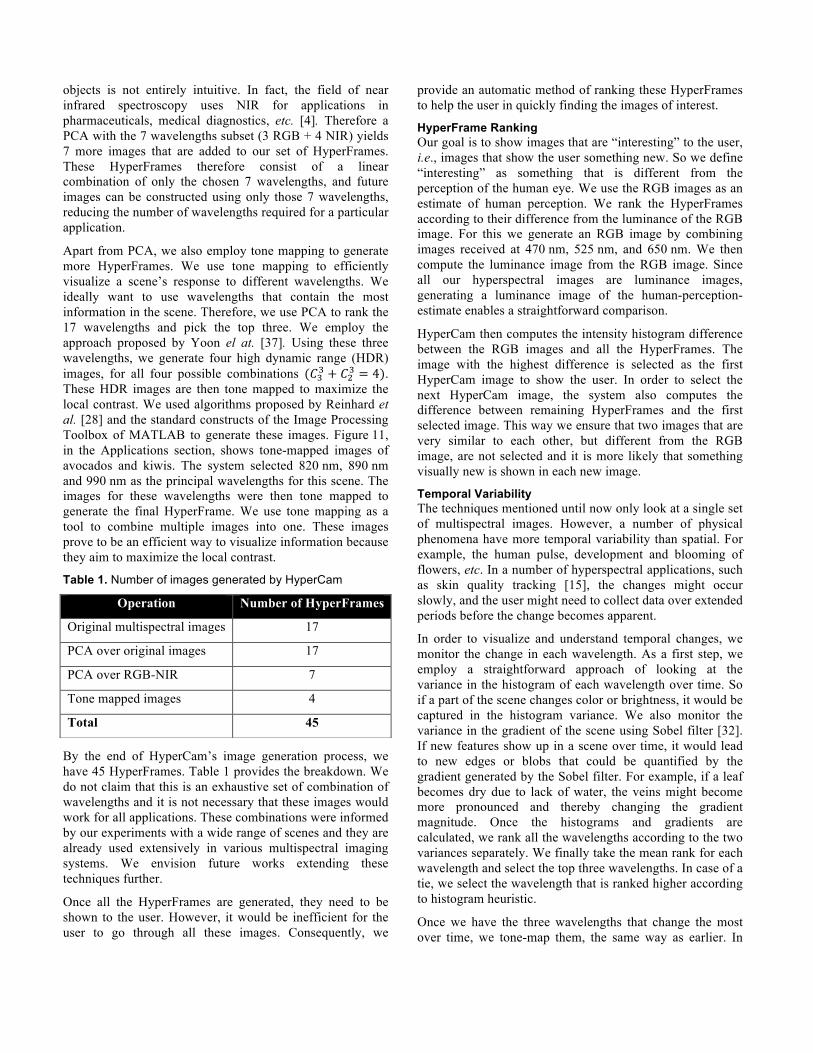
Table 1. Number of images generated by HyperCam
By the end of HyperCam’s image generation process, we have 45 HyperFrames. Table 1 provides the breakdown. We do not claim that this is an exhaustive set of combination of wavelengths and it is not necessary that these images would work for all applications. These combinations were informed by our experiments with a wide range of scenes and they are already used extensively in various multispectral imaging systems. We envision future works extending these techniques further.
Once all the HyperFrames are generated, they need to be shown to the user. However, it would be inefficient for the user to go through all these images. Consequently, we
provide an automatic method of ranking these HyperFrames to help the user in quickly finding the images of interest.
HyperFrame Ranking Our goal is to show images that are “interesting” to the user, i.e., images that show the user something new. So we define “interesting” as something that is different from the perception of the human eye. We use the RGB images as an estimate of human perception. We rank the HyperFrames according to their difference from the luminance of the RGB image. For this we generate an RGB image by combining images received at 470 nm, 525 nm, and 650 nm. We then compute the luminance image from the RGB image. Since all our hyperspectral images are luminance images, generating a luminance image of the human-perception-estimate enables a straightforward comparison.
HyperCam then computes the intensity histogram difference between the RGB images and all the HyperFrames. The image with the highest difference is selected as the first HyperCam image to show the user. In order to select the next HyperCam image, the system also computes the difference between remaining HyperFrames and the first selected image. This way we ensure that two images that are very similar to each other, but different from the RGB image, are not selected and it is more likely that something visually new is shown in each new image.
Temporal Variability The techniques mentioned until now only look at a single set of multispectral images. However, a number of physical phenomena have more temporal variability than spatial. For example, the human pulse, development and blooming of flowers, etc. In a number of hyperspectral applications, such as skin quality tracking [15], the changes might occur slowly, and the user might need to collect data over extended periods before the change becomes apparent.
In order to visualize and understand temporal changes, we monitor the change in each wavelength. As a first step, we employ a straightforward approach of looking at the variance in the histogram of each wavelength over time. So if a part of the scene changes color or brightness, it would be captured in the histogram variance. We also monitor the variance in the gradient of the scene using Sobel filter [32]. If new features show up in a scene over time, it would lead to new edges or blobs that could be quantified by the gradient generated by the Sobel filter. For example, if a leaf becomes dry due to lack of water, the veins might become more pronounced and thereby changing the gradient magnitude. Once the histograms and gradients are calculated, we rank all the wavelengths according to the two variances separately. We finally take the mean rank for each wavelength and select the top three wavelengths. In case of a tie, we select the wavelength that is ranked higher according to histogram heuristic.
Once we have the three wavelengths that change the most over time, we tone-map them, the same way as earlier. In
Operation Number of HyperFrames
Original multispectral images 17
PCA over original images 17
PCA over RGB-NIR 7
Tone mapped images 4
Total 45
this case, the final output of the system is not just the image, but a video that visualizes the change in these top two or three wavelengths. We discuss an application of tracking temporal variability in the next section.
Presets Once the user finds an interesting HyperFrame or video, and thereby an interesting combination of wavelengths, HyperCam provides the option of exporting and saving the features (or coefficients) of principal components for that particular use case. The new hyperspectral images can simply be transformed by loading the saved principal component or tone mapping settings. We show how using these exported presets can be useful in example demonstration applications in the next section.
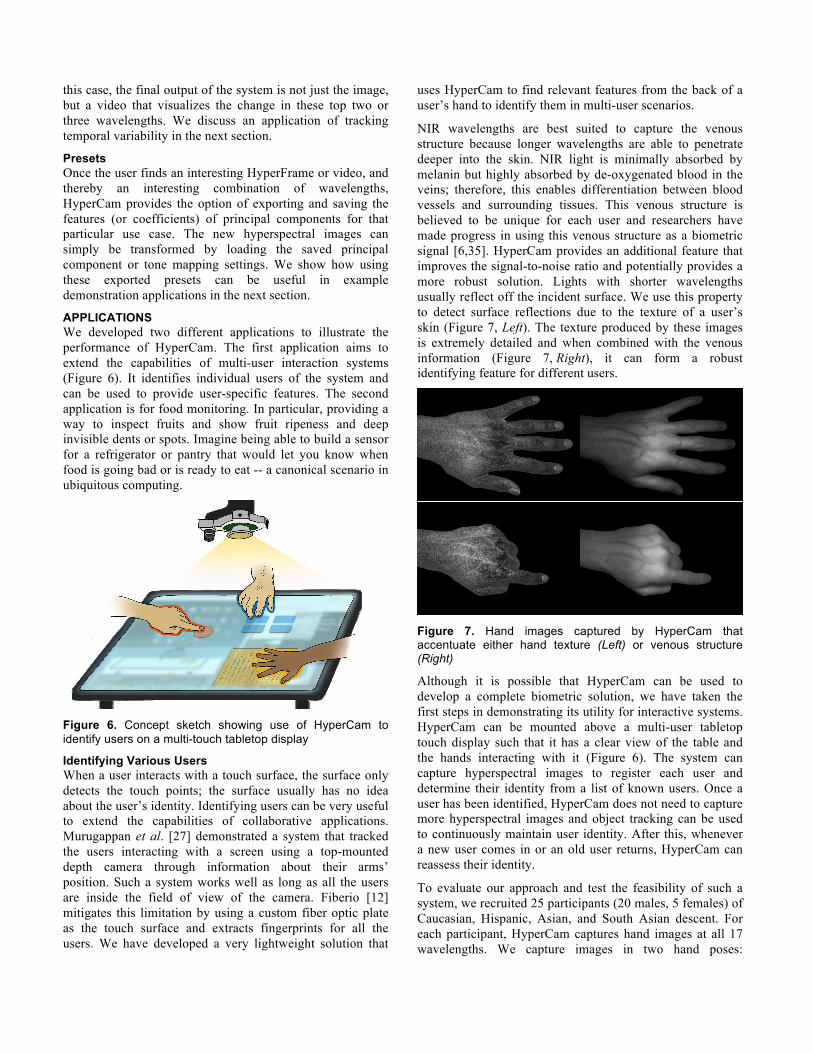
APPLICATIONS We developed two different applications to illustrate the performance of HyperCam. The first application aims to extend the capabilities of multi-user interaction systems (Figure 6). It identifies individual users of the system and can be used to provide user-specific features. The second application is for food monitoring. In particular, providing a way to inspect fruits and show fruit ripeness and deep invisible dents or spots. Imagine being able to build a sensor for a refrigerator or pantry that would let you know when food is going bad or is ready to eat -- a canonical scenario in ubiquitous computing.
Figure 6. Concept sketch showing use of HyperCam to identify users on a multi-touch tabletop display
Identifying Various Users When a user interacts with a touch surface, the surface only detects the touch points; the surface usually has no idea about the user’s identity. Identifying users can be very useful to extend the capabilities of collaborative applications. Murugappan et al. [27] demonstrated a system that tracked the users interacting with a screen using a top-mounted depth camera through information about their arms’ position. Such a system works well as long as all the users are inside the field of view of the camera. Fiberio [12] mitigates this limitation by using a custom fiber optic plate as the touch surface and extracts fingerprints for all the users. We have developed a very lightweight solution that
uses HyperCam to find relevant features from the back of a user’s hand to identify them in multi-user scenarios.
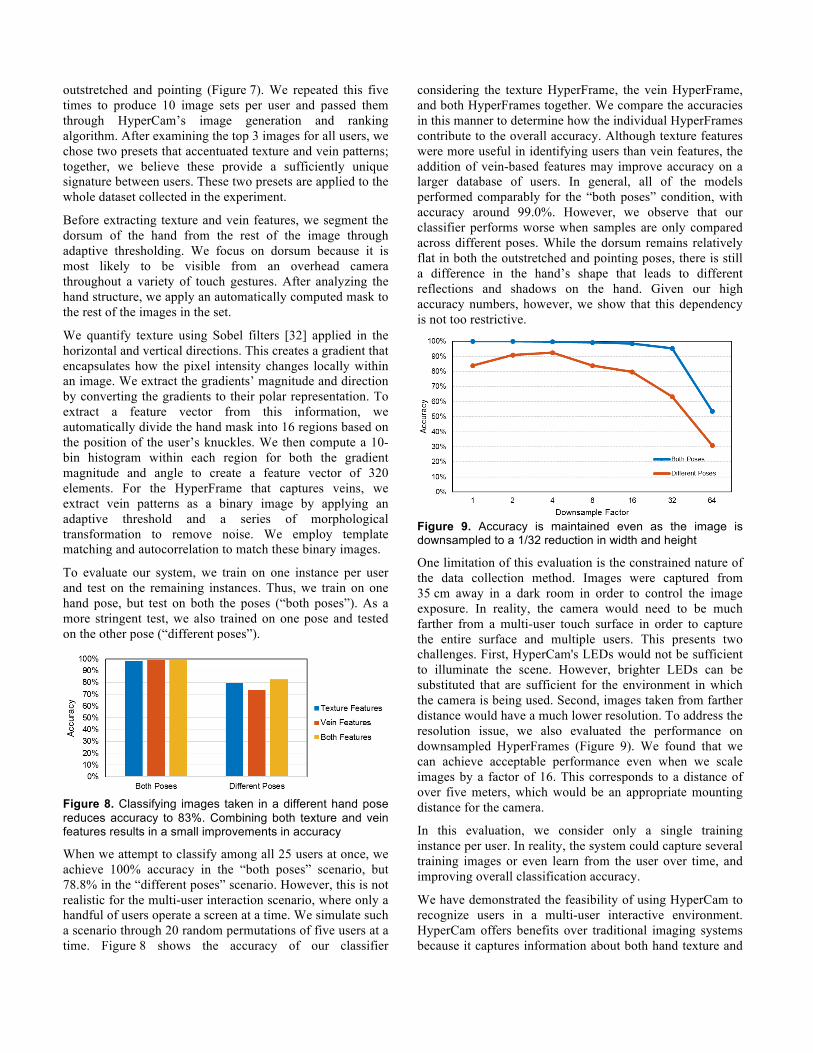
NIR wavelengths are best suited to capture the venous structure because longer wavelengths are able to penetrate deeper into the skin. NIR light is minimally absorbed by melanin but highly absorbed by de-oxygenated blood in the veins; therefore, this enables differentiation between blood vessels and surrounding tissues. This venous structure is believed to be unique for each user and researchers have made progress in using this venous structure as a biometric signal [6,35]. HyperCam provides an additional feature that improves the signal-to-noise ratio and potentially provides a more robust solution. Lights with shorter wavelengths usually reflect off the incident surface. We use this property to detect surface reflections due to the texture of a user’s skin (Figure 7, Left). The texture produced by these images is extremely detailed and when combined with the venous information (Figure 7, Right), it can form a robust identifying feature for different users.
Figure 7. Hand images captured by HyperCam that accentuate either hand texture (Left) or venous structure (Right)
Although it is possible that HyperCam can be used to develop a complete biometric solution, we have taken the first steps in demonstrating its utility for interactive systems. HyperCam can be mounted above a multi-user tabletop touch display such that it has a clear view of the table and the hands interacting with it (Figure 6). The system can capture hyperspectral images to register each user and determine their identity from a list of known users. Once a user has been identified, HyperCam does not need to capture more hyperspectral images and object tracking can be used to continuously maintain user identity. After this, whenever a new user comes in or an old user returns, HyperCam can reassess their identity.
To evaluate our approach and test the feasibility of such a system, we recruited 25 participants (20 males, 5 females) of Caucasian, Hispanic, Asian, and South Asian descent. For each participant, HyperCam captures hand images at all 17 wavelengths. We capture images in two hand poses:
outstretched and pointing (Figure 7). We repeated this five times to produce 10 image sets per user and passed them through HyperCam’s image generation and ranking algorithm. After examining the top 3 images for all users, we chose two presets that accentuated texture and vein patterns; together, we believe these provide a sufficiently unique signature between users. These two presets are applied to the whole dataset collected in the experiment.
Before extracting texture and vein features, we segment the dorsum of the hand from the rest of the image through adaptive thresholding. We focus on dorsum because it is most likely to be visible from an overhead camera throughout a variety of touch gestures. After analyzing the hand structure, we apply an automatically computed mask to the rest of the images in the set.
We quantify texture using Sobel filters [32] applied in the horizontal and vertical directions. This creates a gradient that encapsulates how the pixel intensity changes locally within an image. We extract the gradients’ magnitude and direction by converting the gradients to their polar representation. To extract a feature vector from this information, we automatically divide the hand mask into 16 regions based on the position of the user’s knuckles. We then compute a 10-bin histogram within each region for both the gradient magnitude and angle to create a feature vector of 320 elements. For the HyperFrame that captures veins, we extract vein patterns as a binary image by applying an adaptive threshold and a series of morphological transformation to remove noise. We employ template matching and autocorrelation to match these binary images.
To evaluate our system, we train on one instance per user and test on the remaining instances. Thus, we train on one hand pose, but test on both the poses (“both poses”). As a more stringent test, we also trained on one pose and tested on the other pose (“different poses”).
Figure 8. Classifying images taken in a different hand pose reduces accuracy to 83%. Combining both texture and vein features results in a small improvements in accuracy
When we attempt to classify among all 25 users at once, we achieve 100% accuracy in the “both poses” scenario, but 78.8% in the “different poses” scenario. However, this is not realistic for the multi-user interaction scenario, where only a handful of users operate a screen at a time. We simulate such a scenario through 20 random permutations of five users at a time. Figure 8 shows the accuracy of our classifier
considering the texture HyperFrame, the vein HyperFrame, and both HyperFrames together. We compare the accuracies in this manner to determine how the individual HyperFrames contribute to the overall accuracy. Although texture features were more useful in identifying users than vein features, the addition of vein-based features may improve accuracy on a larger database of users. In general, all of the models performed comparably for the “both poses” condition, with accuracy around 99.0%. However, we observe that our classifier performs worse when samples are only compared across different poses. While the dorsum remains relatively flat in both the outstretched and pointing poses, there is still a difference in the hand’s shape that leads to different reflections and shadows on the hand. Given our high accuracy numbers, however, we show that this dependency is not too restrictive.
Figure 9. Accuracy is maintained even as the image is downsampled to a 1/32 reduction in width and height
One limitation of this evaluation is the constrained nature of the data collection method. Images were captured from 35 cm away in a dark room in order to control the image exposure. In reality, the camera would need to be much farther from a multi-user touch surface in order to capture the entire surface and multiple users. This presents two challenges. First, HyperCam's LEDs would not be sufficient to illuminate the scene. However, brighter LEDs can be substituted that are sufficient for the environment in which the camera is being used. Second, images taken from farther distance would have a much lower resolution. To address the resolution issue, we also evaluated the performance on downsampled HyperFrames (Figure 9). We found that we can achieve acceptable performance even when we scale images by a factor of 16. This corresponds to a distance of over five meters, which would be an appropriate mounting distance for the camera.
In this evaluation, we consider only a single training instance per user. In reality, the system could capture several training images or even learn from the user over time, and improving overall classification accuracy.
We have demonstrated the feasibility of using HyperCam to recognize users in a multi-user interactive environment. HyperCam offers benefits over traditional imaging systems because it captures information about both hand texture and
vein patterns. Moreover, presets can be selected from the automatically generated HyperFrames that highlight the features of interest, making the feature extraction step much easier. Through our evaluation, we show that this approach is successful at reliably distinguishing between five users at a time, a reasonable bound on number of users of a multi-touch surface at any point in time.
Fruit Quality Detection Ripeness is an important attribute that a user wants to be sure of when they buy or eat fruits. Researchers have used hyperspectral imaging and laser spectroscopy to determine a fruit’s ripeness for industrial applications [3,23,24]. These systems are usually tuned for specific fruits. This is essential for these systems because they aim to predict an absolute level of ripeness. We believe that from a home-user’s perspective, relative ripeness is more useful. For instance, a user would be more interested to determine which tomato in their collection is the ripest. This could be done using HyperCam to create a “smart fruit tray” that senses the ripest fruits and makes suggestions accordingly.
Researchers have used a number of wavelengths ranging from 680 nm to 1100 nm for determining fruit ripeness. When these wavelengths strike the fruit, the majority of the light penetrates into the fruit tissue. Inside the fruit, the light is scattered and absorbed by the chemical constituents and the material’s physical structures. As a fruit ripens, the sugar content and density usually increases, which results in increased absorption and scattering of photons. The degree
to which these phenomena occur would depend on the type of fruit, as well as the incident wavelengths.
In evaluating HyperCam, we sought to answer two question: (1) can the HyperCam’s hardware sense the difference between a ripe and unripe fruit; and (2) can our software approach detect whether a fruit is ripe without any domain knowledge.
We captured hyperspectral images of 10 different fruits: apples, oranges, mangoes, plums, pears, tomatoes, strawberries, blueberries, kiwis, and avocados. We purchased two batches of fruits; each batch contained 10 pieces of each fruit. In order to make sure that one of the batches was riper than the other, we bought them one week apart. Additionally, we accelerated the ripening process by keeping all the fruits in the first batch with rice. The presence of ethylene in rice has been shown to accelerate the ripening of fruits [29].
We grouped fruits into pairs of the same type – one ripe and one relatively unripe. We used HyperCam to collect hyperspectral images for each pair. All photos were taken at a distance of 45 cm in a room with normal brightness. Once all the data was collected, a randomly selected subset of 10 images was passed through HyperCam’s image generation and ranking algorithm. We inspected the top five images and recorded the wavelengths with maximum PCA weights. The top five images were inspected and the tone-mapped image of the top three wavelengths (discussed in Software Design) was consistently ranked higher. The three wavelengths selected by HyperCam were 820 nm, 950 nm, and 990 nm (all NIR). We saved this preset and applied it to all the collected images (Figure 10).
Figure 11. HyperCam can be used to detect ripeness, spots, and dents on fruits and vegetables. (Top-Left) RGB image of an avocado, (Bottom-Left) HyperCam image with internal spots, (Right) Original RGB image overlaid with detected spots.
We used a simple blob detection scheme to extract the two fruits from each scene. Because ripeness tends to lower reflectance, we simply compared the mean luminance of each pair. Figure 10 shows example images for avocados, kiwis, and plums. In each image, the fruit on the left is riper. We have three avocados in the image only for illustration purposes – the experiments were only done in pairs. Our system correctly predicted the relative ripeness for 47 of the 50 pairs (94% accuracy). In contrast, when using the RGB images from HyperCam, the accuracy was only 62%.
This system can also be used to detect invisible spots and dents on fruits and vegetables. If there is a dent on a fruit, it will most likely make the material abruptly soft at that location. Therefore, there will be more scattering of the
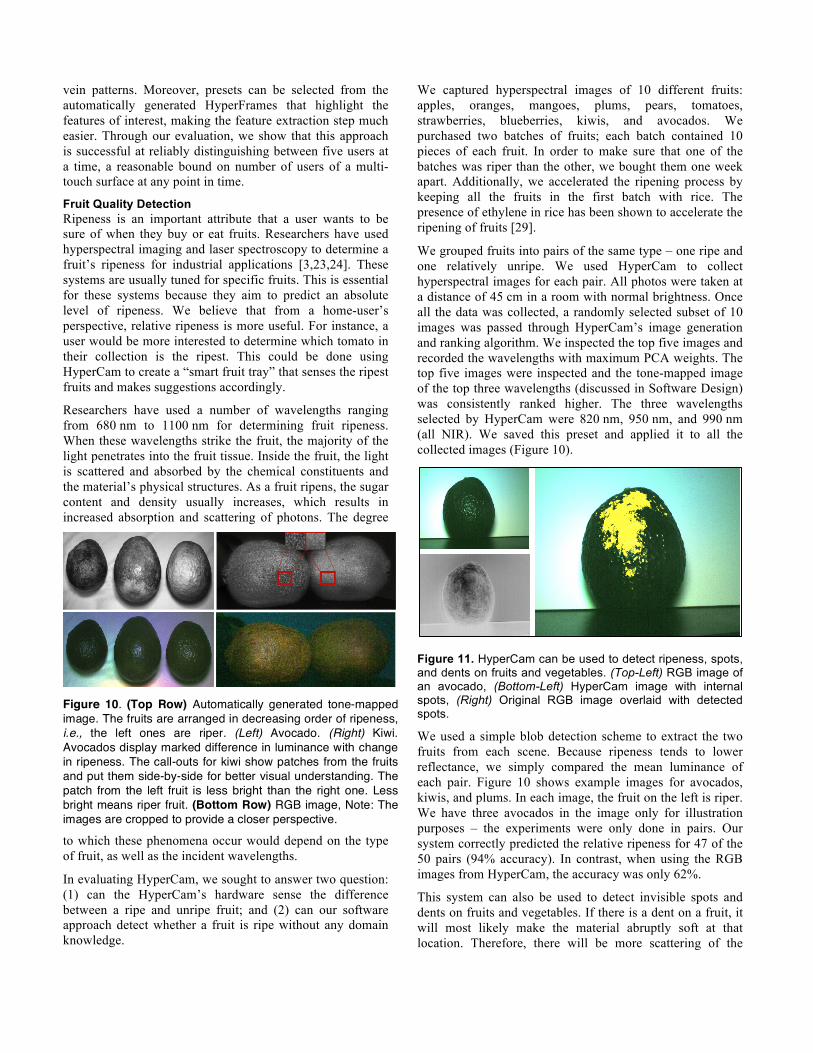
Figure 10. (Top Row) Automatically generated tone-mapped image. The fruits are arranged in decreasing order of ripeness, i.e., the left ones are riper. (Left) Avocado. (Right) Kiwi. Avocados display marked difference in luminance with change in ripeness. The call-outs for kiwi show patches from the fruits and put them side-by-side for better visual understanding. The patch from the left fruit is less bright than the right one. Less bright means riper fruit. (Bottom Row) RGB image, Note: The images are cropped to provide a closer perspective.
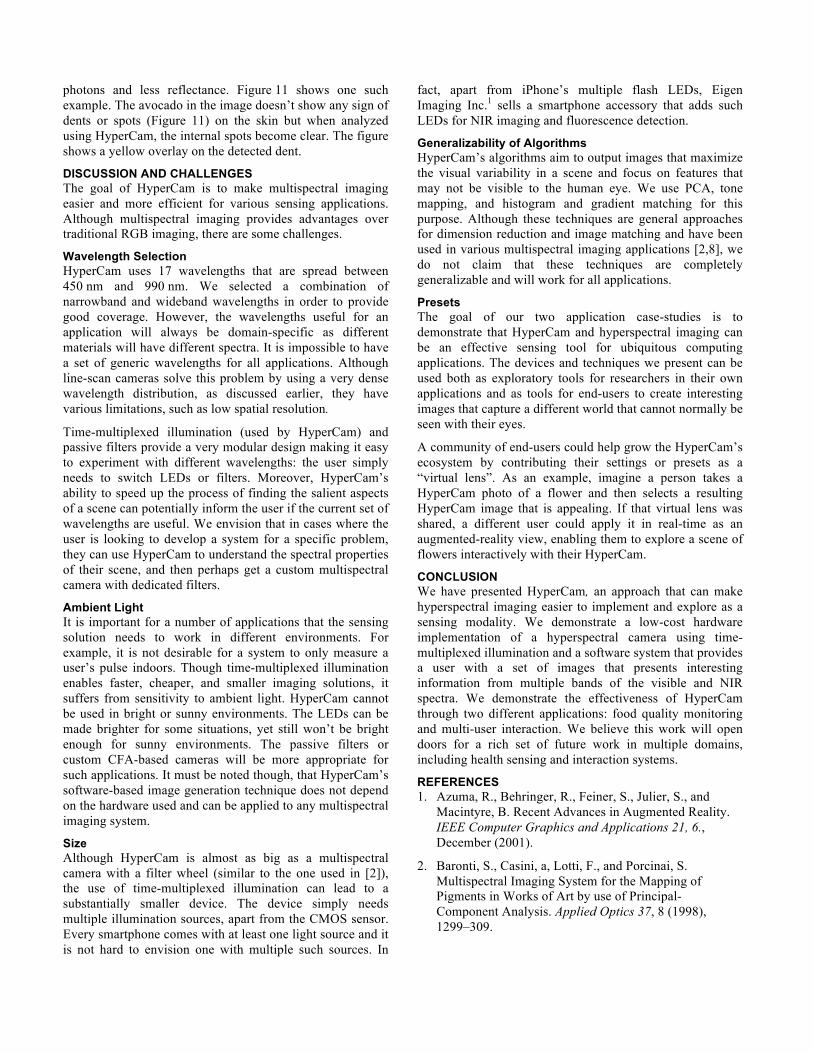
photons and less reflectance. Figure 11 shows one such example. The avocado in the image doesn’t show any sign of dents or spots (Figure 11) on the skin but when analyzed using HyperCam, the internal spots become clear. The figure shows a yellow overlay on the detected dent.
DISCUSSION AND CHALLENGES The goal of HyperCam is to make multispectral imaging easier and more efficient for various sensing applications. Although multispectral imaging provides advantages over traditional RGB imaging, there are some challenges.
Wavelength Selection HyperCam uses 17 wavelengths that are spread between 450 nm and 990 nm. We selected a combination of narrowband and wideband wavelengths in order to provide good coverage. However, the wavelengths useful for an application will always be domain-specific as different materials will have different spectra. It is impossible to have a set of generic wavelengths for all applications. Although line-scan cameras solve this problem by using a very dense wavelength distribution, as discussed earlier, they have various limitations, such as low spatial resolution.
Time-multiplexed illumination (used by HyperCam) and passive filters provide a very modular design making it easy to experiment with different wavelengths: the user simply needs to switch LEDs or filters. Moreover, HyperCam’s ability to speed up the process of finding the salient aspects of a scene can potentially inform the user if the current set of wavelengths are useful. We envision that in cases where the user is looking to develop a system for a specific problem, they can use HyperCam to understand the spectral properties of their scene, and then perhaps get a custom multispectral camera with dedicated filters.
Ambient Light It is important for a number of applications that the sensing solution needs to work in different environments. For example, it is not desirable for a system to only measure a user’s pulse indoors. Though time-multiplexed illumination enables faster, cheaper, and smaller imaging solutions, it suffers from sensitivity to ambient light. HyperCam cannot be used in bright or sunny environments. The LEDs can be made brighter for some situations, yet still won’t be bright enough for sunny environments. The passive filters or custom CFA-based cameras will be more appropriate for such applications. It must be noted though, that HyperCam’s software-based image generation technique does not depend on the hardware used and can be applied to any multispectral imaging system.
Size Although HyperCam is almost as big as a multispectral camera with a filter wheel (similar to the one used in [2]), the use of time-multiplexed illumination can lead to a substantially smaller device. The device simply needs multiple illumination sources, apart from the CMOS sensor. Every smartphone comes with at least one light source and it is not hard to envision one with multiple such sources. In
fact, apart from iPhone’s multiple flash LEDs, Eigen Imaging Inc.1 sells a smartphone accessory that adds such LEDs for NIR imaging and fluorescence detection.
Generalizability of Algorithms HyperCam’s algorithms aim to output images that maximize the visual variability in a scene and focus on features that may not be visible to the human eye. We use PCA, tone mapping, and histogram and gradient matching for this purpose. Although these techniques are general approaches for dimension reduction and image matching and have been used in various multispectral imaging applications [2,8], we do not claim that these techniques are completely generalizable and will work for all applications.
Presets The goal of our two application case-studies is to demonstrate that HyperCam and hyperspectral imaging can be an effective sensing tool for ubiquitous computing applications. The devices and techniques we present can be used both as exploratory tools for researchers in their own applications and as tools for end-users to create interesting images that capture a different world that cannot normally be seen with their eyes.
A community of end-users could help grow the HyperCam’s ecosystem by contributing their settings or presets as a “virtual lens”. As an example, imagine a person takes a HyperCam photo of a flower and then selects a resulting HyperCam image that is appealing. If that virtual lens was shared, a different user could apply it in real-time as an augmented-reality view, enabling them to explore a scene of flowers interactively with their HyperCam.
CONCLUSION We have presented HyperCam, an approach that can make hyperspectral imaging easier to implement and explore as a sensing modality. We demonstrate a low-cost hardware implementation of a hyperspectral camera using time-multiplexed illumination and a software system that provides a user with a set of images that presents interesting information from multiple bands of the visible and NIR spectra. We demonstrate the effectiveness of HyperCam through two different applications: food quality monitoring and multi-user interaction. We believe this work will open doors for a rich set of future work in multiple domains, including health sensing and interaction systems.
REFERENCES 1. Azuma, R., Behringer, R., Feiner, S., Julier, S., and
Macintyre, B. Recent Advances in Augmented Reality. IEEE Computer Graphics and Applications 21, 6., December (2001).
2. Baronti, S., Casini, a, Lotti, F., and Porcinai, S. Multispectral Imaging System for the Mapping of Pigments in Works of Art by use of Principal-Component Analysis. Applied Optics 37, 8 (1998), 1299–309.
3. Van Beers, R., Aernouts, B., De Baerdemaeker, J., and Saeys, W. Apple ripeness detection using hyperspectral laser scatter imaging. Sensing Technologies for Biomaterial, Food, and Agriculture 8881, (2013).
4. Burns, D.A. and Ciurczak, E.W. Handbook of Near-Infrared Analysis. 2007.
5. Coffey, V.C. Multispectral Imaging Moves into the Mainstream. OPN Optics & Photonics News, , 18–24.
6. Cuper, N.J., Verdaasdonk, R.M., de Roode, R., et al. Visualizing veins with near-infrared light to facilitate blood withdrawal in children. Clinical pediatrics 50, 6 (2011), 508–12.
7. Friedhelm König and Praefcke, W. The Practice of Multispectral Image Acquisition. Proceedings of SPIE vol. 3409, EUROPTO Conference on Electronic Imaging: Processing, Printing, and Publishing in Color, (1998).
8. Goltz, D.M., Cloutis, E., Norman, L., and Attas, M. Enhancement of Faint Text Using Visible (420–720 nm) Multispectral Imaging. Restaurator 28, 1 (2007), 11–28.
9. De Greef, L., Goel, M., Seo, M.J., et al. BiliCam: Using Mobile Phones to Monitor Newborn Jaundice. Proceedings of the 2014 ACM International Joint Conference on Pervasive and Ubiquitous Computing 2014.
10. Heinemann, L. and Schmelzeisen-redeker, G. Non-invasive continuous glucose monitoring in Type I diabetic patients with optical glucose sensors. Diabetologia (1998) 41, 1998, 848–854.
11. Ho, B., Kao, H.C., Chen, N., et al. HeatProbe : A Thermal-based Power Meter for Accounting Disaggregated Electricity Usage. Proceedings of the UbiComp 2011., (2011).
12. Holz, C. and Baudisch, P. Fiberio : A Touchscreen that Senses Fingerprints. Proceedings of the 2013 ACM conference on UIST 2013.
13. Imai, F.H. and Berns, R.S. Spectral estimation using trichromatic digital cameras. Proc. of the International Symposium on Multispectral Imaging and Color Reproduction for Digital Archives, (2012).
14. Kanzawa, Y. Human Skin Detection by Visible and Near-Infrared Imaging. IAPR Conference on Machine Vision Applications, (2011), 503–507.
15. Kapsokalyvas, D., Bruscino, N., Alfieri, D., et al. Imaging of human skin lesions with the Multispectral Dermoscope. SPIE Proceedings 7548, (2010), 754808–754808–8.
16. Kargel, J.S., Abrams, M.J., Bishop, M.P., et al. Multispectral imaging contributions to global land ice
measurements from space. Remote Sensing of Environment 99, 1-2 (2005), 187–219.
17. Kim, D., Hilliges, O., Izadi, S., et al. Digits : Freehand 3D Interactions Anywhere Using a Wrist-Worn Gloveless Sensor. Proceedings of the ACM Conference of UIST 2012.
18. Kim, Y.-J. and Yoon, G. Prediction of glucose in whole blood by near-infrared spectroscopy: influence of wavelength region, preprocessing, and hemoglobin concentration. Journal of biomedical optics 11, 4 (2013), 041128.
19. Kong, S.G., Heo, J., Boughorbel, F., et al. Multiscale Fusion of Visible and Thermal IR Images for Illumination-Invariant Face Recognition. International Journal of Computer Vision 71, 2 (2006), 215–233.
20. Larson, E., Cohn, G., Gupta, S., et al. HeatWave : Thermal Imaging for Surface User Interaction. Proc. CHI 2011.
21. Levenson, R.M. and Mansfield, J.R. Multispectral Imaging in Biology and Medicine : Slices of Life. 2006 International Society for Analytical Cytology 758, (2006), 748–758.
22. Li, H., Feng, J., Yang, W., et al. Multi-spectral imaging using LED illuminations. 2012 5th International Congress on Image and Signal Processing, Cisp (2012), 538–542.
23. Lu, R. Predicting Firmness and Sugar Content of Sweet Cherries Using Near-Infrared Diffuse Reflectance Spectroscopy. Transactions of the American Society of Agricultural Engineers 44, 5 (2001), 1265–1271.
24. Lu, R. Multispectral imaging for predicting firmness and soluble solids content of apple fruit. Postharvest Biology and Technology 31, 2 (2004), 147–157.
25. Matsushita, N. and Rekimoto, J. HoloWall: Designing a Finger; Hand, Body, and Object Sensitive Wall. Proc. UIST’97.
26. Murthy, G.R.S. and Jadon, R.S. A review of vision based hand gestures recognition. International Journal of Information Technology and Knowledge Management 2, 2 (2009), 405–410.
27. Murugappan, S., Elmqvist, N., and Ramani, K. Extended Multitouch : Recovering Touch Posture and Differentiating Users using a Depth Camera. Proc. UIST 2012.
28. Reinhard, E., Ward, G., Pattanaik, S., Debevec, P., Heidrich, W., and Myszkowski, K. High Dynamic Range Imaging. 2010.
29. Saltveit, M.E. Effect of ethylene on quality of fresh fruits and vegetables. Postharvest Biology and Technology 15, June 1998, 279–292.

30. Shirazi, A.S., Abdelrahman, Y., Henze, N., Schneegass, S., Khalilbeigi, M., and Schmidt, A. Exploiting Thermal Reflection for Interactive Systems. Proc. CHI 2014, (2014).
31. Smith, M.O., Ustin, S.L., Adams, J.B., and Gillespie, A.R. Vegetation in Deserts: I. A Regional Measure of Abundance from Multispectral Images. Int. Symp. Remote Sens. Environ. 26, February (1990), 1–26.
32. Sobel, I. and Feldman, G. A 3x3 isotropic gradient operator for image processing. 1968.
33. Song, K.-Y., Oh, H.-J., Choi, J., Park, I., Lee, C., and Lee, S. Prediction of landslides using ASTER imagery and data mining models. Advances in Space Research 49, 5 (2012), 978–993.
34. Wadhawan, T., Lancaster, K., and Zouridakis, G. Implementation of the 7-point checklist for melanoma detection on smart handheld devices. 2011 Annual International Conference of the IEEE Engineering in Medicine and Biology Society, (2011), 3180–3183.
35. Wang, L., Leedham, G., and Cho, S. Infrared imaging of hand vein patterns for biometric purposes. The Institution of Engineering and Technology, (2007), 113–122.
36. Wilson, A.D. PlayAnywhere : A Compact Interactive Tabletop Projection-Vision System. Proc. UIST’05, (2005).
37. Yoon, H., Yang, K., and Shahabi, C. Feature subset selection and feature ranking for multivariate time series. IEEE Transactions on Knowledge and Data Engineering 17, 9 (2005), 1186–1198.
38. Realization of natural color reproduction in Digital Still Cameras, closer to the natural sight perception of the human eye. http://www.sony.net/SonyInfo/News/Press_Archive/200307/03-029E/.
39. OV4682 Color CMOS 4-megapixel (2688x1520) Image Sensor with OmniBSI-2TM Technology. http://www.ovt.com/products/sensor.php?id=145&limit=302.
40. Hyperspectral Imaging. http://www.hyspex.no/hyperspectral_imaging/.