hyperion system 9 bi+ financial reporting studio release 9.2
TRANSCRIPT

H Y P E R I O N ® S Y S T E M ™ 9 B I + ™
FINANCIAL REPORTING STUDIO™
R E L E A S E 9 . 2
U S E R ’ S G U I D E

Copyright 1989–2006 Hyperion Solutions Corporation. All rights reserved.
“Hyperion,” the Hyperion logo, and Hyperion’s product names are trademarks of Hyperion. References to other companies and their products use trademarks owned by the respective companies and are for reference purpose only.
No portion hereof may be reproduced or transmitted in any form or by any means, electronic or mechanical, including photocopying, recording, or information storage and retrieval systems, for any purpose other than the recipient’s personal use, without the express written permission of Hyperion.
The information contained herein is subject to change without notice. Hyperion shall not be liable for errors contained herein or consequential damages in connection with the furnishing, performance, or use hereof.
Any Hyperion software described herein is licensed exclusively subject to the conditions set forth in the Hyperion license agreement.
Use, duplication or disclosure by the U.S. Government is subject to restrictions set forth in the applicable Hyperion license agreement and as provided in DFARS 227.7202-1(a) and 227.7202-3(a) (1995), DFARS 252.227-7013(c)(1)(ii) (Oct 1988), FAR 12.212(a) (1995), FAR 52.227-19, or FAR 52.227-14, as applicable.
Hyperion Solutions Corporation 5450 Great America Parkway Santa Clara, California 95054
Printed in the U.S.A.
Contents iii
Contents
Preface . . . . . . . . . . . . . . . . . . . . . . . . . . . . . . . . . . . . . . . . . . . . . . . . . . . . . . . . . . . . . . . . . . . . . . xiii
Purpose . . . . . . . . . . . . . . . . . . . . . . . . . . . . . . . . . . . . . . . . . . . . . . . . . . . . . . . . . . . . . . . . . . . . . xiii
Audience . . . . . . . . . . . . . . . . . . . . . . . . . . . . . . . . . . . . . . . . . . . . . . . . . . . . . . . . . . . . . . . . . . . . xiii
Document Structure . . . . . . . . . . . . . . . . . . . . . . . . . . . . . . . . . . . . . . . . . . . . . . . . . . . . . . . . . . xiii
Where to Find Documentation . . . . . . . . . . . . . . . . . . . . . . . . . . . . . . . . . . . . . . . . . . . . . . . . . . xiv
Help Menu Commands . . . . . . . . . . . . . . . . . . . . . . . . . . . . . . . . . . . . . . . . . . . . . . . . . . . . . . . . . xv
Conventions . . . . . . . . . . . . . . . . . . . . . . . . . . . . . . . . . . . . . . . . . . . . . . . . . . . . . . . . . . . . . . . . . xvi
Additional Support . . . . . . . . . . . . . . . . . . . . . . . . . . . . . . . . . . . . . . . . . . . . . . . . . . . . . . . . . . . xvii
Education Services . . . . . . . . . . . . . . . . . . . . . . . . . . . . . . . . . . . . . . . . . . . . . . . . . . . . . . . . xvii
Consulting Services . . . . . . . . . . . . . . . . . . . . . . . . . . . . . . . . . . . . . . . . . . . . . . . . . . . . . . . xvii
Technical Support . . . . . . . . . . . . . . . . . . . . . . . . . . . . . . . . . . . . . . . . . . . . . . . . . . . . . . . . xvii
Documentation Feedback . . . . . . . . . . . . . . . . . . . . . . . . . . . . . . . . . . . . . . . . . . . . . . . . . . . . . xvii
CHAPTER 1 Getting Started with Financial Reporting . . . . . . . . . . . . . . . . . . . . . . . . . . . . . . . . . . . . . . . . . . . . 19
Terminology in this Release . . . . . . . . . . . . . . . . . . . . . . . . . . . . . . . . . . . . . . . . . . . . . . . . . . . . . . 20
Financial Reporting Components . . . . . . . . . . . . . . . . . . . . . . . . . . . . . . . . . . . . . . . . . . . . . . . . . 20
Data Sources . . . . . . . . . . . . . . . . . . . . . . . . . . . . . . . . . . . . . . . . . . . . . . . . . . . . . . . . . . . . . . . 21
Sample Report . . . . . . . . . . . . . . . . . . . . . . . . . . . . . . . . . . . . . . . . . . . . . . . . . . . . . . . . . . . . . 21
Report Components . . . . . . . . . . . . . . . . . . . . . . . . . . . . . . . . . . . . . . . . . . . . . . . . . . . . . . . . 22
Report Objects . . . . . . . . . . . . . . . . . . . . . . . . . . . . . . . . . . . . . . . . . . . . . . . . . . . . . . . . . . . . . 23
Studio Workspace . . . . . . . . . . . . . . . . . . . . . . . . . . . . . . . . . . . . . . . . . . . . . . . . . . . . . . . . . . 24
Report Designer . . . . . . . . . . . . . . . . . . . . . . . . . . . . . . . . . . . . . . . . . . . . . . . . . . . . . . . . . . . . 24
Property Sheet . . . . . . . . . . . . . . . . . . . . . . . . . . . . . . . . . . . . . . . . . . . . . . . . . . . . . . . . . . . . . 24
Navigating in the Studio Workspace . . . . . . . . . . . . . . . . . . . . . . . . . . . . . . . . . . . . . . . . . . . . . . . 24
Workspace Functionality . . . . . . . . . . . . . . . . . . . . . . . . . . . . . . . . . . . . . . . . . . . . . . . . . . . . 25
Batch and Book Editor, Batch Scheduler . . . . . . . . . . . . . . . . . . . . . . . . . . . . . . . . . . . . . . . . 25
Design Considerations . . . . . . . . . . . . . . . . . . . . . . . . . . . . . . . . . . . . . . . . . . . . . . . . . . . . . . . . . . 25
Planning Details as a Database Connection . . . . . . . . . . . . . . . . . . . . . . . . . . . . . . . . . . . . . 25
Support for WorkForce Planning Smart Lists . . . . . . . . . . . . . . . . . . . . . . . . . . . . . . . . . . . . 26
Database Connection for Analytic Services and Planning Details . . . . . . . . . . . . . . . . . . . 26
Data Queries - Expanded Versus Single Data Segments . . . . . . . . . . . . . . . . . . . . . . . . . . . 26
Designing Considerations . . . . . . . . . . . . . . . . . . . . . . . . . . . . . . . . . . . . . . . . . . . . . . . . . . . . 26
Recommendations for Designing Dynamic Reports . . . . . . . . . . . . . . . . . . . . . . . . . . . . . . 27
iv Contents
Basic Financial Reporting Tasks . . . . . . . . . . . . . . . . . . . . . . . . . . . . . . . . . . . . . . . . . . . . . . . . . . 27
Starting Financial Reporting Studio . . . . . . . . . . . . . . . . . . . . . . . . . . . . . . . . . . . . . . . . . . . 28
Logging on to Workspace . . . . . . . . . . . . . . . . . . . . . . . . . . . . . . . . . . . . . . . . . . . . . . . . . . . 28
Designing Reports . . . . . . . . . . . . . . . . . . . . . . . . . . . . . . . . . . . . . . . . . . . . . . . . . . . . . . . . . 28
Opening Existing Reports . . . . . . . . . . . . . . . . . . . . . . . . . . . . . . . . . . . . . . . . . . . . . . . . . . . 30
Viewing Snapshot Reports . . . . . . . . . . . . . . . . . . . . . . . . . . . . . . . . . . . . . . . . . . . . . . . . . . . 30
Creating a Book . . . . . . . . . . . . . . . . . . . . . . . . . . . . . . . . . . . . . . . . . . . . . . . . . . . . . . . . . . . 30
Creating a Batch . . . . . . . . . . . . . . . . . . . . . . . . . . . . . . . . . . . . . . . . . . . . . . . . . . . . . . . . . . . 30
Setting Preferences . . . . . . . . . . . . . . . . . . . . . . . . . . . . . . . . . . . . . . . . . . . . . . . . . . . . . . . . . 30
Changing your Password . . . . . . . . . . . . . . . . . . . . . . . . . . . . . . . . . . . . . . . . . . . . . . . . . . . . 31
Closing Studio Explore or the Designer . . . . . . . . . . . . . . . . . . . . . . . . . . . . . . . . . . . . . . . . 31
Exiting Financial Reporting Studio . . . . . . . . . . . . . . . . . . . . . . . . . . . . . . . . . . . . . . . . . . . . 31
Toolbars . . . . . . . . . . . . . . . . . . . . . . . . . . . . . . . . . . . . . . . . . . . . . . . . . . . . . . . . . . . . . . . . . . . . . 31
Standard Toolbar . . . . . . . . . . . . . . . . . . . . . . . . . . . . . . . . . . . . . . . . . . . . . . . . . . . . . . . . . . 31
Designer Toolbar . . . . . . . . . . . . . . . . . . . . . . . . . . . . . . . . . . . . . . . . . . . . . . . . . . . . . . . . . . 32
Menus . . . . . . . . . . . . . . . . . . . . . . . . . . . . . . . . . . . . . . . . . . . . . . . . . . . . . . . . . . . . . . . . . . . . . . . 33
File Menu . . . . . . . . . . . . . . . . . . . . . . . . . . . . . . . . . . . . . . . . . . . . . . . . . . . . . . . . . . . . . . . . . 34
Edit Menu . . . . . . . . . . . . . . . . . . . . . . . . . . . . . . . . . . . . . . . . . . . . . . . . . . . . . . . . . . . . . . . . 34
View Menu . . . . . . . . . . . . . . . . . . . . . . . . . . . . . . . . . . . . . . . . . . . . . . . . . . . . . . . . . . . . . . . 35
Insert Menu . . . . . . . . . . . . . . . . . . . . . . . . . . . . . . . . . . . . . . . . . . . . . . . . . . . . . . . . . . . . . . . 35
Format Menu . . . . . . . . . . . . . . . . . . . . . . . . . . . . . . . . . . . . . . . . . . . . . . . . . . . . . . . . . . . . . 36
Task Menu . . . . . . . . . . . . . . . . . . . . . . . . . . . . . . . . . . . . . . . . . . . . . . . . . . . . . . . . . . . . . . . . 36
Administration Menu . . . . . . . . . . . . . . . . . . . . . . . . . . . . . . . . . . . . . . . . . . . . . . . . . . . . . . 37
Window Menu . . . . . . . . . . . . . . . . . . . . . . . . . . . . . . . . . . . . . . . . . . . . . . . . . . . . . . . . . . . . 37
Help Menu . . . . . . . . . . . . . . . . . . . . . . . . . . . . . . . . . . . . . . . . . . . . . . . . . . . . . . . . . . . . . . . 37
Shortcut Menu Commands . . . . . . . . . . . . . . . . . . . . . . . . . . . . . . . . . . . . . . . . . . . . . . . . . . . . . 38
Error Messages . . . . . . . . . . . . . . . . . . . . . . . . . . . . . . . . . . . . . . . . . . . . . . . . . . . . . . . . . . . . . . . . 41
CHAPTER 2 Selecting Members for Report Designers . . . . . . . . . . . . . . . . . . . . . . . . . . . . . . . . . . . . . . . . . . . . 43
Select Members Dialog Box . . . . . . . . . . . . . . . . . . . . . . . . . . . . . . . . . . . . . . . . . . . . . . . . . . . . . 44
Available Area . . . . . . . . . . . . . . . . . . . . . . . . . . . . . . . . . . . . . . . . . . . . . . . . . . . . . . . . . . . . . 45
Organization by Period Reporting . . . . . . . . . . . . . . . . . . . . . . . . . . . . . . . . . . . . . . . . . . . . 48
Assigning Members to Data Rows or Columns . . . . . . . . . . . . . . . . . . . . . . . . . . . . . . . . . . . . . 48
Assigning Members to the Page Axis . . . . . . . . . . . . . . . . . . . . . . . . . . . . . . . . . . . . . . . . . . . . . . 50
Assigning Special Members . . . . . . . . . . . . . . . . . . . . . . . . . . . . . . . . . . . . . . . . . . . . . . . . . . . . . 50
Setting Up Report Prompts for Members . . . . . . . . . . . . . . . . . . . . . . . . . . . . . . . . . . . . . . 51
Setting Up Same As References . . . . . . . . . . . . . . . . . . . . . . . . . . . . . . . . . . . . . . . . . . . . . . . 52
Setting Up a Current Point of View . . . . . . . . . . . . . . . . . . . . . . . . . . . . . . . . . . . . . . . . . . . 53
Selecting the User Point of View as a Member in the Book Point of View . . . . . . . . . . . . 54
Using Calculated and Restricted Key Figures . . . . . . . . . . . . . . . . . . . . . . . . . . . . . . . . . . . . 54
Assigning Members Using Functions . . . . . . . . . . . . . . . . . . . . . . . . . . . . . . . . . . . . . . . . . . . . . 54
Editing Functions . . . . . . . . . . . . . . . . . . . . . . . . . . . . . . . . . . . . . . . . . . . . . . . . . . . . . . . . . . . . . 61
Copying Members Between Applications . . . . . . . . . . . . . . . . . . . . . . . . . . . . . . . . . . . . . . . . . . 61
Contents v
Removing or Adding Members . . . . . . . . . . . . . . . . . . . . . . . . . . . . . . . . . . . . . . . . . . . . . . . . . . . 62
Selecting Multiple Members Based on Criteria . . . . . . . . . . . . . . . . . . . . . . . . . . . . . . . . . . . . . . 62
Filtering the View of Members Based on Criteria . . . . . . . . . . . . . . . . . . . . . . . . . . . . . . . . . . . . 63
Defining Member Lists . . . . . . . . . . . . . . . . . . . . . . . . . . . . . . . . . . . . . . . . . . . . . . . . . . . . . . . . . . 64
Editing Member Lists . . . . . . . . . . . . . . . . . . . . . . . . . . . . . . . . . . . . . . . . . . . . . . . . . . . . . . . . . . . 65
Searching for Members . . . . . . . . . . . . . . . . . . . . . . . . . . . . . . . . . . . . . . . . . . . . . . . . . . . . . . . . . 65
Sorting Members . . . . . . . . . . . . . . . . . . . . . . . . . . . . . . . . . . . . . . . . . . . . . . . . . . . . . . . . . . . . . . 67
Previewing Selected Members . . . . . . . . . . . . . . . . . . . . . . . . . . . . . . . . . . . . . . . . . . . . . . . . . . . . 67
Access Privileges for the Planning Details Database Source . . . . . . . . . . . . . . . . . . . . . . . . . . . . 68
CHAPTER 3 Customizing Charts . . . . . . . . . . . . . . . . . . . . . . . . . . . . . . . . . . . . . . . . . . . . . . . . . . . . . . . . . . . . . . 71
About Charts . . . . . . . . . . . . . . . . . . . . . . . . . . . . . . . . . . . . . . . . . . . . . . . . . . . . . . . . . . . . . . . . . . 72
Bar Charts . . . . . . . . . . . . . . . . . . . . . . . . . . . . . . . . . . . . . . . . . . . . . . . . . . . . . . . . . . . . . . . . . 72
Line Charts . . . . . . . . . . . . . . . . . . . . . . . . . . . . . . . . . . . . . . . . . . . . . . . . . . . . . . . . . . . . . . . . 73
Combo Charts . . . . . . . . . . . . . . . . . . . . . . . . . . . . . . . . . . . . . . . . . . . . . . . . . . . . . . . . . . . . . 73
Pie Charts . . . . . . . . . . . . . . . . . . . . . . . . . . . . . . . . . . . . . . . . . . . . . . . . . . . . . . . . . . . . . . . . . 74
Formatting Charts . . . . . . . . . . . . . . . . . . . . . . . . . . . . . . . . . . . . . . . . . . . . . . . . . . . . . . . . . . . . . 75
Defining Chart Data . . . . . . . . . . . . . . . . . . . . . . . . . . . . . . . . . . . . . . . . . . . . . . . . . . . . . . . . 76
Using the Format Chart Dialog Box . . . . . . . . . . . . . . . . . . . . . . . . . . . . . . . . . . . . . . . . . . . 78
Formatting Fonts in Charts . . . . . . . . . . . . . . . . . . . . . . . . . . . . . . . . . . . . . . . . . . . . . . . . . . 80
Formatting Chart Border and Background Options . . . . . . . . . . . . . . . . . . . . . . . . . . . . . . 81
Formatting Bars in Bar and Combo Charts . . . . . . . . . . . . . . . . . . . . . . . . . . . . . . . . . . . . . 82
Formatting Lines in Line and Combo Charts . . . . . . . . . . . . . . . . . . . . . . . . . . . . . . . . . . . . 83
Defining Combo Chart Options . . . . . . . . . . . . . . . . . . . . . . . . . . . . . . . . . . . . . . . . . . . . . . 84
Formatting Pie Charts . . . . . . . . . . . . . . . . . . . . . . . . . . . . . . . . . . . . . . . . . . . . . . . . . . . . . . . 84
Setting Background Options for a Chart . . . . . . . . . . . . . . . . . . . . . . . . . . . . . . . . . . . . . . . . 85
Positioning Charts on Reports . . . . . . . . . . . . . . . . . . . . . . . . . . . . . . . . . . . . . . . . . . . . . . . . 86
Defining Gridlines . . . . . . . . . . . . . . . . . . . . . . . . . . . . . . . . . . . . . . . . . . . . . . . . . . . . . . . . . . 86
Defining Styles for Data Sets . . . . . . . . . . . . . . . . . . . . . . . . . . . . . . . . . . . . . . . . . . . . . . . . . 87
Resizing and Moving Charts . . . . . . . . . . . . . . . . . . . . . . . . . . . . . . . . . . . . . . . . . . . . . . . . . . 87
Formatting Chart Titles and Labels . . . . . . . . . . . . . . . . . . . . . . . . . . . . . . . . . . . . . . . . . . . . . . . 88
Defining a Chart Legend Title . . . . . . . . . . . . . . . . . . . . . . . . . . . . . . . . . . . . . . . . . . . . . . . . 88
Defining a Chart Title . . . . . . . . . . . . . . . . . . . . . . . . . . . . . . . . . . . . . . . . . . . . . . . . . . . . . . . 89
Defining Chart Axis Titles . . . . . . . . . . . . . . . . . . . . . . . . . . . . . . . . . . . . . . . . . . . . . . . . . . . 89
Defining Axis Labels . . . . . . . . . . . . . . . . . . . . . . . . . . . . . . . . . . . . . . . . . . . . . . . . . . . . . . . . 90
Viewing Charts . . . . . . . . . . . . . . . . . . . . . . . . . . . . . . . . . . . . . . . . . . . . . . . . . . . . . . . . . . . . 91
CHAPTER 4 Building Reports . . . . . . . . . . . . . . . . . . . . . . . . . . . . . . . . . . . . . . . . . . . . . . . . . . . . . . . . . . . . . . . . 93
Adding Report Objects . . . . . . . . . . . . . . . . . . . . . . . . . . . . . . . . . . . . . . . . . . . . . . . . . . . . . . . . . . 94
Using Linked and Local Objects . . . . . . . . . . . . . . . . . . . . . . . . . . . . . . . . . . . . . . . . . . . . . . . 94
Adding Text Objects . . . . . . . . . . . . . . . . . . . . . . . . . . . . . . . . . . . . . . . . . . . . . . . . . . . . . . . . . . . . 96
Modifying Text Objects . . . . . . . . . . . . . . . . . . . . . . . . . . . . . . . . . . . . . . . . . . . . . . . . . . . . . . 97
Saving Text Objects . . . . . . . . . . . . . . . . . . . . . . . . . . . . . . . . . . . . . . . . . . . . . . . . . . . . . . . . . 97
vi Contents
Adding Grids . . . . . . . . . . . . . . . . . . . . . . . . . . . . . . . . . . . . . . . . . . . . . . . . . . . . . . . . . . . . . . . . . 98
Modifying the Properties of Grid Objects . . . . . . . . . . . . . . . . . . . . . . . . . . . . . . . . . . . . . 101
Saving Grid Objects . . . . . . . . . . . . . . . . . . . . . . . . . . . . . . . . . . . . . . . . . . . . . . . . . . . . . . . 101
Inserting Images . . . . . . . . . . . . . . . . . . . . . . . . . . . . . . . . . . . . . . . . . . . . . . . . . . . . . . . . . . . . . 102
Saving Image Objects . . . . . . . . . . . . . . . . . . . . . . . . . . . . . . . . . . . . . . . . . . . . . . . . . . . . . . 103
Inserting Charts . . . . . . . . . . . . . . . . . . . . . . . . . . . . . . . . . . . . . . . . . . . . . . . . . . . . . . . . . . . . . . 103
Saving Chart Objects . . . . . . . . . . . . . . . . . . . . . . . . . . . . . . . . . . . . . . . . . . . . . . . . . . . . . . 104
Creating Headers and Footers . . . . . . . . . . . . . . . . . . . . . . . . . . . . . . . . . . . . . . . . . . . . . . . . . . 105
Positioning Report Objects . . . . . . . . . . . . . . . . . . . . . . . . . . . . . . . . . . . . . . . . . . . . . . . . . . . . . 105
Resizing Report Objects . . . . . . . . . . . . . . . . . . . . . . . . . . . . . . . . . . . . . . . . . . . . . . . . . . . . . . . 106
Saving Report Objects . . . . . . . . . . . . . . . . . . . . . . . . . . . . . . . . . . . . . . . . . . . . . . . . . . . . . . . . . 107
Removing Report Objects from a Report . . . . . . . . . . . . . . . . . . . . . . . . . . . . . . . . . . . . . . . . . 108
Designing Headers and Footers . . . . . . . . . . . . . . . . . . . . . . . . . . . . . . . . . . . . . . . . . . . . . . . . . 108
Creating a Title Page . . . . . . . . . . . . . . . . . . . . . . . . . . . . . . . . . . . . . . . . . . . . . . . . . . . . . . . . . . 109
Inserting Page Breaks Before Report Objects . . . . . . . . . . . . . . . . . . . . . . . . . . . . . . . . . . . . . . 109
Viewing Report Summaries . . . . . . . . . . . . . . . . . . . . . . . . . . . . . . . . . . . . . . . . . . . . . . . . . . . . 109
Viewing Server Information . . . . . . . . . . . . . . . . . . . . . . . . . . . . . . . . . . . . . . . . . . . . . . . . . . . . 110
CHAPTER 5 Customizing Grids . . . . . . . . . . . . . . . . . . . . . . . . . . . . . . . . . . . . . . . . . . . . . . . . . . . . . . . . . . . . . 113
Inserting Rows or Columns in Grids . . . . . . . . . . . . . . . . . . . . . . . . . . . . . . . . . . . . . . . . . . . . . 114
Cutting, Copying, and Pasting in Grids . . . . . . . . . . . . . . . . . . . . . . . . . . . . . . . . . . . . . . . . . . 115
Specifying Row and Column Headings for Grids . . . . . . . . . . . . . . . . . . . . . . . . . . . . . . . . . . . 116
Overriding Row and Column Headings for Grids . . . . . . . . . . . . . . . . . . . . . . . . . . . . . . 117
About Row and Column Templates . . . . . . . . . . . . . . . . . . . . . . . . . . . . . . . . . . . . . . . . . . . . . 119
How Inheritance Works with Row and Column Templates . . . . . . . . . . . . . . . . . . . . . . . 120
Property Values . . . . . . . . . . . . . . . . . . . . . . . . . . . . . . . . . . . . . . . . . . . . . . . . . . . . . . . . . . . 120
Creating a Row and Column Template . . . . . . . . . . . . . . . . . . . . . . . . . . . . . . . . . . . . . . . . . . . 122
Inserting a Row and Column Template . . . . . . . . . . . . . . . . . . . . . . . . . . . . . . . . . . . . . . . . . . . 125
Unlinking a Row and Column Template . . . . . . . . . . . . . . . . . . . . . . . . . . . . . . . . . . . . . . . . . . 125
Modifying an Row and Column Template . . . . . . . . . . . . . . . . . . . . . . . . . . . . . . . . . . . . . . . . 126
Setting Data Query Optimization Options . . . . . . . . . . . . . . . . . . . . . . . . . . . . . . . . . . . . . . . . 126
Enabling Expansions for Analytic Services . . . . . . . . . . . . . . . . . . . . . . . . . . . . . . . . . . . . . . . . 129
Displaying Line Item Detail for Financial Management . . . . . . . . . . . . . . . . . . . . . . . . . . . . . 129
Showing Supporting Detail for Planning . . . . . . . . . . . . . . . . . . . . . . . . . . . . . . . . . . . . . . . . . 129
Defining the Grid Point of View . . . . . . . . . . . . . . . . . . . . . . . . . . . . . . . . . . . . . . . . . . . . . . . . 131
Showing or Hiding the Grid POV Bar . . . . . . . . . . . . . . . . . . . . . . . . . . . . . . . . . . . . . . . . 131
Selecting Members for the Grid Point of View . . . . . . . . . . . . . . . . . . . . . . . . . . . . . . . . . 132
Setting Up a Grid Point of View . . . . . . . . . . . . . . . . . . . . . . . . . . . . . . . . . . . . . . . . . . . . . . . . . 132
Inserting Page Breaks . . . . . . . . . . . . . . . . . . . . . . . . . . . . . . . . . . . . . . . . . . . . . . . . . . . . . . . . . 133
Defining Page Axis Headings . . . . . . . . . . . . . . . . . . . . . . . . . . . . . . . . . . . . . . . . . . . . . . . . . . . 134
Changing the Database Connection of Grids . . . . . . . . . . . . . . . . . . . . . . . . . . . . . . . . . . . . . . 135
Contents vii
Assigning Multiple Database Connection to Grids . . . . . . . . . . . . . . . . . . . . . . . . . . . . . . . . . . 136
Adding Auto Calculations to Data Rows and Columns . . . . . . . . . . . . . . . . . . . . . . . . . . . . . . 136
Applying Formatting to Auto Calculated Data Rows and Columns . . . . . . . . . . . . . . . . . 140
Defining Formula Rows or Columns . . . . . . . . . . . . . . . . . . . . . . . . . . . . . . . . . . . . . . . . . . . . . 141
Defining Headings for Formula Rows and Columns . . . . . . . . . . . . . . . . . . . . . . . . . . . . . 143
Expanding Rows or Columns . . . . . . . . . . . . . . . . . . . . . . . . . . . . . . . . . . . . . . . . . . . . . . . . 143
Multiple Calculation Iterations . . . . . . . . . . . . . . . . . . . . . . . . . . . . . . . . . . . . . . . . . . . . . . 148
Using the Formula Bar . . . . . . . . . . . . . . . . . . . . . . . . . . . . . . . . . . . . . . . . . . . . . . . . . . . . . . . . . 148
Example Report with Formulas . . . . . . . . . . . . . . . . . . . . . . . . . . . . . . . . . . . . . . . . . . . . . . 148
Creating Formulas Using the Formula Bar . . . . . . . . . . . . . . . . . . . . . . . . . . . . . . . . . . . . . 150
Editing Formulas Using the Formula Bar . . . . . . . . . . . . . . . . . . . . . . . . . . . . . . . . . . . . . . 151
Deleting Formulas . . . . . . . . . . . . . . . . . . . . . . . . . . . . . . . . . . . . . . . . . . . . . . . . . . . . . . . . . 152
Modifying Member Selection Using the Formula Bar . . . . . . . . . . . . . . . . . . . . . . . . . . . . 152
Accessing Property Sheet Features . . . . . . . . . . . . . . . . . . . . . . . . . . . . . . . . . . . . . . . . . . . . . . . 153
Calculating at the Cell Level . . . . . . . . . . . . . . . . . . . . . . . . . . . . . . . . . . . . . . . . . . . . . . . . . . . . 153
Using Text Functions to Display Information . . . . . . . . . . . . . . . . . . . . . . . . . . . . . . . . . . . . . . 154
CHAPTER 6 Defining the User POV. . . . . . . . . . . . . . . . . . . . . . . . . . . . . . . . . . . . . . . . . . . . . . . . . . . . . . . . . . . 157
Setting Up the User POV from the Report Designer . . . . . . . . . . . . . . . . . . . . . . . . . . . . . . . . . 158
Selecting Members for the User POV from the Report Designer . . . . . . . . . . . . . . . . . . . . . . . 159
CHAPTER 7 Providing for Detailed Data and Documents in Reports . . . . . . . . . . . . . . . . . . . . . . . . . . . . . . . . 161
Setting Up Expansions to Access Detail Data Within Reports . . . . . . . . . . . . . . . . . . . . . . . . . 162
Positioning Expansion Rows and Columns . . . . . . . . . . . . . . . . . . . . . . . . . . . . . . . . . . . . . . . . 162
Attaching Cell Documents in a Report . . . . . . . . . . . . . . . . . . . . . . . . . . . . . . . . . . . . . . . . . . . . 163
Supported File Microsoft Office File Types . . . . . . . . . . . . . . . . . . . . . . . . . . . . . . . . . . . . . 163
Supported Print and Print Preview Options . . . . . . . . . . . . . . . . . . . . . . . . . . . . . . . . . . . . 163
Considerations . . . . . . . . . . . . . . . . . . . . . . . . . . . . . . . . . . . . . . . . . . . . . . . . . . . . . . . . . . . . 165
Printing Cell Documents . . . . . . . . . . . . . . . . . . . . . . . . . . . . . . . . . . . . . . . . . . . . . . . . . . . . . . . 165
Printing a List of Attached Cell Documents . . . . . . . . . . . . . . . . . . . . . . . . . . . . . . . . . . . . 166
Setting Up Links to Related Content . . . . . . . . . . . . . . . . . . . . . . . . . . . . . . . . . . . . . . . . . . . . . 166
Changing the Related Content Server for Multiple Reports or Grids in the Repository . 166
Creating Links to Related Content . . . . . . . . . . . . . . . . . . . . . . . . . . . . . . . . . . . . . . . . . . . . . . . 167
Removing Access from Related Content . . . . . . . . . . . . . . . . . . . . . . . . . . . . . . . . . . . . . . . . . . . 168
Modifying the Properties for Related Content . . . . . . . . . . . . . . . . . . . . . . . . . . . . . . . . . . . . . . 168
Related Content Properties Dialog box . . . . . . . . . . . . . . . . . . . . . . . . . . . . . . . . . . . . . . . 169
Using Smart View for Office . . . . . . . . . . . . . . . . . . . . . . . . . . . . . . . . . . . . . . . . . . . . . . . . . . . . 169
CHAPTER 8 Previewing and Printing Reports . . . . . . . . . . . . . . . . . . . . . . . . . . . . . . . . . . . . . . . . . . . . . . . . . . 171
Responding to Prompts when Previewing . . . . . . . . . . . . . . . . . . . . . . . . . . . . . . . . . . . . . . . . . 172
Previewing the Current User POV Settings . . . . . . . . . . . . . . . . . . . . . . . . . . . . . . . . . . . . . . . . 172
Setting Preview Preferences . . . . . . . . . . . . . . . . . . . . . . . . . . . . . . . . . . . . . . . . . . . . . . . . . . . . . 173
viii Contents
Previewing Reports in a Web Browser . . . . . . . . . . . . . . . . . . . . . . . . . . . . . . . . . . . . . . . . . . . . 173
Previewing Reports in Financial Reporting Studio . . . . . . . . . . . . . . . . . . . . . . . . . . . . . . . . . 173
Printing Reports . . . . . . . . . . . . . . . . . . . . . . . . . . . . . . . . . . . . . . . . . . . . . . . . . . . . . . . . . . . . . 174
Printing Tips for Report Designers . . . . . . . . . . . . . . . . . . . . . . . . . . . . . . . . . . . . . . . . . . . . . . 174
Positioning and Alignment . . . . . . . . . . . . . . . . . . . . . . . . . . . . . . . . . . . . . . . . . . . . . . . . . 174
Printing Text Boxes . . . . . . . . . . . . . . . . . . . . . . . . . . . . . . . . . . . . . . . . . . . . . . . . . . . . . . . . 175
Printing Grids . . . . . . . . . . . . . . . . . . . . . . . . . . . . . . . . . . . . . . . . . . . . . . . . . . . . . . . . . . . . 175
Printing Page Dimension Headings . . . . . . . . . . . . . . . . . . . . . . . . . . . . . . . . . . . . . . . . . . 175
Printing Page Members . . . . . . . . . . . . . . . . . . . . . . . . . . . . . . . . . . . . . . . . . . . . . . . . . . . . 176
Printing Headers and Footers . . . . . . . . . . . . . . . . . . . . . . . . . . . . . . . . . . . . . . . . . . . . . . . 176
CHAPTER 9 Formatting Reports . . . . . . . . . . . . . . . . . . . . . . . . . . . . . . . . . . . . . . . . . . . . . . . . . . . . . . . . . . . . 177
Formatting Text Boxes . . . . . . . . . . . . . . . . . . . . . . . . . . . . . . . . . . . . . . . . . . . . . . . . . . . . . . . . . 178
Specifying Fonts for Text Boxes . . . . . . . . . . . . . . . . . . . . . . . . . . . . . . . . . . . . . . . . . . . . . . 178
Aligining Text in Text Boxes . . . . . . . . . . . . . . . . . . . . . . . . . . . . . . . . . . . . . . . . . . . . . . . . . 178
Adding Borders and Shading to Text Boxes . . . . . . . . . . . . . . . . . . . . . . . . . . . . . . . . . . . . 179
Formatting Grids . . . . . . . . . . . . . . . . . . . . . . . . . . . . . . . . . . . . . . . . . . . . . . . . . . . . . . . . . 179
Expanding the View of a Grid . . . . . . . . . . . . . . . . . . . . . . . . . . . . . . . . . . . . . . . . . . . . . . . 180
Formatting Best Practices . . . . . . . . . . . . . . . . . . . . . . . . . . . . . . . . . . . . . . . . . . . . . . . . . . 180
Formatting Numbers in Grids . . . . . . . . . . . . . . . . . . . . . . . . . . . . . . . . . . . . . . . . . . . . . . . 180
Hiding Rows, Columns, or Grids . . . . . . . . . . . . . . . . . . . . . . . . . . . . . . . . . . . . . . . . . . . . 190
Controlling the Evaluation of Suppression in Hidden Rows or Columns . . . . . . . . . . . 190
Sorting Rows, Columns, and Pages . . . . . . . . . . . . . . . . . . . . . . . . . . . . . . . . . . . . . . . . . . . 191
About Conditional Formatting . . . . . . . . . . . . . . . . . . . . . . . . . . . . . . . . . . . . . . . . . . . . . . . . . 193
Applying Conditional Formatting on Grids . . . . . . . . . . . . . . . . . . . . . . . . . . . . . . . . . . . 196
Adding Conditional Formats . . . . . . . . . . . . . . . . . . . . . . . . . . . . . . . . . . . . . . . . . . . . . . . . 200
Changing the Order of Conditional Formats . . . . . . . . . . . . . . . . . . . . . . . . . . . . . . . . . . . 200
Deleting Conditional Formats . . . . . . . . . . . . . . . . . . . . . . . . . . . . . . . . . . . . . . . . . . . . . . . 201
Changing Row Height and Column Width . . . . . . . . . . . . . . . . . . . . . . . . . . . . . . . . . . . . 201
Merging Cells into One Cell . . . . . . . . . . . . . . . . . . . . . . . . . . . . . . . . . . . . . . . . . . . . . . . . 202
Conditional Suppression . . . . . . . . . . . . . . . . . . . . . . . . . . . . . . . . . . . . . . . . . . . . . . . . . . . . . . 202
Behavior of Conditional Suppression . . . . . . . . . . . . . . . . . . . . . . . . . . . . . . . . . . . . . . . . . 203
Using the Basic Option in Conditional Suppression . . . . . . . . . . . . . . . . . . . . . . . . . . . . . 204
Using the Advanced Option in Conditional Suppression . . . . . . . . . . . . . . . . . . . . . . . . . 205
Deleting Conditional Suppression . . . . . . . . . . . . . . . . . . . . . . . . . . . . . . . . . . . . . . . . . . . 209
Formatting Images . . . . . . . . . . . . . . . . . . . . . . . . . . . . . . . . . . . . . . . . . . . . . . . . . . . . . . . . . . . 209
Changing the Page Setup . . . . . . . . . . . . . . . . . . . . . . . . . . . . . . . . . . . . . . . . . . . . . . . . . . . . . . 210
CHAPTER 10 Using Functions . . . . . . . . . . . . . . . . . . . . . . . . . . . . . . . . . . . . . . . . . . . . . . . . . . . . . . . . . . . . . . . 213
Mathematical Functions . . . . . . . . . . . . . . . . . . . . . . . . . . . . . . . . . . . . . . . . . . . . . . . . . . . . . . . 214
Arguments . . . . . . . . . . . . . . . . . . . . . . . . . . . . . . . . . . . . . . . . . . . . . . . . . . . . . . . . . . . . . . . 215
Text Functions . . . . . . . . . . . . . . . . . . . . . . . . . . . . . . . . . . . . . . . . . . . . . . . . . . . . . . . . . . . . . . . 219
Text Function Consideration . . . . . . . . . . . . . . . . . . . . . . . . . . . . . . . . . . . . . . . . . . . . . . . . 220
Contents ix
Current / Cur Keyword . . . . . . . . . . . . . . . . . . . . . . . . . . . . . . . . . . . . . . . . . . . . . . . . . . . . . 221
List of Functions . . . . . . . . . . . . . . . . . . . . . . . . . . . . . . . . . . . . . . . . . . . . . . . . . . . . . . . . . . . . . . 226
Abs . . . . . . . . . . . . . . . . . . . . . . . . . . . . . . . . . . . . . . . . . . . . . . . . . . . . . . . . . . . . . . . . . . . . . 226
Average . . . . . . . . . . . . . . . . . . . . . . . . . . . . . . . . . . . . . . . . . . . . . . . . . . . . . . . . . . . . . . . . . . 227
AverageA . . . . . . . . . . . . . . . . . . . . . . . . . . . . . . . . . . . . . . . . . . . . . . . . . . . . . . . . . . . . . . . . . 228
CalcStatus . . . . . . . . . . . . . . . . . . . . . . . . . . . . . . . . . . . . . . . . . . . . . . . . . . . . . . . . . . . . . . . . 228
CellText . . . . . . . . . . . . . . . . . . . . . . . . . . . . . . . . . . . . . . . . . . . . . . . . . . . . . . . . . . . . . . . . . . 229
Count . . . . . . . . . . . . . . . . . . . . . . . . . . . . . . . . . . . . . . . . . . . . . . . . . . . . . . . . . . . . . . . . . . . 232
CountA . . . . . . . . . . . . . . . . . . . . . . . . . . . . . . . . . . . . . . . . . . . . . . . . . . . . . . . . . . . . . . . . . . 233
DataSource . . . . . . . . . . . . . . . . . . . . . . . . . . . . . . . . . . . . . . . . . . . . . . . . . . . . . . . . . . . . . . . 233
Date . . . . . . . . . . . . . . . . . . . . . . . . . . . . . . . . . . . . . . . . . . . . . . . . . . . . . . . . . . . . . . . . . . . . . 235
Difference . . . . . . . . . . . . . . . . . . . . . . . . . . . . . . . . . . . . . . . . . . . . . . . . . . . . . . . . . . . . . . . . 237
Eval . . . . . . . . . . . . . . . . . . . . . . . . . . . . . . . . . . . . . . . . . . . . . . . . . . . . . . . . . . . . . . . . . . . . . 238
GetCell . . . . . . . . . . . . . . . . . . . . . . . . . . . . . . . . . . . . . . . . . . . . . . . . . . . . . . . . . . . . . . . . . . 239
GetHeading . . . . . . . . . . . . . . . . . . . . . . . . . . . . . . . . . . . . . . . . . . . . . . . . . . . . . . . . . . . . . . 240
GridDimension . . . . . . . . . . . . . . . . . . . . . . . . . . . . . . . . . . . . . . . . . . . . . . . . . . . . . . . . . . . 241
HFMCurrency . . . . . . . . . . . . . . . . . . . . . . . . . . . . . . . . . . . . . . . . . . . . . . . . . . . . . . . . . . . . 242
ListOfCellDocuments . . . . . . . . . . . . . . . . . . . . . . . . . . . . . . . . . . . . . . . . . . . . . . . . . . . . . . 244
IfThen, If . . . . . . . . . . . . . . . . . . . . . . . . . . . . . . . . . . . . . . . . . . . . . . . . . . . . . . . . . . . . . . . . . 245
Max . . . . . . . . . . . . . . . . . . . . . . . . . . . . . . . . . . . . . . . . . . . . . . . . . . . . . . . . . . . . . . . . . . . . . 248
MemberAlias . . . . . . . . . . . . . . . . . . . . . . . . . . . . . . . . . . . . . . . . . . . . . . . . . . . . . . . . . . . . . 249
MemberDescription . . . . . . . . . . . . . . . . . . . . . . . . . . . . . . . . . . . . . . . . . . . . . . . . . . . . . . . 250
MemberName . . . . . . . . . . . . . . . . . . . . . . . . . . . . . . . . . . . . . . . . . . . . . . . . . . . . . . . . . . . . 251
MemberProperty . . . . . . . . . . . . . . . . . . . . . . . . . . . . . . . . . . . . . . . . . . . . . . . . . . . . . . . . . . 252
MemberQualifiedName . . . . . . . . . . . . . . . . . . . . . . . . . . . . . . . . . . . . . . . . . . . . . . . . . . . . 254
Min . . . . . . . . . . . . . . . . . . . . . . . . . . . . . . . . . . . . . . . . . . . . . . . . . . . . . . . . . . . . . . . . . . . . . 255
Mod . . . . . . . . . . . . . . . . . . . . . . . . . . . . . . . . . . . . . . . . . . . . . . . . . . . . . . . . . . . . . . . . . . . . . 255
Page . . . . . . . . . . . . . . . . . . . . . . . . . . . . . . . . . . . . . . . . . . . . . . . . . . . . . . . . . . . . . . . . . . . . . 256
PageCount . . . . . . . . . . . . . . . . . . . . . . . . . . . . . . . . . . . . . . . . . . . . . . . . . . . . . . . . . . . . . . . 257
PercentOfTotal . . . . . . . . . . . . . . . . . . . . . . . . . . . . . . . . . . . . . . . . . . . . . . . . . . . . . . . . . . . . 257
Pi . . . . . . . . . . . . . . . . . . . . . . . . . . . . . . . . . . . . . . . . . . . . . . . . . . . . . . . . . . . . . . . . . . . . . . . 258
PlanningAnnotations . . . . . . . . . . . . . . . . . . . . . . . . . . . . . . . . . . . . . . . . . . . . . . . . . . . . . . 258
POVAlias . . . . . . . . . . . . . . . . . . . . . . . . . . . . . . . . . . . . . . . . . . . . . . . . . . . . . . . . . . . . . . . . . 261
POVDescription . . . . . . . . . . . . . . . . . . . . . . . . . . . . . . . . . . . . . . . . . . . . . . . . . . . . . . . . . . 261
POV / POVMember . . . . . . . . . . . . . . . . . . . . . . . . . . . . . . . . . . . . . . . . . . . . . . . . . . . . . . . 262
ProcessManagementStatus . . . . . . . . . . . . . . . . . . . . . . . . . . . . . . . . . . . . . . . . . . . . . . . . . . 262
Product . . . . . . . . . . . . . . . . . . . . . . . . . . . . . . . . . . . . . . . . . . . . . . . . . . . . . . . . . . . . . . . . . . 263
Random . . . . . . . . . . . . . . . . . . . . . . . . . . . . . . . . . . . . . . . . . . . . . . . . . . . . . . . . . . . . . . . . . 264
Rank . . . . . . . . . . . . . . . . . . . . . . . . . . . . . . . . . . . . . . . . . . . . . . . . . . . . . . . . . . . . . . . . . . . . 264
ReportAuthor . . . . . . . . . . . . . . . . . . . . . . . . . . . . . . . . . . . . . . . . . . . . . . . . . . . . . . . . . . . . . 265
ReportCreated . . . . . . . . . . . . . . . . . . . . . . . . . . . . . . . . . . . . . . . . . . . . . . . . . . . . . . . . . . . . 266
ReportDesc . . . . . . . . . . . . . . . . . . . . . . . . . . . . . . . . . . . . . . . . . . . . . . . . . . . . . . . . . . . . . . . 266
ReportFolder . . . . . . . . . . . . . . . . . . . . . . . . . . . . . . . . . . . . . . . . . . . . . . . . . . . . . . . . . . . . . 266
ReportModified . . . . . . . . . . . . . . . . . . . . . . . . . . . . . . . . . . . . . . . . . . . . . . . . . . . . . . . . . . . 267
x Contents
ReportModifiedBy . . . . . . . . . . . . . . . . . . . . . . . . . . . . . . . . . . . . . . . . . . . . . . . . . . . . . . . . 267
ReportName . . . . . . . . . . . . . . . . . . . . . . . . . . . . . . . . . . . . . . . . . . . . . . . . . . . . . . . . . . . . . 268
ReportRunBy . . . . . . . . . . . . . . . . . . . . . . . . . . . . . . . . . . . . . . . . . . . . . . . . . . . . . . . . . . . . . 268
Round . . . . . . . . . . . . . . . . . . . . . . . . . . . . . . . . . . . . . . . . . . . . . . . . . . . . . . . . . . . . . . . . . . 268
Sqrt . . . . . . . . . . . . . . . . . . . . . . . . . . . . . . . . . . . . . . . . . . . . . . . . . . . . . . . . . . . . . . . . . . . . . 269
Sum . . . . . . . . . . . . . . . . . . . . . . . . . . . . . . . . . . . . . . . . . . . . . . . . . . . . . . . . . . . . . . . . . . . . 269
Truncate / Trunc . . . . . . . . . . . . . . . . . . . . . . . . . . . . . . . . . . . . . . . . . . . . . . . . . . . . . . . . . . 270
Variance / Var . . . . . . . . . . . . . . . . . . . . . . . . . . . . . . . . . . . . . . . . . . . . . . . . . . . . . . . . . . . . 271
VariancePercent / VarPer . . . . . . . . . . . . . . . . . . . . . . . . . . . . . . . . . . . . . . . . . . . . . . . . . . . 274
xbrlContext . . . . . . . . . . . . . . . . . . . . . . . . . . . . . . . . . . . . . . . . . . . . . . . . . . . . . . . . . . . . . . 276
xbrlLineItem . . . . . . . . . . . . . . . . . . . . . . . . . . . . . . . . . . . . . . . . . . . . . . . . . . . . . . . . . . . . . 277
Mathematical Operators in Expressions . . . . . . . . . . . . . . . . . . . . . . . . . . . . . . . . . . . . . . . . . . 277
Mathematical Operands in Expressions . . . . . . . . . . . . . . . . . . . . . . . . . . . . . . . . . . . . . . . . . . 278
Natural Precedence . . . . . . . . . . . . . . . . . . . . . . . . . . . . . . . . . . . . . . . . . . . . . . . . . . . . . . . . . . . 279
CHAPTER 11 Managing the Explore Repository . . . . . . . . . . . . . . . . . . . . . . . . . . . . . . . . . . . . . . . . . . . . . . . . . 281
Creating Folders . . . . . . . . . . . . . . . . . . . . . . . . . . . . . . . . . . . . . . . . . . . . . . . . . . . . . . . . . . . . . . 281
Duplicating Objects in the Repository . . . . . . . . . . . . . . . . . . . . . . . . . . . . . . . . . . . . . . . . . . . 282
Filtering Report Objects . . . . . . . . . . . . . . . . . . . . . . . . . . . . . . . . . . . . . . . . . . . . . . . . . . . . . . . 282
Cutting, Copying, and Pasting in the Repository . . . . . . . . . . . . . . . . . . . . . . . . . . . . . . . . . . . 283
Managing Database Connections . . . . . . . . . . . . . . . . . . . . . . . . . . . . . . . . . . . . . . . . . . . . . . . 283
Exporting Repository Objects and Report Objects . . . . . . . . . . . . . . . . . . . . . . . . . . . . . . . . . 283
Importing Report Objects into the Repository . . . . . . . . . . . . . . . . . . . . . . . . . . . . . . . . . . . . . 283
Sending Links to Reports Through E-Mail . . . . . . . . . . . . . . . . . . . . . . . . . . . . . . . . . . . . . . . . 283
Deleting Items from the Repository . . . . . . . . . . . . . . . . . . . . . . . . . . . . . . . . . . . . . . . . . . . . . . 283
Changing the Database Connection for Reports and Report Objects in the Repository . . . 284
Changing a Report Database Connection . . . . . . . . . . . . . . . . . . . . . . . . . . . . . . . . . . . . . . . . . 284
Managing Security for Objects in the Repository . . . . . . . . . . . . . . . . . . . . . . . . . . . . . . . . . . . 284
CHAPTER 12 Using Batch Processing . . . . . . . . . . . . . . . . . . . . . . . . . . . . . . . . . . . . . . . . . . . . . . . . . . . . . . . . . 287
CHAPTER 13 XBRL in Hyperion Reports . . . . . . . . . . . . . . . . . . . . . . . . . . . . . . . . . . . . . . . . . . . . . . . . . . . . . . . 289
XBRL Terms . . . . . . . . . . . . . . . . . . . . . . . . . . . . . . . . . . . . . . . . . . . . . . . . . . . . . . . . . . . . . . . . . 290
Setting Up Hyperion Reports for XBRL . . . . . . . . . . . . . . . . . . . . . . . . . . . . . . . . . . . . . . . . . . 290
Enabling XBRL . . . . . . . . . . . . . . . . . . . . . . . . . . . . . . . . . . . . . . . . . . . . . . . . . . . . . . . . . . . 290
Downloading XBRL taxonomies to the XBRL directory . . . . . . . . . . . . . . . . . . . . . . . . . 291
Using XBRL Management . . . . . . . . . . . . . . . . . . . . . . . . . . . . . . . . . . . . . . . . . . . . . . . . . . . . . 291
Managing the XBRL Schema . . . . . . . . . . . . . . . . . . . . . . . . . . . . . . . . . . . . . . . . . . . . . . . . 291
Updating Schema Registration . . . . . . . . . . . . . . . . . . . . . . . . . . . . . . . . . . . . . . . . . . . . . . 292
Maintaining Schema Registration . . . . . . . . . . . . . . . . . . . . . . . . . . . . . . . . . . . . . . . . . . . . 293
Editing Labels and Short Names on Schemas . . . . . . . . . . . . . . . . . . . . . . . . . . . . . . . . . . 293
Managing XBRL Context . . . . . . . . . . . . . . . . . . . . . . . . . . . . . . . . . . . . . . . . . . . . . . . . . . . . . . 294
Contents xi
Defining the XBRL Context . . . . . . . . . . . . . . . . . . . . . . . . . . . . . . . . . . . . . . . . . . . . . . . . . 294
Assigning XBRL Context . . . . . . . . . . . . . . . . . . . . . . . . . . . . . . . . . . . . . . . . . . . . . . . . . . . 296
Removing XBRL Context . . . . . . . . . . . . . . . . . . . . . . . . . . . . . . . . . . . . . . . . . . . . . . . . . . . 296
Managing XBRL Units . . . . . . . . . . . . . . . . . . . . . . . . . . . . . . . . . . . . . . . . . . . . . . . . . . . . . 296
Assigning XBRL Units . . . . . . . . . . . . . . . . . . . . . . . . . . . . . . . . . . . . . . . . . . . . . . . . . . . . . . 298
Assigning XBRL Line Items to Rows . . . . . . . . . . . . . . . . . . . . . . . . . . . . . . . . . . . . . . . . . . . . . . 298
Using the Find Feature in XBRL Line Item Setup . . . . . . . . . . . . . . . . . . . . . . . . . . . . . . . 300
Using XBRL Facts in Text Objects and Text Cells . . . . . . . . . . . . . . . . . . . . . . . . . . . . . . . . . . . 302
Using XBRL Footnotes in Text Objects and Text Cells . . . . . . . . . . . . . . . . . . . . . . . . . . . . . . . 303
Exporting the Instance Document . . . . . . . . . . . . . . . . . . . . . . . . . . . . . . . . . . . . . . . . . . . . . . . 303
Select Member for Page Axis Dialog Box . . . . . . . . . . . . . . . . . . . . . . . . . . . . . . . . . . . . . . . 304
CHAPTER 14 Working with Books and Snapshot Books . . . . . . . . . . . . . . . . . . . . . . . . . . . . . . . . . . . . . . . . . . . 305
APPENDIX A Property Sheet Help . . . . . . . . . . . . . . . . . . . . . . . . . . . . . . . . . . . . . . . . . . . . . . . . . . . . . . . . . . . . 313
Report Properties . . . . . . . . . . . . . . . . . . . . . . . . . . . . . . . . . . . . . . . . . . . . . . . . . . . . . . . . . . . . . 314
Grid Properties . . . . . . . . . . . . . . . . . . . . . . . . . . . . . . . . . . . . . . . . . . . . . . . . . . . . . . . . . . . . . . . 314
Grid Properties - General Category . . . . . . . . . . . . . . . . . . . . . . . . . . . . . . . . . . . . . . . . . . . 314
Grid Properties - Suppression Category . . . . . . . . . . . . . . . . . . . . . . . . . . . . . . . . . . . . . . . 315
Grid Properties - Position Category . . . . . . . . . . . . . . . . . . . . . . . . . . . . . . . . . . . . . . . . . . . 316
Page Properties . . . . . . . . . . . . . . . . . . . . . . . . . . . . . . . . . . . . . . . . . . . . . . . . . . . . . . . . . . . . . . . 317
Heading Row/Column Properties . . . . . . . . . . . . . . . . . . . . . . . . . . . . . . . . . . . . . . . . . . . . . . . . 318
Row / Column Properties . . . . . . . . . . . . . . . . . . . . . . . . . . . . . . . . . . . . . . . . . . . . . . . . . . . . . . 318
Cell Properties . . . . . . . . . . . . . . . . . . . . . . . . . . . . . . . . . . . . . . . . . . . . . . . . . . . . . . . . . . . . . . . . 320
Text Row / Column Properties . . . . . . . . . . . . . . . . . . . . . . . . . . . . . . . . . . . . . . . . . . . . . . . . . . 320
Text Cell Properties . . . . . . . . . . . . . . . . . . . . . . . . . . . . . . . . . . . . . . . . . . . . . . . . . . . . . . . . . . . 321
Chart Properties . . . . . . . . . . . . . . . . . . . . . . . . . . . . . . . . . . . . . . . . . . . . . . . . . . . . . . . . . . . . . . 321
Image Properties . . . . . . . . . . . . . . . . . . . . . . . . . . . . . . . . . . . . . . . . . . . . . . . . . . . . . . . . . . . . . . 322
Text Properties . . . . . . . . . . . . . . . . . . . . . . . . . . . . . . . . . . . . . . . . . . . . . . . . . . . . . . . . . . . . . . . 323
Row and Column Template Properties . . . . . . . . . . . . . . . . . . . . . . . . . . . . . . . . . . . . . . . . . . . . 324
APPENDIX B Frequently Asked Questions . . . . . . . . . . . . . . . . . . . . . . . . . . . . . . . . . . . . . . . . . . . . . . . . . . . . . . 325
APPENDIX C Currency Table . . . . . . . . . . . . . . . . . . . . . . . . . . . . . . . . . . . . . . . . . . . . . . . . . . . . . . . . . . . . . . . . . 329
Glossary . . . . . . . . . . . . . . . . . . . . . . . . . . . . . . . . . . . . . . . . . . . . . . . . . . . . . . . . . . . . . . . . . . . . . . 331
Index . . . . . . . . . . . . . . . . . . . . . . . . . . . . . . . . . . . . . . . . . . . . . . . . . . . . . . . . . . . . . . . . . . . . . . . . 345

xii Contents
Preface xiii
Preface
Welcome to the Hyperion System 9 BI+ Financial Reporting Studio User’s Guide. In this preface:
● “Purpose” on page xiii
● “Audience” on page xiii
● “Document Structure” on page xiii
● “Where to Find Documentation” on page xiv
● “Conventions” on page xvi
● “Additional Support” on page xvii
● “Documentation Feedback” on page xvii
PurposeThis guide provides information about designing, formatting, viewing, managing, and printing
reports using Hyperion System 9 BI+ Financial ReportingTM. It explains Financial Reporting features and options and contains the concepts, procedures, formats, tasks, and examples.
AudienceThis guide is for users who prepare, manage, and view published reports.
Document StructureChapter 1, “Getting Started with Financial Reporting,”—introduces the Studio workspace and the fundamental components comprising the groundworks in Financial Reporting Studio.
Chapter 2, “Selecting Members for Report Designers,”—describes how to organize members by lists, how to use functions to dynamically retrieve a members list and related members from a data source, and how to select members for your grid as well as Grid and User Point Of View (POV) bars.
Chapter 4, “Building Reports,” describes how to build a custom report using report objects and how to define those report objects by using property sheets.
xiv Preface
Chapter 3, “Customizing Charts,” describes the types of charts you can add, how to access data from the chart’s controlling grid, and how to use formatting options for the chart.
Chapter 5, “Customizing Grids,” describes how you can design custom grids, change the database connection of a grid, and use multiple database connections in a single grid, as well as how to use functions to refine your report data or to add dynamic data.
Chapter 6, “Defining the User POV,” describes how to select members for the user POV and how to limit the end users’s access to specific POV members.
Chapter 7, “Providing for Detailed Data and Documents in Reports,” describes how to design your report to enable end users to view detail data that resides in the same report or in a linked report.
Chapter 8, “Previewing and Printing Reports,” describes how to preview and print all types of Financial Reporting reports and books as well as how to respond to prompts contained in a report or book while previewing or printing.
Chapter 14, “Working with Books and Snapshot Books,” describes how to define and manage books and snapshot books.
Chapter 9, “Formatting Reports,” describes how to format your report objects (text boxes, grids, images) as well as how to specify a page size for printing, or previewing.
Chapter 10, “Using Functions,” describes functions and how to apply them in your Financial Reporting report.
Chapter 11, “Managing the Explore Repository,” which describes the many functions you can perform in the repository such as organizing reports, importing and exporting reports, and flagging reports for viewing in the Studio workspace.
Chapter 12, “Using Batch Processing,” describes how to define and manage batches comprised of reports, snapshot reports, books, or snapshot books.
Chapter 13, “XBRL in Hyperion Reports,” describes XBRL™ (eXtensible Business Reporting Language) and how it is used in Financial Reporting Studio.
Appendix A, “Property Sheet Help,” provides help for the property sheets in Financial Reporting Studio.
Appendix C, “Currency Table,” shows the currencies that are supported in Financial Reporting Studio.
Appendix B, “Frequently Asked Questions,” contains a list of commonly asked questions and answers for Financial Reporting Studio.
Glossary contains a list of key terms and their definitions.
Index contains an alphabetized list of Hyperion terms and subjects, and their page references.
Where to Find DocumentationAll Financial Reporting Studio documentation is accessible from the following locations:
Help Menu Commands xv
● The HTML Financial Reporting and Financial Reporting Studio Information Maps are located at Start > Programs > Hyperion System 9 BI+ > Reporting Studio Info Map.
● The Hyperion Solutions Web site
● The Hyperion Download Center which can be accessed from the Hyperion Solutions Web site.
➤ To access documentation from the Hyperion Download Center:
1 Go to the Hyperion Solutions Web site and navigate to Services > WorldWide Support > Download Center.
Note: Your Login ID for the Hyperion Download Center is your e-mail address. The Login ID and Password required for the Hyperion Download Center are different from the Login ID and Password required for Hyperion Support Online through Hyperion.com. If you are not sure whether you have a Hyperion Download Center account, follow the on-screen instructions.
2 In the Login ID and Password text boxes, enter your e-mail address and password.
3 In the Language list box, select the language and click Login.
4 If you are a member on multiple Hyperion Solutions Download Center accounts, select the account that you want to use for the current session.
5 To access documentation online, from the Product List, select the product and follow the on-screen instructions.
Help Menu CommandsThe following table identifies commands available from the Help menu in Financial Reporting.
Table i Help Menu Command
Option Description
Information Map Launches the BI+ Information Map that provides the following assistance:
● Online help in PDF and HTML format
● Links to related resources to assist you in using Financial Reporting Studio
Technical Support
Launches the Hyperion Technical Support site, where you submit defects and contact Technical Support
xvi Preface
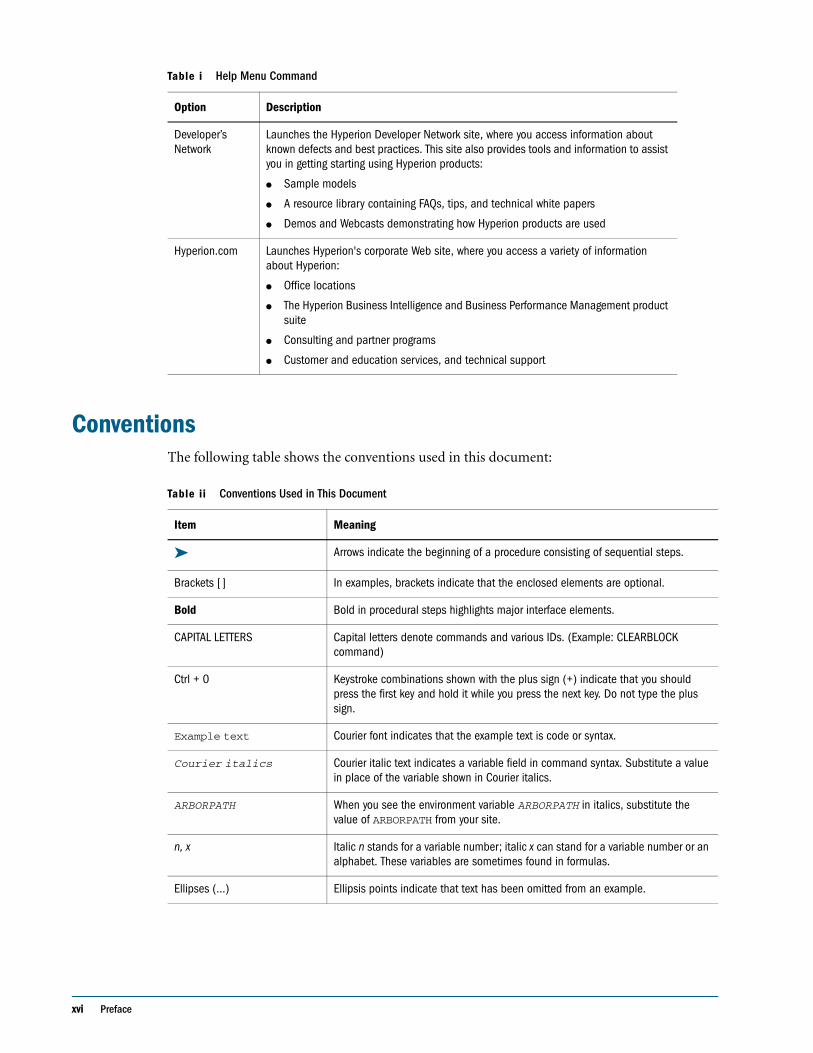
ConventionsThe following table shows the conventions used in this document:
Developer’s Network
Launches the Hyperion Developer Network site, where you access information about known defects and best practices. This site also provides tools and information to assist you in getting starting using Hyperion products:
● Sample models
● A resource library containing FAQs, tips, and technical white papers
● Demos and Webcasts demonstrating how Hyperion products are used
Hyperion.com Launches Hyperion's corporate Web site, where you access a variety of information about Hyperion:
● Office locations
● The Hyperion Business Intelligence and Business Performance Management product suite
● Consulting and partner programs
● Customer and education services, and technical support
Table ii Conventions Used in This Document
Item Meaning
➤ Arrows indicate the beginning of a procedure consisting of sequential steps.
Brackets [ ] In examples, brackets indicate that the enclosed elements are optional.
Bold Bold in procedural steps highlights major interface elements.
CAPITAL LETTERS Capital letters denote commands and various IDs. (Example: CLEARBLOCK command)
Ctrl + 0 Keystroke combinations shown with the plus sign (+) indicate that you should press the first key and hold it while you press the next key. Do not type the plus sign.
Example text Courier font indicates that the example text is code or syntax.
Courier italics Courier italic text indicates a variable field in command syntax. Substitute a value in place of the variable shown in Courier italics.
ARBORPATH When you see the environment variable ARBORPATH in italics, substitute the value of ARBORPATH from your site.
n, x Italic n stands for a variable number; italic x can stand for a variable number or an alphabet. These variables are sometimes found in formulas.
Ellipses (...) Ellipsis points indicate that text has been omitted from an example.
Table i Help Menu Command
Option Description
Documentation Feedback xvii
Additional SupportIn addition to providing documentation and online help, Hyperion offers the following product information and support. For details on education, consulting, or support options, click the Services link at the Hyperion Web site.
Education ServicesHyperion offers instructor-led training, custom training, and e-Learning covering all Hyperion applications and technologies. Training is geared to administrators, end users, and information systems professionals.
Consulting ServicesExperienced Hyperion consultants and partners implement software solutions tailored to clients’ particular reporting, analysis, modeling, and planning requirements. Hyperion also offers specialized consulting packages, technical assessments, and integration solutions.
Technical SupportHyperion provides enhanced electronic-based and telephone support to clients to resolve product issues quickly and accurately. This support is available for all Hyperion products at no additional cost to clients with current maintenance agreements.
Documentation FeedbackHyperion strives to provide complete and accurate documentation. Your opinion on the documentation is of value, so please send your comments by going to http://www.hyperion.com/services/support_programs/doc_survey/index.cfm.
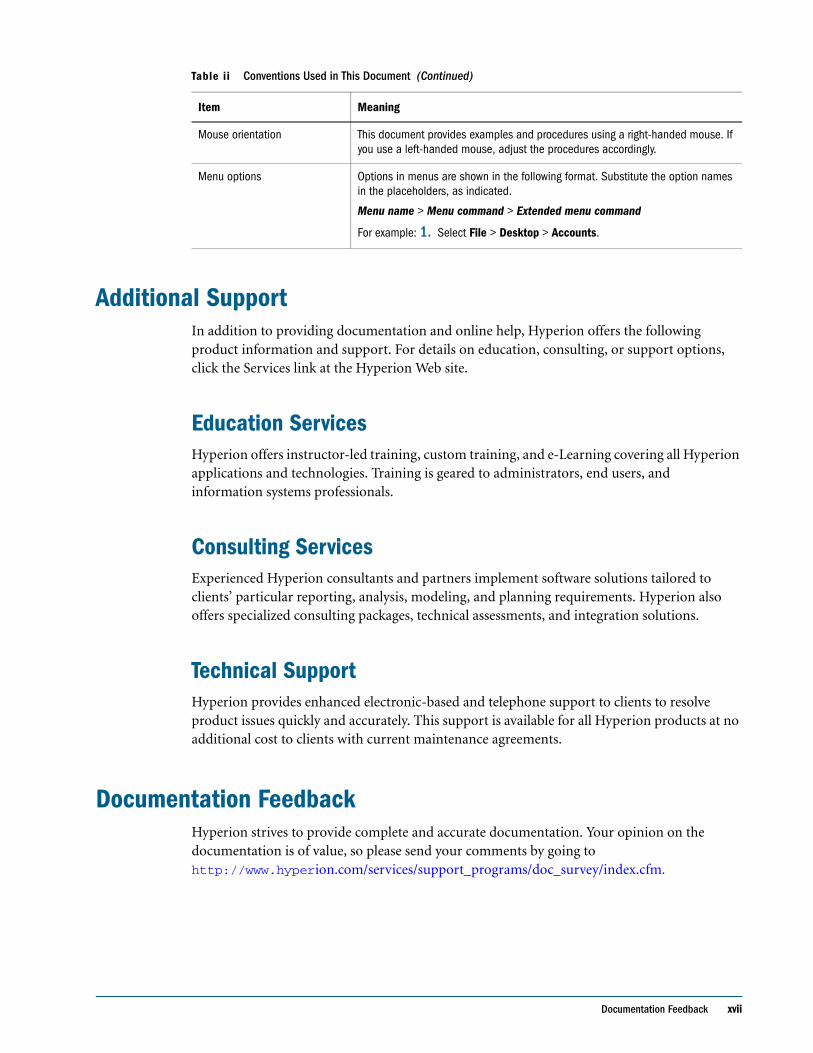
Mouse orientation This document provides examples and procedures using a right-handed mouse. If you use a left-handed mouse, adjust the procedures accordingly.
Menu options Options in menus are shown in the following format. Substitute the option names in the placeholders, as indicated.
Menu name > Menu command > Extended menu command
For example: 1. Select File > Desktop > Accounts.
Table ii Conventions Used in This Document (Continued)
Item Meaning

xviii Preface
Getting Started with Financial Reporting 19
C h a p t e r
1Getting Started with Financial
Reporting
Financial Reporting is a powerful tool for designing and presenting analytic data graphically. You can design traditional financial report formats such as cash management reports, profit and loss statements, and balance sheets. You can also design nontraditional formats for financial or analytic data that include text and graphics.
Financial Reporting uses an object-oriented graphical report layout. Whether you have little or advanced experience using an object-oriented graphical program, it is easy to design reports. You use report objects, such as text boxes, grids, images, and charts, to design your reports. You can use the same report objects in multiple reports.
Getting Started includes the following topics:
In This Chapter Terminology in this Release . . . . . . . . . . . . . . . . . . . . . . . . . . . . . . . . . . . . . . . . . . . . . . . . . . . . . . . . . . . . . . . . . . 20
Financial Reporting Components . . . . . . . . . . . . . . . . . . . . . . . . . . . . . . . . . . . . . . . . . . . . . . . . . . . . . . . . . . . . . . 20
Sample Report . . . . . . . . . . . . . . . . . . . . . . . . . . . . . . . . . . . . . . . . . . . . . . . . . . . . . . . . . . . . . . . . . . . . . . . . . . . 21
Report Components. . . . . . . . . . . . . . . . . . . . . . . . . . . . . . . . . . . . . . . . . . . . . . . . . . . . . . . . . . . . . . . . . . . . . . . . 22
Design Considerations . . . . . . . . . . . . . . . . . . . . . . . . . . . . . . . . . . . . . . . . . . . . . . . . . . . . . . . . . . . . . . . . . . . . . . 25
Basic Financial Reporting Tasks . . . . . . . . . . . . . . . . . . . . . . . . . . . . . . . . . . . . . . . . . . . . . . . . . . . . . . . . . . . . . . . 27
Toolbars . . . . . . . . . . . . . . . . . . . . . . . . . . . . . . . . . . . . . . . . . . . . . . . . . . . . . . . . . . . . . . . . . . . . . . . . . . . . . . . . 31
Menus . . . . . . . . . . . . . . . . . . . . . . . . . . . . . . . . . . . . . . . . . . . . . . . . . . . . . . . . . . . . . . . . . . . . . . . . . . . . . . . . . 33
Shortcut Menu Commands . . . . . . . . . . . . . . . . . . . . . . . . . . . . . . . . . . . . . . . . . . . . . . . . . . . . . . . . . . . . . . . . . . 38
Error Messages . . . . . . . . . . . . . . . . . . . . . . . . . . . . . . . . . . . . . . . . . . . . . . . . . . . . . . . . . . . . . . . . . . . . . . . . . . . 41
20 Getting Started with Financial Reporting
Terminology in this ReleaseTo differentiate between the Windows client and the Web client the following terms are used in this guide:
● In this guide, for Financial Reporting Studio, “workspace” is referred to as “Studio workspace”. When in the Report Designer, “workspace” is referred to as the “Report Designer workspace”. The Web client equivalent is referred to as “Hyperion System 9 BI+
WorkspaceTM” (Workspace).
● In this guide, for Financial Reporting Studio, “explore” is referred to as “Studio Explore”. The Web client equivalent is referred to as “Explore”.
Note: For customers of Hyperion, this release of Financial Reporting contains numerous differences from the prior release. For a comparison of UI, terminology, and key functionality, see the Hyperion System 9 BI+ Enterprise MetricsTM, Financial Reporting, Interactive Reporting, Productions Reporting, and Web Analysis Modules Transition Guide.
Note: This guide provides detailed information on functions that are performed in Financial Reporting Studio. Also, it briefly describes additional functionality that can be performed in Financial Reporting Workspace. For information about Financial Reporting functionality that is performed in Workspace, see the Hyperion System 9 BI+ Workspace User's Guide.
Financial Reporting ComponentsFinancial Reporting is comprised of numerous components that can be accessed in Financial Reporting Studio, Workspace, or both:
● Report Designer—In Financial Reporting Studio - Enables you to create, edit, or delete report objects, reports or snapshot reports.
● Explore
❍ In Financial Reporting Studio - Enables you to create, open, save, and delete folders and store report objects, reports, and snapshot reports.
❍ In Workspace - Enables you to open stored files, create folders, export and import files, and set up e-mail links to folders, reports, and snapshot books.
● Book Editor—In Workspace - Provides the capability of creating a book of reports, which can be saved as a book or a snapshot book.
● Scheduler—In Workspace-Enables you to schedule a batch and view the status of batches that are scheduled for future processing.
● Batch Editor—In Workspace-Enables you to add objects to a batch job, remove objects from a batch job, schedule a batch, and indicate whether or not you want the batch deleted after it runs.
● Workspace—The tasks you can perform are based on your user rights.
Financial Reporting Components 21
❍ In Financial Reporting Studio - If you are Report Designer or Global Administrator, you can create, edit, or delete report objects, reports or snapshot reports in the designer Studio workspace or work with reports and report objects in Studio Explore.
❍ In Workspace - you can create a book of reports, schedule batches, view batches, and edit batches. If you are a user with viewer rights you can view reports and export documents to Word, Excel, and PowerPoint. For information on Workspace, see the Hyperion System 9 BI+ Workspace User's Guide.
Data SourcesStarting with this release of Financial Reporting, you can retrieve data from SAP BW data sources. You can also design and view reports that retrieve, and format data from Hyperion
System 9 Financial ManagementTM, and Hyperion System 9BI+ Analytic ServicesTM, as in earlier releases of Financial Reporting.
You can query multiple SAP BW data sources within a report. SAP BW data sources can include InfoProviders, which provide unified access to all types of SAP BW objects. These objects include InfoCubes, ODS objects, Master Data Tables, InfoSets, and remote InfoCubes.
With SAP BW data sources, Financial Reporting provides direct access to aggregates, which are integrated views of data in an InfoCube. Aggregates make it possible to access InfoCube data quickly in reporting. Financial Reporting provides direct access to aggregates through an OLAP BAPI, which is a specialized interface for accessing BW data through presentation tools.
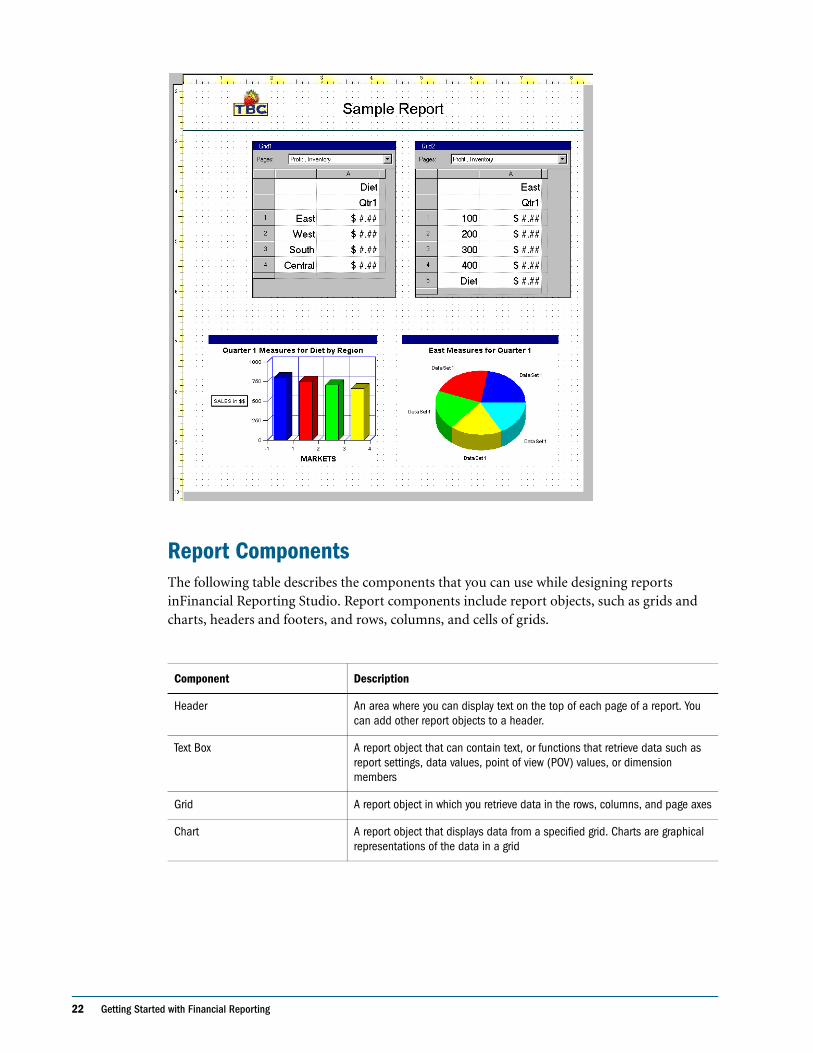
Sample ReportThe following figure shows a sample report created in Financial Reporting Studio. The sample report is designed with a header that contains an image and a title, and two grids and charts. The charts reference the grid data above.
22 Getting Started with Financial Reporting
Report ComponentsThe following table describes the components that you can use while designing reports inFinancial Reporting Studio. Report components include report objects, such as grids and charts, headers and footers, and rows, columns, and cells of grids.
Component Description
Header An area where you can display text on the top of each page of a report. You can add other report objects to a header.
Text Box A report object that can contain text, or functions that retrieve data such as report settings, data values, point of view (POV) values, or dimension members
Grid A report object in which you retrieve data in the rows, columns, and page axes
Chart A report object that displays data from a specified grid. Charts are graphical representations of the data in a grid
Financial Reporting Components 23
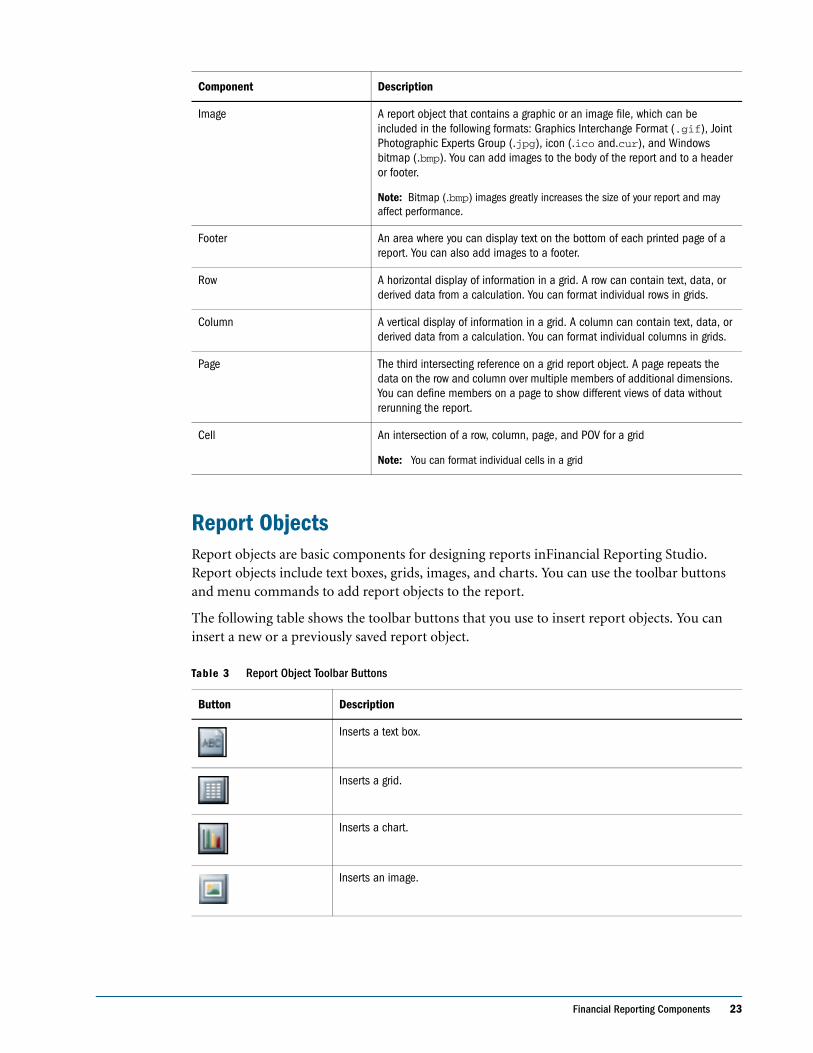
Report Objects Report objects are basic components for designing reports inFinancial Reporting Studio. Report objects include text boxes, grids, images, and charts. You can use the toolbar buttons and menu commands to add report objects to the report.
The following table shows the toolbar buttons that you use to insert report objects. You can insert a new or a previously saved report object.
Image A report object that contains a graphic or an image file, which can be included in the following formats: Graphics Interchange Format (.gif), Joint Photographic Experts Group (.jpg), icon (.ico and.cur), and Windows bitmap (.bmp). You can add images to the body of the report and to a header or footer.
Note: Bitmap (.bmp) images greatly increases the size of your report and may affect performance.
Footer An area where you can display text on the bottom of each printed page of a report. You can also add images to a footer.
Row A horizontal display of information in a grid. A row can contain text, data, or derived data from a calculation. You can format individual rows in grids.
Column A vertical display of information in a grid. A column can contain text, data, or derived data from a calculation. You can format individual columns in grids.
Page The third intersecting reference on a grid report object. A page repeats the data on the row and column over multiple members of additional dimensions. You can define members on a page to show different views of data without rerunning the report.
Cell An intersection of a row, column, page, and POV for a grid
Note: You can format individual cells in a grid
Table 3 Report Object Toolbar Buttons
Button Description
Inserts a text box.
Inserts a grid.
Inserts a chart.
Inserts an image.
Component Description
24 Getting Started with Financial Reporting
Studio Workspace The Studio workspace is an area where you can open a new or existing report in the Report Designer and access the repository. The Studio workspace is the first area you see when you log on to Financial Reporting Studio. Only a Report Designer and Global Administrator can access to the Financial Reporting Studio Explore and Designer. See the Hyperion System 9 BI+ Workspace Administrator’s Guide for more information on rights and security.
Report DesignerIn the Financial Reporting Studio Designer area, the Report Designer can create and edit reports. You can view your report data in print, print preview, or Web preview.
In Financial Reporting Studio Designer, you select toolbar buttons or menu commands to add report objects to the report. You can then customize each report object using its property sheet. For example, you can select a grid, and use the Grid Properties property sheet to specify dimensions, select members, and specify heading options. For more information on the property sheets, see “Property Sheet” on page 24.
You can also select a report object and right-click to display a shortcut menu. For a list of shortcut commands available, see “Shortcut Menu Commands” on page 38.
Property SheetProperty sheets enable you to set various options for the currently selected report component. When you set a property option, it is automatically applied to the selected report object.
The property sheet features change based on the category selected. There are several categories available, depending on the type of report component selected. Each category shows another set of characteristics you can set for a selected report component.
By default, property sheets are displayed on the right side of the designer. You can hide the property sheet window.
To hide a property sheet that is displayed, deselect View > Property Sheet.
To display a properties sheet that is hidden, select View > Property Sheet.
Navigating in the Studio WorkspaceAfter you log on, you see the Studio Explore page, which displays the Financial Reporting repository. Use the top of the page to select menu commands, use shortcuts from the toolbar area, or right-click to select shortcut menu items.
The Report Designer can create a report by selecting File > New > Report from the menu bar.
For menu option availability, see “Menus” on page 33, for toolbars, see “Toolbars” on page 31 and for shortcuts, see “Shortcut Menu Commands” on page 38.
Design Considerations 25
Workspace FunctionalityIn addition to the functionality available in the Financial Reporting Studio, Workspace provides expanded functionality for the Report Designer. For example, repository objects such as reports, books, and graphics can be opened, copied, deleted, moved, imported, exported and renamed. Folders can be created, opened, deleted, imported, exported and renamed. Reports and books can be previewed (HTML or PDF). You can also sort items in the repository by clicking a column field header. In addition, the following menu commands are available: For detailed information on the following topics, see the Hyperion System 9 BI+ Workspace User’s Guide .
● Access Privileges
● Preferences
● Change and manage Database Connections
● Email Links
● Display items of type
● Hyperion System 9 Shared ServicesTM
Batch and Book Editor, Batch SchedulerIncluded with Workspace is the ability to work with books and batches. Batches can be created, edited and saved. Batches can also be scheduled, with full Batch Scheduler capabilities available from Workspace. Books can also be created, edited and saved. Advanced Member Selection has capabilities such as member functions (for example, Children, Descendants) and lists, similar to Financial Reporting Studio. For more information on batches, Book Editor, and Batch Scheduler, see the Hyperion System 9 BI+ Workspace User’s Guide .
Design ConsiderationsReport performance can vary for each client. What is acceptable for one client may not be acceptable for another. For example, if reports are run in batches during off-peak hours, they may have to be completed before the next business day. When data is updated hourly, report performance may only be acceptable if report output returns in seconds.
Planning Details as a Database ConnectionOnce you install the Hyperion System 9 PlanningTM Planning Details ADM driver, you may choose Planning Details as a database connection within Financial Reporting. The Planning Details ADM driver is optimized as a data source to provide features such as supporting details, planning unit annotations and metadata filtering. If your report grid does not use those Planning features, for optimal performance, choose Analytic Services as the database connection for your report. For more information, see “Showing Supporting Detail for Planning” on page 129 and “PlanningAnnotations” on page 258.
26 Getting Started with Financial Reporting
Support for WorkForce Planning Smart ListsSmart Lists are attribute-like values that are assigned to members, where the actual assignment is stored as data in the Essbase cube for the member (for example, 0, 1, 2, 3, 4) and the Planning Repository translates these numbers to textual strings (for example, 0=”Straight Line Depreciation”, 1=” Double Declining Balance”, and so on).
Examples of Financial Reporting support of Smart Lists:
● Grids which reference cells in a Planning database which contain Smart Lists will return a string value instead of a number. String values are always shown in the results instead of numbers.
● The Text function GetCell() returns the string value instead of a number when it references a cell containing an Smart List.
● Using string comparison operators (equals, startswith, and so on), Conditional Formatting and Suppression allows selection of any cell (Data, Formula, Text) with the "Cell Value" operand. For example, Conditional Suppression can refer to a data cell which contains a Smart List string and apply Conditional Suppression such as "suppress row if cell value B, 6 starts with 'ABC'".
Database Connection for Analytic Services and Planning DetailsWhen you change a report from an Interactive Reporting database connection to a Planning Details database connection or vice versa, there are several restrictions because the data source reference is the only change. For more information, see “Changing a Report Database Connection” on page 284.
Data Queries - Expanded Versus Single Data SegmentsA data segment is a row or column that retrieves data from a database. An expanded data segment is a row or column that can expand, so that the resulting grid expands to two or more rows or columns when viewed. Often, expanded data segments use functions such as Children Of or Descendants Of. A single data segment is a row or column that remains a single row or column when shown in the viewer.
While it is generally valid to use expanded and single data segments in the same grid, when designing a grid with large amounts of data, consider using expanded data segments rather than single data segments. Expanded data segments provide some performance advantages over single data segments. However, to produce detailed formatting on different data rows or columns, use single data segments.
Designing ConsiderationsBefore designing reports, the designer should consider the following items:
Basic Financial Reporting Tasks 27
● Has the data source application been designed to support the required hierarchies and calculations for all reports?
● What is the goal of the report?
● Who are the end users of the report?
● How frequently is the report generated and by how may users?
● What is an acceptable retrieval/generation time?
● How many cells does the report query (before suppression)?
Recommendations for Designing Dynamic ReportsWhen designing dynamic reports, consider the following information:
● Use expanded data segments for optimal performance:
❍ Use functions on expanded data segments that are not placed on separate rows/columns
❍ Use multiple member selections on expanded data segments that are not placed in separate rows/columns
❍ Use single data segments only when required for formatting or calculations
● Write efficient formulas:
❍ Use row/column formulas rather than cell formulas, when possible
❍ Use reference properties
❍ Use a cell reference instead of cross-axis references
❍ Remove unnecessary parenthesis from formulas
● Don't limit your report to the Grid object:
❍ Add functions in text boxes that highlight specific areas
❍ Hide a grid of data in a report to highlight just the graphics
● Create report templates:
❍ Leverage the power of POVs and prompting functions
❍ Design once using the CurrentPOV and prompting functions
❍ Learn the power of Grid, User, Book, and Batch POVs
● Create reusable objects and row and column templates. Text, Image, Grid, Chart objects, and row and column templates can be reused in multiple reports
Basic Financial Reporting TasksBasic tasks in Financial Reporting Studio are as follows:
● “Starting Financial Reporting Studio” on page 28.
● “Designing Reports” on page 28.
28 Getting Started with Financial Reporting
● “Opening Existing Reports” on page 30.
● “Viewing Snapshot Reports” on page 30.
● “Creating a Book” on page 30
● “Creating a Batch” on page 30
● “Setting Preferences” on page 30
● “Changing your Password” on page 31
● “Closing Studio Explore or the Designer” on page 31
● “Exiting Financial Reporting Studio” on page 31.
Starting Financial Reporting Studio
➤ To start theFinancial Reporting Studio:
1 Perform an action:
● Double-click the Financial Reporting Studio icon on your desktop.
● From the Windows Start menu, select Programs > Hyperion System 9 BI+ > Financial Reporting Studio.
2 When the Hyperion Login dialog box is displayed, type your User ID, Password, and select a report server. Click Okey.
Logging on to Workspace
➤ To log on to Workspace:
1 Enter the following case-sensitive URL in the Address box of the Web browser:
httFp://webserver:port number/workspace/index.jsp
2 Enter your username and password.
3 Click Log On. Workspace is displayed.
Designing ReportsYou can design reports in the Financial Reporting Studio Designer using a blank report layout where you can specify the contents of the report, including grids, charts, images, text boxes, headers, and footers.
➤ To design a report in the Report Designer:
1 Select File > New > Report.
2 To add data to your report, select Insert > Grid, then drag an area on the Designer Studio workspace for the grid.
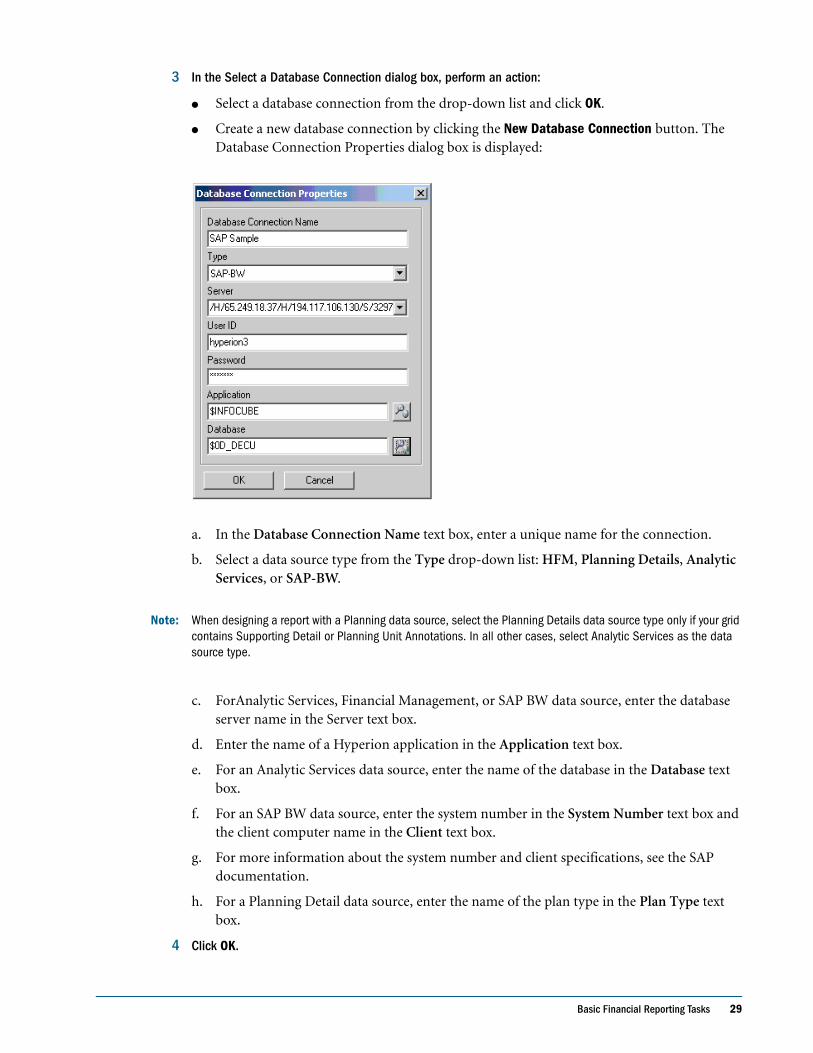
Basic Financial Reporting Tasks 29
3 In the Select a Database Connection dialog box, perform an action:
● Select a database connection from the drop-down list and click OK.
● Create a new database connection by clicking the New Database Connection button. The Database Connection Properties dialog box is displayed:
a. In the Database Connection Name text box, enter a unique name for the connection.
b. Select a data source type from the Type drop-down list: HFM, Planning Details, Analytic Services, or SAP-BW.
Note: When designing a report with a Planning data source, select the Planning Details data source type only if your grid contains Supporting Detail or Planning Unit Annotations. In all other cases, select Analytic Services as the data source type.
c. ForAnalytic Services, Financial Management, or SAP BW data source, enter the database server name in the Server text box.
d. Enter the name of a Hyperion application in the Application text box.
e. For an Analytic Services data source, enter the name of the database in the Database text box.
f. For an SAP BW data source, enter the system number in the System Number text box and the client computer name in the Client text box.
g. For more information about the system number and client specifications, see the SAP documentation.
h. For a Planning Detail data source, enter the name of the plan type in the Plan Type text box.
4 Click OK.
30 Getting Started with Financial Reporting
Opening Existing ReportsYou can open existing reports in the Designer or Studio Explore to modify the report design or to display the report with current data. Data is refreshed when the report is opened or viewed. Static data can be saved with a report when you save it as a snapshot report.
➤ To open an existing report in the Designer:
1 Select File > Open.
2 Double-click a folder from the Open dialog box or highlight the folder name and click Open.
A list of all reports contained in the folder is displayed.
3 Select reports to open, then click Open.
➤ To open an existing report in Studio Explore:
1 From Studio Explore, double-click a folder to view all reports in the folder.
2 Double-click a report you want to open.
Viewing Snapshot ReportsYou view snapshot reports to display and print static reports. You can open a snapshot report from Studio Explore repository.
➤ To view a snapshot report:
1 Select one or more snapshot reports from the repository and select File > Print Preview.
For more information on viewing or printing a snapshot report, see Chapter 8, “Previewing and Printing Reports.”
Creating a BookBooks are created in Workspace. For information on creating a book, see Hyperion System 9 BI+ Workspace User's Guide.
Creating a BatchBatches are created in Workspace. For information on creating a batch, see Hyperion System 9 BI+ Workspace User's Guide.
Setting PreferencesPreferences are set in Workspace. For information on setting preferences, see the Hyperion System 9 BI+ Workspace User’s Guide .
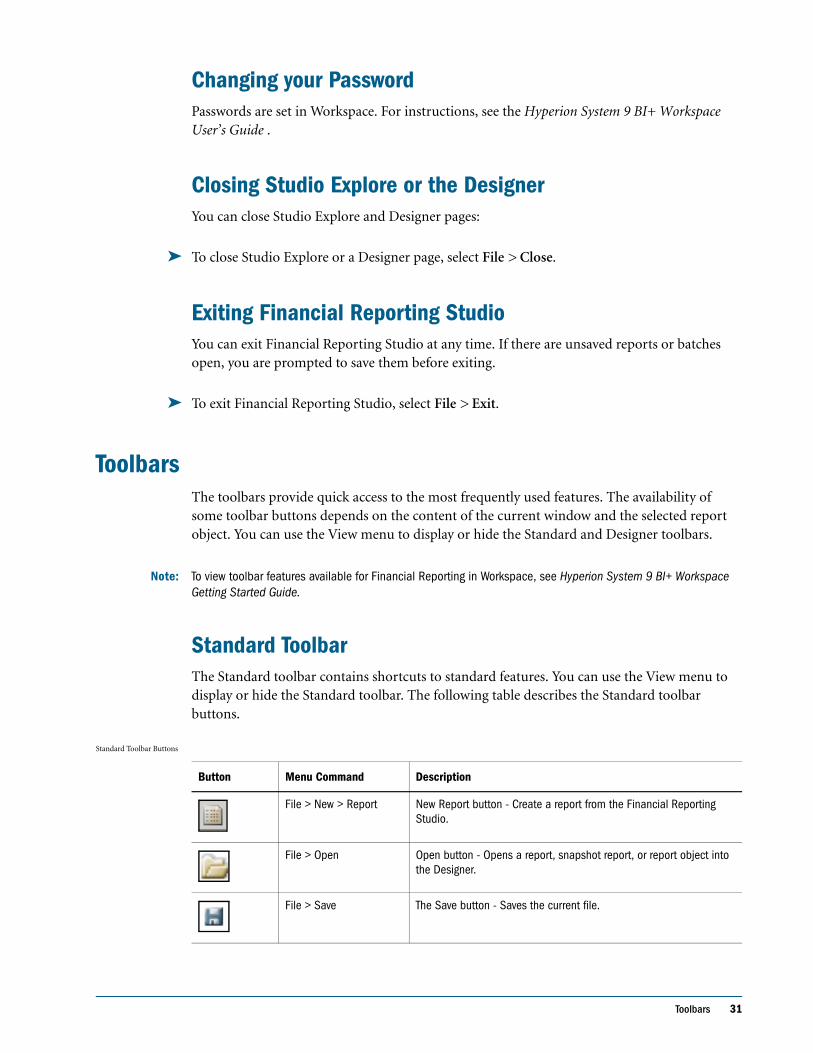
Toolbars 31
Changing your PasswordPasswords are set in Workspace. For instructions, see the Hyperion System 9 BI+ Workspace User’s Guide .
Closing Studio Explore or the DesignerYou can close Studio Explore and Designer pages:
➤ To close Studio Explore or a Designer page, select File > Close.
Exiting Financial Reporting StudioYou can exit Financial Reporting Studio at any time. If there are unsaved reports or batches open, you are prompted to save them before exiting.
➤ To exit Financial Reporting Studio, select File > Exit.
Toolbars The toolbars provide quick access to the most frequently used features. The availability of some toolbar buttons depends on the content of the current window and the selected report object. You can use the View menu to display or hide the Standard and Designer toolbars.
Note: To view toolbar features available for Financial Reporting in Workspace, see Hyperion System 9 BI+ Workspace Getting Started Guide.
Standard ToolbarThe Standard toolbar contains shortcuts to standard features. You can use the View menu to display or hide the Standard toolbar. The following table describes the Standard toolbar buttons.
Standard Toolbar Buttons
Button Menu Command Description
File > New > Report New Report button - Create a report from the Financial Reporting Studio.
File > Open Open button - Opens a report, snapshot report, or report object into the Designer.
File > Save The Save button - Saves the current file.
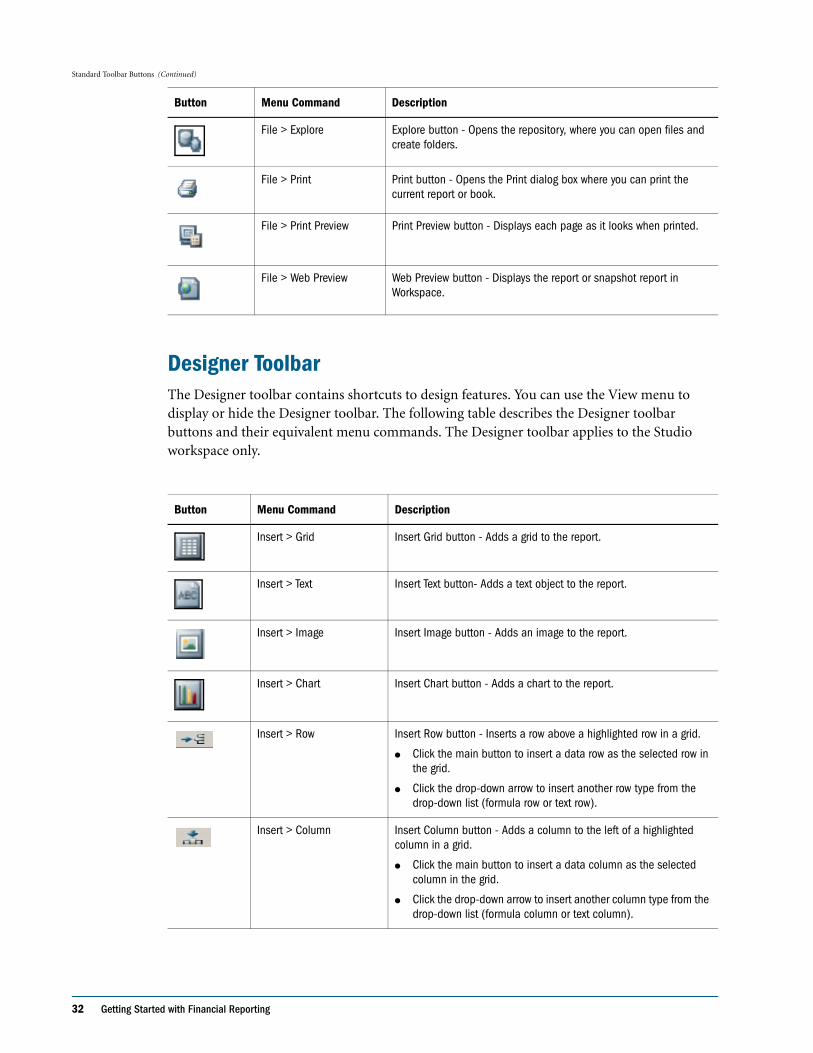
32 Getting Started with Financial Reporting
Designer ToolbarThe Designer toolbar contains shortcuts to design features. You can use the View menu to display or hide the Designer toolbar. The following table describes the Designer toolbar buttons and their equivalent menu commands. The Designer toolbar applies to the Studio workspace only.
File > Explore Explore button - Opens the repository, where you can open files and create folders.
File > Print Print button - Opens the Print dialog box where you can print the current report or book.
File > Print Preview Print Preview button - Displays each page as it looks when printed.
File > Web Preview Web Preview button - Displays the report or snapshot report in Workspace.
Button Menu Command Description
Insert > Grid Insert Grid button - Adds a grid to the report.
Insert > Text Insert Text button- Adds a text object to the report.
Insert > Image Insert Image button - Adds an image to the report.
Insert > Chart Insert Chart button - Adds a chart to the report.
Insert > Row Insert Row button - Inserts a row above a highlighted row in a grid.
● Click the main button to insert a data row as the selected row in the grid.
● Click the drop-down arrow to insert another row type from the drop-down list (formula row or text row).
Insert > Column Insert Column button - Adds a column to the left of a highlighted column in a grid.
● Click the main button to insert a data column as the selected column in the grid.
● Click the drop-down arrow to insert another column type from the drop-down list (formula column or text column).
Standard Toolbar Buttons (Continued)
Button Menu Command Description
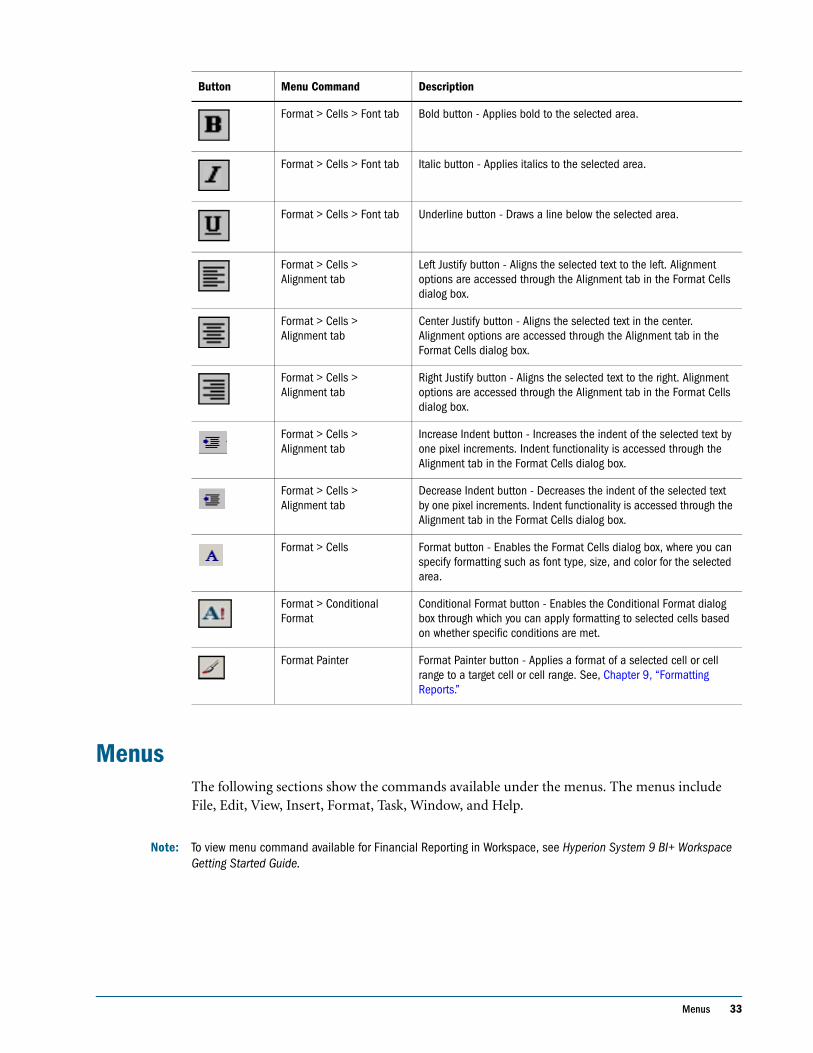
Menus 33
MenusThe following sections show the commands available under the menus. The menus include File, Edit, View, Insert, Format, Task, Window, and Help.
Note: To view menu command available for Financial Reporting in Workspace, see Hyperion System 9 BI+ Workspace Getting Started Guide.
Format > Cells > Font tab Bold button - Applies bold to the selected area.
Format > Cells > Font tab Italic button - Applies italics to the selected area.
Format > Cells > Font tab Underline button - Draws a line below the selected area.
Format > Cells > Alignment tab
Left Justify button - Aligns the selected text to the left. Alignment options are accessed through the Alignment tab in the Format Cells dialog box.
Format > Cells > Alignment tab
Center Justify button - Aligns the selected text in the center. Alignment options are accessed through the Alignment tab in the Format Cells dialog box.
Format > Cells > Alignment tab
Right Justify button - Aligns the selected text to the right. Alignment options are accessed through the Alignment tab in the Format Cells dialog box.
Format > Cells > Alignment tab
Increase Indent button - Increases the indent of the selected text by one pixel increments. Indent functionality is accessed through the Alignment tab in the Format Cells dialog box.
Format > Cells > Alignment tab
Decrease Indent button - Decreases the indent of the selected text by one pixel increments. Indent functionality is accessed through the Alignment tab in the Format Cells dialog box.
Format > Cells Format button - Enables the Format Cells dialog box, where you can specify formatting such as font type, size, and color for the selected area.
Format > Conditional Format
Conditional Format button - Enables the Conditional Format dialog box through which you can apply formatting to selected cells based on whether specific conditions are met.
Format Painter Format Painter button - Applies a format of a selected cell or cell range to a target cell or cell range. See, Chapter 9, “Formatting Reports.”
Button Menu Command Description
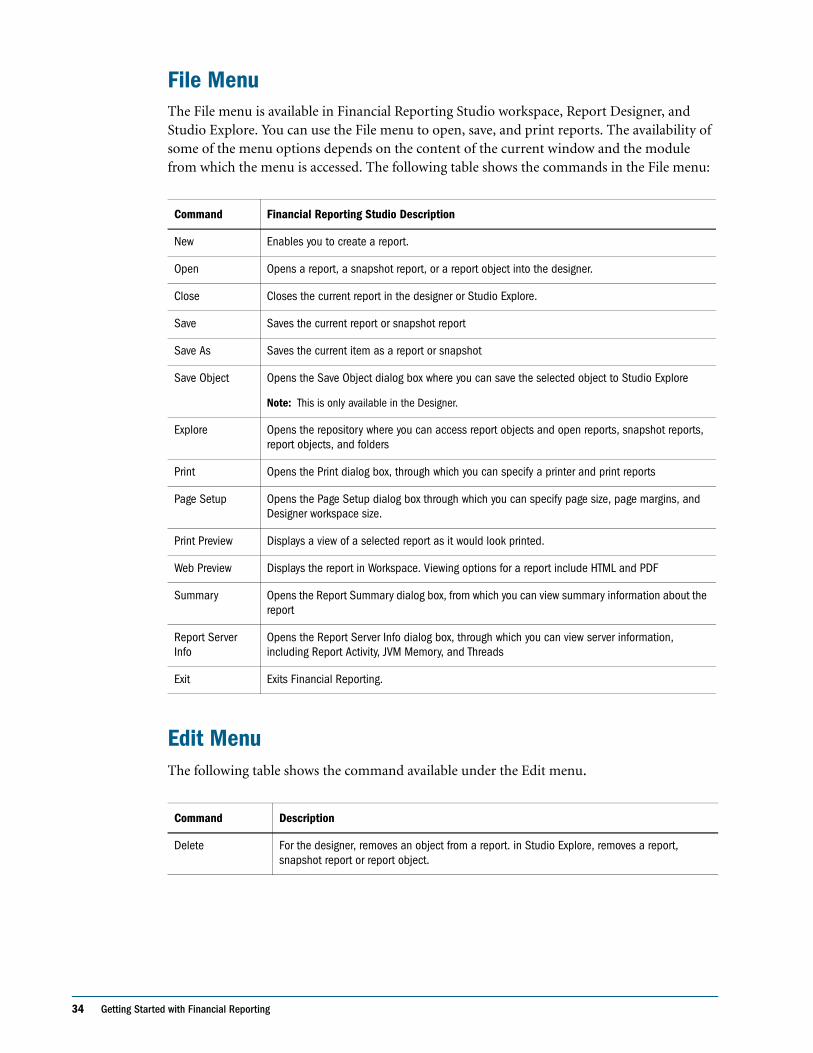
34 Getting Started with Financial Reporting
File MenuThe File menu is available in Financial Reporting Studio workspace, Report Designer, and Studio Explore. You can use the File menu to open, save, and print reports. The availability of some of the menu options depends on the content of the current window and the module from which the menu is accessed. The following table shows the commands in the File menu:
Edit MenuThe following table shows the command available under the Edit menu.
Command Financial Reporting Studio Description
New Enables you to create a report.
Open Opens a report, a snapshot report, or a report object into the designer.
Close Closes the current report in the designer or Studio Explore.
Save Saves the current report or snapshot report
Save As Saves the current item as a report or snapshot
Save Object Opens the Save Object dialog box where you can save the selected object to Studio Explore
Note: This is only available in the Designer.
Explore Opens the repository where you can access report objects and open reports, snapshot reports, report objects, and folders
Print Opens the Print dialog box, through which you can specify a printer and print reports
Page Setup Opens the Page Setup dialog box through which you can specify page size, page margins, and Designer workspace size.
Print Preview Displays a view of a selected report as it would look printed.
Web Preview Displays the report in Workspace. Viewing options for a report include HTML and PDF
Summary Opens the Report Summary dialog box, from which you can view summary information about the report
Report Server Info
Opens the Report Server Info dialog box, through which you can view server information, including Report Activity, JVM Memory, and Threads
Exit Exits Financial Reporting.
Command Description
Delete For the designer, removes an object from a report. in Studio Explore, removes a report, snapshot report or report object.
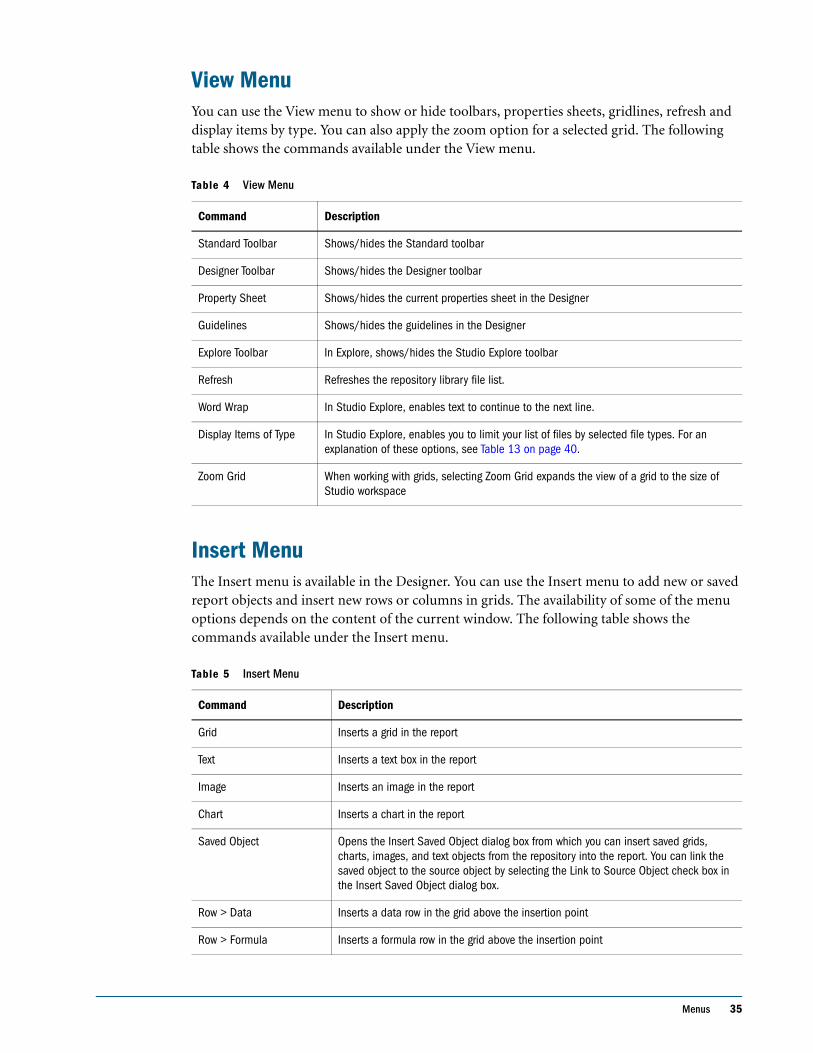
Menus 35
View MenuYou can use the View menu to show or hide toolbars, properties sheets, gridlines, refresh and display items by type. You can also apply the zoom option for a selected grid. The following table shows the commands available under the View menu.
Insert MenuThe Insert menu is available in the Designer. You can use the Insert menu to add new or saved report objects and insert new rows or columns in grids. The availability of some of the menu options depends on the content of the current window. The following table shows the commands available under the Insert menu.
Table 4 View Menu
Command Description
Standard Toolbar Shows/hides the Standard toolbar
Designer Toolbar Shows/hides the Designer toolbar
Property Sheet Shows/hides the current properties sheet in the Designer
Guidelines Shows/hides the guidelines in the Designer
Explore Toolbar In Explore, shows/hides the Studio Explore toolbar
Refresh Refreshes the repository library file list.
Word Wrap In Studio Explore, enables text to continue to the next line.
Display Items of Type In Studio Explore, enables you to limit your list of files by selected file types. For an explanation of these options, see Table 13 on page 40.
Zoom Grid When working with grids, selecting Zoom Grid expands the view of a grid to the size of Studio workspace
Table 5 Insert Menu
Command Description
Grid Inserts a grid in the report
Text Inserts a text box in the report
Image Inserts an image in the report
Chart Inserts a chart in the report
Saved Object Opens the Insert Saved Object dialog box from which you can insert saved grids, charts, images, and text objects from the repository into the report. You can link the saved object to the source object by selecting the Link to Source Object check box in the Insert Saved Object dialog box.
Row > Data Inserts a data row in the grid above the insertion point
Row > Formula Inserts a formula row in the grid above the insertion point
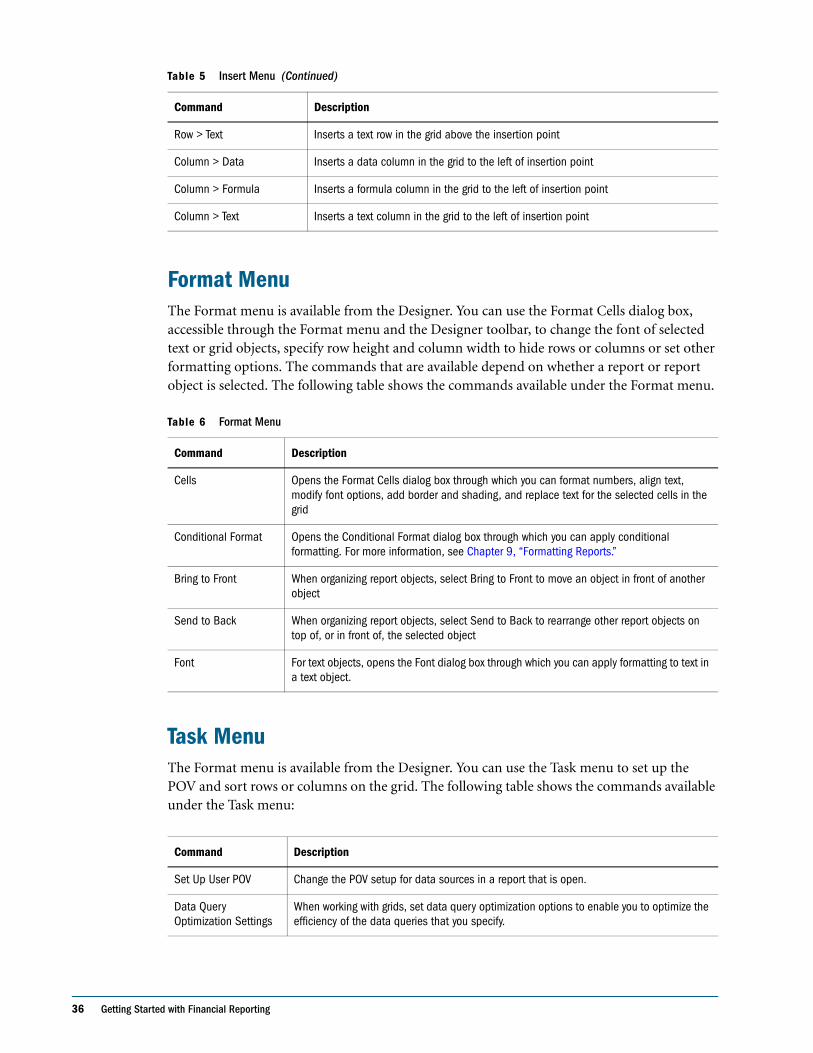
36 Getting Started with Financial Reporting
Format MenuThe Format menu is available from the Designer. You can use the Format Cells dialog box, accessible through the Format menu and the Designer toolbar, to change the font of selected text or grid objects, specify row height and column width to hide rows or columns or set other formatting options. The commands that are available depend on whether a report or report object is selected. The following table shows the commands available under the Format menu.
Task MenuThe Format menu is available from the Designer. You can use the Task menu to set up the POV and sort rows or columns on the grid. The following table shows the commands available under the Task menu:
Row > Text Inserts a text row in the grid above the insertion point
Column > Data Inserts a data column in the grid to the left of insertion point
Column > Formula Inserts a formula column in the grid to the left of insertion point
Column > Text Inserts a text column in the grid to the left of insertion point
Table 6 Format Menu
Command Description
Cells Opens the Format Cells dialog box through which you can format numbers, align text, modify font options, add border and shading, and replace text for the selected cells in the grid
Conditional Format Opens the Conditional Format dialog box through which you can apply conditional formatting. For more information, see Chapter 9, “Formatting Reports.”
Bring to Front When organizing report objects, select Bring to Front to move an object in front of another object
Send to Back When organizing report objects, select Send to Back to rearrange other report objects on top of, or in front of, the selected object
Font For text objects, opens the Font dialog box through which you can apply formatting to text in a text object.
Command Description
Set Up User POV Change the POV setup for data sources in a report that is open.
Data Query Optimization Settings
When working with grids, set data query optimization options to enable you to optimize the efficiency of the data queries that you specify.
Table 5 Insert Menu (Continued)
Command Description
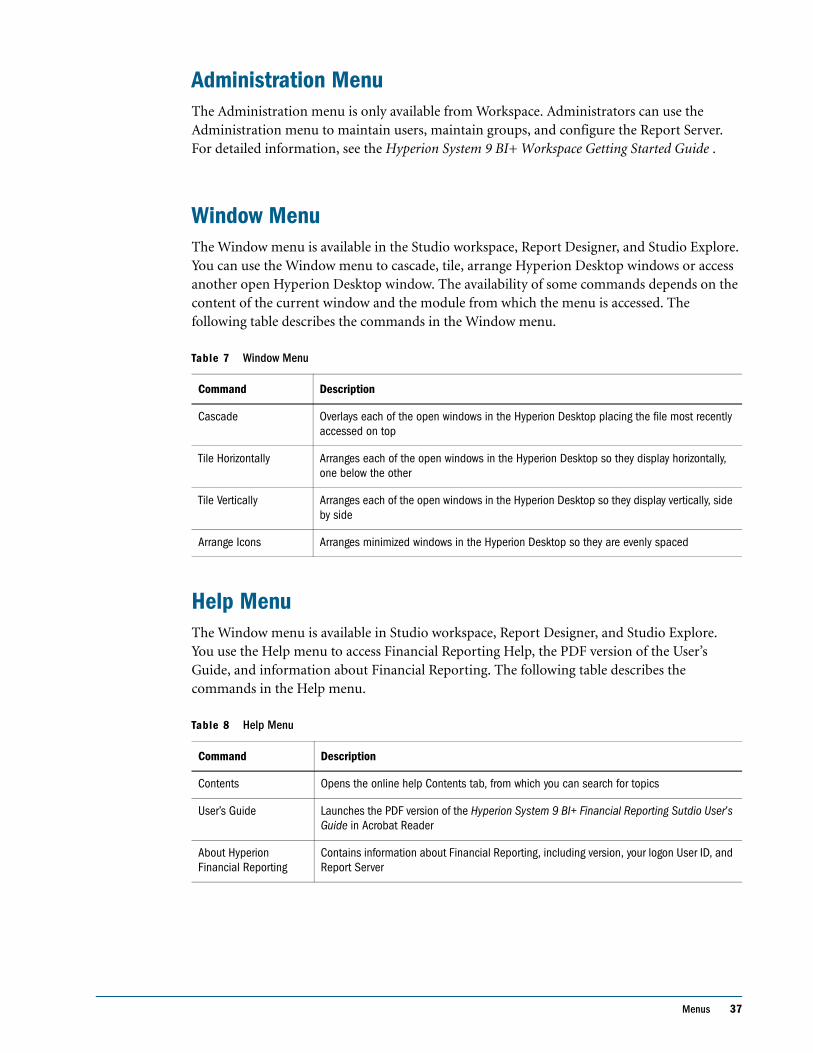
Menus 37
Administration MenuThe Administration menu is only available from Workspace. Administrators can use the Administration menu to maintain users, maintain groups, and configure the Report Server. For detailed information, see the Hyperion System 9 BI+ Workspace Getting Started Guide .
Window MenuThe Window menu is available in the Studio workspace, Report Designer, and Studio Explore. You can use the Window menu to cascade, tile, arrange Hyperion Desktop windows or access another open Hyperion Desktop window. The availability of some commands depends on the content of the current window and the module from which the menu is accessed. The following table describes the commands in the Window menu.
Help MenuThe Window menu is available in Studio workspace, Report Designer, and Studio Explore. You use the Help menu to access Financial Reporting Help, the PDF version of the User’s Guide, and information about Financial Reporting. The following table describes the commands in the Help menu.
Table 7 Window Menu
Command Description
Cascade Overlays each of the open windows in the Hyperion Desktop placing the file most recently accessed on top
Tile Horizontally Arranges each of the open windows in the Hyperion Desktop so they display horizontally, one below the other
Tile Vertically Arranges each of the open windows in the Hyperion Desktop so they display vertically, side by side
Arrange Icons Arranges minimized windows in the Hyperion Desktop so they are evenly spaced
Table 8 Help Menu
Command Description
Contents Opens the online help Contents tab, from which you can search for topics
User’s Guide Launches the PDF version of the Hyperion System 9 BI+ Financial Reporting Sutdio User’s Guide in Acrobat Reader
About Hyperion Financial Reporting
Contains information about Financial Reporting, including version, your logon User ID, and Report Server
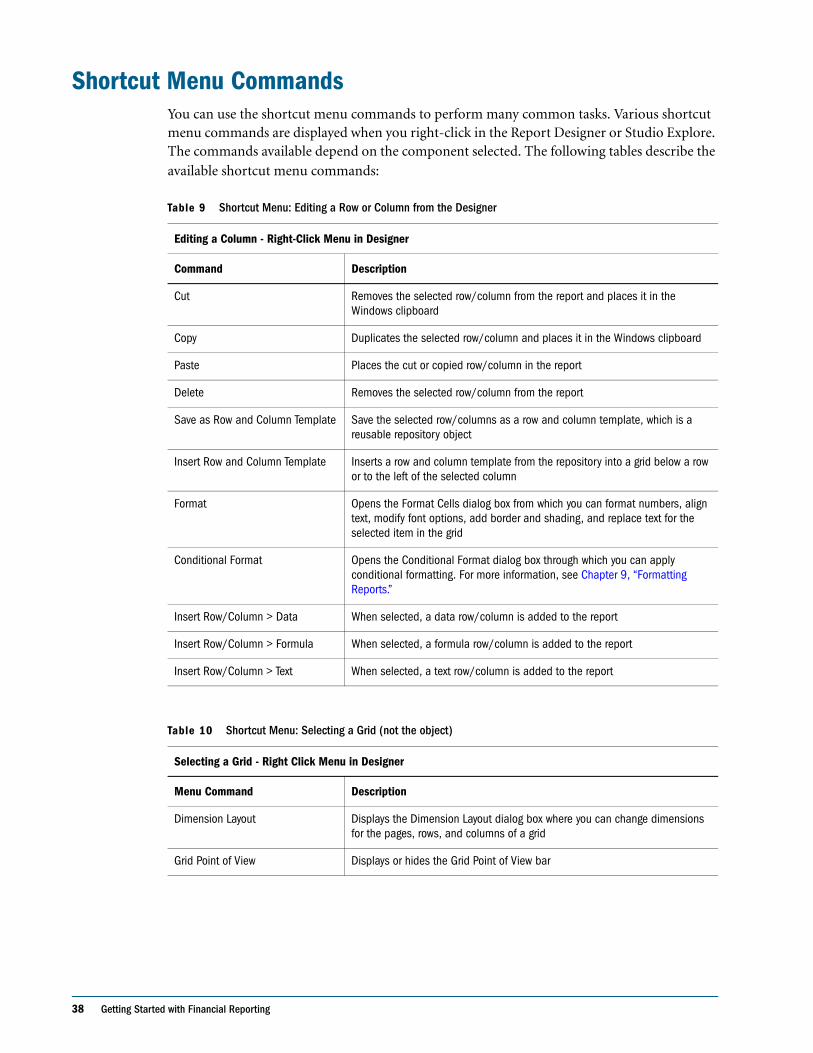
38 Getting Started with Financial Reporting
Shortcut Menu CommandsYou can use the shortcut menu commands to perform many common tasks. Various shortcut menu commands are displayed when you right-click in the Report Designer or Studio Explore. The commands available depend on the component selected. The following tables describe the
available shortcut menu commands:
Table 9 Shortcut Menu: Editing a Row or Column from the Designer
Editing a Column - Right-Click Menu in Designer
Command Description
Cut Removes the selected row/column from the report and places it in the Windows clipboard
Copy Duplicates the selected row/column and places it in the Windows clipboard
Paste Places the cut or copied row/column in the report
Delete Removes the selected row/column from the report
Save as Row and Column Template Save the selected row/columns as a row and column template, which is a reusable repository object
Insert Row and Column Template Inserts a row and column template from the repository into a grid below a row or to the left of the selected column
Format Opens the Format Cells dialog box from which you can format numbers, align text, modify font options, add border and shading, and replace text for the selected item in the grid
Conditional Format Opens the Conditional Format dialog box through which you can apply conditional formatting. For more information, see Chapter 9, “Formatting Reports.”
Insert Row/Column > Data When selected, a data row/column is added to the report
Insert Row/Column > Formula When selected, a formula row/column is added to the report
Insert Row/Column > Text When selected, a text row/column is added to the report
Table 10 Shortcut Menu: Selecting a Grid (not the object)
Selecting a Grid - Right Click Menu in Designer
Menu Command Description
Dimension Layout Displays the Dimension Layout dialog box where you can change dimensions for the pages, rows, and columns of a grid
Grid Point of View Displays or hides the Grid Point of View bar
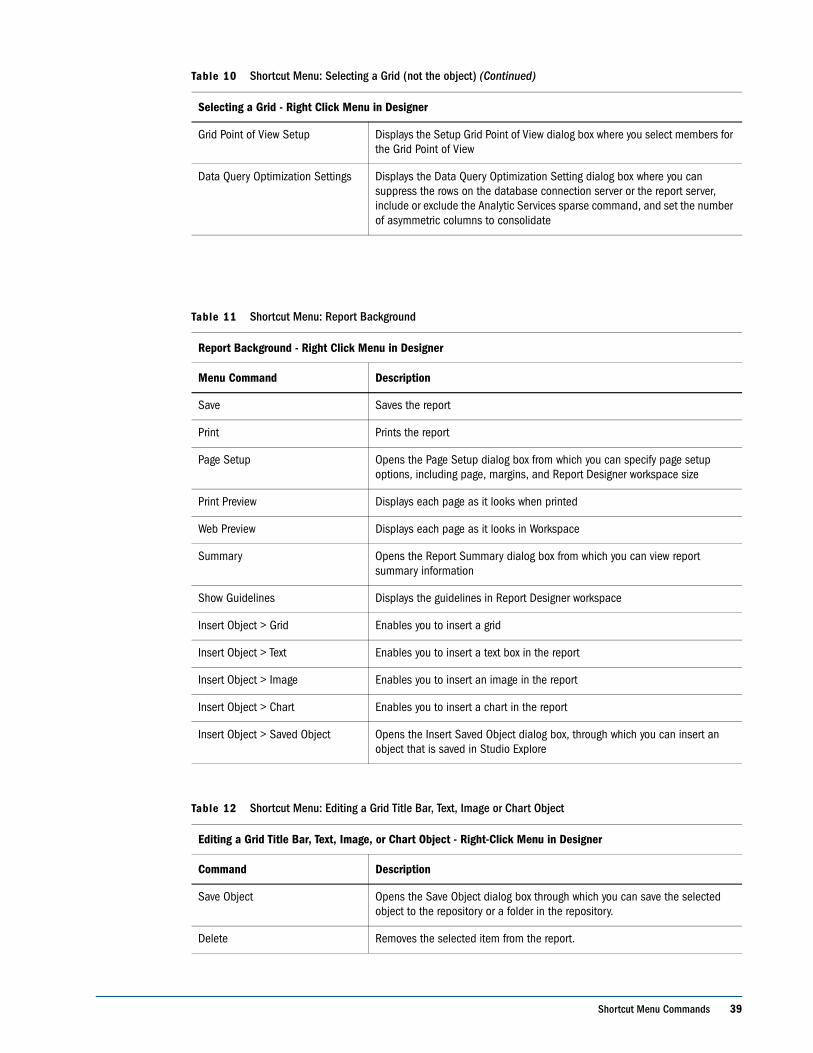
Shortcut Menu Commands 39
Grid Point of View Setup Displays the Setup Grid Point of View dialog box where you select members for the Grid Point of View
Data Query Optimization Settings Displays the Data Query Optimization Setting dialog box where you can suppress the rows on the database connection server or the report server, include or exclude the Analytic Services sparse command, and set the number of asymmetric columns to consolidate
Table 11 Shortcut Menu: Report Background
Report Background - Right Click Menu in Designer
Menu Command Description
Save Saves the report
Print Prints the report
Page Setup Opens the Page Setup dialog box from which you can specify page setup options, including page, margins, and Report Designer workspace size
Print Preview Displays each page as it looks when printed
Web Preview Displays each page as it looks in Workspace
Summary Opens the Report Summary dialog box from which you can view report summary information
Show Guidelines Displays the guidelines in Report Designer workspace
Insert Object > Grid Enables you to insert a grid
Insert Object > Text Enables you to insert a text box in the report
Insert Object > Image Enables you to insert an image in the report
Insert Object > Chart Enables you to insert a chart in the report
Insert Object > Saved Object Opens the Insert Saved Object dialog box, through which you can insert an object that is saved in Studio Explore
Table 12 Shortcut Menu: Editing a Grid Title Bar, Text, Image or Chart Object
Editing a Grid Title Bar, Text, Image, or Chart Object - Right-Click Menu in Designer
Command Description
Save Object Opens the Save Object dialog box through which you can save the selected object to the repository or a folder in the repository.
Delete Removes the selected item from the report.
Table 10 Shortcut Menu: Selecting a Grid (not the object) (Continued)
Selecting a Grid - Right Click Menu in Designer
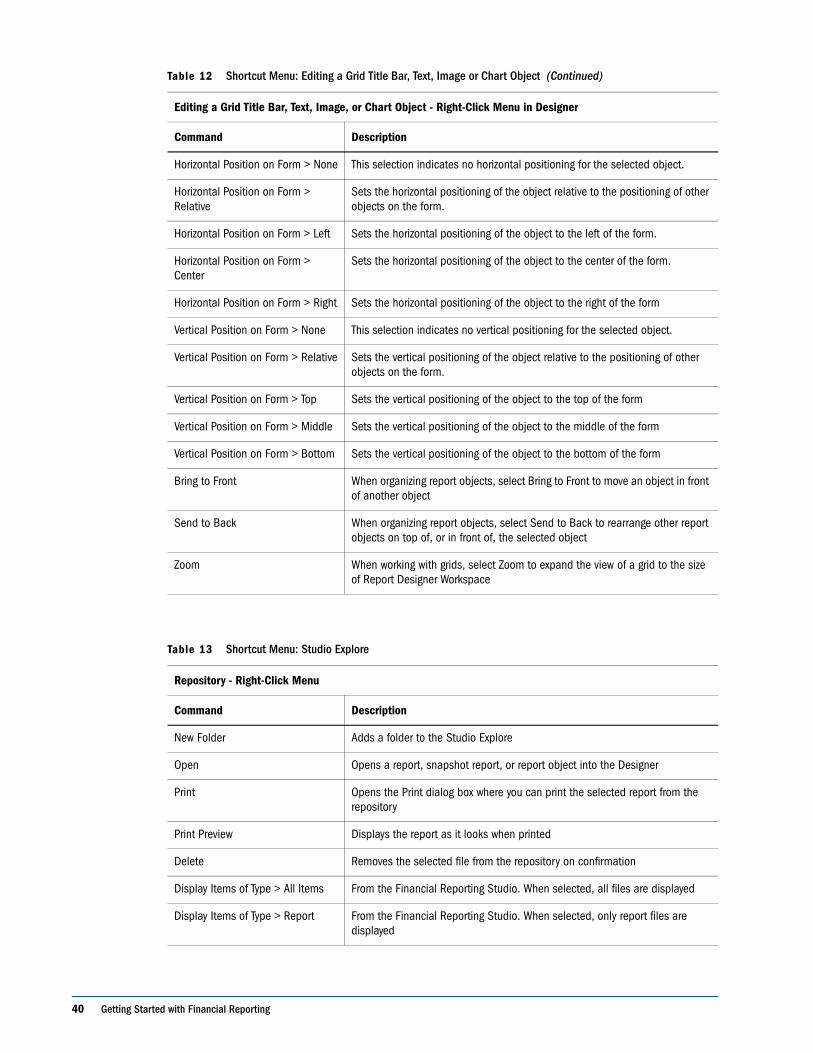
40 Getting Started with Financial Reporting
Horizontal Position on Form > None This selection indicates no horizontal positioning for the selected object.
Horizontal Position on Form > Relative
Sets the horizontal positioning of the object relative to the positioning of other objects on the form.
Horizontal Position on Form > Left Sets the horizontal positioning of the object to the left of the form.
Horizontal Position on Form > Center
Sets the horizontal positioning of the object to the center of the form.
Horizontal Position on Form > Right Sets the horizontal positioning of the object to the right of the form
Vertical Position on Form > None This selection indicates no vertical positioning for the selected object.
Vertical Position on Form > Relative Sets the vertical positioning of the object relative to the positioning of other objects on the form.
Vertical Position on Form > Top Sets the vertical positioning of the object to the top of the form
Vertical Position on Form > Middle Sets the vertical positioning of the object to the middle of the form
Vertical Position on Form > Bottom Sets the vertical positioning of the object to the bottom of the form
Bring to Front When organizing report objects, select Bring to Front to move an object in front of another object
Send to Back When organizing report objects, select Send to Back to rearrange other report objects on top of, or in front of, the selected object
Zoom When working with grids, select Zoom to expand the view of a grid to the size of Report Designer Workspace
Table 13 Shortcut Menu: Studio Explore
Repository - Right-Click Menu
Command Description
New Folder Adds a folder to the Studio Explore
Open Opens a report, snapshot report, or report object into the Designer
Print Opens the Print dialog box where you can print the selected report from the repository
Print Preview Displays the report as it looks when printed
Delete Removes the selected file from the repository on confirmation
Display Items of Type > All Items From the Financial Reporting Studio. When selected, all files are displayed
Display Items of Type > Report From the Financial Reporting Studio. When selected, only report files are displayed
Table 12 Shortcut Menu: Editing a Grid Title Bar, Text, Image or Chart Object (Continued)
Editing a Grid Title Bar, Text, Image, or Chart Object - Right-Click Menu in Designer
Command Description
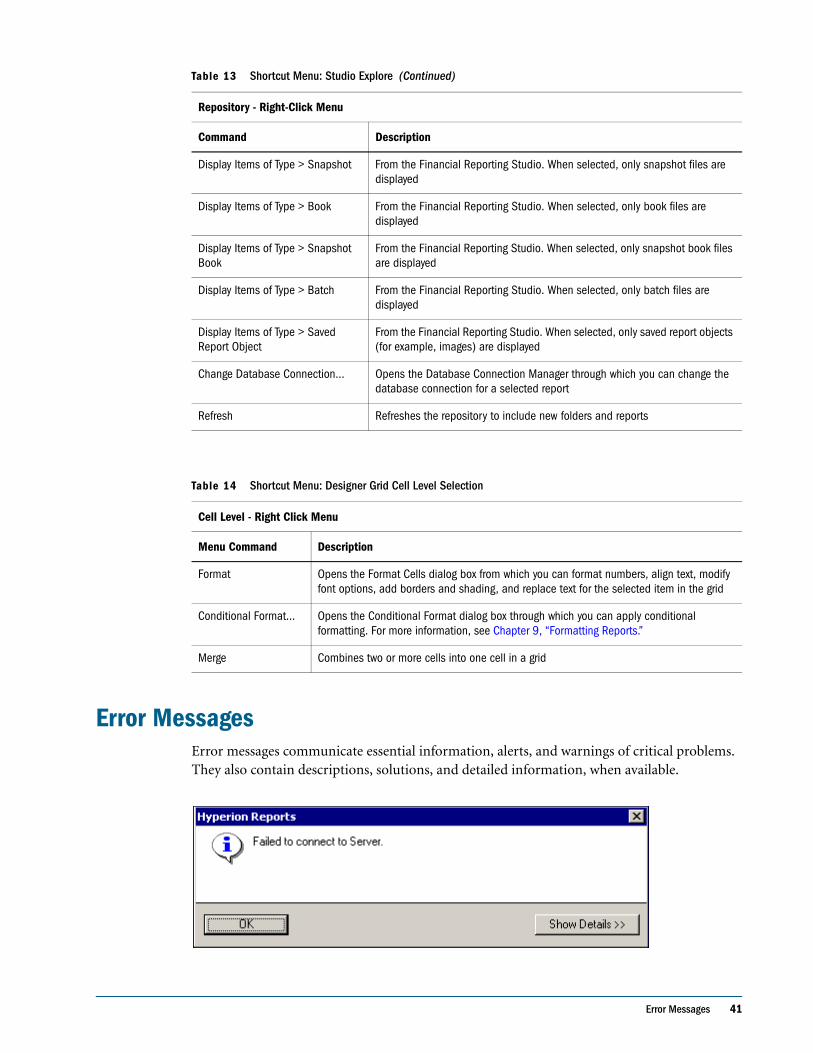
Error Messages 41
Error MessagesError messages communicate essential information, alerts, and warnings of critical problems. They also contain descriptions, solutions, and detailed information, when available.
Display Items of Type > Snapshot From the Financial Reporting Studio. When selected, only snapshot files are displayed
Display Items of Type > Book From the Financial Reporting Studio. When selected, only book files are displayed
Display Items of Type > Snapshot Book
From the Financial Reporting Studio. When selected, only snapshot book files are displayed
Display Items of Type > Batch From the Financial Reporting Studio. When selected, only batch files are displayed
Display Items of Type > Saved Report Object
From the Financial Reporting Studio. When selected, only saved report objects (for example, images) are displayed
Change Database Connection... Opens the Database Connection Manager through which you can change the database connection for a selected report
Refresh Refreshes the repository to include new folders and reports
Table 14 Shortcut Menu: Designer Grid Cell Level Selection
Cell Level - Right Click Menu
Menu Command Description
Format Opens the Format Cells dialog box from which you can format numbers, align text, modify font options, add borders and shading, and replace text for the selected item in the grid
Conditional Format... Opens the Conditional Format dialog box through which you can apply conditional formatting. For more information, see Chapter 9, “Formatting Reports.”
Merge Combines two or more cells into one cell in a grid
Table 13 Shortcut Menu: Studio Explore (Continued)
Repository - Right-Click Menu
Command Description
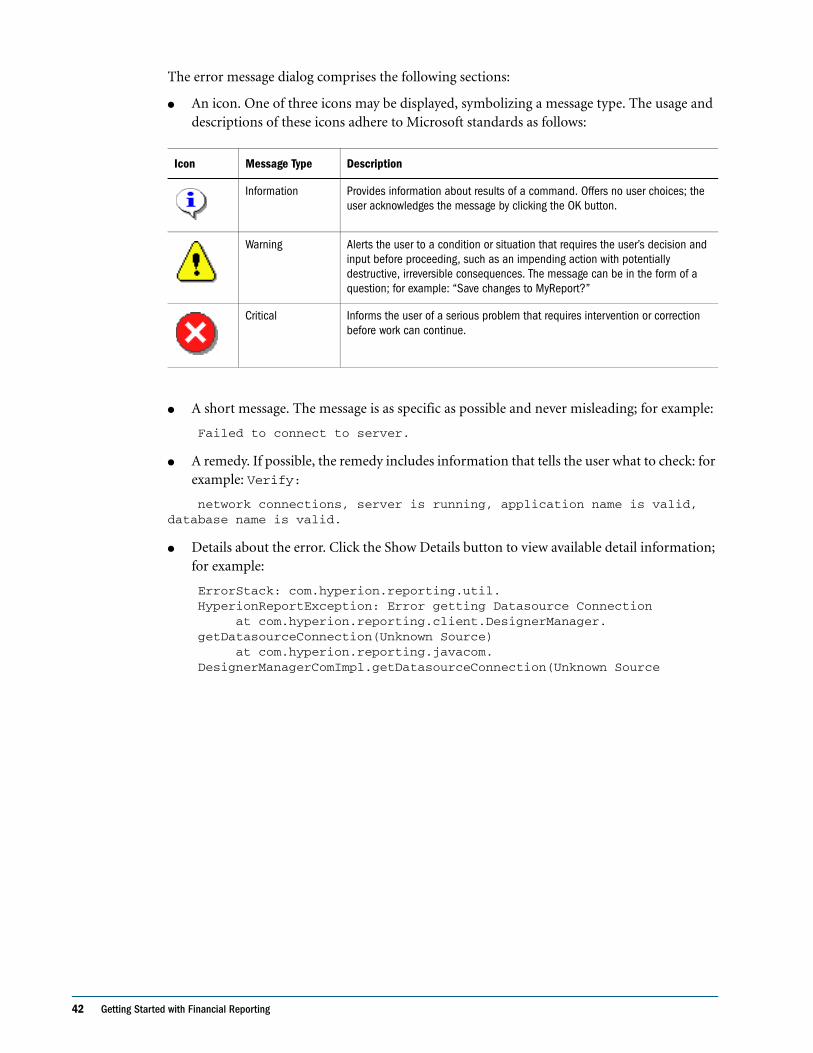
42 Getting Started with Financial Reporting
The error message dialog comprises the following sections:
● An icon. One of three icons may be displayed, symbolizing a message type. The usage and descriptions of these icons adhere to Microsoft standards as follows:
● A short message. The message is as specific as possible and never misleading; for example:
Failed to connect to server.
● A remedy. If possible, the remedy includes information that tells the user what to check: for example: Verify:
network connections, server is running, application name is valid, database name is valid.
● Details about the error. Click the Show Details button to view available detail information; for example:
ErrorStack: com.hyperion.reporting.util. HyperionReportException: Error getting Datasource Connection at com.hyperion.reporting.client.DesignerManager. getDatasourceConnection(Unknown Source) at com.hyperion.reporting.javacom. DesignerManagerComImpl.getDatasourceConnection(Unknown Source
Icon Message Type Description
Information Provides information about results of a command. Offers no user choices; the user acknowledges the message by clicking the OK button.
Warning Alerts the user to a condition or situation that requires the user’s decision and input before proceeding, such as an impending action with potentially destructive, irreversible consequences. The message can be in the form of a question; for example: “Save changes to MyReport?”
Critical Informs the user of a serious problem that requires intervention or correction before work can continue.
Selecting Members for Report Designers 43
C h a p t e r
2Selecting Members for Report
Designers
Specifying data for grids entails setting criteria that identify the data for retrieval. You set the criteria by assigning members to the rows, columns, and page axes in a grid, as well as to the grid point of view (POV) and userPOV bars. For more information, see Chapter 6, “Defining the User POV” and “Defining the Grid Point of View” on page 131.
You can create lists of reusable members, and use functions that retrieve members dynamically. Before you begin to define members, you must insert a grid in the report and define its dimension layout. For more information, see “Adding Grids” on page 98.
Note: If you use Planning Details as a type of database connection to go against a Planning cube, all available dimensions are listed. However, you have access privileges to members only in certain dimensions. This affects the output of your report. For more information, on how access privileges affect your report, see the topic “Access Privileges for the Planning Details Database Source” on page 68.
In This Chapter Select Members Dialog Box . . . . . . . . . . . . . . . . . . . . . . . . . . . . . . . . . . . . . . . . . . . . . . . . . . . . . . . . . . . . . . . . . . 44
Assigning Members to Data Rows or Columns. . . . . . . . . . . . . . . . . . . . . . . . . . . . . . . . . . . . . . . . . . . . . . . . . . . . . 48
Assigning Members to the Page Axis. . . . . . . . . . . . . . . . . . . . . . . . . . . . . . . . . . . . . . . . . . . . . . . . . . . . . . . . . . . . 50
Assigning Special Members . . . . . . . . . . . . . . . . . . . . . . . . . . . . . . . . . . . . . . . . . . . . . . . . . . . . . . . . . . . . . . . . . . 50
Assigning Members Using Functions. . . . . . . . . . . . . . . . . . . . . . . . . . . . . . . . . . . . . . . . . . . . . . . . . . . . . . . . . . . . 54
Editing Functions. . . . . . . . . . . . . . . . . . . . . . . . . . . . . . . . . . . . . . . . . . . . . . . . . . . . . . . . . . . . . . . . . . . . . . . . . . 61
Copying Members Between Applications. . . . . . . . . . . . . . . . . . . . . . . . . . . . . . . . . . . . . . . . . . . . . . . . . . . . . . . . . 61
Removing or Adding Members . . . . . . . . . . . . . . . . . . . . . . . . . . . . . . . . . . . . . . . . . . . . . . . . . . . . . . . . . . . . . . . . 62
Selecting Multiple Members Based on Criteria . . . . . . . . . . . . . . . . . . . . . . . . . . . . . . . . . . . . . . . . . . . . . . . . . . . . 62
Filtering the View of Members Based on Criteria . . . . . . . . . . . . . . . . . . . . . . . . . . . . . . . . . . . . . . . . . . . . . . . . . . . 63
Defining Member Lists . . . . . . . . . . . . . . . . . . . . . . . . . . . . . . . . . . . . . . . . . . . . . . . . . . . . . . . . . . . . . . . . . . . . . . 64
Editing Member Lists . . . . . . . . . . . . . . . . . . . . . . . . . . . . . . . . . . . . . . . . . . . . . . . . . . . . . . . . . . . . . . . . . . . . . . . 65
Searching for Members . . . . . . . . . . . . . . . . . . . . . . . . . . . . . . . . . . . . . . . . . . . . . . . . . . . . . . . . . . . . . . . . . . . . . 65
Sorting Members . . . . . . . . . . . . . . . . . . . . . . . . . . . . . . . . . . . . . . . . . . . . . . . . . . . . . . . . . . . . . . . . . . . . . . . . . . 67
Previewing Selected Members . . . . . . . . . . . . . . . . . . . . . . . . . . . . . . . . . . . . . . . . . . . . . . . . . . . . . . . . . . . . . . . . 67
Access Privileges for the Planning Details Database Source . . . . . . . . . . . . . . . . . . . . . . . . . . . . . . . . . . . . . . . . . . 68
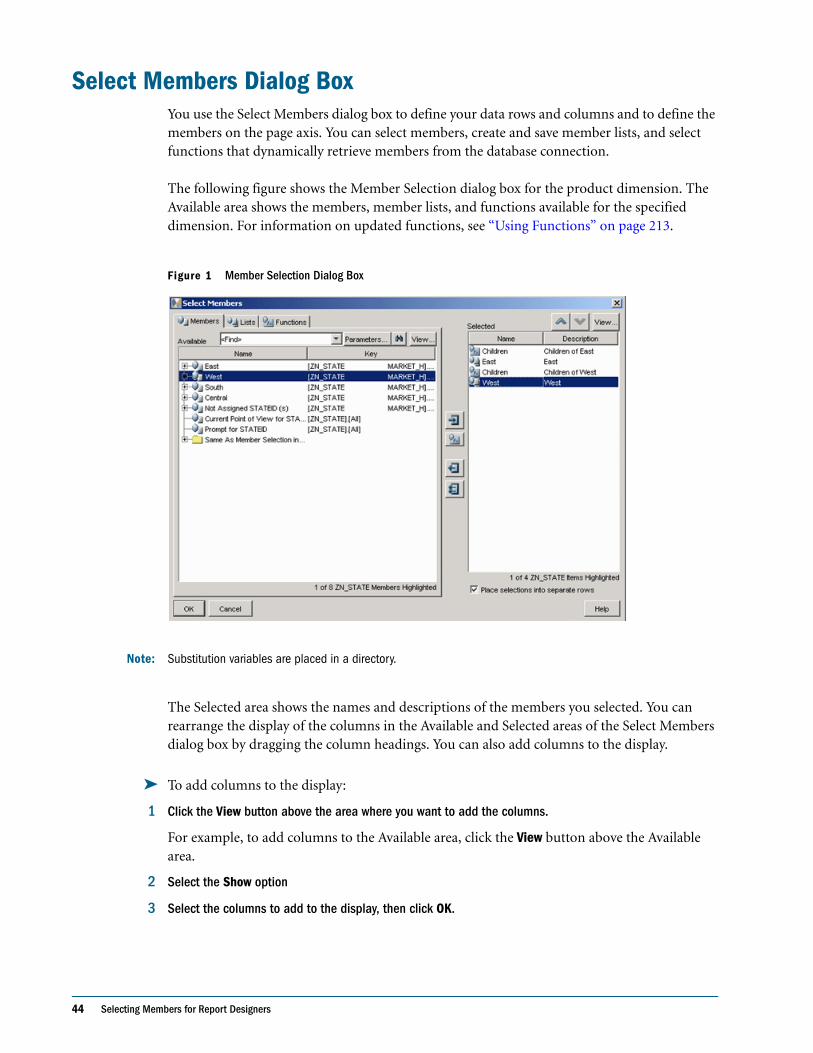
44 Selecting Members for Report Designers
Select Members Dialog BoxYou use the Select Members dialog box to define your data rows and columns and to define the members on the page axis. You can select members, create and save member lists, and select functions that dynamically retrieve members from the database connection.
The following figure shows the Member Selection dialog box for the product dimension. The Available area shows the members, member lists, and functions available for the specified dimension. For information on updated functions, see “Using Functions” on page 213.
Figure 1 Member Selection Dialog Box
Note: Substitution variables are placed in a directory.
The Selected area shows the names and descriptions of the members you selected. You can rearrange the display of the columns in the Available and Selected areas of the Select Members dialog box by dragging the column headings. You can also add columns to the display.
➤ To add columns to the display:
1 Click the View button above the area where you want to add the columns.
For example, to add columns to the Available area, click the View button above the Available area.
2 Select the Show option
3 Select the columns to add to the display, then click OK.
Select Members Dialog Box 45
With an SAP BW data source, you can use the View button above the Available area to view a dimension hierarchy other than the one that is displayed.
➤ To view a hierarchy other than the one that is displayed:
1 Click a hierarchical dimension in the Available area.
2 Click the View button above the Available area.
3 Select the Hierarchy option.
4 Select the hierarchy you want to view, then click OK.
Note: The properties below the Available area are displayed only if you are reporting on Financial Management Organization by Period for the Entity dimension. The parent and the entities that belong to the parent are displayed.
When you run a report, the parent name is not displayed; only the entity name is displayed.
Available AreaThe Available area shows the members that are available to assign to a grid. You can show individual members, member lists, and functions that dynamically select members. The Select Members dialog box has three navigational tabs: Members, Lists, and Functions.
Members TabThe Members tab shows the members that are associated with the selected dimension. By default, the members for a dimension are shown in tree view, which is a hierarchal view of the members of the specified dimension. You can also show the members in a flat list. By default, the tree view shows only the top-level member. You can expand the top-level member to see its descendents.
Lists TabThe Lists tab shows member lists used to perform a query or to select members for your report. The type of lists vary based on the database connection you are using. Member lists can be of the following type.
System lists. System lists are predefined in the database when you create user lists; you can include members, member lists, and functions. System lists are available when you use Analytic Services, Planning, or Financial Management as database connections.
User lists. You can create user-defined list members in a predefined order. You can create user lists when using Analytic Services as a database connection. For information on adding a user-defined list, see “Defining Member Lists” on page 64.
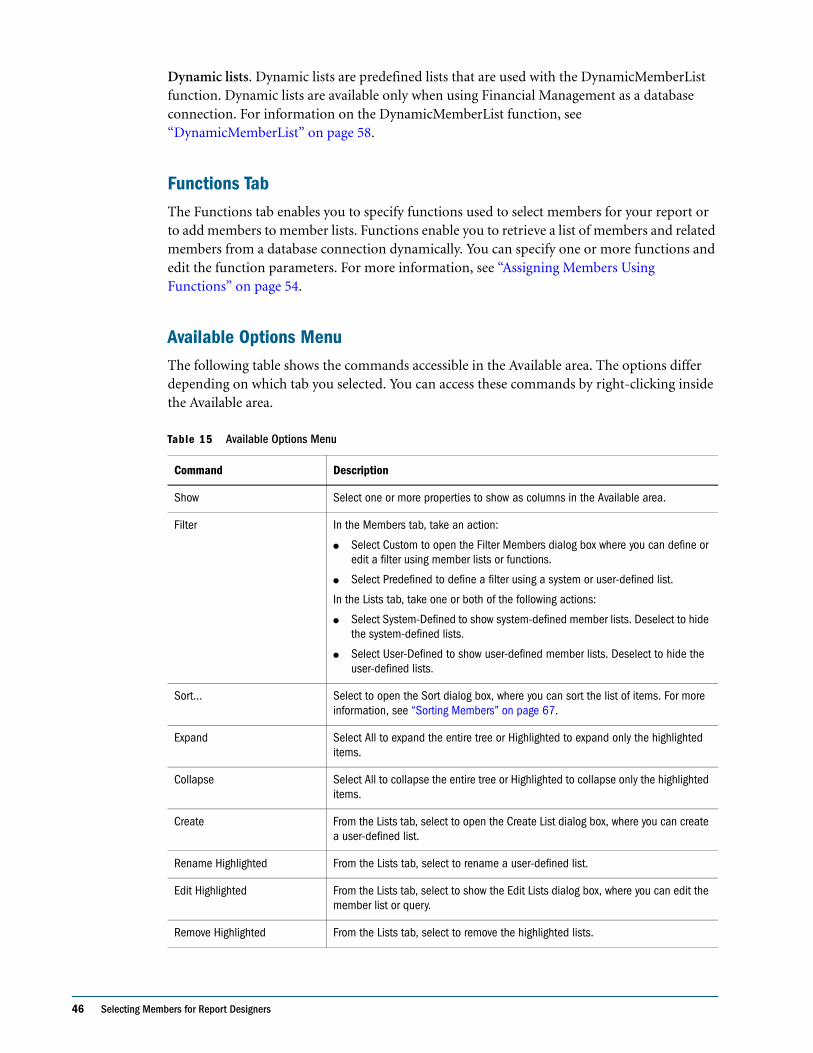
46 Selecting Members for Report Designers
Dynamic lists. Dynamic lists are predefined lists that are used with the DynamicMemberList function. Dynamic lists are available only when using Financial Management as a database connection. For information on the DynamicMemberList function, see “DynamicMemberList” on page 58.
Functions TabThe Functions tab enables you to specify functions used to select members for your report or to add members to member lists. Functions enable you to retrieve a list of members and related members from a database connection dynamically. You can specify one or more functions and edit the function parameters. For more information, see “Assigning Members Using Functions” on page 54.
Available Options MenuThe following table shows the commands accessible in the Available area. The options differ depending on which tab you selected. You can access these commands by right-clicking inside the Available area.
Table 15 Available Options Menu
Command Description
Show Select one or more properties to show as columns in the Available area.
Filter In the Members tab, take an action:
● Select Custom to open the Filter Members dialog box where you can define or edit a filter using member lists or functions.
● Select Predefined to define a filter using a system or user-defined list.
In the Lists tab, take one or both of the following actions:
● Select System-Defined to show system-defined member lists. Deselect to hide the system-defined lists.
● Select User-Defined to show user-defined member lists. Deselect to hide the user-defined lists.
Sort... Select to open the Sort dialog box, where you can sort the list of items. For more information, see “Sorting Members” on page 67.
Expand Select All to expand the entire tree or Highlighted to expand only the highlighted items.
Collapse Select All to collapse the entire tree or Highlighted to collapse only the highlighted items.
Create From the Lists tab, select to open the Create List dialog box, where you can create a user-defined list.
Rename Highlighted From the Lists tab, select to rename a user-defined list.
Edit Highlighted From the Lists tab, select to show the Edit Lists dialog box, where you can edit the member list or query.
Remove Highlighted From the Lists tab, select to remove the highlighted lists.
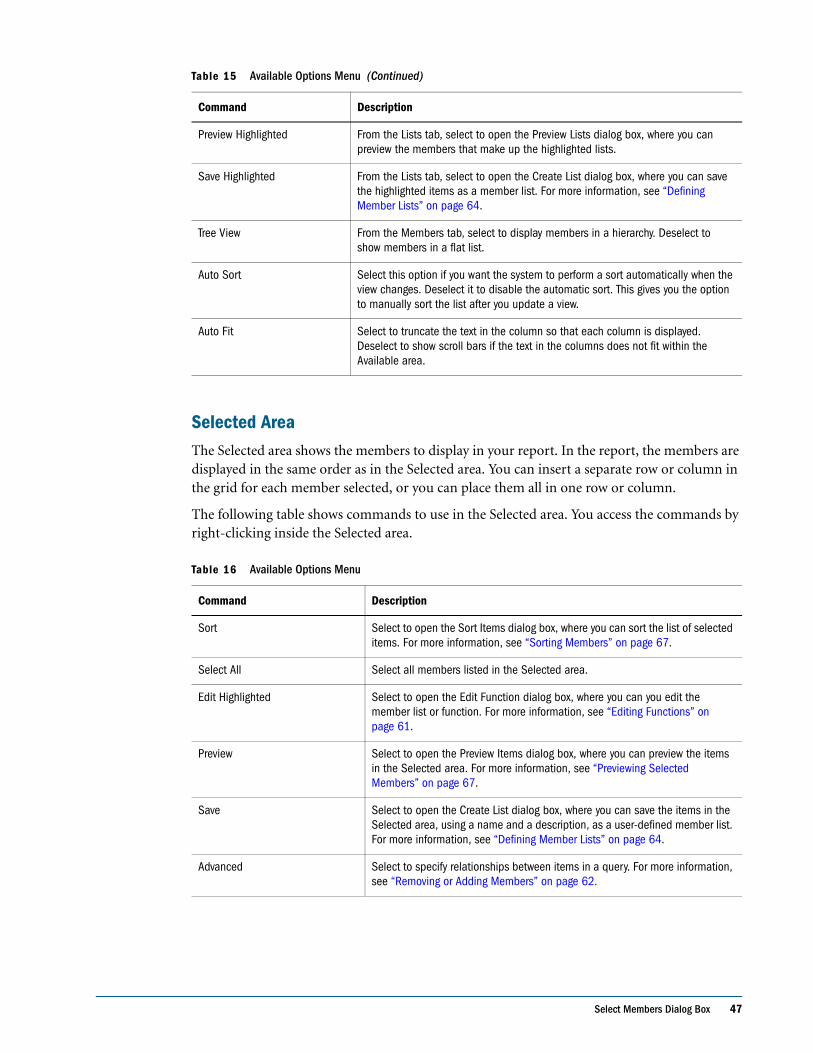
Select Members Dialog Box 47
Selected AreaThe Selected area shows the members to display in your report. In the report, the members are displayed in the same order as in the Selected area. You can insert a separate row or column in the grid for each member selected, or you can place them all in one row or column.
The following table shows commands to use in the Selected area. You access the commands by right-clicking inside the Selected area.
Preview Highlighted From the Lists tab, select to open the Preview Lists dialog box, where you can preview the members that make up the highlighted lists.
Save Highlighted From the Lists tab, select to open the Create List dialog box, where you can save the highlighted items as a member list. For more information, see “Defining Member Lists” on page 64.
Tree View From the Members tab, select to display members in a hierarchy. Deselect to show members in a flat list.
Auto Sort Select this option if you want the system to perform a sort automatically when the view changes. Deselect it to disable the automatic sort. This gives you the option to manually sort the list after you update a view.
Auto Fit Select to truncate the text in the column so that each column is displayed. Deselect to show scroll bars if the text in the columns does not fit within the Available area.
Table 16 Available Options Menu
Command Description
Sort Select to open the Sort Items dialog box, where you can sort the list of selected items. For more information, see “Sorting Members” on page 67.
Select All Select all members listed in the Selected area.
Edit Highlighted Select to open the Edit Function dialog box, where you can you edit the member list or function. For more information, see “Editing Functions” on page 61.
Preview Select to open the Preview Items dialog box, where you can preview the items in the Selected area. For more information, see “Previewing Selected Members” on page 67.
Save Select to open the Create List dialog box, where you can save the items in the Selected area, using a name and a description, as a user-defined member list. For more information, see “Defining Member Lists” on page 64.
Advanced Select to specify relationships between items in a query. For more information, see “Removing or Adding Members” on page 62.
Table 15 Available Options Menu (Continued)
Command Description
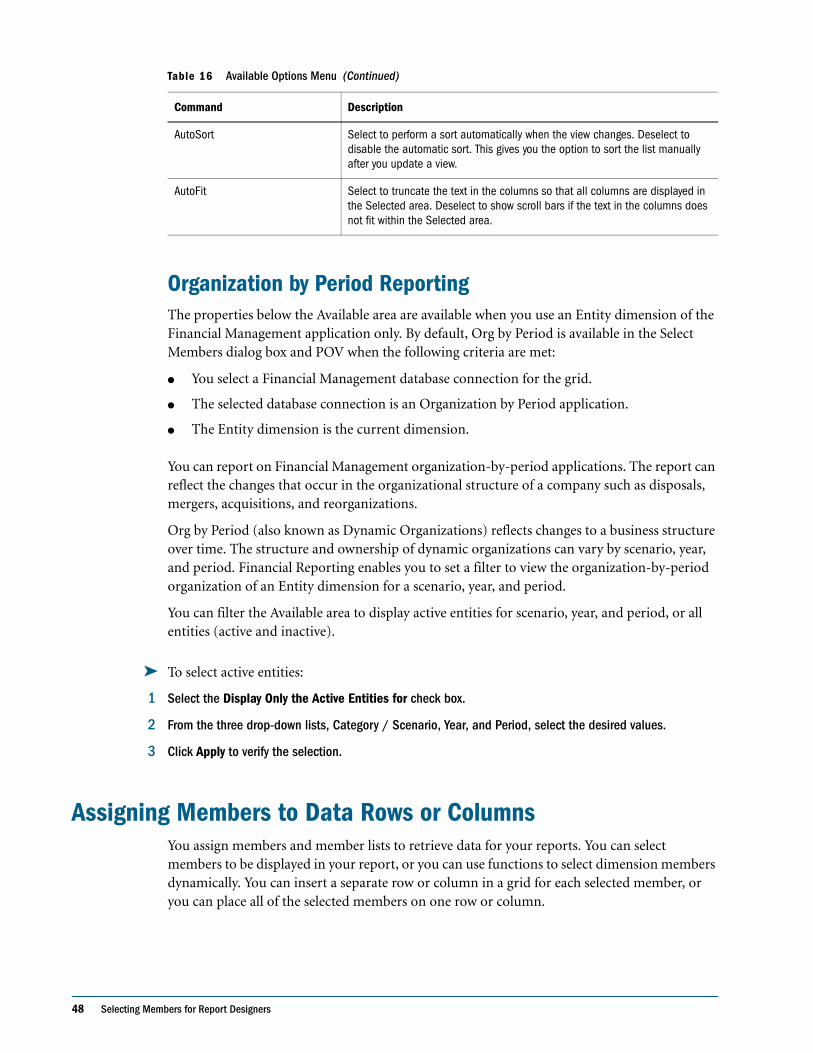
48 Selecting Members for Report Designers
Organization by Period ReportingThe properties below the Available area are available when you use an Entity dimension of the Financial Management application only. By default, Org by Period is available in the Select Members dialog box and POV when the following criteria are met:
● You select a Financial Management database connection for the grid.
● The selected database connection is an Organization by Period application.
● The Entity dimension is the current dimension.
You can report on Financial Management organization-by-period applications. The report can reflect the changes that occur in the organizational structure of a company such as disposals, mergers, acquisitions, and reorganizations.
Org by Period (also known as Dynamic Organizations) reflects changes to a business structure over time. The structure and ownership of dynamic organizations can vary by scenario, year, and period. Financial Reporting enables you to set a filter to view the organization-by-period organization of an Entity dimension for a scenario, year, and period.
You can filter the Available area to display active entities for scenario, year, and period, or all entities (active and inactive).
➤ To select active entities:
1 Select the Display Only the Active Entities for check box.
2 From the three drop-down lists, Category / Scenario, Year, and Period, select the desired values.
3 Click Apply to verify the selection.
Assigning Members to Data Rows or ColumnsYou assign members and member lists to retrieve data for your reports. You can select members to be displayed in your report, or you can use functions to select dimension members dynamically. You can insert a separate row or column in a grid for each selected member, or you can place all of the selected members on one row or column.
AutoSort Select to perform a sort automatically when the view changes. Deselect to disable the automatic sort. This gives you the option to sort the list manually after you update a view.
AutoFit Select to truncate the text in the columns so that all columns are displayed in the Selected area. Deselect to show scroll bars if the text in the columns does not fit within the Selected area.
Table 16 Available Options Menu (Continued)
Command Description
Assigning Members to Data Rows or Columns 49
➤ To select members for data rows or columns:
1 Open a report.
2 To add members using the Select Members dialog box, take an action:
● Double-click a dimension in the grid.
● Select a dimension in the grid. Then in the formula bar, click the button with the dimension name.
Note: If you know the member names for a dimension, enter the member names, separated by commas, into the formula bar text area. Case sensitivity is enabled for member names, however it is not enabled for function names. For example, for the Measures dimension you might enter children of (Profit), then click the check mark to verify the member names.
3 Take an action:
● To assign individual members, select the Members tab, then highlight the members to add to the data row or column.
● To assign member lists, select the Lists tab, then highlight the member lists to add to the data row or column.
● To assign functions, select the Functions tab, then highlight the functions to add to the data row or column.
4 Take an action:
● To add the highlighted items to the Selected area, click the Add button, .
● To add a member function (children, descendents, and so on) to a selected member, click
the Add Relationship button, .
Note: The Add Relationship button is available only on the Members tab.
5 Optional: In the Selected are, review the selected members by clicking the View button, then selecting Preview. For more information, see “Previewing Selected Members” on page 67.
6 Optional: To insert a row or column for each selected member, select the check box, Place selections into separate rows (or Columns).
Note: This option is available only in the Select Members dialog box and not the Formula bar.
7 Click OK to return to the report designer.
50 Selecting Members for Report Designers
Assigning Members to the Page AxisYou can assign members to the page axis of a grid. When you select members for the page axis and run the report, the system generates a grid for each page member. If a chart references a grid with multiple page members, a new chart is generated for each page member.
For example, suppose you assign the following members of the Scenario and Entity dimensions to the page axis:
● Target 1 and Target 2 of the Scenario dimension
● Radio Promotions and Web Promotions to the Entity dimension
When you view the report, it is formatted and populated with data from all combinations of members on the page axis. The report contains four grids, one for each page member combination.
You can select any combination of the members:
● Target 1: Radio Promotions
● Target 1: Web Promotions
● Target 2: Radio Promotions
● Target 2: Web Promotions
To add or change dimensions that are assigned to the page axis, see “Adding Grids” on page 98.
Note: In Financial Reporting, the members (and corresponding data) in the page axis are all retrieved when the report is run. Reports with a large number of members on the page axis, may impact performance.
➤ To assign members to the page axis:
1 Open a report.
2 Select a dimension on the Pages bar.
3 On the formula bar, select the button with the dimension name.
Note: If you know the member names for a dimension, enter the member name into the formula bar text area. For example, for the Measures dimension enter Profit, Sales. Click the check mark, to verify the member selection.
4 In the Member Selection dialog box, select the members to use on the page axis, then click OK.
Assigning Special MembersYou can use the Select Members dialog box to select the special members Prompt, Same As, Current Point of View, and User Point of View.
Assigning Special Members 51
● Prompt acts like a variable that asks the user to select members when a report is run. You determine the dimension and defaults at design time, and the user selects the members when generating the report. Prompt also enables the report writer to filter the dimension members from which the user can select when running the report.
● Same As creates a column or row member selection with the same member selection setting as another column or row.
● Current Point of View acts as a variable that employs the POV to specify the member of a dimension when the report is run.
● User Point of View can be selected as a member on the book POV. The parameters can be modified by the end user.
Setting Up Report Prompts for MembersA prompt is a way of enabling the viewer to assign members to a dimension. The prompt is set up during design time. As a report designer, you can limit the type of data to assign to a dimension. You can also specify whether the Respond to Prompts dialog box displays member names, descriptions (for a Financial Management database connection) or aliases (for Analytic Services or Planning database connections), or both member names and descriptions or aliases.
For example, you might create a report that enables the user to select from lines of products. The report designer selects Prompt as a member of Product, then selects specific lines of product. The end user who runs the report selects from those product lines.
➤ To set up a report prompt for members:
1 Open a report.
2 Double-click a dimension cell for which you want to assign a prompt.
3 in the Available area of the Members tab, select Prompt for (dimension name) and move it the Selected area.
4 Click OK.
The Define Prompts dialog box is displayed:
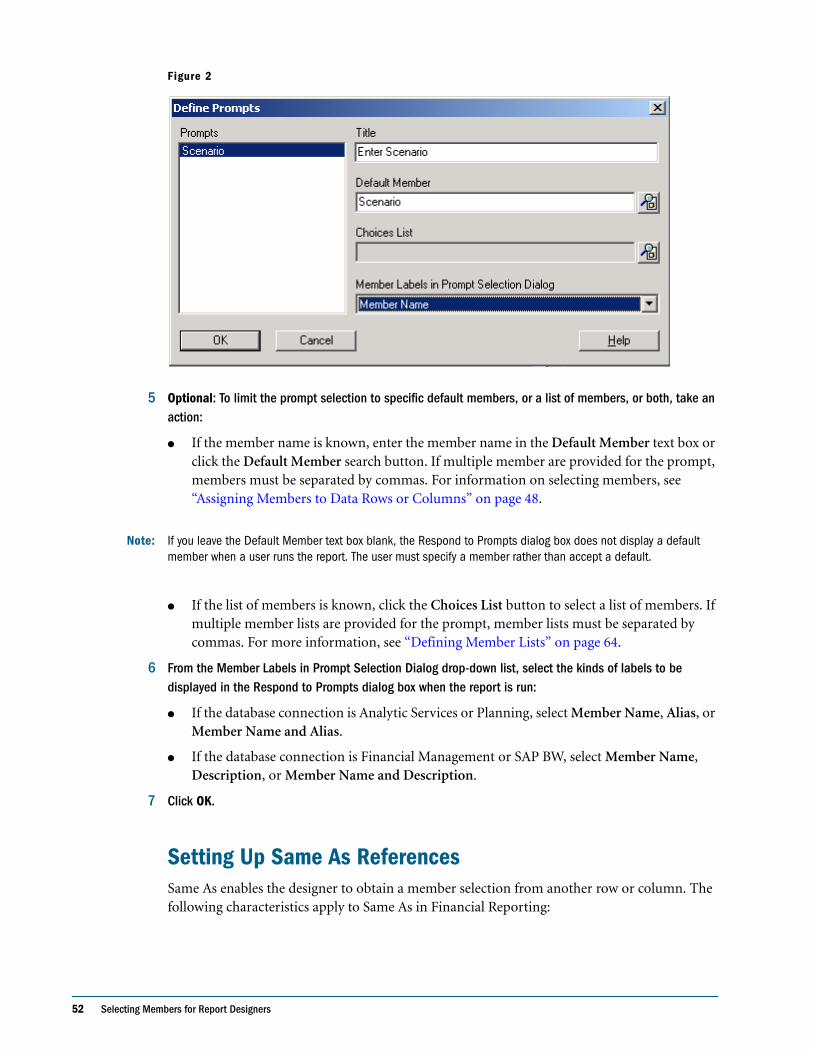
52 Selecting Members for Report Designers
Figure 2
5 Optional: To limit the prompt selection to specific default members, or a list of members, or both, take an action:
● If the member name is known, enter the member name in the Default Member text box or click the Default Member search button. If multiple member are provided for the prompt, members must be separated by commas. For information on selecting members, see “Assigning Members to Data Rows or Columns” on page 48.
Note: If you leave the Default Member text box blank, the Respond to Prompts dialog box does not display a default member when a user runs the report. The user must specify a member rather than accept a default.
● If the list of members is known, click the Choices List button to select a list of members. If multiple member lists are provided for the prompt, member lists must be separated by commas. For more information, see “Defining Member Lists” on page 64.
6 From the Member Labels in Prompt Selection Dialog drop-down list, select the kinds of labels to be displayed in the Respond to Prompts dialog box when the report is run:
● If the database connection is Analytic Services or Planning, select Member Name, Alias, or Member Name and Alias.
● If the database connection is Financial Management or SAP BW, select Member Name, Description, or Member Name and Description.
7 Click OK.
Setting Up Same As ReferencesSame As enables the designer to obtain a member selection from another row or column. The following characteristics apply to Same As in Financial Reporting:
Assigning Special Members 53
● In a report, members referred to by Same As are always from the same dimension, same type of database connection, and same grid.
● Members referred to by Same As are only available for member selections on rows and columns in a grid. Same As cannot be used as member selection in:
❍ Page Axis
❍ Grid POV
❍ User POV
❍ Book POV
❍ Batches POV
❍ Default member selection for a prompt
❍ A response to a prompt
❍ Member function member parameter, such as range
❍ Member selection in the book editor
● Same As can reference a row or column that gets its member selection from a prompt or Current POV.
● Same As cannot reference another Same As reference.
● Same As is not supported within row and column templates.
● Same As must be used alone and cannot be combined with any other member selections.
➤ To set up Same As:
1 Open a report and double-click a member selection for which you want to set up Same As.
2 On the Members tab, expand Same As Member Selections and select Same As...for the row or column for
the dimension, then click the Add button, , to add the Same As for the dimension to the Selected area.
3 Click OK.
Setting Up a Current Point of ViewA current POV enables the designer to obtain a member for a row, column, or page from the user POV.
➤ To set up a current POV:
1 Open a report and double-click a member selection for which you want to set up a current POV.
2 On the Members tab, select Current Point of View for the dimension, then click the Add button, , to add the Current Point of View for the dimension to the Selected area.
3 Click OK.
54 Selecting Members for Report Designers
Selecting the User Point of View as a Member in the Book Point of ViewWhen a report is added to a book, the dimensions that are on the user POV in the report definitions are applied to the book POV. Members on the book POV default to the user POV in the Book Editor.
➤ To select the user POV as a member in the book POV:
1 Select File > Repository.
Tip: You can filter the repository by selecting View > Display Items of Type and then selecting Book.
2 Double-click a book. The book is opened in the Book Editor.
3 In the book POV, double-click a dimension for which you want to set up a user POV.
4 From the Select Members dialog box, select the User Point of View for the dimension.
5 Click OK.
Using Calculated and Restricted Key Figures
Assigning Members Using FunctionsYou can use functions to select members dynamically. After you select a function, you can edit its parameters. For more information on the dynamic use of functions, see “Using the Formula Bar” on page 148. For more information on editing function parameters, see “Editing Functions” on page 61.
Table 17 and Table 18 describe the functions used to assign members.
Note: Except where noted, all functions listed are supported for Analytic Services and Planning Details. Functions with an ‘x’ in the Financial Management column are supported by Financial Management.
Table 17 Functions Available Through Member Selection and the Formula Bar
Function SyntaxFinancial Management Studio Description
Children Children of member (Inclusive) x The members one level below the specified parent
Descendants Descendants of member (Inclusive) x The members at all levels below the specified parent
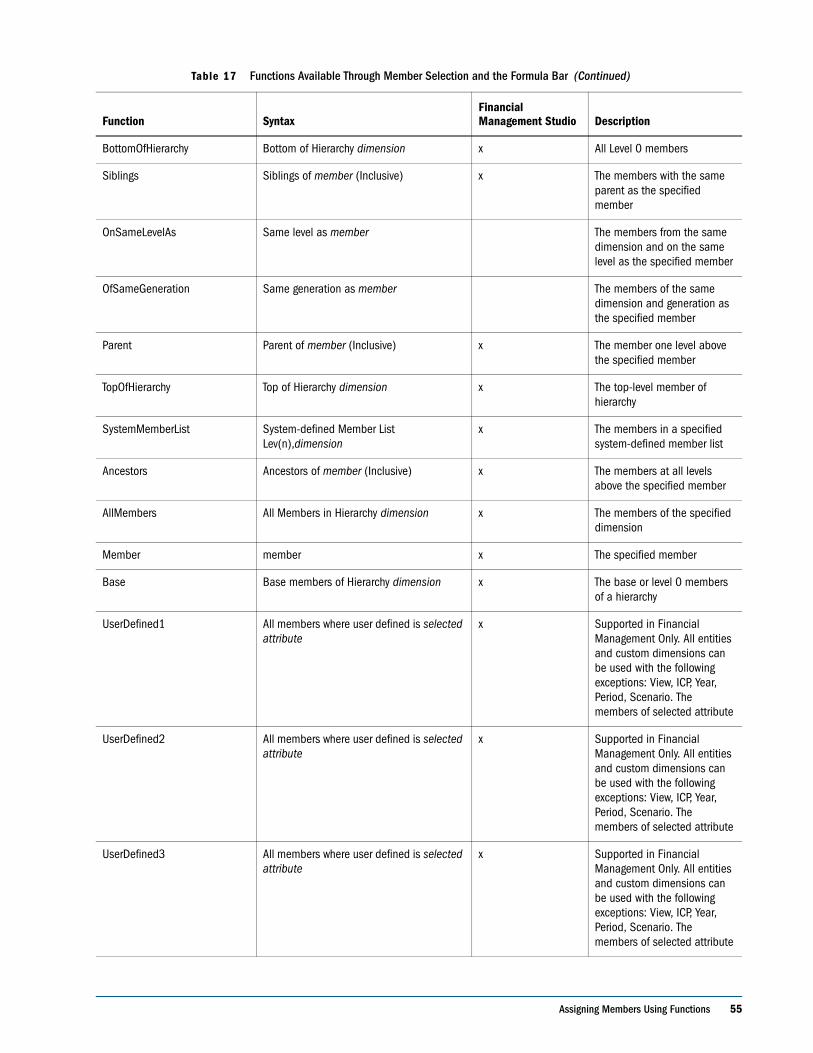
Assigning Members Using Functions 55
BottomOfHierarchy Bottom of Hierarchy dimension x All Level 0 members
Siblings Siblings of member (Inclusive) x The members with the same parent as the specified member
OnSameLevelAs Same level as member The members from the same dimension and on the same level as the specified member
OfSameGeneration Same generation as member The members of the same dimension and generation as the specified member
Parent Parent of member (Inclusive) x The member one level above the specified member
TopOfHierarchy Top of Hierarchy dimension x The top-level member of hierarchy
SystemMemberList System-defined Member List Lev(n),dimension
x The members in a specified system-defined member list
Ancestors Ancestors of member (Inclusive) x The members at all levels above the specified member
AllMembers All Members in Hierarchy dimension x The members of the specified dimension
Member member x The specified member
Base Base members of Hierarchy dimension x The base or level 0 members of a hierarchy
UserDefined1 All members where user defined is selected attribute
x Supported in Financial Management Only. All entities and custom dimensions can be used with the following exceptions: View, ICP, Year, Period, Scenario. The members of selected attribute
UserDefined2 All members where user defined is selected attribute
x Supported in Financial Management Only. All entities and custom dimensions can be used with the following exceptions: View, ICP, Year, Period, Scenario. The members of selected attribute
UserDefined3 All members where user defined is selected attribute
x Supported in Financial Management Only. All entities and custom dimensions can be used with the following exceptions: View, ICP, Year, Period, Scenario. The members of selected attribute
Table 17 Functions Available Through Member Selection and the Formula Bar (Continued)
Function SyntaxFinancial Management Studio Description
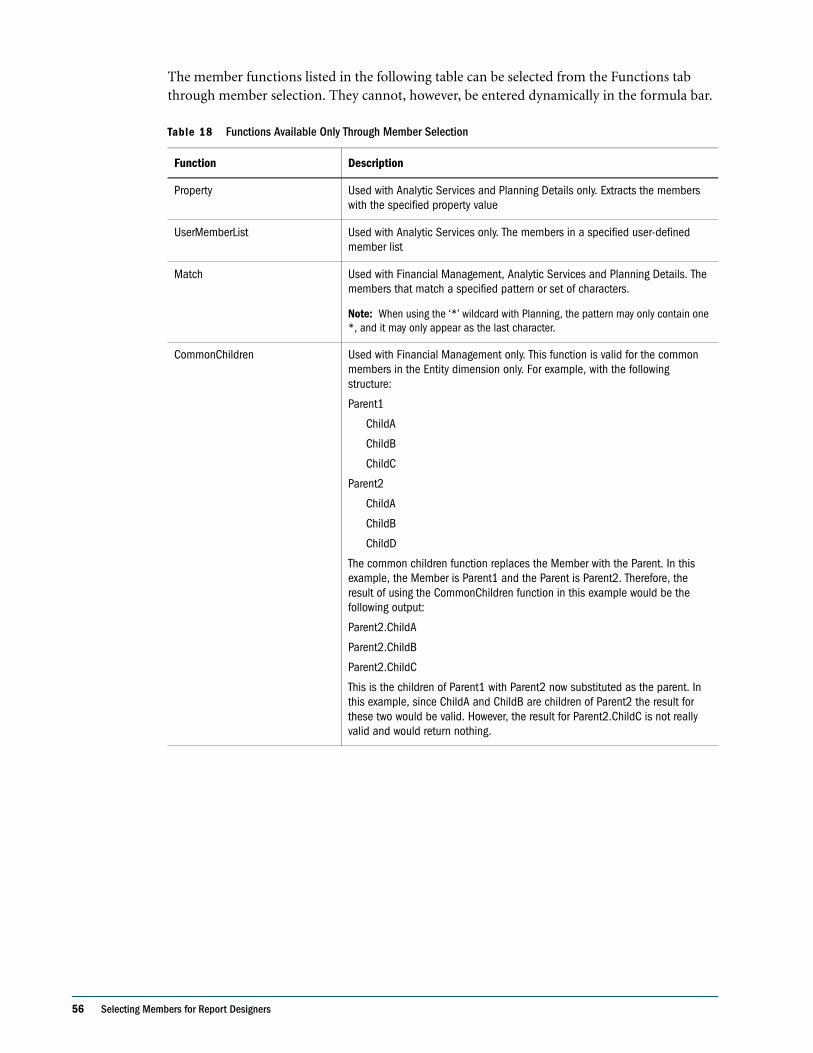
56 Selecting Members for Report Designers
The member functions listed in the following table can be selected from the Functions tab through member selection. They cannot, however, be entered dynamically in the formula bar.
Table 18 Functions Available Only Through Member Selection
Function Description
Property Used with Analytic Services and Planning Details only. Extracts the members with the specified property value
UserMemberList Used with Analytic Services only. The members in a specified user-defined member list
Match Used with Financial Management, Analytic Services and Planning Details. The members that match a specified pattern or set of characters.
Note: When using the ‘*’ wildcard with Planning, the pattern may only contain one *, and it may only appear as the last character.
CommonChildren Used with Financial Management only. This function is valid for the common members in the Entity dimension only. For example, with the following structure:
Parent1
ChildA
ChildB
ChildC
Parent2
ChildA
ChildB
ChildD
The common children function replaces the Member with the Parent. In this example, the Member is Parent1 and the Parent is Parent2. Therefore, the result of using the CommonChildren function in this example would be the following output:
Parent2.ChildA
Parent2.ChildB
Parent2.ChildC
This is the children of Parent1 with Parent2 now substituted as the parent. In this example, since ChildA and ChildB are children of Parent2 the result for these two would be valid. However, the result for Parent2.ChildC is not really valid and would return nothing.
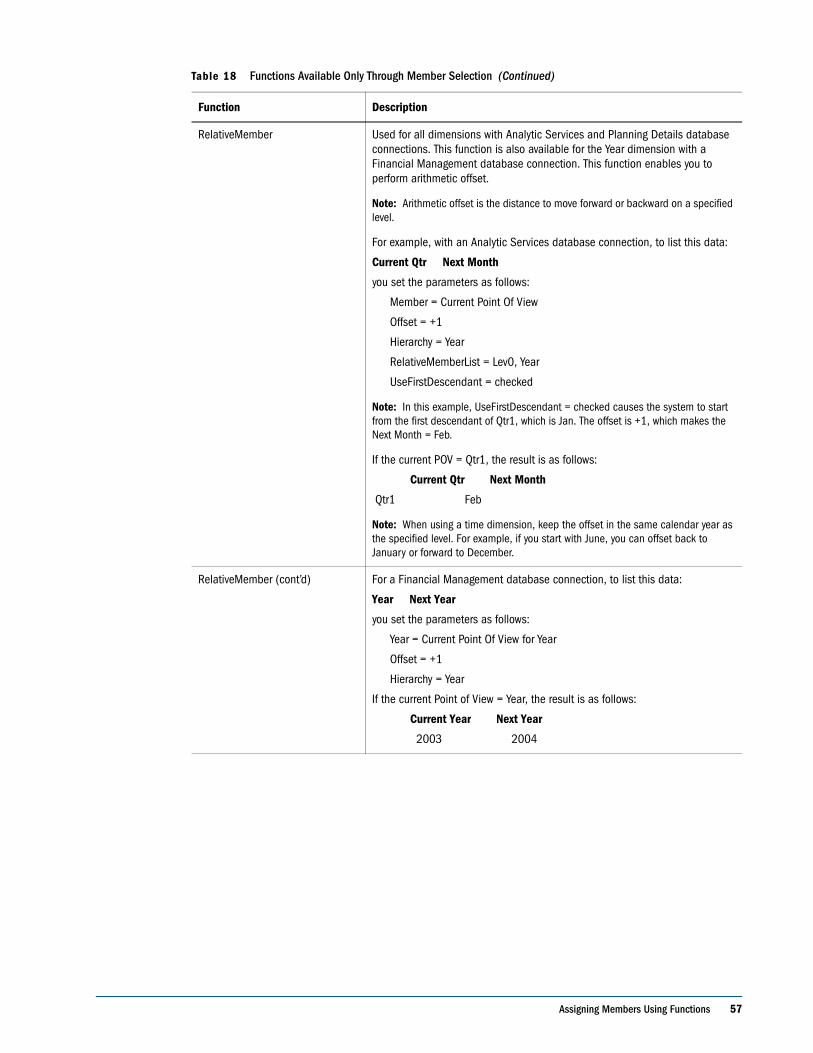
Assigning Members Using Functions 57
RelativeMember Used for all dimensions with Analytic Services and Planning Details database connections. This function is also available for the Year dimension with a Financial Management database connection. This function enables you to perform arithmetic offset.
Note: Arithmetic offset is the distance to move forward or backward on a specified level.
For example, with an Analytic Services database connection, to list this data:
Current Qtr Next Month
you set the parameters as follows:
Member = Current Point Of View
Offset = +1
Hierarchy = Year
RelativeMemberList = Lev0, Year
UseFirstDescendant = checked
Note: In this example, UseFirstDescendant = checked causes the system to start from the first descendant of Qtr1, which is Jan. The offset is +1, which makes the Next Month = Feb.
If the current POV = Qtr1, the result is as follows:
Current Qtr Next Month
Qtr1 Feb
Note: When using a time dimension, keep the offset in the same calendar year as the specified level. For example, if you start with June, you can offset back to January or forward to December.
RelativeMember (cont’d) For a Financial Management database connection, to list this data:
Year Next Year
you set the parameters as follows:
Year = Current Point Of View for Year
Offset = +1
Hierarchy = Year
If the current Point of View = Year, the result is as follows:
Current Year Next Year
2003 2004
Table 18 Functions Available Only Through Member Selection (Continued)
Function Description
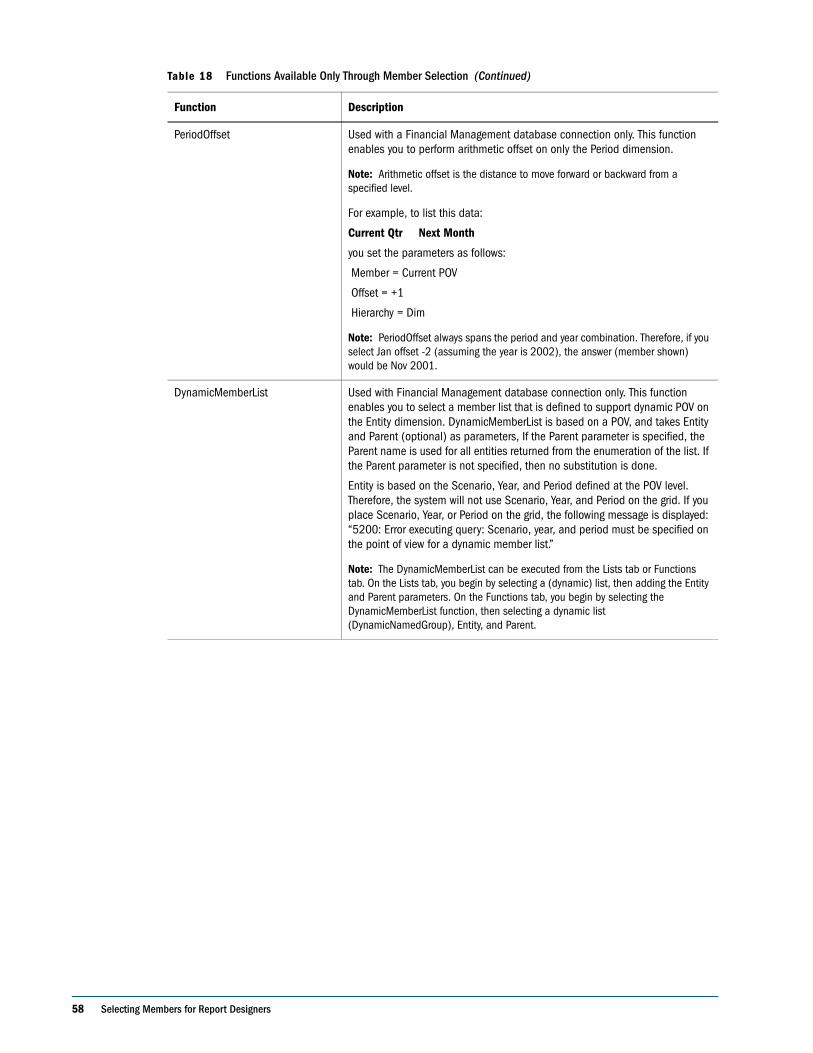
58 Selecting Members for Report Designers
PeriodOffset Used with a Financial Management database connection only. This function enables you to perform arithmetic offset on only the Period dimension.
Note: Arithmetic offset is the distance to move forward or backward from a specified level.
For example, to list this data:
Current Qtr Next Month
you set the parameters as follows:
Member = Current POV
Offset = +1
Hierarchy = Dim
Note: PeriodOffset always spans the period and year combination. Therefore, if you select Jan offset -2 (assuming the year is 2002), the answer (member shown) would be Nov 2001.
DynamicMemberList Used with Financial Management database connection only. This function enables you to select a member list that is defined to support dynamic POV on the Entity dimension. DynamicMemberList is based on a POV, and takes Entity and Parent (optional) as parameters, If the Parent parameter is specified, the Parent name is used for all entities returned from the enumeration of the list. If the Parent parameter is not specified, then no substitution is done.
Entity is based on the Scenario, Year, and Period defined at the POV level. Therefore, the system will not use Scenario, Year, and Period on the grid. If you place Scenario, Year, or Period on the grid, the following message is displayed: “5200: Error executing query: Scenario, year, and period must be specified on the point of view for a dynamic member list.”
Note: The DynamicMemberList can be executed from the Lists tab or Functions tab. On the Lists tab, you begin by selecting a (dynamic) list, then adding the Entity and Parent parameters. On the Functions tab, you begin by selecting the DynamicMemberList function, then selecting a dynamic list (DynamicNamedGroup), Entity, and Parent.
Table 18 Functions Available Only Through Member Selection (Continued)
Function Description
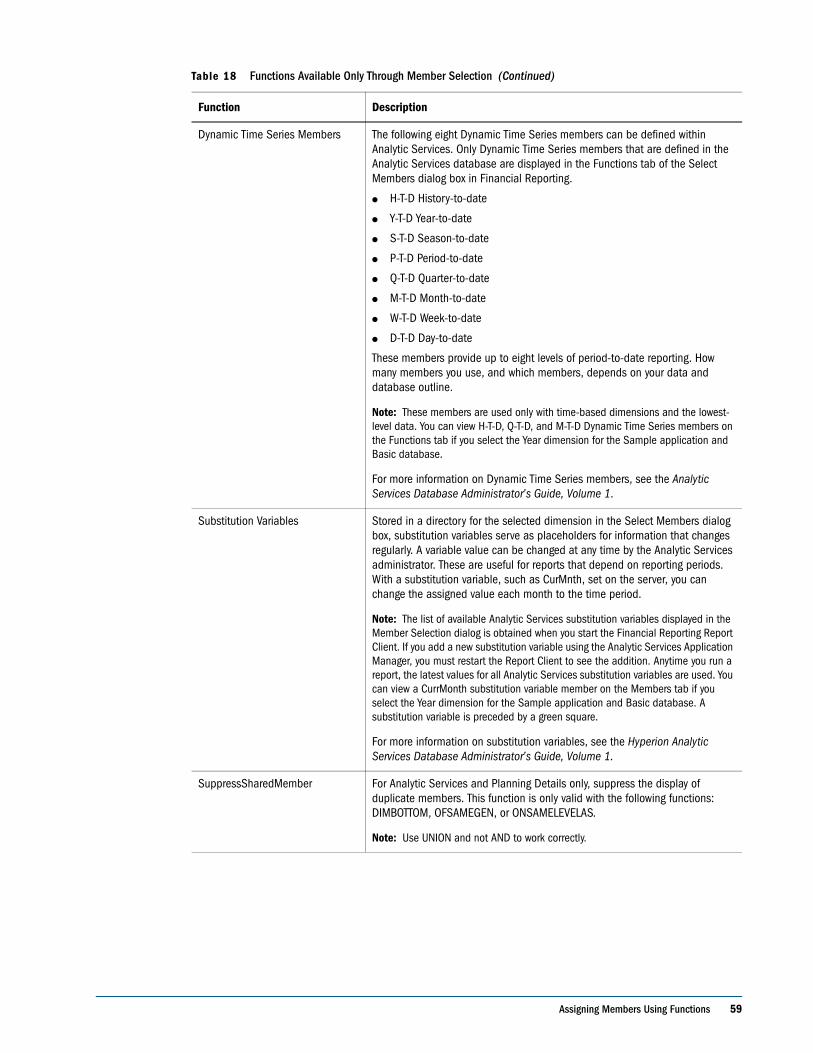
Assigning Members Using Functions 59
Dynamic Time Series Members The following eight Dynamic Time Series members can be defined within Analytic Services. Only Dynamic Time Series members that are defined in the Analytic Services database are displayed in the Functions tab of the Select Members dialog box in Financial Reporting.
● H-T-D History-to-date
● Y-T-D Year-to-date
● S-T-D Season-to-date
● P-T-D Period-to-date
● Q-T-D Quarter-to-date
● M-T-D Month-to-date
● W-T-D Week-to-date
● D-T-D Day-to-date
These members provide up to eight levels of period-to-date reporting. How many members you use, and which members, depends on your data and database outline.
Note: These members are used only with time-based dimensions and the lowest-level data. You can view H-T-D, Q-T-D, and M-T-D Dynamic Time Series members on the Functions tab if you select the Year dimension for the Sample application and Basic database.
For more information on Dynamic Time Series members, see the Analytic Services Database Administrator’s Guide, Volume 1.
Substitution Variables Stored in a directory for the selected dimension in the Select Members dialog box, substitution variables serve as placeholders for information that changes regularly. A variable value can be changed at any time by the Analytic Services administrator. These are useful for reports that depend on reporting periods. With a substitution variable, such as CurMnth, set on the server, you can change the assigned value each month to the time period.
Note: The list of available Analytic Services substitution variables displayed in the Member Selection dialog is obtained when you start the Financial Reporting Report Client. If you add a new substitution variable using the Analytic Services Application Manager, you must restart the Report Client to see the addition. Anytime you run a report, the latest values for all Analytic Services substitution variables are used. You can view a CurrMonth substitution variable member on the Members tab if you select the Year dimension for the Sample application and Basic database. A substitution variable is preceded by a green square.
For more information on substitution variables, see the Hyperion Analytic Services Database Administrator’s Guide, Volume 1.
SuppressSharedMember For Analytic Services and Planning Details only, suppress the display of duplicate members. This function is only valid with the following functions: DIMBOTTOM, OFSAMEGEN, or ONSAMELEVELAS.
Note: Use UNION and not AND to work correctly.
Table 18 Functions Available Only Through Member Selection (Continued)
Function Description
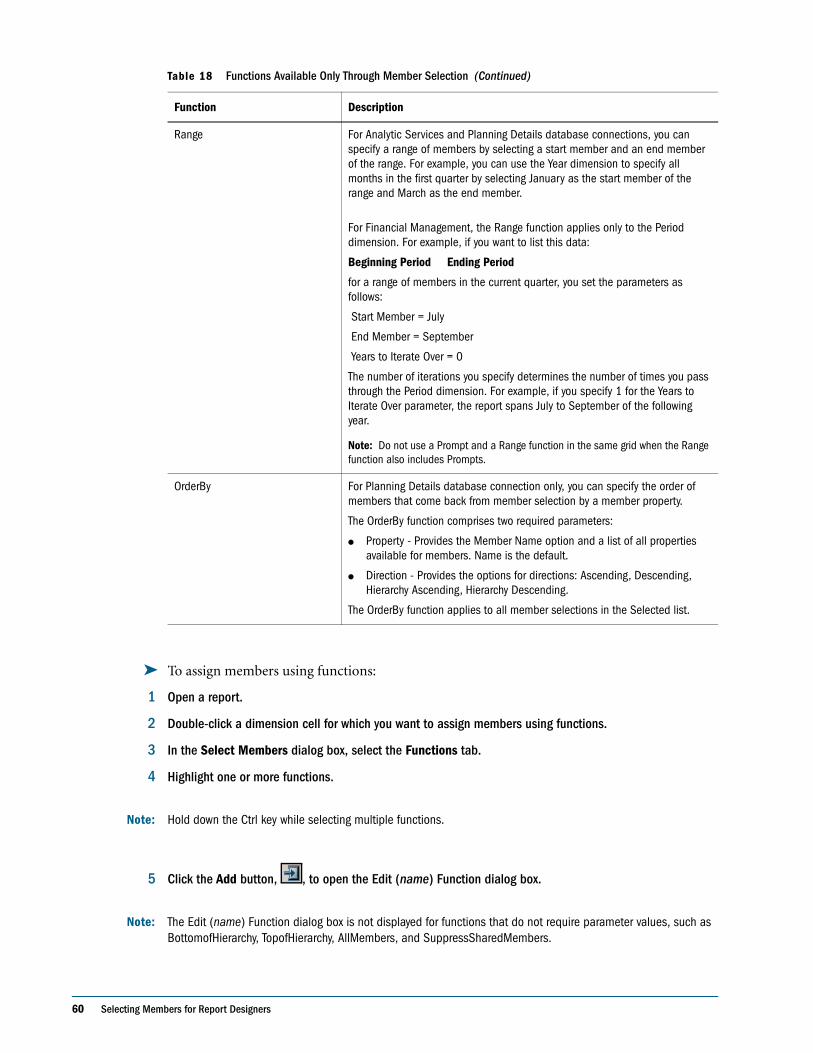
60 Selecting Members for Report Designers
➤ To assign members using functions:
1 Open a report.
2 Double-click a dimension cell for which you want to assign members using functions.
3 In the Select Members dialog box, select the Functions tab.
4 Highlight one or more functions.
Note: Hold down the Ctrl key while selecting multiple functions.
5 Click the Add button, , to open the Edit (name) Function dialog box.
Note: The Edit (name) Function dialog box is not displayed for functions that do not require parameter values, such as BottomofHierarchy, TopofHierarchy, AllMembers, and SuppressSharedMembers.
Range For Analytic Services and Planning Details database connections, you can specify a range of members by selecting a start member and an end member of the range. For example, you can use the Year dimension to specify all months in the first quarter by selecting January as the start member of the range and March as the end member.
For Financial Management, the Range function applies only to the Period dimension. For example, if you want to list this data:
Beginning Period Ending Period
for a range of members in the current quarter, you set the parameters as follows:
Start Member = July
End Member = September
Years to Iterate Over = 0
The number of iterations you specify determines the number of times you pass through the Period dimension. For example, if you specify 1 for the Years to Iterate Over parameter, the report spans July to September of the following year.
Note: Do not use a Prompt and a Range function in the same grid when the Range function also includes Prompts.
OrderBy For Planning Details database connection only, you can specify the order of members that come back from member selection by a member property.
The OrderBy function comprises two required parameters:
● Property - Provides the Member Name option and a list of all properties available for members. Name is the default.
● Direction - Provides the options for directions: Ascending, Descending, Hierarchy Ascending, Hierarchy Descending.
The OrderBy function applies to all member selections in the Selected list.
Table 18 Functions Available Only Through Member Selection (Continued)
Function Description
Copying Members Between Applications 61
6 Double-click the Value column inside row 1, then edit its value by clicking the Lookup button.
Tip: You can resize the columns using the arrows that appear when you hover the cursor over the column dividers that display between categories.
7 Repeat steps step 2 through step 6 to edit the remaining rows.
8 Click OK.
9 Click OK to return to your report.
Editing FunctionsYou can edit a function by changing its parameter values. For example, you can specify that a function include or exclude a specified member, or you can change the hierarchy value of a function.
➤ To edit a function:
1 Open a report and select the data row or column or a data row or column heading cell in which you want to edit a function.
2 In the Selected area of the Select Members dialog box, double-click the function to edit.
3 Double-click the Value column inside row 1, then edit its value by clicking the Lookup button.
4 Repeat step 1 through step 3 to edit the remaining rows.
5 Click OK.
6 Click OK to return to your report.
Copying Members Between ApplicationsYou can take any valid members from an application, such as an Excel spreadsheet, and paste them as new members in the corresponding dimension of another application. For example, suppose you have the following members in Excel for the Year dimension: Jan, Feb, Mar, Apr, May, Jun, July, Aug, Sep, Oct, Nov, Dec. You can copy those members to a grid that contains the Year dimension. If you paste members into a row or column that contains a secondary database connection, the type of database connection is carried over with the members.
➤ To copy members between applications:
1 Open an application containing the members you want copied to a report.
2 Copy the members to use with Financial Reporting.
3 Switch to Financial Reporting.
4 Select File > Open.
62 Selecting Members for Report Designers
5 Open a report.
6 Select a cell in a grid that contains the dimension to which you want to copy members.
7 In the formula bar, right-click inside the text box, then select Edit > Paste.
8 Edit the text in the formula bar by adding commas between members.
9 Click to verify the member names.
Removing or Adding MembersYou can remove or add members from a dimension. Removing members changes the output of your report, giving you more control over its content.
➤ To remove or add members that are contained in one cell:
1 Click the cell containing the members. The dimension name is displayed on the formula bar button; members are displayed in the text area of the formula bar.
2 In the formula bar, take an action:
● Double-click the dimension name that is displayed on the command button to display the Select Members dialog box.
❍ To remove one or more items from the Selected area, select the items, then click the
Remove button, .
❍ To remove all items, click .
● Edit the text area of the formula bar by removing or adding members. Separate members
with commas. Then click to verify the member names.
➤ To remove members that are in separate rows or columns:
1 Select the row or column.
2 Right-click the row or column, then select Delete.
Selecting Multiple Members Based on CriteriaYou can select members dynamically based on user-defined criteria. You define criteria by creating expressions of members, Boolean operations, and commands.
Boolean operators enable you to specify precise member combinations for the report, which is useful for dealing with large volumes of data. Use the AND, OR, UNION, and NOT Boolean operators, combined with expression commands, to refine your member selections.
Filtering the View of Members Based on Criteria 63
➤ To select multiple members based on criteria:
1 Open a report.
2 Double-click a dimension cell for which you want to assign members.
3 In the Select Members dialog box, right-click inside the Selected area, then click Advanced.
Note: At least two members must be displayed in the Selected area before you can create criteria.
4 Build expressions by using one or more of the following operators and symbols:
● Select NOT to add the Boolean operator NOT to the expression. NOT is the inverse of the selected condition.
● Type a left parenthesis, (, to add an opening character to the expression.
● Type a right parenthesis, ), to add a closing character to the expression.
● Click in the OPERATOR column, then select AND, OR, or UNION.
❍ When all conditions must be met, use the AND operator.
❍ When one condition of several must be met, use the OR operator.
❍ To combine the data, use the UNION operator.
Note: You must use two pairs of parentheses if you are using three members. For example, if you selected descendants of Market and you want to exclude East, West, and South, your advanced member selection query should be as follows: Descendants of Market AND NOT ( East AND NOT ( West AND NOT SOUTH ))
5 Click OK to return to your report.
Filtering the View of Members Based on CriteriaYou define filters to view only members that meet your criteria. You can then select from the filtered list for your report. For example, you can display Regions in the United States division only. Filters are useful for reducing the number of members that are displayed.
For an SAP BW data source, your filtering criteria can include display attributes, which provide descriptive information about a dimensions, levels, or members. Filtering criteria can use wildcards and the Contains, Starts with, Ends with, and Is Null operators as well as the equal sign ( = ), less-than ( < ), an greater-than ( > ) operators.
➤ To define filters:
1 Open a report.
2 Double-click a dimension cell for which you want to edit a member.
64 Selecting Members for Report Designers
The Select members dialog box is displayed.
3 Right-click inside the Available area and name one of the following selections:
● Select Filter > Custom, highlight the lists or available functions, then click the Add button,
, to move them to the Selected area.
● Select Filter > Predefined, then highlight the desired list.
4 Click OK.
5 Click OK to return to your report.
Defining Member ListsMember lists are user-defined saved queries or system-defined lists of members. System-defined lists are typically created by the database administrator. Member lists can include members, other member lists, and functions.
Note: User-defined lists can be created only with Analytic Services as a database connection. The size of a member list cannot exceed 4K.
➤ To define a member list:
1 Open a report.
2 Double-click a dimension cell for which you want to assign a member.
3 In the Select Members dialog box, take an action:
● In the Members tab, highlight the members to include in the member list, right-click inside the Available area, then click Save Highlighted.
● In the Lists tab, right-click inside the Available area, then click Create.
4 From the Available area of the Create (dimension) List dialog box, select the members, member lists, and
functions to include in the member list and move them to the Selected area using the Add button, , or
Add Relationship button, .
5 Optional: To edit a function, use the procedure described in “Editing Functions” on page 61.
6 Click OK.
7 Enter a name and description for the member list, then click OK.
Note: Do not use quotation marks ( “ ) when entering a member list. If you do, Financial Reporting saves the name with the quotation marks, but you cannot select the name later.
8 Click OK to return to your report.
Searching for Members 65
Editing Member ListsYou can edit user-defined member lists. For example, you can add or remove members or functions from a member list.
➤ To edit a member list:
1 Open a report.
2 Double-click a dimension cell for which you want to edit a member list.
3 In the Select Members dialog box, select the Lists tab.
4 Double-click the user-defined member list to edit.
5 In the Edit...List dialog box, take an action:
● To add members to the Selected list, highlight the items in the Members, Lists, or
Functions tabs, then click the Add button, , or Add Relationship button, .
● To remove members from the list, highlight the members in the Selected area, then click
the Remove button, .
● To remove all items, click the Remove All button, .
6 Click OK.
7 Click OK to return to your report.
Searching for MembersYou can perform searches for members to edit. You can search using a text string or by property (that is, name and description). You can also use a blank space as a separator to perform simultaneous searches. If you enclose a string of characters in quotation marks, the system searches for an exact match, including the blank spaces between the characters.
The system saves the previous 25 search criteria strings. If you are searching for a list or function you must activate this function by using the Find Next or Find Previous button.
Note: For Financial Management, when you search for an entity, you must search on parent.entity (for example. D62VIELO.D62475LO). When you search just the entity, you must precede the entity with a wildcard, (for example, *D62475LO).
The following table shows the options used to find members:
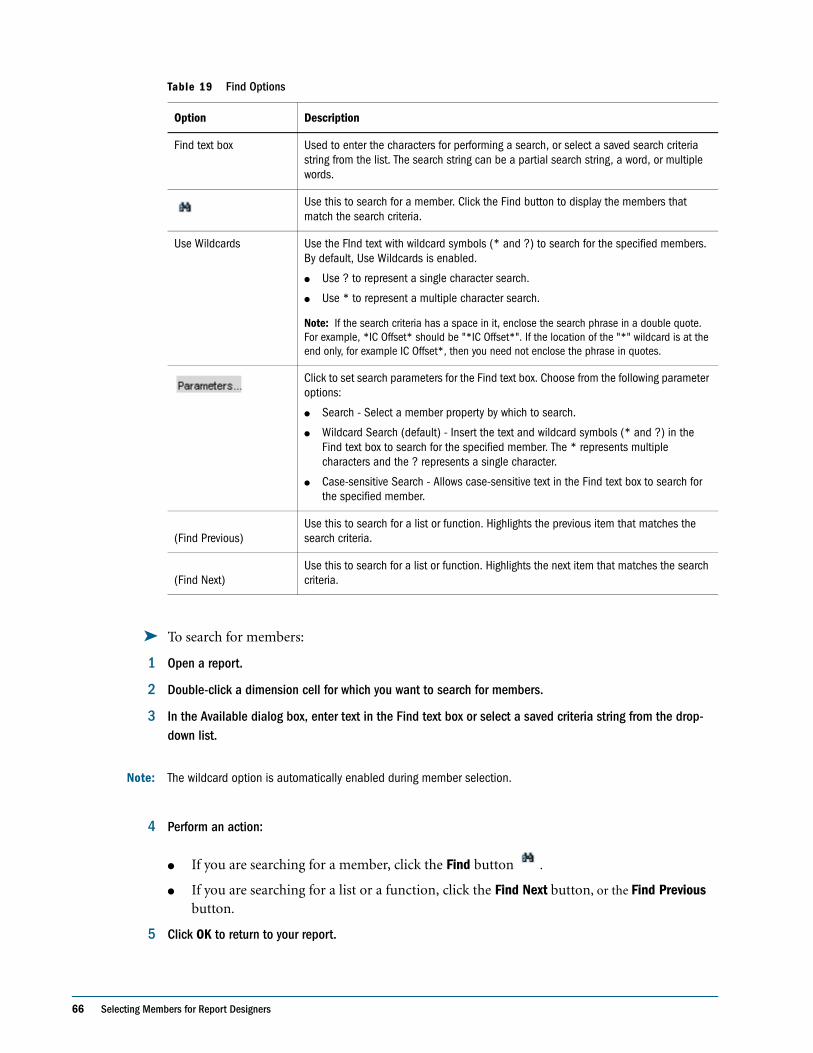
66 Selecting Members for Report Designers
➤ To search for members:
1 Open a report.
2 Double-click a dimension cell for which you want to search for members.
3 In the Available dialog box, enter text in the Find text box or select a saved criteria string from the drop-down list.
Note: The wildcard option is automatically enabled during member selection.
4 Perform an action:
● If you are searching for a member, click the Find button .
● If you are searching for a list or a function, click the Find Next button, or the Find Previous button.
5 Click OK to return to your report.
Table 19 Find Options
Option Description
Find text box Used to enter the characters for performing a search, or select a saved search criteria string from the list. The search string can be a partial search string, a word, or multiple words.
Use this to search for a member. Click the Find button to display the members that match the search criteria.
Use Wildcards Use the FInd text with wildcard symbols (* and ?) to search for the specified members. By default, Use Wildcards is enabled.
● Use ? to represent a single character search.
● Use * to represent a multiple character search.
Note: If the search criteria has a space in it, enclose the search phrase in a double quote. For example, *IC Offset* should be "*IC Offset*". If the location of the "*" wildcard is at the end only, for example IC Offset*, then you need not enclose the phrase in quotes.
Click to set search parameters for the Find text box. Choose from the following parameter options:
● Search - Select a member property by which to search.
● Wildcard Search (default) - Insert the text and wildcard symbols (* and ?) in the Find text box to search for the specified member. The * represents multiple characters and the ? represents a single character.
● Case-sensitive Search - Allows case-sensitive text in the Find text box to search for the specified member.
(Find Previous)
Use this to search for a list or function. Highlights the previous item that matches the search criteria.
(Find Next)
Use this to search for a list or function. Highlights the next item that matches the search criteria.
Previewing Selected Members 67
Sorting MembersYou can sort members to facilitate viewing them within member selection. By default, the members are displayed in the sort order of the database connection.
You can sort selectable members in a preferred order, and you can sort the members that are selected to match the row or column order of data in your report. The order in which selected items are displayed in member selection is the order in which they are evaluated and displayed on the report.
You sort the members by property and display them in ascending or descending order. By default, the system sorts the list numerically, then alphabetically.
You can enable the system to sort the list whenever the view changes, or you can sort the list manually.
➤ To sort members manually:
1 Open a report.
2 Double-click a dimension cell for which you want to sort members.
3 In the Selected Members list, click View, then select Sort.
4 In the Sort (dimension) Items dialog box, select the property for the primary sort, then click . Optionally repeat this step to select a second and third sort method.
5 Click OK twice.
Previewing Selected MembersYou can preview the members or member lists selected for your report before you run it. The members that you view result from an evaluated member list or function.
➤ To preview members:
1 Open a report.
2 Double-click the cell for which you want to preview members.
3 In the Select Members dialog box, click the Selected area.
4 Click the View button, and select Preview.
5 The Preview (dimension) Items dialog box is displayed, listing the member selection for that selected cell.
6 Click OK to close the Preview (dimension) Items dialog box.
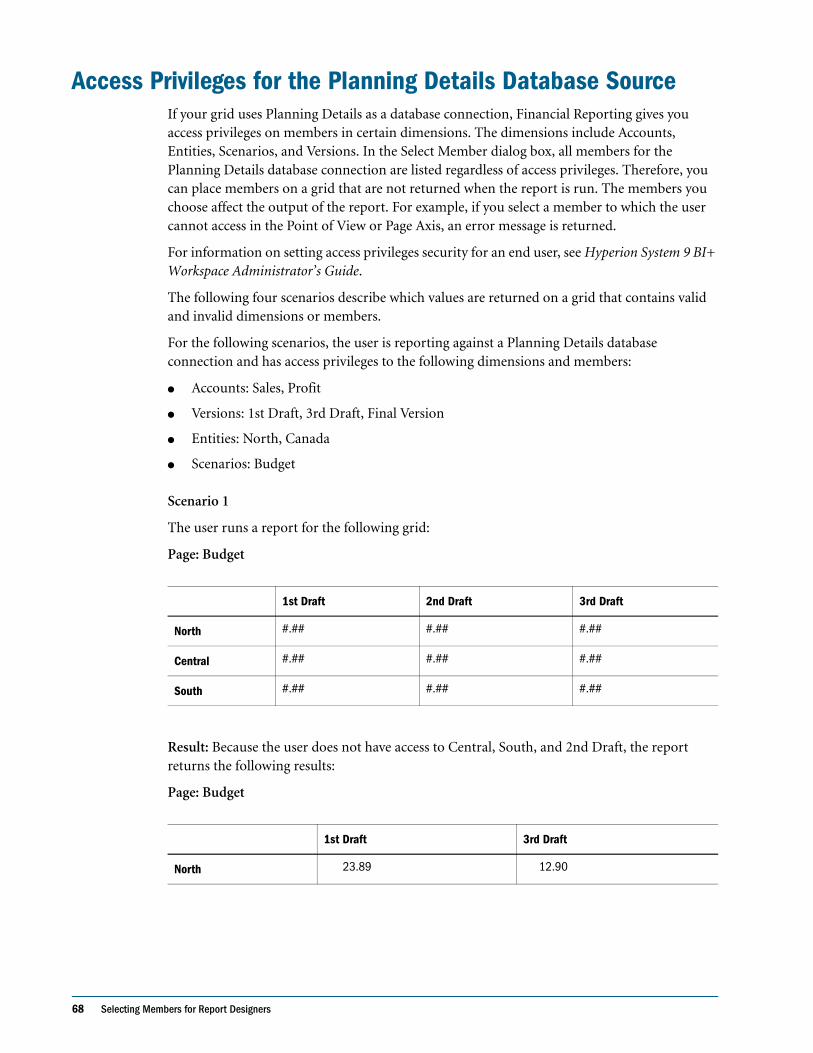
68 Selecting Members for Report Designers
Access Privileges for the Planning Details Database SourceIf your grid uses Planning Details as a database connection, Financial Reporting gives you access privileges on members in certain dimensions. The dimensions include Accounts, Entities, Scenarios, and Versions. In the Select Member dialog box, all members for the Planning Details database connection are listed regardless of access privileges. Therefore, you can place members on a grid that are not returned when the report is run. The members you choose affect the output of the report. For example, if you select a member to which the user cannot access in the Point of View or Page Axis, an error message is returned.
For information on setting access privileges security for an end user, see Hyperion System 9 BI+ Workspace Administrator’s Guide.
The following four scenarios describe which values are returned on a grid that contains valid and invalid dimensions or members.
For the following scenarios, the user is reporting against a Planning Details database connection and has access privileges to the following dimensions and members:
● Accounts: Sales, Profit
● Versions: 1st Draft, 3rd Draft, Final Version
● Entities: North, Canada
● Scenarios: Budget
Scenario 1
The user runs a report for the following grid:
Page: Budget
Result: Because the user does not have access to Central, South, and 2nd Draft, the report returns the following results:
Page: Budget
1st Draft 2nd Draft 3rd Draft
North #.## #.## #.##
Central #.## #.## #.##
South #.## #.## #.##
1st Draft 3rd Draft
North 23.89 12.90
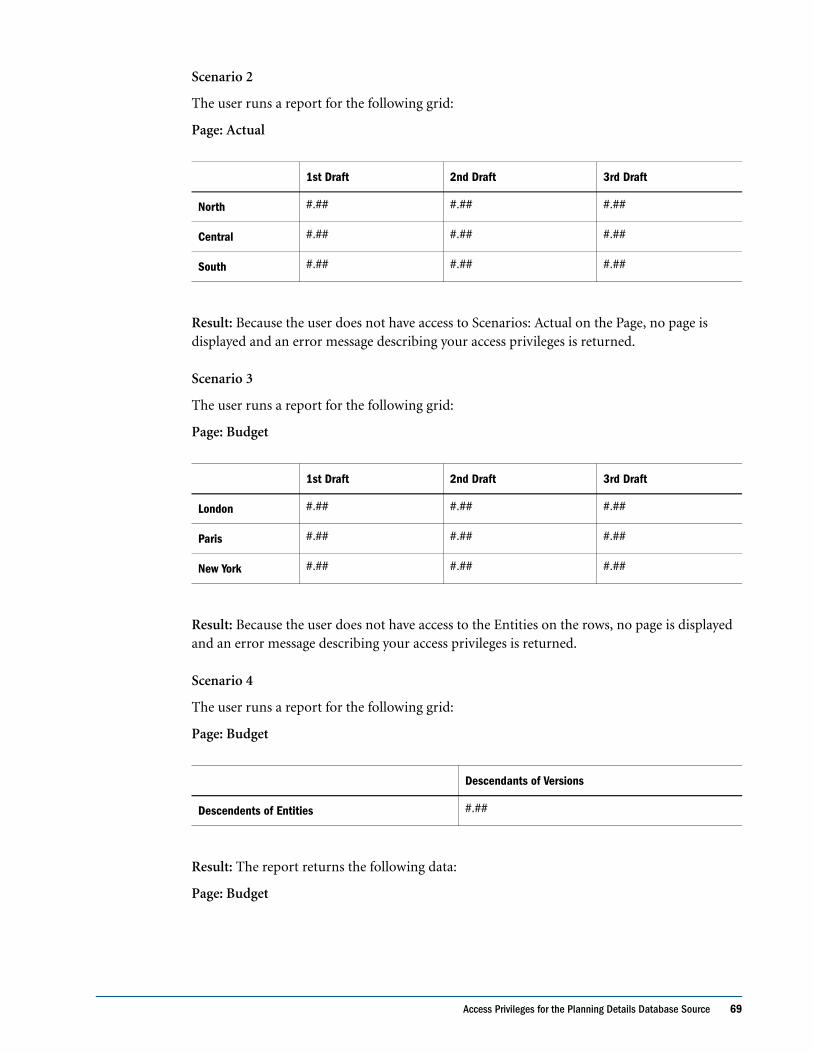
Access Privileges for the Planning Details Database Source 69
Scenario 2
The user runs a report for the following grid:
Page: Actual
Result: Because the user does not have access to Scenarios: Actual on the Page, no page is displayed and an error message describing your access privileges is returned.
Scenario 3
The user runs a report for the following grid:
Page: Budget
Result: Because the user does not have access to the Entities on the rows, no page is displayed and an error message describing your access privileges is returned.
Scenario 4
The user runs a report for the following grid:
Page: Budget
Result: The report returns the following data:
Page: Budget
1st Draft 2nd Draft 3rd Draft
North #.## #.## #.##
Central #.## #.## #.##
South #.## #.## #.##
1st Draft 2nd Draft 3rd Draft
London #.## #.## #.##
Paris #.## #.## #.##
New York #.## #.## #.##
Descendants of Versions
Descendents of Entities #.##
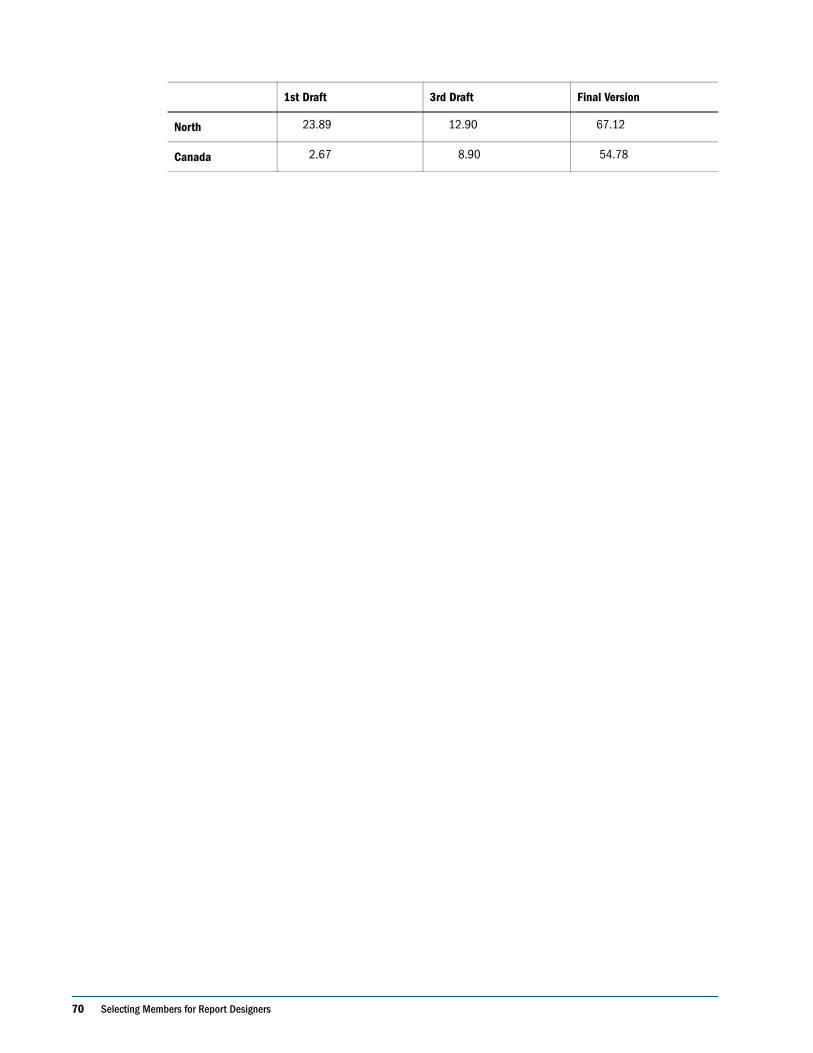
70 Selecting Members for Report Designers
1st Draft 3rd Draft Final Version
North 23.89 12.90 67.12
Canada 2.67 8.90 54.78
Customizing Charts 71
C h a p t e r
3Customizing Charts
This chapter describes the kinds of charts you can create and the ways in which you can format them. The following topics create the basic framework for customizing charts:
In This Chapter About Charts . . . . . . . . . . . . . . . . . . . . . . . . . . . . . . . . . . . . . . . . . . . . . . . . . . . . . . . . . . . . . . . . . . . . . . . . . . . . . 72
Formatting Charts . . . . . . . . . . . . . . . . . . . . . . . . . . . . . . . . . . . . . . . . . . . . . . . . . . . . . . . . . . . . . . . . . . . . . . . . . 75
Formatting Chart Titles and Labels . . . . . . . . . . . . . . . . . . . . . . . . . . . . . . . . . . . . . . . . . . . . . . . . . . . . . . . . . . . . . 88
A chart is a graphical representation of report data from a grid on a report. The chart retrieves data dynamically from the grid, so if data in the grid changes, the chart is updated automatically.
You can define and format the following components of a chart:
● Chart type and data content
● Chart attributes such as title, title angle, font angle, and background formatting
● Legend and axis information such as labels, font, background color, and orientation
● Formatting options specific to a chart type, such as bar width for a bar chart
● Horizontal and vertical positioning of a chart on a report
You can hide the controlling grid to display only the chart in your report. For more information, see “Hiding Rows, Columns, or Grids” on page 190.
For information about adding charts to your report, see “Inserting Charts” on page 103.
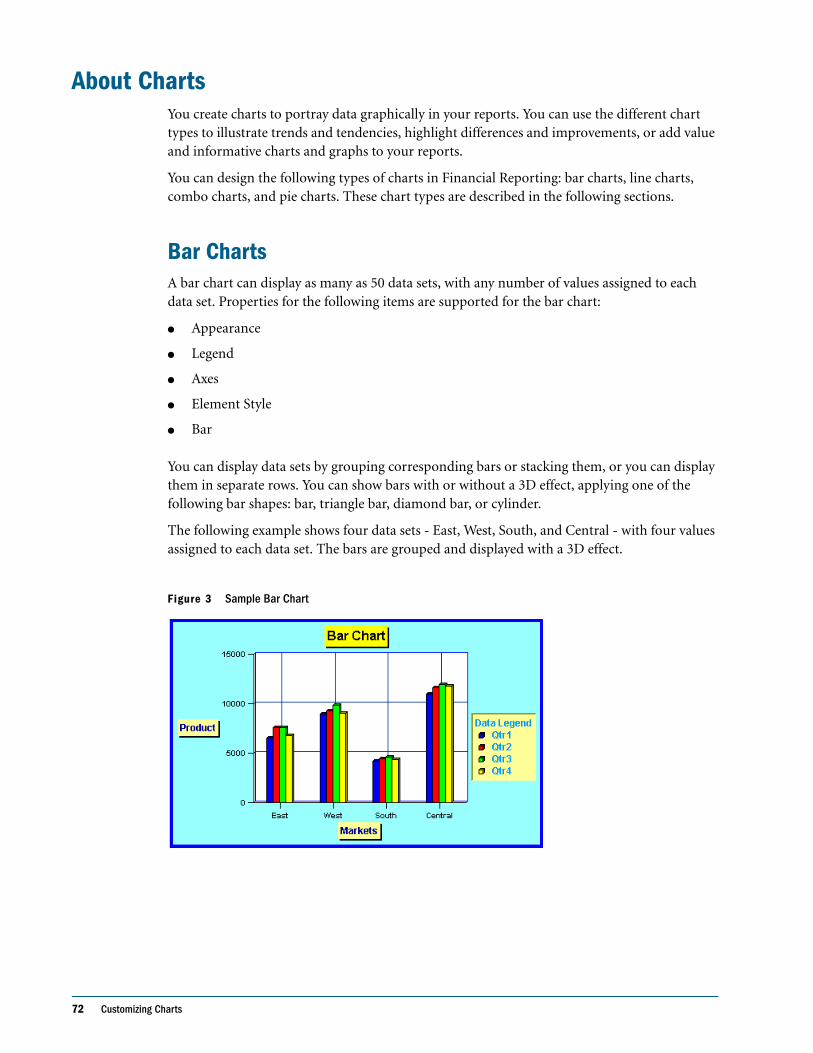
72 Customizing Charts
About ChartsYou create charts to portray data graphically in your reports. You can use the different chart types to illustrate trends and tendencies, highlight differences and improvements, or add value and informative charts and graphs to your reports.
You can design the following types of charts in Financial Reporting: bar charts, line charts, combo charts, and pie charts. These chart types are described in the following sections.
Bar ChartsA bar chart can display as many as 50 data sets, with any number of values assigned to each data set. Properties for the following items are supported for the bar chart:
● Appearance
● Legend
● Axes
● Element Style
● Bar
You can display data sets by grouping corresponding bars or stacking them, or you can display them in separate rows. You can show bars with or without a 3D effect, applying one of the following bar shapes: bar, triangle bar, diamond bar, or cylinder.
The following example shows four data sets - East, West, South, and Central - with four values assigned to each data set. The bars are grouped and displayed with a 3D effect.
Figure 3 Sample Bar Chart
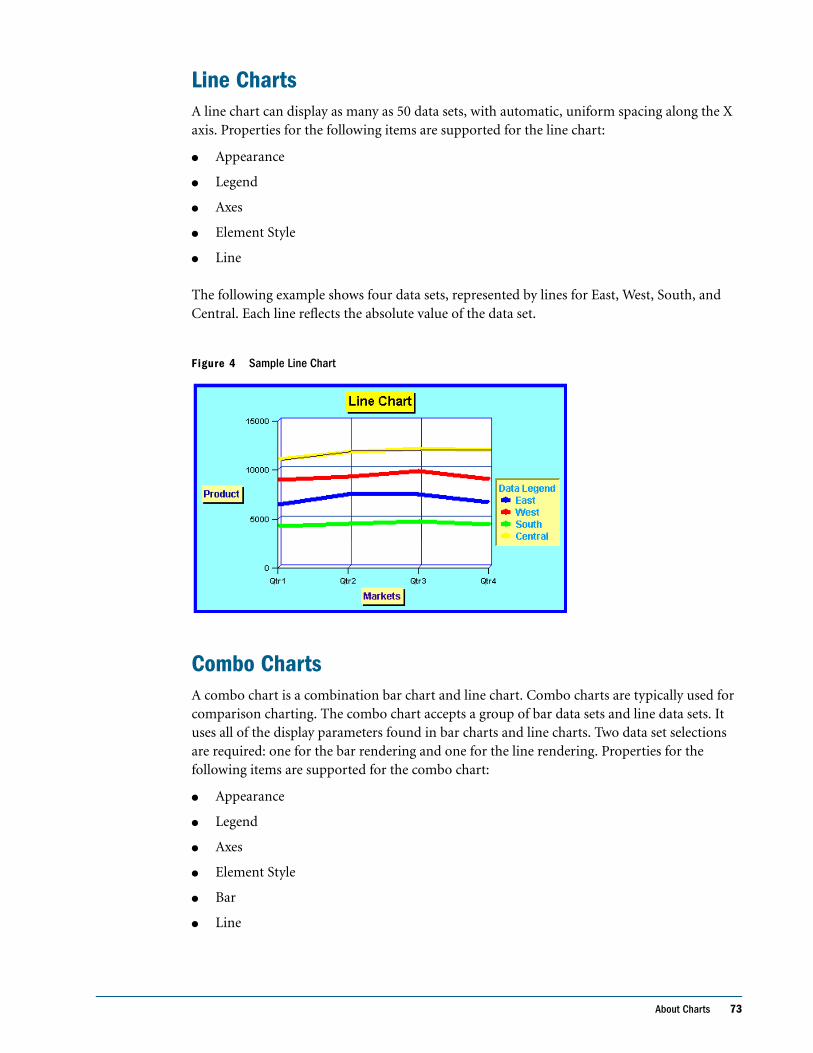
About Charts 73
Line ChartsA line chart can display as many as 50 data sets, with automatic, uniform spacing along the X axis. Properties for the following items are supported for the line chart:
● Appearance
● Legend
● Axes
● Element Style
● Line
The following example shows four data sets, represented by lines for East, West, South, and Central. Each line reflects the absolute value of the data set.
Figure 4 Sample Line Chart
Combo ChartsA combo chart is a combination bar chart and line chart. Combo charts are typically used for comparison charting. The combo chart accepts a group of bar data sets and line data sets. It uses all of the display parameters found in bar charts and line charts. Two data set selections are required: one for the bar rendering and one for the line rendering. Properties for the following items are supported for the combo chart:
● Appearance
● Legend
● Axes
● Element Style
● Bar
● Line
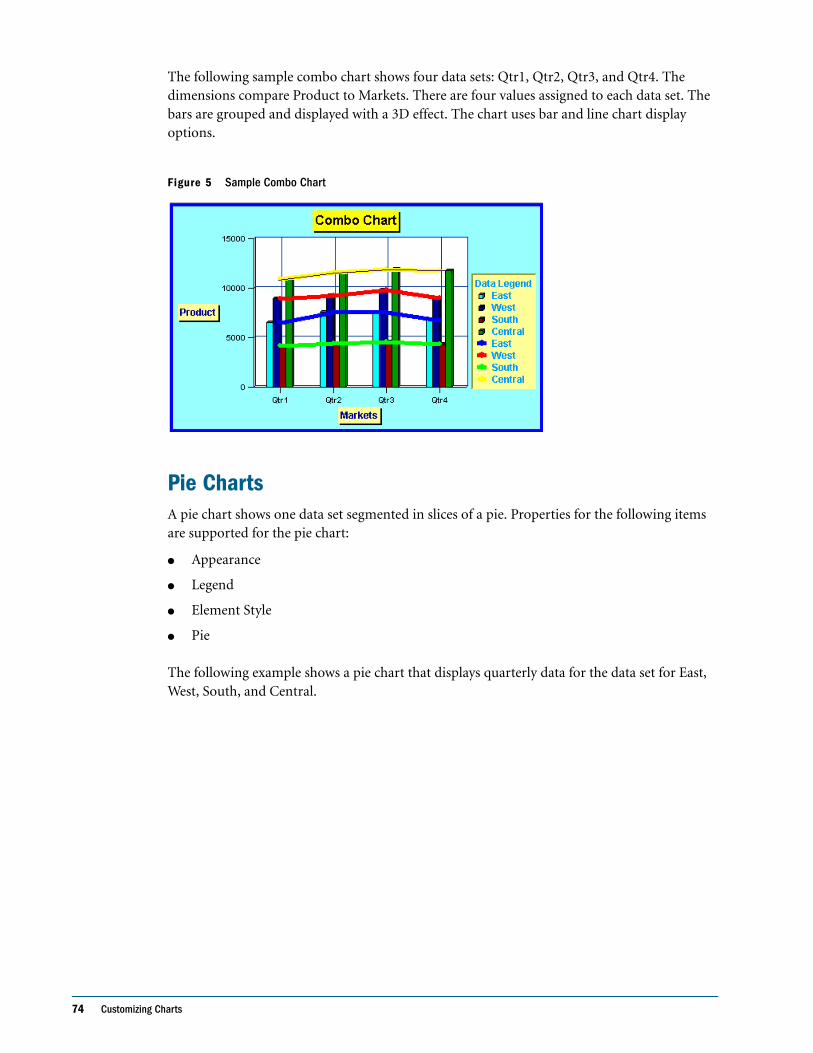
74 Customizing Charts
The following sample combo chart shows four data sets: Qtr1, Qtr2, Qtr3, and Qtr4. The dimensions compare Product to Markets. There are four values assigned to each data set. The bars are grouped and displayed with a 3D effect. The chart uses bar and line chart display options.
Figure 5 Sample Combo Chart
Pie ChartsA pie chart shows one data set segmented in slices of a pie. Properties for the following items are supported for the pie chart:
● Appearance
● Legend
● Element Style
● Pie
The following example shows a pie chart that displays quarterly data for the data set for East, West, South, and Central.
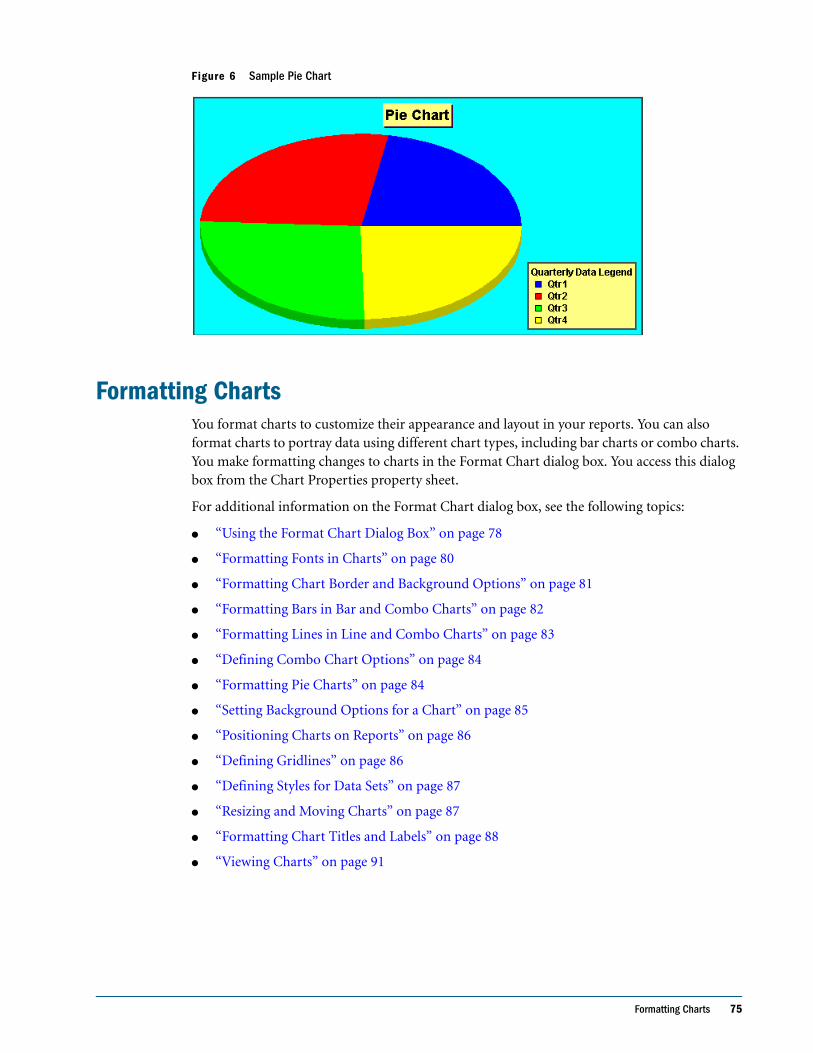
Formatting Charts 75
Figure 6 Sample Pie Chart
Formatting ChartsYou format charts to customize their appearance and layout in your reports. You can also format charts to portray data using different chart types, including bar charts or combo charts. You make formatting changes to charts in the Format Chart dialog box. You access this dialog box from the Chart Properties property sheet.
For additional information on the Format Chart dialog box, see the following topics:
● “Using the Format Chart Dialog Box” on page 78
● “Formatting Fonts in Charts” on page 80
● “Formatting Chart Border and Background Options” on page 81
● “Formatting Bars in Bar and Combo Charts” on page 82
● “Formatting Lines in Line and Combo Charts” on page 83
● “Defining Combo Chart Options” on page 84
● “Formatting Pie Charts” on page 84
● “Setting Background Options for a Chart” on page 85
● “Positioning Charts on Reports” on page 86
● “Defining Gridlines” on page 86
● “Defining Styles for Data Sets” on page 87
● “Resizing and Moving Charts” on page 87
● “Formatting Chart Titles and Labels” on page 88
● “Viewing Charts” on page 91
76 Customizing Charts
Defining Chart DataYou define chart data using the Chart Properties property sheet. You can identify, from the controlling grid, the rows and columns that contain the data to display. You can reference data or formula rows and columns from the controlling grid by selecting contiguous or non contiguous rows and columns for the data range. You can also include or exclude auto calculations from the data set.
If you are designing a line, bar, or combo chart, you can reference multiple rows or columns from the grid. If you are designing a pie chart, you can reference any single row or column from the grid. When you define a combo chart, you specify the data rows and columns for the bar and line.
➤ Charts display aggregate rows or aggregate columns that expand. For example, if you specify row 1 and row 1 contains a function that retrieves 10 child members, the chart displays 10 data sets, or one data set for each child member.
➤ To define chart data:
1 Open a report and create a grid and a chart.
2 On the Chart Properties property sheet, select the type of chart to design (bar, line, pie, or combo) from the Chart Type drop-down list. The following figure shows the options on the Chart Properties property sheet. For more information, see Appendix A, “Property Sheet Help.”
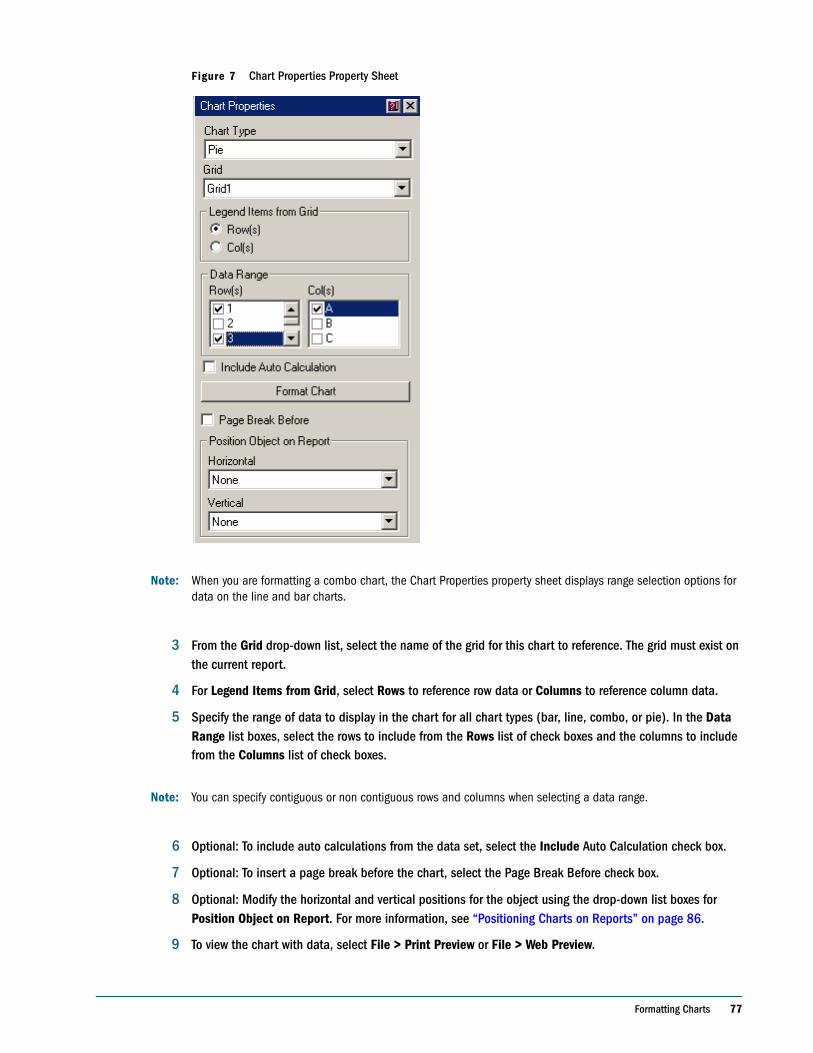
Formatting Charts 77
Figure 7 Chart Properties Property Sheet
Note: When you are formatting a combo chart, the Chart Properties property sheet displays range selection options for data on the line and bar charts.
3 From the Grid drop-down list, select the name of the grid for this chart to reference. The grid must exist on the current report.
4 For Legend Items from Grid, select Rows to reference row data or Columns to reference column data.
5 Specify the range of data to display in the chart for all chart types (bar, line, combo, or pie). In the Data Range list boxes, select the rows to include from the Rows list of check boxes and the columns to include from the Columns list of check boxes.
Note: You can specify contiguous or non contiguous rows and columns when selecting a data range.
6 Optional: To include auto calculations from the data set, select the Include Auto Calculation check box.
7 Optional: To insert a page break before the chart, select the Page Break Before check box.
8 Optional: Modify the horizontal and vertical positions for the object using the drop-down list boxes for Position Object on Report. For more information, see “Positioning Charts on Reports” on page 86.
9 To view the chart with data, select File > Print Preview or File > Web Preview.
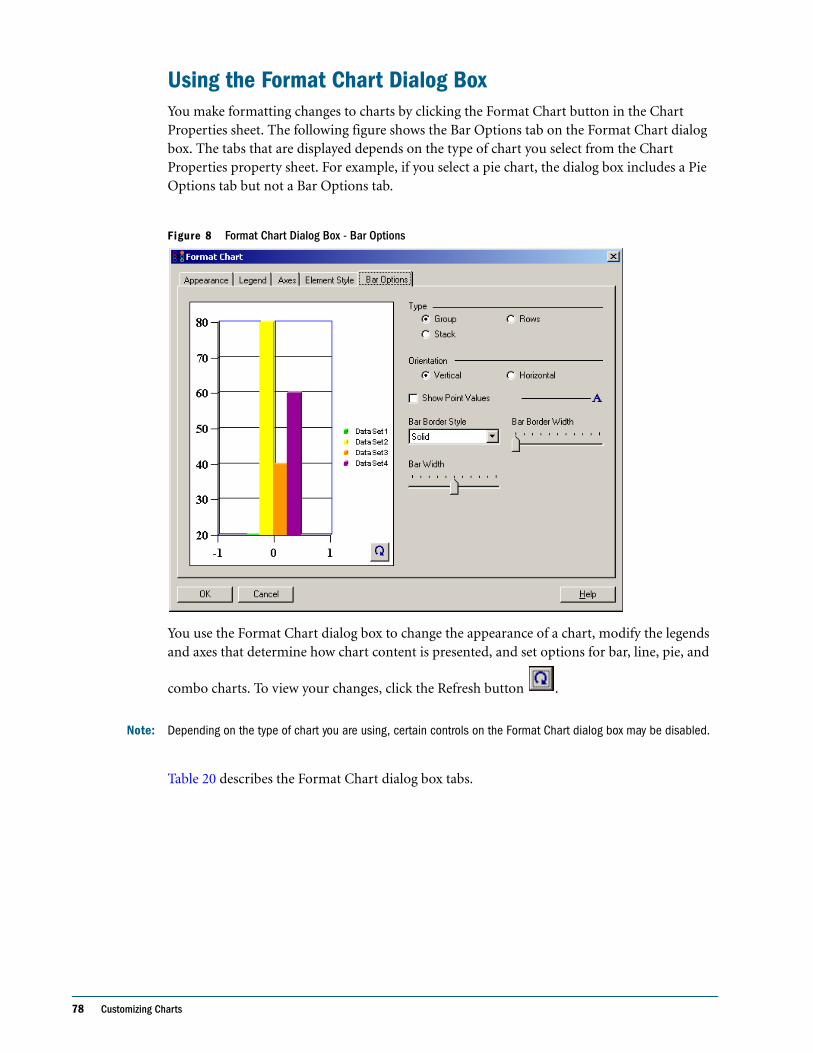
78 Customizing Charts
Using the Format Chart Dialog BoxYou make formatting changes to charts by clicking the Format Chart button in the Chart Properties sheet. The following figure shows the Bar Options tab on the Format Chart dialog box. The tabs that are displayed depends on the type of chart you select from the Chart Properties property sheet. For example, if you select a pie chart, the dialog box includes a Pie Options tab but not a Bar Options tab.
Figure 8 Format Chart Dialog Box - Bar Options
You use the Format Chart dialog box to change the appearance of a chart, modify the legends and axes that determine how chart content is presented, and set options for bar, line, pie, and
combo charts. To view your changes, click the Refresh button .
Note: Depending on the type of chart you are using, certain controls on the Format Chart dialog box may be disabled.
Table 20 describes the Format Chart dialog box tabs.
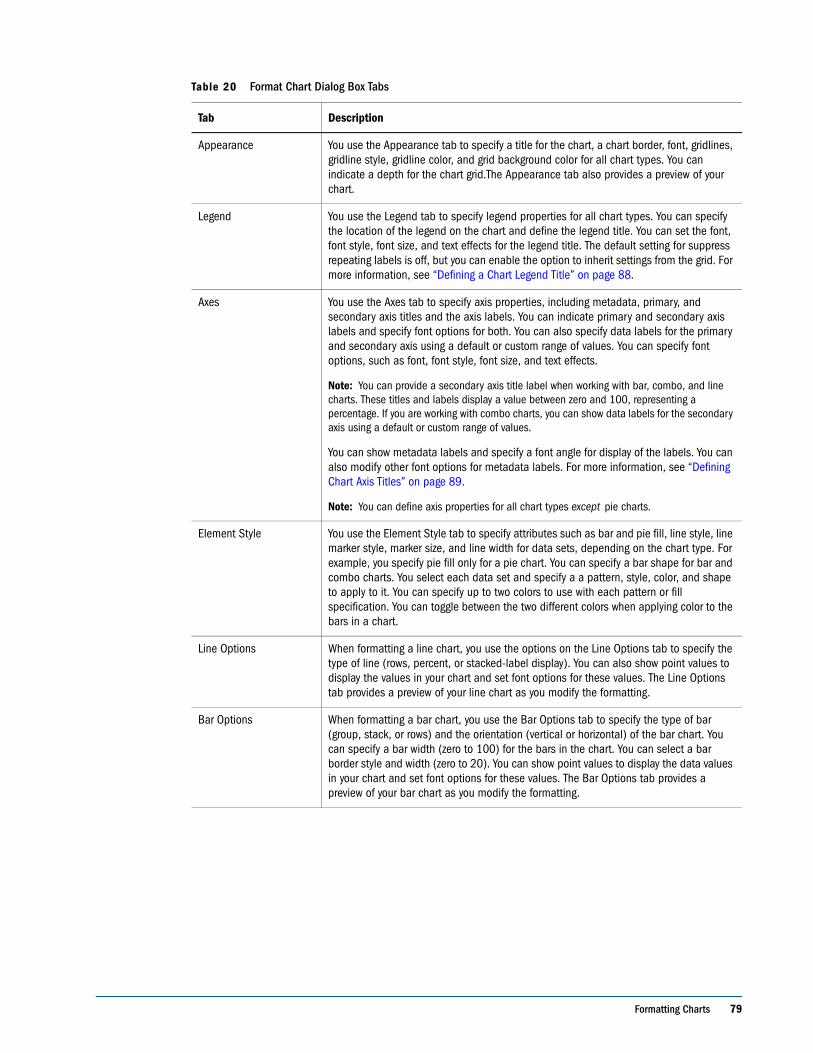
Formatting Charts 79
Table 20 Format Chart Dialog Box Tabs
Tab Description
Appearance You use the Appearance tab to specify a title for the chart, a chart border, font, gridlines, gridline style, gridline color, and grid background color for all chart types. You can indicate a depth for the chart grid.The Appearance tab also provides a preview of your chart.
Legend You use the Legend tab to specify legend properties for all chart types. You can specify the location of the legend on the chart and define the legend title. You can set the font, font style, font size, and text effects for the legend title. The default setting for suppress repeating labels is off, but you can enable the option to inherit settings from the grid. For more information, see “Defining a Chart Legend Title” on page 88.
Axes You use the Axes tab to specify axis properties, including metadata, primary, and secondary axis titles and the axis labels. You can indicate primary and secondary axis labels and specify font options for both. You can also specify data labels for the primary and secondary axis using a default or custom range of values. You can specify font options, such as font, font style, font size, and text effects.
Note: You can provide a secondary axis title label when working with bar, combo, and line charts. These titles and labels display a value between zero and 100, representing a percentage. If you are working with combo charts, you can show data labels for the secondary axis using a default or custom range of values.
You can show metadata labels and specify a font angle for display of the labels. You can also modify other font options for metadata labels. For more information, see “Defining Chart Axis Titles” on page 89.
Note: You can define axis properties for all chart types except pie charts.
Element Style You use the Element Style tab to specify attributes such as bar and pie fill, line style, line marker style, marker size, and line width for data sets, depending on the chart type. For example, you specify pie fill only for a pie chart. You can specify a bar shape for bar and combo charts. You select each data set and specify a a pattern, style, color, and shape to apply to it. You can specify up to two colors to use with each pattern or fill specification. You can toggle between the two different colors when applying color to the bars in a chart.
Line Options When formatting a line chart, you use the options on the Line Options tab to specify the type of line (rows, percent, or stacked-label display). You can also show point values to display the values in your chart and set font options for these values. The Line Options tab provides a preview of your line chart as you modify the formatting.
Bar Options When formatting a bar chart, you use the Bar Options tab to specify the type of bar (group, stack, or rows) and the orientation (vertical or horizontal) of the bar chart. You can specify a bar width (zero to 100) for the bars in the chart. You can select a bar border style and width (zero to 20). You can show point values to display the data values in your chart and set font options for these values. The Bar Options tab provides a preview of your bar chart as you modify the formatting.
80 Customizing Charts
Formatting Fonts in ChartsWhen working with charts, you can format fonts to customize their appearance. Font formatting options include font selection, font size, color, and font angle (zero to 315 degrees, in increments of 45 degrees).
You can format fonts by clicking the Format button, , which is displayed throughout the tabs located on the Format Chart dialog box.
Note: You can preview font selection options in the Preview window in the Format Dialog Box.
Line Options and Bar Options
When formatting a combo chart, the Format Chart dialog box includes a Line Options tab and a Bar Options tab. Consult the Line Options tab and Bar Options tab descriptions in this table for information about the tabs.
Note: When you are formatting a combo chart, the Chart Properties property sheet displays range selection options for data on the line and bar charts.
Pie Options You use the Pie Options tab to specify formatting options for a pie chart. You can modify the angle of the pie chart, specify a separation distance (which applies to the first slice of the pie chart only), and select slice values (percent, data, or label) to display in the pie chart. You can also format the font options for these values. You can indicate the position (exterior or radial) for the slice values. You can specify a slice border style (solid, dotted, dashed, or dotdashed) and a border width (zero to 20) for the slice. The Pie Options tab provides a preview of your pie chart as you modify the formatting options.
Table 20 Format Chart Dialog Box Tabs (Continued)
Tab Description
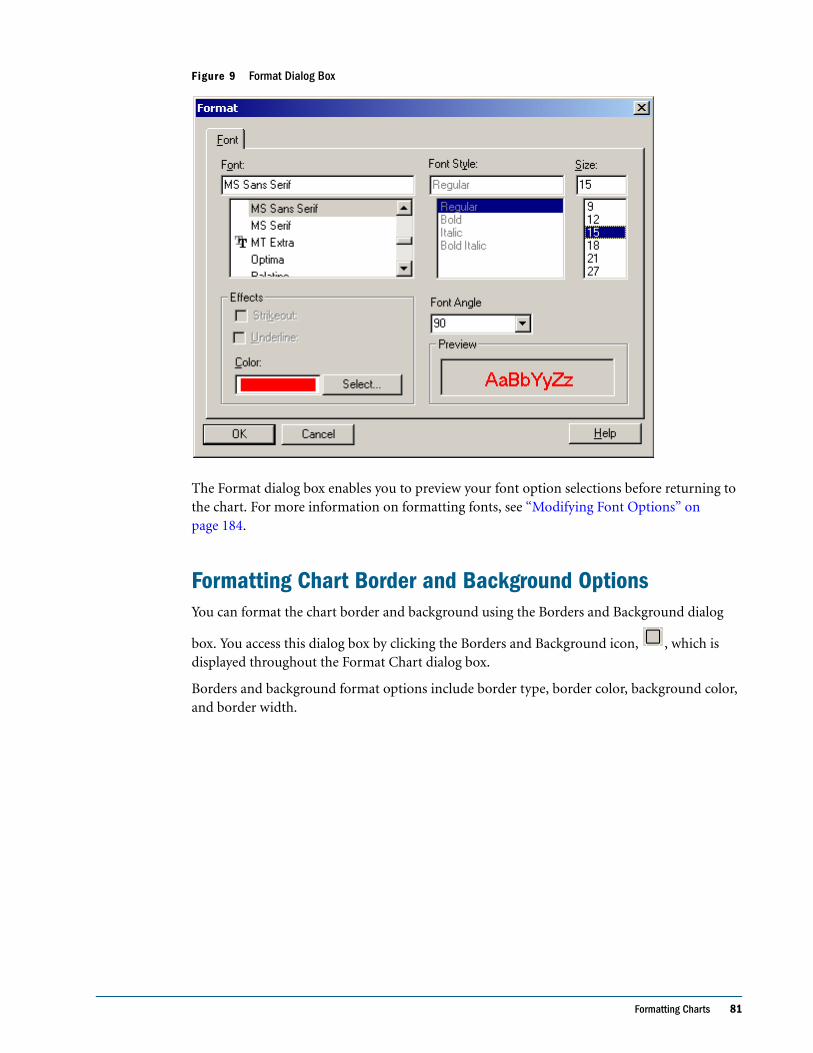
Formatting Charts 81
Figure 9 Format Dialog Box
The Format dialog box enables you to preview your font option selections before returning to the chart. For more information on formatting fonts, see “Modifying Font Options” on page 184.
Formatting Chart Border and Background OptionsYou can format the chart border and background using the Borders and Background dialog
box. You access this dialog box by clicking the Borders and Background icon, , which is displayed throughout the Format Chart dialog box.
Borders and background format options include border type, border color, background color, and border width.
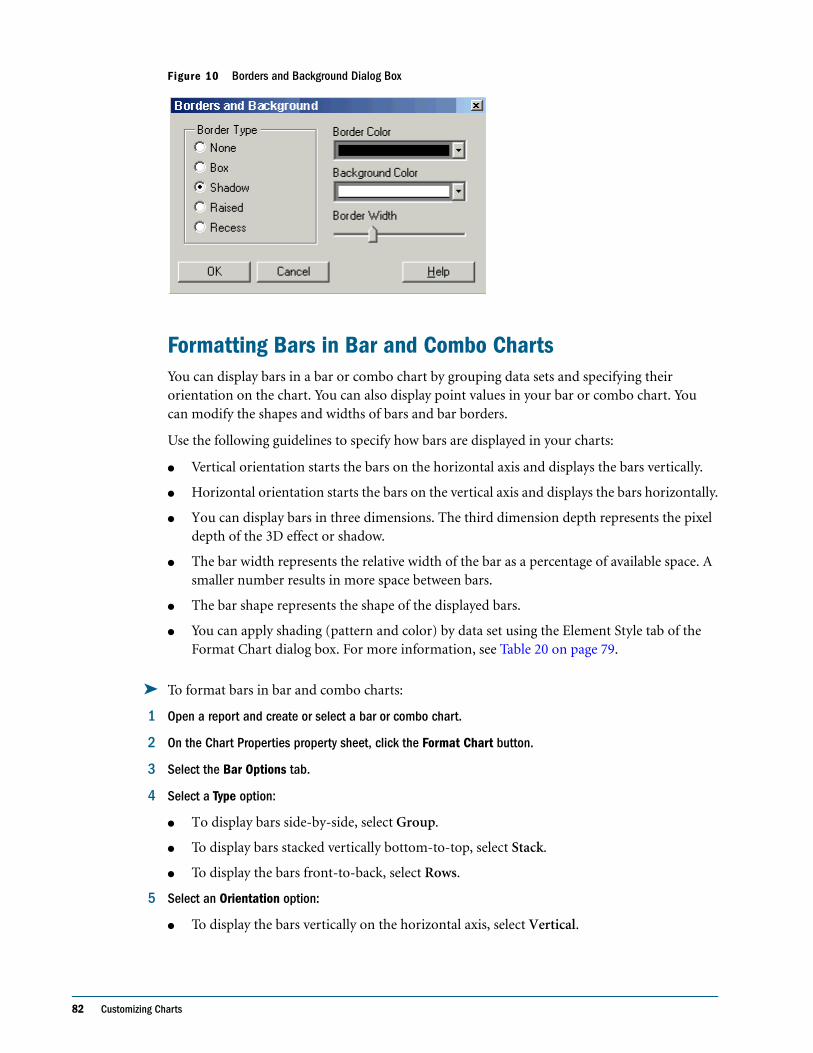
82 Customizing Charts
Figure 10 Borders and Background Dialog Box
Formatting Bars in Bar and Combo ChartsYou can display bars in a bar or combo chart by grouping data sets and specifying their orientation on the chart. You can also display point values in your bar or combo chart. You can modify the shapes and widths of bars and bar borders.
Use the following guidelines to specify how bars are displayed in your charts:
● Vertical orientation starts the bars on the horizontal axis and displays the bars vertically.
● Horizontal orientation starts the bars on the vertical axis and displays the bars horizontally.
● You can display bars in three dimensions. The third dimension depth represents the pixel depth of the 3D effect or shadow.
● The bar width represents the relative width of the bar as a percentage of available space. A smaller number results in more space between bars.
● The bar shape represents the shape of the displayed bars.
● You can apply shading (pattern and color) by data set using the Element Style tab of the Format Chart dialog box. For more information, see Table 20 on page 79.
➤ To format bars in bar and combo charts:
1 Open a report and create or select a bar or combo chart.
2 On the Chart Properties property sheet, click the Format Chart button.
3 Select the Bar Options tab.
4 Select a Type option:
● To display bars side-by-side, select Group.
● To display bars stacked vertically bottom-to-top, select Stack.
● To display the bars front-to-back, select Rows.
5 Select an Orientation option:
● To display the bars vertically on the horizontal axis, select Vertical.
Formatting Charts 83
● To display the bars horizontally on the vertical axis, select Horizontal.
6 To show the numerical value or data that the bar represents, select the Show Point Values check box. The value is displayed within the bar.
7 Click the Font button, , to set font options for the bar values.
8 To specify a style to be applied to the border of the bars in the chart, select Solid, Dotted, Dashed, or DotDashed from the Bar Border Style drop-down list.
9 To alter the width of the bars, use the slide tool in the Bar Width box.
10 To increase or decrease the width of the bar borders, use the slide tool in the Bar Border Width box.
11 Click OK.
Note: You can define styles for the bars representing the current data set. For more information, see “Defining Styles for Data Sets” on page 87.
Formatting Lines in Line and Combo ChartsYou can specify display options for lines in line and combo charts. For example, you can display lines in separate rows, stacked as a percentage of the total of all values, or stacked as absolute values.
➤ To format lines in line and combo charts:
1 Open a report and create or select a line or combo chart.
2 On the Chart Properties property sheet, click the Format Chart button.
3 Select the Line Options tab.
4 Select one of the following line types:
● To display the line sets in separate rows, select Rows. For example, if you define the 3D depth as nonzero, the lines are displayed in separate rows, from front to back.
● To display the line sets stacked on top of each other, normalized to 100%, select Percent. As each line set is drawn, its values are added to previous values displayed and are shown as percentages of the total of all values.
● To display the line sets stacked, select Stack. As each line set is drawn, its values are added to previous values. Select one of the following from the drop-down list:
❍ To show pop-ups with accumulated values, select Total Value.
❍ To show pop-ups as individual item values, select Segment Value.
5 To show the numerical value or data that the line represents, select the Show Point Values check box. The value is displayed on top of the line.
6 To set font options for the point values of the lines, click the Font button, .
7 Click OK.
84 Customizing Charts
Note: You can define styles for the lines representing the current data set. For more information, see “Defining Styles for Data Sets” on page 87.
Defining Combo Chart OptionsA combo chart combines a line chart and a bar chart. Typically used to contrast data sets, combo charts employ bar and line options and are set with the same variables as bar charts and line charts.
When you are formatting a combo chart, the Format Chart dialog box includes the Line Options tab and Bar Options tab. For more information, see Table 20 on page 79. For information about defining bar options for a combo chart, see “Formatting Bars in Bar and Combo Charts” on page 82. For information about defining line options for a combo chart, see “Formatting Lines in Line and Combo Charts” on page 83.
Formatting Pie ChartsWhen creating a pie chart, you can specify the starting angle for the first pie slice, the level of separation between pie slices, the position and type of pie slice labels, and the slice border style and width. You can also set font options including font, font size, effects, and angle for the textual display of the slice values.
➤ To format a pie chart:
1 Open a report and create or select a pie chart.
2 On the Chart Properties property sheet, click the Format Chart button.
3 Click the Pie Options tab.
4 To specify the angle of the first pie slice, use the slide tool for Pie Angle. The angle is measured in degrees from 0 to 360, counterclockwise, with 0 degrees pointing to the 3 o'clock position.
5 To indicate the distance between the pie slices, use the slide tool for Separation. Moving the slide tool to the left makes the space between slices smaller; moving the slide tool to the right increases the space between slices.
6 Select a Show Slice Values as option:
● To show data values as a percentage, select Percent.
● To show the absolute value of the pie chart data, select Data.
● To display the data value as a label, select Label.
7 To set font options for the slice values shown in the chart, click the Font button, .
8 Select a Position option:
● To show the slice values outside of the pie chart, select Exterior.
● To show the slice values inside of the pie chart, select Radial. Use the slide tool to adjust the location of the data value inside of the slice.
Formatting Charts 85
9 From the Slice Border Style drop down list, select a style to apply to the border of the slices in your pie chart: solid, dotted, dashed, or dotdash.
10 To indicate the width of the borders for the pie chart slices, use the slide tool for Slice Border Width. The maximum width is 100.
11 Click OK.
Note: You can define styles for the slices of the pie that represent the current data set. For more information, see “Defining Styles for Data Sets” on page 87.
Setting Background Options for a ChartYou can set background options for a chart, such as a border, gridlines, gridline color, gridline style, and grid background. You can also set the grid depth.
➤ To set background options for a chart:
1 Open a report and select a chart.
2 From the Chart Properties property sheet, click the Format Chart button.
3 Select the Appearance tab.
4 Optional: To place a border around the chart, select the Chart Border check box.
5 Click the Borders and Background icon, , to format the border and background of the chart.
6 To modify the gridlines, gridline color, style, or background, select an option from the drop-down list boxes:
● To specify which gridlines to consider for the current format (both, vertical, horizontal or none), select an option from the Gridlines drop-down list.
● To define a style (solid, dotted, dashed, dotdash, or bar) for the gridlines, select an option from the Gridline Style drop-down list.
● To define a color for the gridlines, select an option from the Gridline Color drop-down color palette.
● To define a background color to display behind the gridlines, select an option from the Grid Background drop-down color palette.
Note: When setting background options for a pie chart, these options are not available.
7 Optional: Modify the Grid Depth using the slide tool provided.
8 Click OK.
86 Customizing Charts
Positioning Charts on ReportsYou can specify a chart’s position on the report and how it is displayed when printed. You can specify a position relative to the grid, a position relative to other report objects, or no position at all. If you do not specify a position, the chart remains in the location where it was originally created on the report.
➤ To position a chart on a report:
1 Open a report and select a chart.
2 On the Chart Properties property sheet, modify the horizontal and vertical positions for the object using Position Object on Report:
a. From the Horizontal drop-down list, select one of the following horizontal positions:
❍ Select None to anchor this chart at its current position in the report. The chart is printed in this position.
❍ Select Relative if you want the chart to maintain a distance relative to other report objects located to the left of it. This option assures that the chart is not printed on top of another report object.
❍ Select Left to position the chart against the left margin of the report.
❍ Select Center to position the chart in the center of the report.
❍ Select Right to position the chart against the right margin of the report.
b. In the Vertical drop-down list, select one of the following vertical positions:
❍ Select None to anchor this chart at its current position in the report. The chart is printed in this position.
❍ Select Relative if you want the chart to maintain a distance relative to other report objects located above it. This option assures that the chart is not printed on top of another report object.
❍ Select Top to position the chart at the top of the report.
❍ Select Middle to position the chart in the middle of the report.
❍ Select Bottom to position the chart at the bottom of the report.
Defining GridlinesYou can display gridlines behind a bar, line, or combo chart. You can show or hide gridlines, and you can specify gridline color, style, and background color.
➤ To define gridlines:
1 Open a report and select a chart.
2 On the Chart Properties property sheet, click the Format Chart button.
3 Select the Appearance tab.
4 From the Gridlines drop-down list, select one of the following options:
Formatting Charts 87
● Horizontal to show horizontal gridlines
● Vertical to show vertical gridlines
● Both to display horizontal and vertical gridlines
● None to hide gridlines
5 Optional: To specify a style (solid, dotted, dashed, dotdash, or bar) for the gridlines, click Gridline Style and select an option from the drop-down list.
6 Optional: To specify a color for the gridlines, click Gridline Color and select a color from the drop-down color palette.
7 Optional: To specify a background color to display behind the gridlines, click Grid Background and select a color from the drop-down color palette.
Defining Styles for Data SetsYou can define styles for data sets in charts. You can define a pattern and color for each data set in your report. The specified shading and patterns are applied to each respective data set to differentiate values in the chart.
➤ To define styles for a data set:
1 Open a report and select a chart.
2 On the Chart Properties property sheet, click the Format Chart button.
3 Select the Element Style tab.
4 Select a data set.
5 Select a fill pattern for the selected data set.
6 From the Color 1 and Color 2 drop-down list boxes, select two colors for contrasting the pattern.
Note: To toggle between the two different colors selected, click the Toggle Color icon,.
7 Select a line style, line marker style, marker size, and line width to apply to the data set.
8 Click OK.
Resizing and Moving ChartsYou can change the size of a chart and move a chart to another location in a report.
➤ To resize a chart:
1 Select a chart by clicking on that chart object.
2 Click and drag a handle, located on the perimeter of the chart, to change the size.
88 Customizing Charts
➤ To move a chart:
1 Click inside the chart, selecting the chart as an object.
2 Hold down the left mouse button and drag the chart to another location in the report.
Formatting Chart Titles and LabelsYou can specify and format chart legend titles, chart titles, chart axes titles, and axis labels in your chart. You can also format the font and borders and background of the titles and axes you indicate. You specify chart titles and labels in the Format Chart dialog box.
For more information on defining chart titles and labels, see the following topics:
● “Defining a Chart Legend Title” on page 88
● “Defining a Chart Title” on page 89
● “Defining Chart Axis Titles” on page 89
● “Defining Axis Labels” on page 90
Defining a Chart Legend TitleYou define a legend to identify and describe the data sets used in your chart. You can specify font and background options and border color. You can also specify the placement location for the legend within the chart boundaries.
You can also suppress repeating labels, through which you can inherit settings from the referenced grid. Repeating labels are axis labels that repeat in a chart if you do not suppress them.
Note: Chart legend options are available for all chart types.
➤ To define chart legend options:
1 Open a report and select a chart.
2 On the Chart Properties property sheet, click the Format Chart button.
3 Select the Legend tab to display the formatting and placement options for legends.
4 Select the Place Legend check box to select the vertical and horizontal positions of the chart legend relative to the chart boundaries. Vertical positioning options include Top, Middle, and Bottom. Horizontal positioning options include Left, Center, Right.
5 Click the Borders and Background icon, , to format the border and background of the legend.
6 In the Legend Title text box, enter a title for the legend.
7 Click the Font button, to set font options, including font, font size, effects, and angle, for the legend title and its labels, then click OK.
Formatting Chart Titles and Labels 89
8 To suppress X-axis labels that would otherwise repeat, select from the following options for Suppress Repeating Labels: Inherit Settings from Grid, On, or Off.
9 Click OK.
Defining a Chart TitleWhen defining chart appearance, you can specify a title and then select font and background options for the title.
➤ To define a chart title:
1 Open a report and select a chart.
2 From the Chart Properties property sheet, click the Format Chart button.
3 Select the Appearance tab.
4 In the Chart Title text box, enter a title for the chart.
Tip: When defining legend, axes or chart titles, you can print the title on multiple lines using a \n in the title. You can use a \’s to indicate a possessive apostrophe in the legend, axes or chart title. You can combine these commands to use apostrophes with titles that span multiple lines.
5 Optional: Click the Font button, , then set font options and click OK.
6 Optional: Click the Borders and Background icon, , then specify border and background options for the chart title, and click OK.
7 To place a border around the chart, select the Chart Border check box.
8 Optional: Click the Borders and Background icon, , then specify border and background options for the chart border and click OK.
9 Click OK.
Defining Chart Axis TitlesYou can specify a metadata title and primary and secondary axis titles, to identify the data that is displayed on the axes of your chart. You can also specify font options, including font size, color, and font angle. You can label your metadata using the same formatting options.
You can also specify font options, including font size, color, and font angle. You can label your metadata using the same formatting options.
You can specify color, border, and background options for the title of each axis.
Note: Chart axis options are available for bar, line, and combo charts only.
90 Customizing Charts
➤ To define a chart axis title:
1 Open a report and select a chart.
2 On the Chart Properties property sheet, click the Format Chart button.
3 Select the Axes tab to display the formatting options for axes, then perform one or more of the following actions:
● In the Metadata Title text box, enter the title for the horizontal axis.
● In the Primary Axis Title text box, enter the title for the primary vertical axis. This is displayed to the left of the chart.
● In the Secondary Axis Title text box, enter the title for the secondary vertical axis. This is displayed to the right of the chart.
4 Click the Font button, , to set font options and then click OK.
5 Click the Borders and Background icon, , then specify border and background options for the axis title and click OK.
6 Click OK.
Defining Axis LabelsYou can define and format labels for the primary and secondary axis in a chart. For a combo chart, you can specify and format a secondary axis label. You can also display and format metadata labels.
Note: A primary or secondary axis label enables you to specify a custom range of values on the axis.
➤ To define axis labels:
1 Open a report and select a chart.
2 On the Chart Properties property sheet, click the Format Chart button.
3 Select the Axes tab and perform one or more of the following actions:
● To use the default range of values on the primary axis, select the check box for Primary Axis Label.
● To enter a range of values, including minimum, maximum, and step, on the primary axis, select the check box for Primary Axis Label and the Custom Range check box.
Note: You can use the custom range to change the starting and ending numbers of your axis and the numeric intervals. For example, you can display values 40 through 60 at three step intervals by entering 40, 60, and 3 in the Min, Max, and Step check boxes, consecutively.
● To use the default range of values on the secondary axis of a combo chart, select the check box for Secondary Axis Label.
Formatting Chart Titles and Labels 91
● To enter a range of values, including maximum, minimum, and step, on the secondary axis of a combo chart, select the check box for Secondary Axis Label and the Custom Range check box.
● To display the percentage of the default range of values on the secondary axis in a bar of line chart, select the check box for Secondary Axis Label.
● To enter a range of values, including minimum, maximum, and step, on the secondary axis in a bar or line chart, select the check box for Secondary Axis Label and the Custom Range check box.
4 Click the Font button, , to set font options for the data labels, and then click OK.
5 Click the Borders and Background icon, , then specify border and background options for the data labels, and then click OK.
6 To show the metadata labels with a standard display, select the Show Metadata Labels check box.
Note: Financial Reporting implements staggered labels as a default to ensure the even distribution of data on report axes.
7 Click the Font button, , to set font options for the metadata labels, then click OK.
Viewing ChartsYou can print and print-preview the chart rendering in Financial Reporting Studio and Financial Reporting. If you installed the Adobe SVG Viewer, charts are rendered in enhanced quality for the following output.
● When viewed in PDF in Financial Reporting.
● When exported to PDF in Financial Reporting Studio.
For information on downloading the Adobe SVG Viewer, see the Hyperion System 9 BI+ Financial Reporting Installation Guide.

92 Customizing Charts
Building Reports 93
C h a p t e r
4Building Reports
To build reports, you create a report design by adding report objects to the design and defining the report object properties. Report objects include text boxes, grids, images, and charts. When you create a report, you start with a blank design area. You can modify the blank report as necessary.
In This Chapter Adding Report Objects . . . . . . . . . . . . . . . . . . . . . . . . . . . . . . . . . . . . . . . . . . . . . . . . . . . . . . . . . . . . . . . . . . . . . . 94
Adding Text Objects . . . . . . . . . . . . . . . . . . . . . . . . . . . . . . . . . . . . . . . . . . . . . . . . . . . . . . . . . . . . . . . . . . . . . . . . 96
Adding Grids . . . . . . . . . . . . . . . . . . . . . . . . . . . . . . . . . . . . . . . . . . . . . . . . . . . . . . . . . . . . . . . . . . . . . . . . . . . . . 98
Inserting Images . . . . . . . . . . . . . . . . . . . . . . . . . . . . . . . . . . . . . . . . . . . . . . . . . . . . . . . . . . . . . . . . . . . . . . . . . 102
Inserting Charts . . . . . . . . . . . . . . . . . . . . . . . . . . . . . . . . . . . . . . . . . . . . . . . . . . . . . . . . . . . . . . . . . . . . . . . . . . 103
Creating Headers and Footers . . . . . . . . . . . . . . . . . . . . . . . . . . . . . . . . . . . . . . . . . . . . . . . . . . . . . . . . . . . . . . . 105
Positioning Report Objects . . . . . . . . . . . . . . . . . . . . . . . . . . . . . . . . . . . . . . . . . . . . . . . . . . . . . . . . . . . . . . . . . . 105
Resizing Report Objects . . . . . . . . . . . . . . . . . . . . . . . . . . . . . . . . . . . . . . . . . . . . . . . . . . . . . . . . . . . . . . . . . . . . 106
Saving Report Objects . . . . . . . . . . . . . . . . . . . . . . . . . . . . . . . . . . . . . . . . . . . . . . . . . . . . . . . . . . . . . . . . . . . . . 107
Removing Report Objects from a Report . . . . . . . . . . . . . . . . . . . . . . . . . . . . . . . . . . . . . . . . . . . . . . . . . . . . . . . . 108
Designing Headers and Footers . . . . . . . . . . . . . . . . . . . . . . . . . . . . . . . . . . . . . . . . . . . . . . . . . . . . . . . . . . . . . . 108
Creating a Title Page . . . . . . . . . . . . . . . . . . . . . . . . . . . . . . . . . . . . . . . . . . . . . . . . . . . . . . . . . . . . . . . . . . . . . . 109
Inserting Page Breaks Before Report Objects . . . . . . . . . . . . . . . . . . . . . . . . . . . . . . . . . . . . . . . . . . . . . . . . . . . . 109
Viewing Report Summaries . . . . . . . . . . . . . . . . . . . . . . . . . . . . . . . . . . . . . . . . . . . . . . . . . . . . . . . . . . . . . . . . . 109
Viewing Server Information . . . . . . . . . . . . . . . . . . . . . . . . . . . . . . . . . . . . . . . . . . . . . . . . . . . . . . . . . . . . . . . . . 110

94 Building Reports
Adding Report ObjectsReport objects are defined as text boxes, grids, charts, or images defined in the design area of a report. Adding report objects to your report involves specifying the report layout and object properties, and selecting the data content. You can also insert report objects previously stored in the repository. Report objects can be used in multiple reports.
After you add a report object, you can assign properties to it such as format options. Format options include font, alignment, spacing, shading, and positioning.
➤ To add a report object:
1 Select File > New > Report.
2 Add report objects to your report using the “Report Objects” on page 23.
3 Save your report by selecting File > Save.
Using Linked and Local ObjectsReport objects can be saved to the repository and serve as a resource for other reports. They can be inserted into other reports as linked or local (unlinked) objects and used “as is” or customized.
Linking objects to a source object can save time and effort. By updating one source object, you update all reports that are linked to this source object.
The option to link or not to link is specified while performing the following functions:
● Saving a report object to the repository
● Inserting an object from the repository into your report. When you insert a saved object from the repository as a linked object, you can clear the link after it is copied into the report. However, you cannot reverse this action.
Linked ObjectsLinked objects enable you to save an object in a report and in the repository. You can link the object in the report to the source object in the repository so that modifications to the source object are reflected in the object that exists in the report.
When you insert a source object into a report, modify it, then link it to the source object when saving the object, the changes are reflected in the source object and all objects that are linked to it in other reports. For an example of creating a linked report object, see “Saving Text Objects” on page 97.
For example, suppose you insert into your report a text object, Company_Logo, from the repository. You then modify the text in Company_Logo and save the object, specifying a link to the source object. The revised Company_Logo text object overwrites the source object in the repository, and any new report or existing report that is also linked to the Company_Logo source object reflects the modified text.
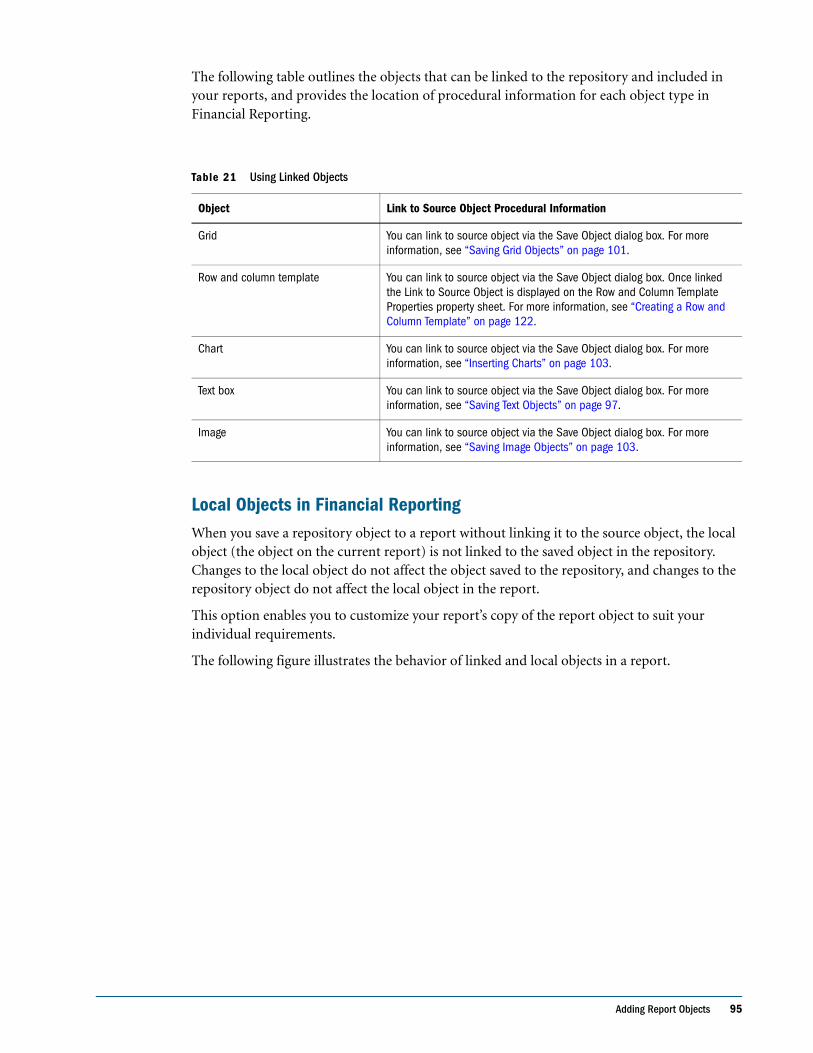
Adding Report Objects 95
The following table outlines the objects that can be linked to the repository and included in your reports, and provides the location of procedural information for each object type in Financial Reporting.
Local Objects in Financial ReportingWhen you save a repository object to a report without linking it to the source object, the local object (the object on the current report) is not linked to the saved object in the repository. Changes to the local object do not affect the object saved to the repository, and changes to the repository object do not affect the local object in the report.
This option enables you to customize your report’s copy of the report object to suit your individual requirements.
The following figure illustrates the behavior of linked and local objects in a report.
Table 21 Using Linked Objects
Object Link to Source Object Procedural Information
Grid You can link to source object via the Save Object dialog box. For more information, see “Saving Grid Objects” on page 101.
Row and column template You can link to source object via the Save Object dialog box. Once linked the Link to Source Object is displayed on the Row and Column Template Properties property sheet. For more information, see “Creating a Row and Column Template” on page 122.
Chart You can link to source object via the Save Object dialog box. For more information, see “Inserting Charts” on page 103.
Text box You can link to source object via the Save Object dialog box. For more information, see “Saving Text Objects” on page 97.
Image You can link to source object via the Save Object dialog box. For more information, see “Saving Image Objects” on page 103.
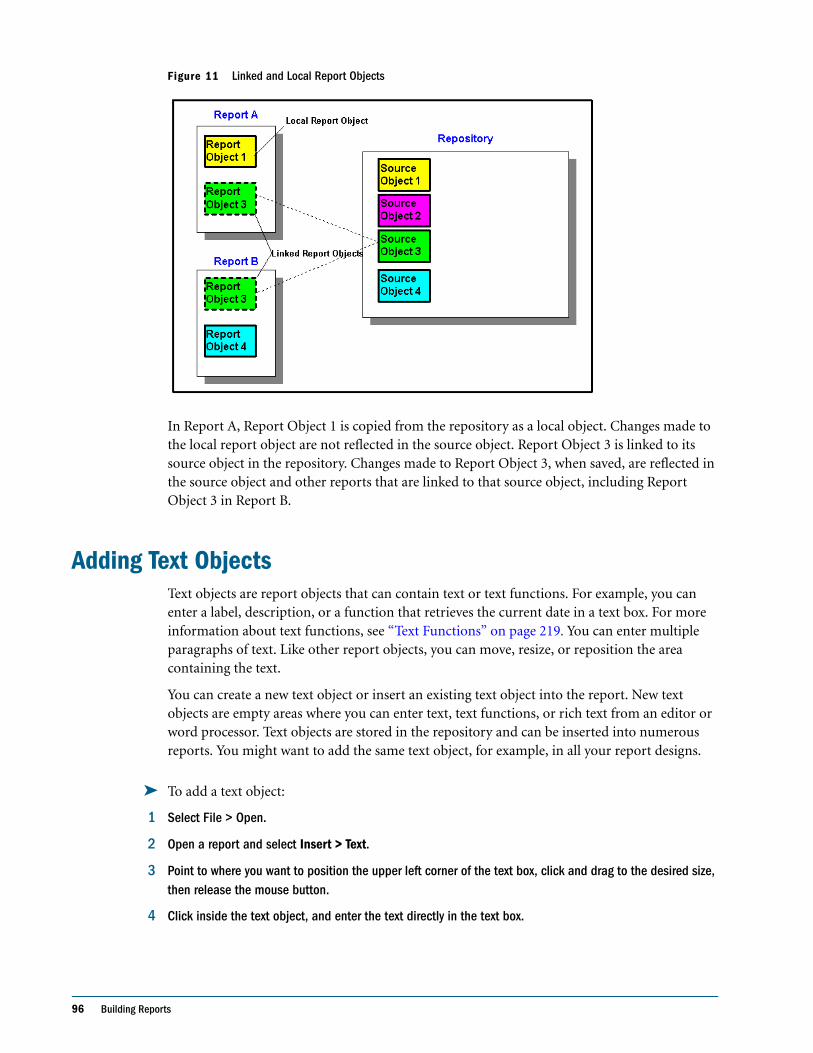
96 Building Reports
Figure 11 Linked and Local Report Objects
In Report A, Report Object 1 is copied from the repository as a local object. Changes made to the local report object are not reflected in the source object. Report Object 3 is linked to its source object in the repository. Changes made to Report Object 3, when saved, are reflected in the source object and other reports that are linked to that source object, including Report Object 3 in Report B.
Adding Text ObjectsText objects are report objects that can contain text or text functions. For example, you can enter a label, description, or a function that retrieves the current date in a text box. For more information about text functions, see “Text Functions” on page 219. You can enter multiple paragraphs of text. Like other report objects, you can move, resize, or reposition the area containing the text.
You can create a new text object or insert an existing text object into the report. New text objects are empty areas where you can enter text, text functions, or rich text from an editor or word processor. Text objects are stored in the repository and can be inserted into numerous reports. You might want to add the same text object, for example, in all your report designs.
➤ To add a text object:
1 Select File > Open.
2 Open a report and select Insert > Text.
3 Point to where you want to position the upper left corner of the text box, click and drag to the desired size, then release the mouse button.
4 Click inside the text object, and enter the text directly in the text box.
Adding Text Objects 97
➤ To insert a text box from the repository:
1 Select File > Open.
2 Open a report and select Insert > Saved Object.
3 In the Type drop-down list, select Text.
4 Select the directory where you want to search for the text object, then select the desired text object.
5 Perform an action:
● To use the text object as a linked object, select Link to Source Object.
● To use the text object as an unlinked object, deselect Link to Source Object. This is the default option.
6 Click Insert.
Modifying Text ObjectsYou can modify the properties of a text object. This includes inserting a function in the text object, modifying the vertical or horizontal position of the text box, and selecting the autosize function, which enables the display of all of the text contained in the text object. You can also select the Page Break Before check box, which displays the text box on the top of the next page when you preview or print the report. You can also link the current text object to a source object in the repository.
Note: The Link to Source Object check box is enabled after the text object is saved to the repository and the Link to Source Object check box is selected.
➤ To modify a text object:
1 Select the text object.
2 Using the Text Properties sheet, modify the properties of the object. To modify the text, select Format > Font.
Tip: To resize the text object, drag a handle. To move the text object, drag inside the text object border.
Saving Text ObjectsWhen you save a text object, you can create a link between that text object and the source object in the repository. Text objects can be saved to the repository for reuse when building reports. Once they are saved to the repository, they can be inserted into a report as linked or unlinked objects.
Note: Changes to a linked object are not saved when you save and close your design.
98 Building Reports
➤ To save the text object to the repository:
1 Click the text object, then select File > Save Object.
2 Select a folder or create a folder.
3 Perform the following actions:
a. In the Name text box, enter the report text object name. You can use upper and lowercase letters, spaces and numbers. The program does not accept special characters such as \ / %, ? + < > | ‘.
b. In the Description text box, enter the description of the text object.
4 Perform an action:
● To create a link from the text object in the report to the source object in the repository, select Link to Source Object.
● To save without creating a link from the text object in the report to the saved object in the repository, clear Link to Source Object.
Note: For a description of linked objects, see “Using Linked and Local Objects” on page 94.
5 Click Save to save the text object to the repository. When you save a text object, only the specified object is saved, not the entire report design.
Adding Grids Grids are tables that can contain data from external database connections. You can add a grid to your report, define its dimension layout, select members, and then format the grid. You can also insert an existing grid to reuse a preformatted grid design. You can use text, dimensions, members, and formulas to define the grid content. You can also hide a grid. For example, you might want to display a chart in a report, but not the grid associated with the chart.
You define the dimension layout for the grid by specifying a database connection, then dragging the available dimensions from the Point of View (POV) frame into the Rows, Columns, and Pages frames. The dimensions that are not placed in the Rows, Columns, or Pages frames are displayed in the user POV bar for that grid. You can layer multiple dimensions on a row, column, or page. For example, you might want to place the Scenario and Time dimensions on the same axis to show actual and budget data over a period of time.
The following figure shows the Dimension Layout dialog box. This is where you define the grid’s dimension layout by dragging the dimensions from the Point of View frame into the Pages, Rows, and Columns frames.
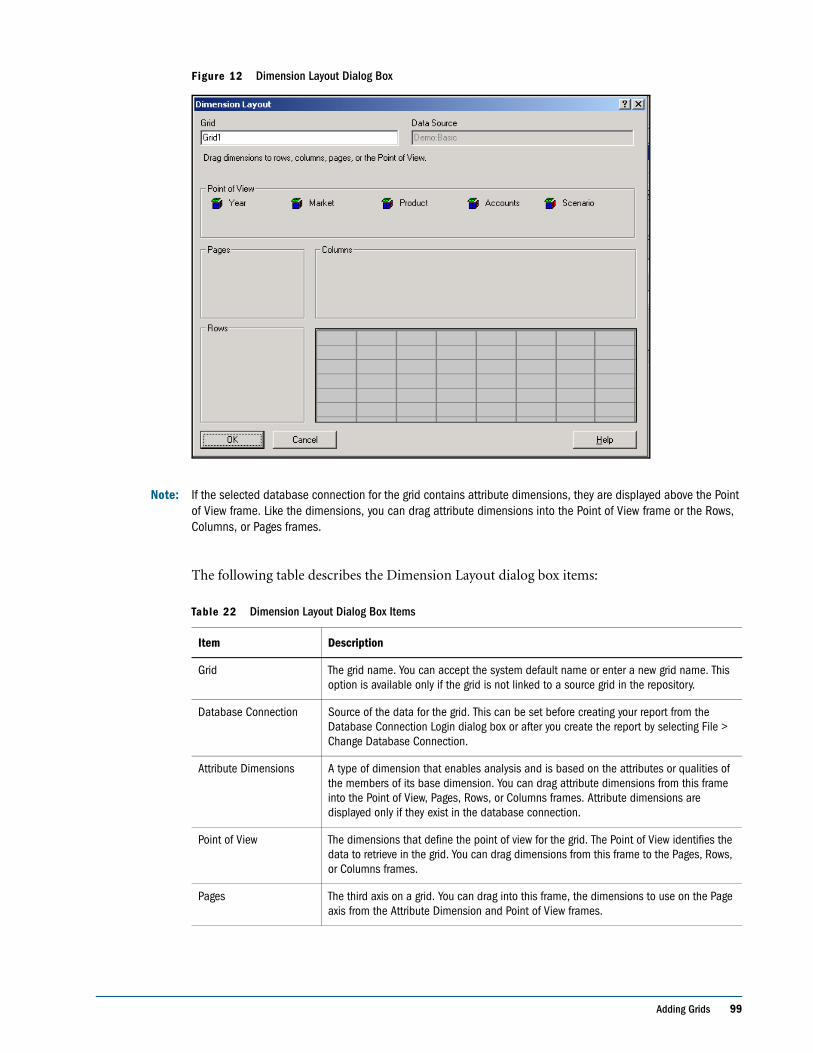
Adding Grids 99
Figure 12 Dimension Layout Dialog Box
Note: If the selected database connection for the grid contains attribute dimensions, they are displayed above the Point of View frame. Like the dimensions, you can drag attribute dimensions into the Point of View frame or the Rows, Columns, or Pages frames.
The following table describes the Dimension Layout dialog box items:
Table 22 Dimension Layout Dialog Box Items
Item Description
Grid The grid name. You can accept the system default name or enter a new grid name. This option is available only if the grid is not linked to a source grid in the repository.
Database Connection Source of the data for the grid. This can be set before creating your report from the Database Connection Login dialog box or after you create the report by selecting File > Change Database Connection.
Attribute Dimensions A type of dimension that enables analysis and is based on the attributes or qualities of the members of its base dimension. You can drag attribute dimensions from this frame into the Point of View, Pages, Rows, or Columns frames. Attribute dimensions are displayed only if they exist in the database connection.
Point of View The dimensions that define the point of view for the grid. The Point of View identifies the data to retrieve in the grid. You can drag dimensions from this frame to the Pages, Rows, or Columns frames.
Pages The third axis on a grid. You can drag into this frame, the dimensions to use on the Page axis from the Attribute Dimension and Point of View frames.
100 Building Reports
After you define the dimension layout, you can select the members to use for each dimension. For more information, see “Assigning Members to Data Rows or Columns” on page 48 and “Assigning Members to the Page Axis” on page 50.
When you add a new grid, the system assigns a default name to the grid. You can rename the grid in the Dimension Layout dialog box or when you save it. The default name assigned is Gridn, where n is a system-assigned identification number. For example, if you save a grid that is the sixth system-named grid saved in the report, the default name is Grid6. The system uses the grid name when a function or chart references the grid. For example, if you design a chart to graphically display the data from a grid, the chart properties must reference the grid by its name.
➤ To add a new grid into your report:
1 Open a report and select Insert > Grid.
2 Point to where you want to place the upper left corner of the grid and drag to the desired size, then release the mouse button.
3 In the Select a Database Connection dialog box, select a Database Connection.
4 Click OK. The Dimension Layout window is displayed.
5 Drag the dimension icons from the Attribute Dimensions frames, if they exist, and Point of View frames into the Pages, Rows, or Columns frames, then click OK.
Note: You can place multiple dimensions into the Rows, Columns, or Pages frames.
➤ To insert an existing grid into your report:
1 Open a report and select Insert > Saved Object.
2 In the Type drop-down list, select Grid.
3 Select the directory where you want to search for the grid object, then select the desired grid object.
4 Perform an action:
● To use the grid object as a linked object, select Link to Source Object.
● To use the grid object as an unlinked object, clear Link to Source Object. This is the default.
Columns A vertical display of information in a grid or table. You can drag into this frame the dimensions to use on the column.
Rows A horizontal display of information in a grid or table. You can drag into this frame the dimensions to use on the row axis from the Attribute Dimension and Point of View frames.
Table 22 Dimension Layout Dialog Box Items (Continued)
Item Description
Adding Grids 101
Note: For a description of linked objects, see “Using Linked and Local Objects” on page 94.
5 Click Insert.
Modifying the Properties of Grid ObjectsYou can customize grid objects using the Grid Properties sheet, which contains four primary categories for modifying a selected grid: general, format, suppression, and position. You can use the general and format categories to position and format the selected grid, including dimension layout, show members, cell alignment, and borders and shading. Suppression is used to hide a grid, or values in a grid’s cells. You would use positioning to modify the object’s vertical or horizontal positioning on the grid. The following procedure describes how to modify the properties of a grid object.
➤ To modify the properties of a grid object:
1 Open a report and select the object to be modified.
2 Modify the object using the Grid Properties sheet. For information on customizing your grid, see Chapter 5, “Customizing Grids.”
3 Optional: Click the Dimension Layout button in the Grid Properties sheet to change the dimensions on the grid’s axes. If this is a linked grid, the Grid field displays the name of the grid and its path in the repository.
Tip: To resize the grid object, drag a handle. To move the grid object, drag the grid’s title bar.
Saving Grid ObjectsWhen you save a grid object, you can create a link between that grid object and the source object in the repository. When you save the object in the repository, it can be reused by linking to another report.
Note: You must have Designer or System Administrator level security to perform this function.
➤ To save the grid object to the repository:
1 Click the grid, then select File > Save Object.
2 Select a folder in which to store the grid, or create a new folder.
3 In the Name text box, enter the grid name. You can use upper and lowercase letters, spaces and numbers. The program does not accept special characters such as \ / %, ? + < > | ‘.
4 In the Description text box, enter the description of the grid.
5 Perform an action:
● To create a link from the grid object in the report to the source object in the repository, select Link to Source Object.
102 Building Reports
● To save a grid object without creating a link from the grid object in the report to the saved source object in the repository, clear Link to Source Object.
Note: For a description of linked objects, see “Using Linked and Local Objects” on page 94.
6 Click Save to save the grid object to the repository. When you save a grid object, only the specified object is saved, not the entire report design.
Inserting ImagesImage objects are graphics or pictures that can be used in your report. The following image formats can be used:
● Bitmaps: .bmp and .dib
● Graphics Interchange Format (GIF): .gif
● Joint Photographic Experts Group (JPEG): .jpg
● Icon: .ico and .cur
You can add images to the header, footer, or body of a report. After you add an image frame with an image file to the report, you can format the image object. For more information on image formatting, see “Formatting Images” on page 209.
You can insert an image file that is stored in a file system outside Financial Reporting into the image frame, or you can insert an entire image object that is saved in Studio Explore.
Note: Image objects are saved with the report. As a result, the speed of the application may be affected based on the size of your image object.
➤ To insert a new image object located outside of Studio Explore:
1 Open a report and select Insert > Image.
2 Point to where you want to place the upper left corner of the image frame, click and drag to the desired size, then release the mouse button.
3 In the Files of type drop-down list, select an image format.
4 Select an image file from the default Financial Reporting bin directory, or click the Look in drop-down list to search for an image file located on your file system.
5 Click Open to select the image file.
6 Use the Image Properties sheet to modify the image.
Note: To add the image to the Financial Reporting repository, or to save it as a linked object, select File > Save Object. For information, see Saving Image Objects
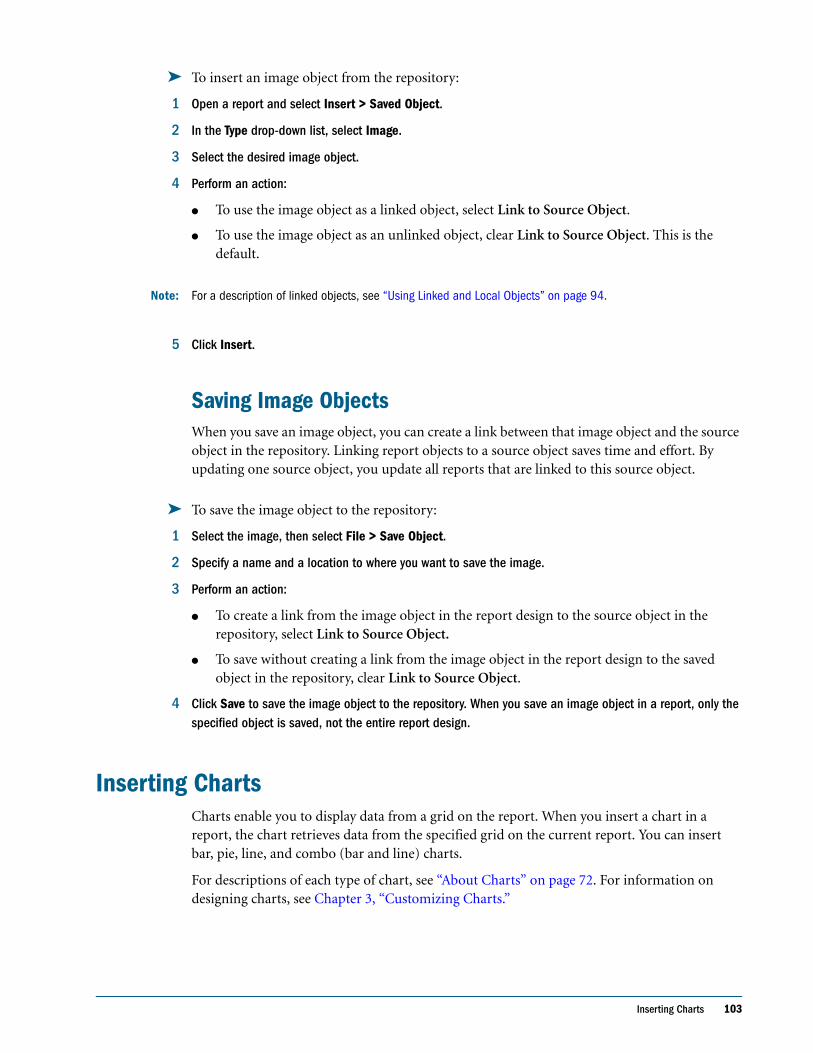
Inserting Charts 103
➤ To insert an image object from the repository:
1 Open a report and select Insert > Saved Object.
2 In the Type drop-down list, select Image.
3 Select the desired image object.
4 Perform an action:
● To use the image object as a linked object, select Link to Source Object.
● To use the image object as an unlinked object, clear Link to Source Object. This is the default.
Note: For a description of linked objects, see “Using Linked and Local Objects” on page 94.
5 Click Insert.
Saving Image ObjectsWhen you save an image object, you can create a link between that image object and the source object in the repository. Linking report objects to a source object saves time and effort. By updating one source object, you update all reports that are linked to this source object.
➤ To save the image object to the repository:
1 Select the image, then select File > Save Object.
2 Specify a name and a location to where you want to save the image.
3 Perform an action:
● To create a link from the image object in the report design to the source object in the repository, select Link to Source Object.
● To save without creating a link from the image object in the report design to the saved object in the repository, clear Link to Source Object.
4 Click Save to save the image object to the repository. When you save an image object in a report, only the specified object is saved, not the entire report design.
Inserting ChartsCharts enable you to display data from a grid on the report. When you insert a chart in a report, the chart retrieves data from the specified grid on the current report. You can insert bar, pie, line, and combo (bar and line) charts.
For descriptions of each type of chart, see “About Charts” on page 72. For information on designing charts, see Chapter 3, “Customizing Charts.”
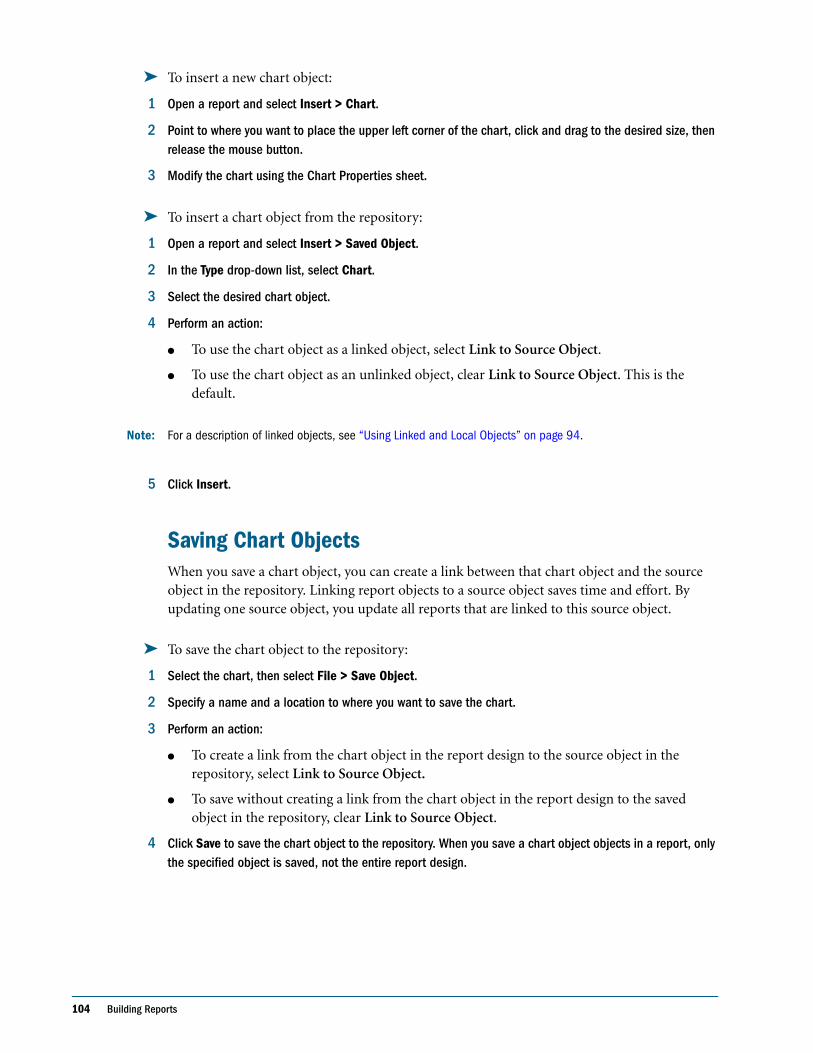
104 Building Reports
➤ To insert a new chart object:
1 Open a report and select Insert > Chart.
2 Point to where you want to place the upper left corner of the chart, click and drag to the desired size, then release the mouse button.
3 Modify the chart using the Chart Properties sheet.
➤ To insert a chart object from the repository:
1 Open a report and select Insert > Saved Object.
2 In the Type drop-down list, select Chart.
3 Select the desired chart object.
4 Perform an action:
● To use the chart object as a linked object, select Link to Source Object.
● To use the chart object as an unlinked object, clear Link to Source Object. This is the default.
Note: For a description of linked objects, see “Using Linked and Local Objects” on page 94.
5 Click Insert.
Saving Chart ObjectsWhen you save a chart object, you can create a link between that chart object and the source object in the repository. Linking report objects to a source object saves time and effort. By updating one source object, you update all reports that are linked to this source object.
➤ To save the chart object to the repository:
1 Select the chart, then select File > Save Object.
2 Specify a name and a location to where you want to save the chart.
3 Perform an action:
● To create a link from the chart object in the report design to the source object in the repository, select Link to Source Object.
● To save without creating a link from the chart object in the report design to the saved object in the repository, clear Link to Source Object.
4 Click Save to save the chart object to the repository. When you save a chart object objects in a report, only the specified object is saved, not the entire report design.
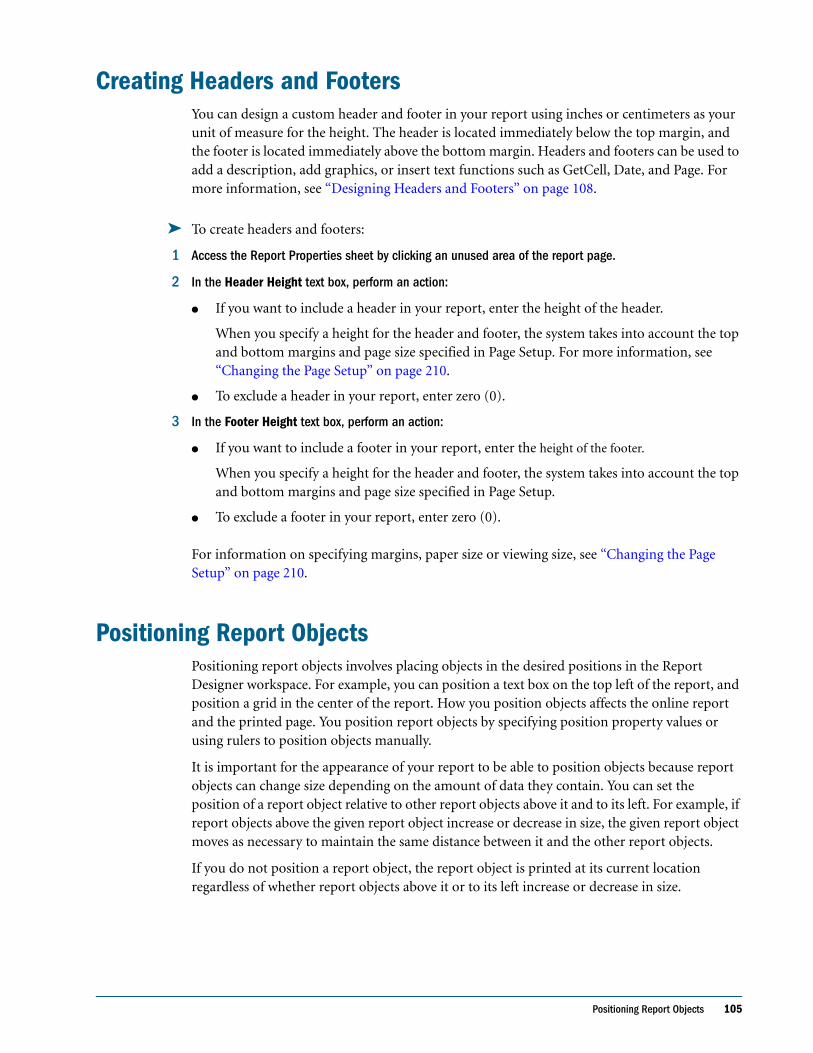
Positioning Report Objects 105
Creating Headers and FootersYou can design a custom header and footer in your report using inches or centimeters as your unit of measure for the height. The header is located immediately below the top margin, and the footer is located immediately above the bottom margin. Headers and footers can be used to add a description, add graphics, or insert text functions such as GetCell, Date, and Page. For more information, see “Designing Headers and Footers” on page 108.
➤ To create headers and footers:
1 Access the Report Properties sheet by clicking an unused area of the report page.
2 In the Header Height text box, perform an action:
● If you want to include a header in your report, enter the height of the header.
When you specify a height for the header and footer, the system takes into account the top and bottom margins and page size specified in Page Setup. For more information, see “Changing the Page Setup” on page 210.
● To exclude a header in your report, enter zero (0).
3 In the Footer Height text box, perform an action:
● If you want to include a footer in your report, enter the height of the footer.
When you specify a height for the header and footer, the system takes into account the top and bottom margins and page size specified in Page Setup.
● To exclude a footer in your report, enter zero (0).
For information on specifying margins, paper size or viewing size, see “Changing the Page Setup” on page 210.
Positioning Report ObjectsPositioning report objects involves placing objects in the desired positions in the Report Designer workspace. For example, you can position a text box on the top left of the report, and position a grid in the center of the report. How you position objects affects the online report and the printed page. You position report objects by specifying position property values or using rulers to position objects manually.
It is important for the appearance of your report to be able to position objects because report objects can change size depending on the amount of data they contain. You can set the position of a report object relative to other report objects above it and to its left. For example, if report objects above the given report object increase or decrease in size, the given report object moves as necessary to maintain the same distance between it and the other report objects.
If you do not position a report object, the report object is printed at its current location regardless of whether report objects above it or to its left increase or decrease in size.
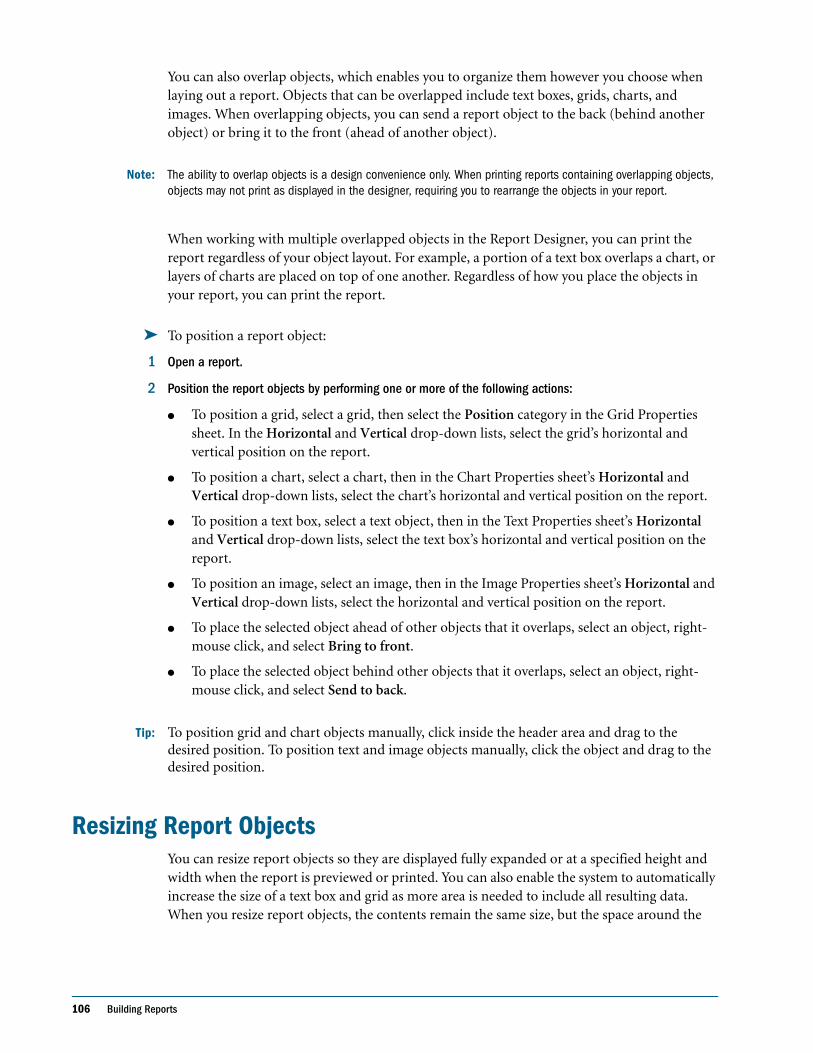
106 Building Reports
You can also overlap objects, which enables you to organize them however you choose when laying out a report. Objects that can be overlapped include text boxes, grids, charts, and images. When overlapping objects, you can send a report object to the back (behind another object) or bring it to the front (ahead of another object).
Note: The ability to overlap objects is a design convenience only. When printing reports containing overlapping objects, objects may not print as displayed in the designer, requiring you to rearrange the objects in your report.
When working with multiple overlapped objects in the Report Designer, you can print the report regardless of your object layout. For example, a portion of a text box overlaps a chart, or layers of charts are placed on top of one another. Regardless of how you place the objects in your report, you can print the report.
➤ To position a report object:
1 Open a report.
2 Position the report objects by performing one or more of the following actions:
● To position a grid, select a grid, then select the Position category in the Grid Properties sheet. In the Horizontal and Vertical drop-down lists, select the grid’s horizontal and vertical position on the report.
● To position a chart, select a chart, then in the Chart Properties sheet’s Horizontal and Vertical drop-down lists, select the chart’s horizontal and vertical position on the report.
● To position a text box, select a text object, then in the Text Properties sheet’s Horizontal and Vertical drop-down lists, select the text box’s horizontal and vertical position on the report.
● To position an image, select an image, then in the Image Properties sheet’s Horizontal and Vertical drop-down lists, select the horizontal and vertical position on the report.
● To place the selected object ahead of other objects that it overlaps, select an object, right-mouse click, and select Bring to front.
● To place the selected object behind other objects that it overlaps, select an object, right-mouse click, and select Send to back.
Tip: To position grid and chart objects manually, click inside the header area and drag to the desired position. To position text and image objects manually, click the object and drag to the desired position.
Resizing Report Objects You can resize report objects so they are displayed fully expanded or at a specified height and width when the report is previewed or printed. You can also enable the system to automatically increase the size of a text box and grid as more area is needed to include all resulting data. When you resize report objects, the contents remain the same size, but the space around the
Saving Report Objects 107
contents changes. For example, you can drag a handle of a grid border to reserve an amount of space to the left of the grid. When you view the grid, the area to the left of the grid remains blank.
Note: If you reduce the size of a text box or grid so that there is more content than can fit in it, scroll bars are displayed on the border of an online report.
➤ To resize a report object:
1 Open a report.
2 Resize the report objects as follows:
● To resize a text box, select the text object, then in the Text Properties sheet, select Autosize. The text area fully expands when you preview or print the report.
Note: You are limited to 27 lines of text. To see all lines of text, deselect Autosize.
● To enable the system to horizontally and vertically expand a grid, select the grid, then select the General category on the Grid Properties sheet. Select Autosize.
Tip: To manually adjust the size of a report object, drag a report object’s handle. Use the guidelines and the ruler on the Report Designer workspace to assist in sizing report objects.
Saving Report ObjectsWhen you save a report object, you can create a link between that source object and the source object in the repository. Saving report objects in the repository enables you to reuse them on a consistent basis. This saves time and enables you to build a library of objects to access and use when creating reports.
➤ To save report objects:
1 Click the report object, then select File > Save Object.
2 Select a folder or create a new folder.
3 In the Name text box, enter the report object name. You can use upper and lowercase letters, spaces and numbers. The program does not accept special characters such as \ / %, ? + < > | ‘.
4 In the Description text box, enter the description of the report object.
5 Perform an action to save the local report object to the repository:
● To create a link from the local object in the report to the source object in the repository, select Link to source object.
● To save without creating a link from the local object in the report design to the saved object in the repository, clear Link to source object.
108 Building Reports
6 Click Save to save the report object to the repository. When you save report objects in a report, only the specified object is saved, not the entire report design.
Removing Report Objects from a ReportWhen you remove a linked report object from a report, it is removed from only the report and not from the repository. You can still use the source report object in other reports. For information on removing report objects from the server, see Chapter 11, “Managing the Explore Repository.”
➤ To remove a report object from a report:
1 Select a report object, then perform an action:
● Right-click, then select Delete.
● Select Edit > Delete.
Designing Headers and Footers Headers and footers are displayed at the top and bottom of each page in a report and can be aligned to the right, left, or center. Headers and footers can include text, images, and formulas that retrieve text, such as the report name. You can also include the page number in a header or footer.
➤ To design headers and footers:
1 Open a report.
2 Click the space outside of a report object to display the Report Properties sheet.
3 Remove any report objects that are located in the header or footer area, then perform one or both of the following actions:
● To specify a header height, enter a height in inches or centimeters in the Header Height text box.
● To specify a footer height, enter a height in the Footer Height text box.
Tip: If you do not want a header or footer, specify zero (0) for the header or footer height, respectively. The height of the header and footer defaults to zero (0) units in a blank report layout.
4 Perform either of the following actions:
● To insert text in a header or footer:
a. Select Insert > Text.
b. In the header or footer area, click where you want to place the upper left corner of the text box and drag to the desired size, then release the mouse button.
Viewing Report Summaries 109
c. Click inside the text box. Then, enter the exact text in the text box, or specify a formula in the text box to dynamically retrieve header or footer information. To specify a formula, add functions such as page, date, and report description, click the Insert Functions button in the Text Properties sheet.
● To insert an image in a header or footer:
a. Select Insert > Image.
b. In the header or footer area, point to where you want to place the upper left corner of the image and drag to the desired size, then release the mouse button.
5 Set properties using the Text or Image Properties sheet.
Creating a Title PageA title page creates a new page at the beginning of your report with the user-defined text.
➤ To create a title page:
1 Open a report to which you want to add a title page and add a text box at the top of the Report Designer workspace. For instructions on adding a text box, see “Adding Text Objects” on page 96.
2 Select a report object below the text box, then from that report object’s property sheet, select Page Break Before.
3 Design the text for the title page using the options in the Text Properties sheet.
4 Select File > Print Preview to view the title page.
Inserting Page Breaks Before Report Objects You insert a page break before a report object to move the report object to the next page.
➤ To insert a page break before a report object:
1 Open a report and select a report object above which you want to insert a page break.
2 From the report object’s property sheet, select the Page Break Before check box.
Viewing Report SummariesA Report summary shows the name, the description, and the creator of a report. In addition, a report summary shows the modifier, date, and time the report was last modified.
Summary information is saved when you save the report. The following table describes the options you can select to be displayed in your report summary:
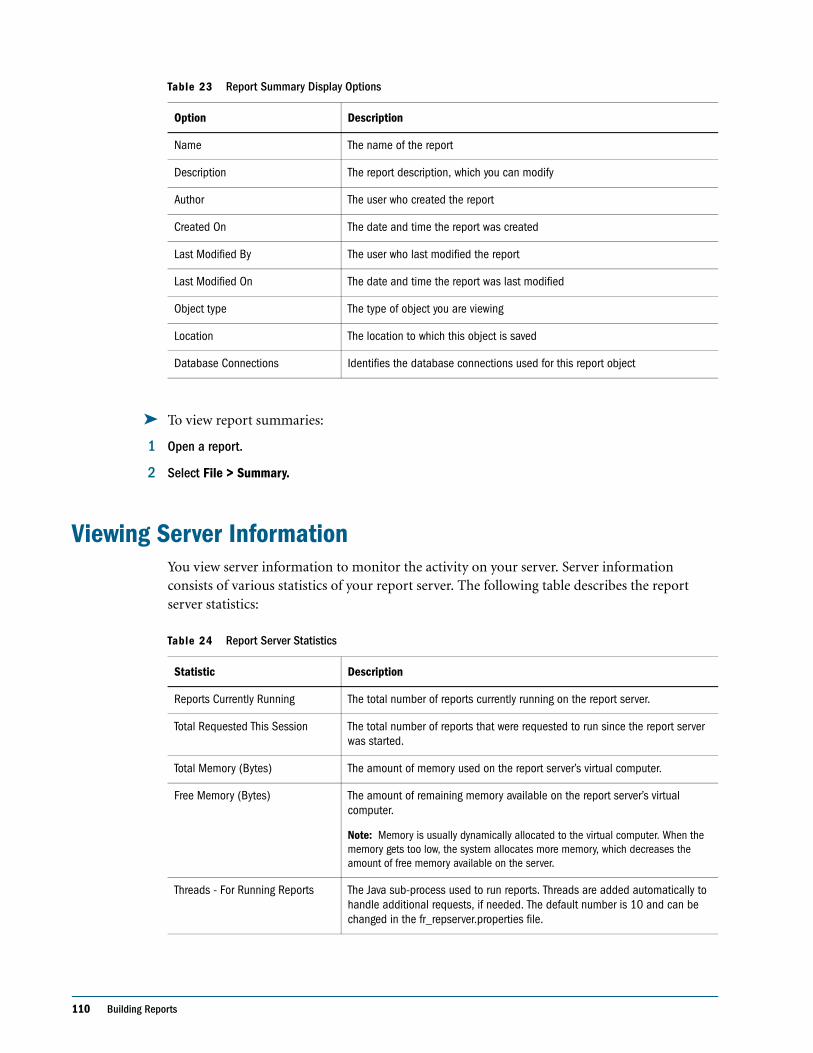
110 Building Reports
➤ To view report summaries:
1 Open a report.
2 Select File > Summary.
Viewing Server InformationYou view server information to monitor the activity on your server. Server information consists of various statistics of your report server. The following table describes the report server statistics:
Table 23 Report Summary Display Options
Option Description
Name The name of the report
Description The report description, which you can modify
Author The user who created the report
Created On The date and time the report was created
Last Modified By The user who last modified the report
Last Modified On The date and time the report was last modified
Object type The type of object you are viewing
Location The location to which this object is saved
Database Connections Identifies the database connections used for this report object
Table 24 Report Server Statistics
Statistic Description
Reports Currently Running The total number of reports currently running on the report server.
Total Requested This Session The total number of reports that were requested to run since the report server was started.
Total Memory (Bytes) The amount of memory used on the report server’s virtual computer.
Free Memory (Bytes) The amount of remaining memory available on the report server’s virtual computer.
Note: Memory is usually dynamically allocated to the virtual computer. When the memory gets too low, the system allocates more memory, which decreases the amount of free memory available on the server.
Threads - For Running Reports The Java sub-process used to run reports. Threads are added automatically to handle additional requests, if needed. The default number is 10 and can be changed in the fr_repserver.properties file.

Viewing Server Information 111
➤ To view server information:
1 Open a report.
2 Select File > Report Server Info.
3 Click Close to close the Report Server Info dialog box.

112 Building Reports
Customizing Grids 113
C h a p t e r
5Customizing Grids
You can customize grids by calculating data rows and columns. You can use functions to refine your report data or to add dynamic data, such as the date the report was created. You can also cut, copy, or paste rows or columns within a grid or across multiple grids.
Before you begin to customize grids, you must insert at least one grid and define its dimension layout. To customize a report, you must insert a text box or a grid in your report. For more information, see “Adding Report Objects” on page 94.
In This Chapter Inserting Rows or Columns in Grids . . . . . . . . . . . . . . . . . . . . . . . . . . . . . . . . . . . . . . . . . . . . . . . . . . . . . . . . . . . 114
Cutting, Copying, and Pasting in Grids . . . . . . . . . . . . . . . . . . . . . . . . . . . . . . . . . . . . . . . . . . . . . . . . . . . . . . . . . 115
Specifying Row and Column Headings for Grids . . . . . . . . . . . . . . . . . . . . . . . . . . . . . . . . . . . . . . . . . . . . . . . . . . 116
About Row and Column Templates . . . . . . . . . . . . . . . . . . . . . . . . . . . . . . . . . . . . . . . . . . . . . . . . . . . . . . . . . . . . 119
Setting Data Query Optimization Options . . . . . . . . . . . . . . . . . . . . . . . . . . . . . . . . . . . . . . . . . . . . . . . . . . . . . . . 126
Enabling Expansions for Analytic Services . . . . . . . . . . . . . . . . . . . . . . . . . . . . . . . . . . . . . . . . . . . . . . . . . . . . . . 129
Displaying Line Item Detail for Financial Management. . . . . . . . . . . . . . . . . . . . . . . . . . . . . . . . . . . . . . . . . . . . . . 129
Showing Supporting Detail for Planning . . . . . . . . . . . . . . . . . . . . . . . . . . . . . . . . . . . . . . . . . . . . . . . . . . . . . . . . 129
Defining the Grid Point of View . . . . . . . . . . . . . . . . . . . . . . . . . . . . . . . . . . . . . . . . . . . . . . . . . . . . . . . . . . . . . . . 131
Inserting Page Breaks . . . . . . . . . . . . . . . . . . . . . . . . . . . . . . . . . . . . . . . . . . . . . . . . . . . . . . . . . . . . . . . . . . . . . 133
Defining Page Axis Headings . . . . . . . . . . . . . . . . . . . . . . . . . . . . . . . . . . . . . . . . . . . . . . . . . . . . . . . . . . . . . . . . 134
Changing the Database Connection of Grids. . . . . . . . . . . . . . . . . . . . . . . . . . . . . . . . . . . . . . . . . . . . . . . . . . . . . 135
Defining Formula Rows or Columns . . . . . . . . . . . . . . . . . . . . . . . . . . . . . . . . . . . . . . . . . . . . . . . . . . . . . . . . . . . 141
Using the Formula Bar . . . . . . . . . . . . . . . . . . . . . . . . . . . . . . . . . . . . . . . . . . . . . . . . . . . . . . . . . . . . . . . . . . . . . 148
Accessing Property Sheet Features. . . . . . . . . . . . . . . . . . . . . . . . . . . . . . . . . . . . . . . . . . . . . . . . . . . . . . . . . . . . 153
Calculating at the Cell Level . . . . . . . . . . . . . . . . . . . . . . . . . . . . . . . . . . . . . . . . . . . . . . . . . . . . . . . . . . . . . . . . . 153
Using Text Functions to Display Information . . . . . . . . . . . . . . . . . . . . . . . . . . . . . . . . . . . . . . . . . . . . . . . . . . . . . 154
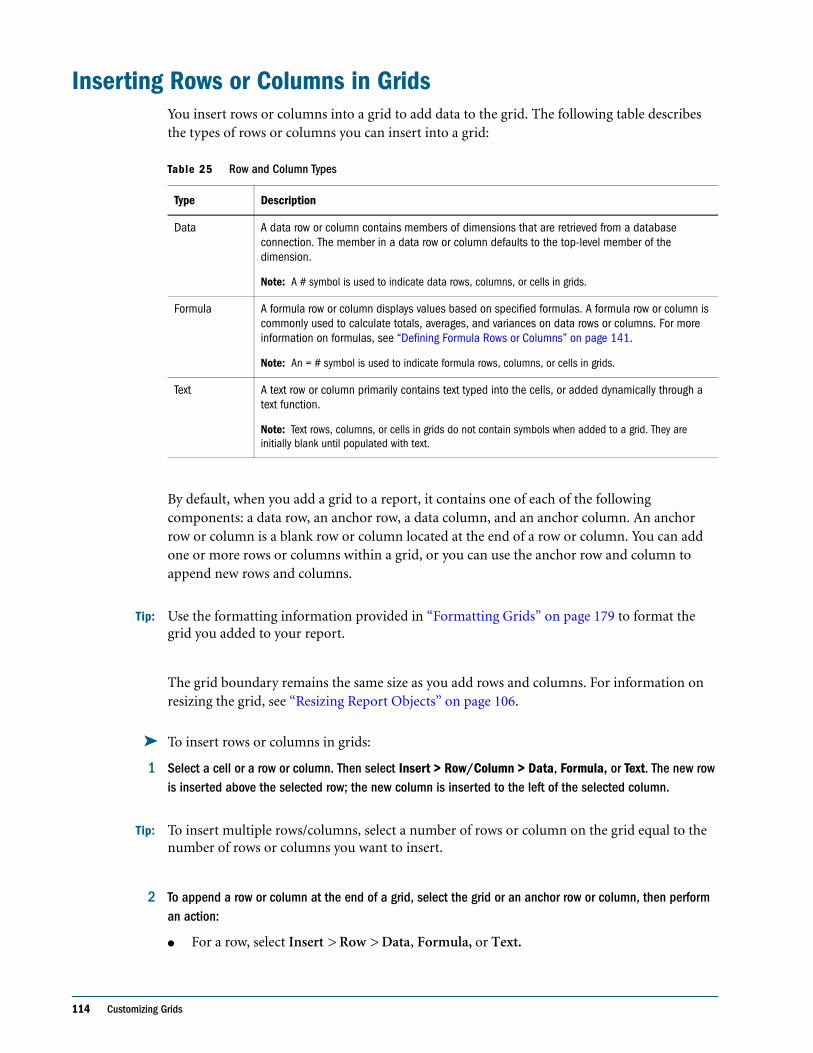
114 Customizing Grids
Inserting Rows or Columns in GridsYou insert rows or columns into a grid to add data to the grid. The following table describes the types of rows or columns you can insert into a grid:
By default, when you add a grid to a report, it contains one of each of the following components: a data row, an anchor row, a data column, and an anchor column. An anchor row or column is a blank row or column located at the end of a row or column. You can add one or more rows or columns within a grid, or you can use the anchor row and column to append new rows and columns.
Tip: Use the formatting information provided in “Formatting Grids” on page 179 to format the grid you added to your report.
The grid boundary remains the same size as you add rows and columns. For information on resizing the grid, see “Resizing Report Objects” on page 106.
➤ To insert rows or columns in grids:
1 Select a cell or a row or column. Then select Insert > Row/Column > Data, Formula, or Text. The new row is inserted above the selected row; the new column is inserted to the left of the selected column.
Tip: To insert multiple rows/columns, select a number of rows or column on the grid equal to the number of rows or columns you want to insert.
2 To append a row or column at the end of a grid, select the grid or an anchor row or column, then perform an action:
● For a row, select Insert > Row > Data, Formula, or Text.
Table 25 Row and Column Types
Type Description
Data A data row or column contains members of dimensions that are retrieved from a database connection. The member in a data row or column defaults to the top-level member of the dimension.
Note: A # symbol is used to indicate data rows, columns, or cells in grids.
Formula A formula row or column displays values based on specified formulas. A formula row or column is commonly used to calculate totals, averages, and variances on data rows or columns. For more information on formulas, see “Defining Formula Rows or Columns” on page 141.
Note: An = # symbol is used to indicate formula rows, columns, or cells in grids.
Text A text row or column primarily contains text typed into the cells, or added dynamically through a text function.
Note: Text rows, columns, or cells in grids do not contain symbols when added to a grid. They are initially blank until populated with text.
Cutting, Copying, and Pasting in Grids 115
● For a column, select Insert > Column > Data, Formula, or Text.
3 To populate the row or column with data, formula, or text, perform an action:
● For a data row or column, double-click the row or column heading and select dimension members to place on the row or column. For more information, see “Assigning Members to Data Rows or Columns” on page 48.
● For a formula row or column, select the row or column heading and build a formula in the formula bar. For more information, see “Defining Formula Rows or Columns” on page 141.
● For a text row or column, enter text directly into the row or column. For more information on formatting text rows or columns, see “Formatting Text Boxes” on page 178.
Note: To delete a row or column, select the desired row or column, then select Edit > Delete.
Cutting, Copying, and Pasting in GridsYou can copy, and paste rows and columns and formula rows and columns within the same grid or between two different grids in a report. You can only cut and paste rows and columns and formula rows and columns within the same grid.
Note: For formula rows and columns, you must cut the entire row or column.
➤ To cut, copy, and paste rows or columns in grids:
1 Open Financial Reporting Studio.
2 Select File > New > Report to open a blank report, or select an existing report.
3 Create a grid.
4 Select a row or column and perform an action:
● To cut a row or column and place the information on the Windows clipboard, select Edit > Cut.
● To copy a row or column and place the information on the Windows clipboard, select Edit > Copy.
Tip: To select multiple consecutive rows or columns, press the SHIFT key and click multiple rows or columns.
5 Click the destination row or column.
6 To paste the selection in the destination row or column, select Edit > Paste.
116 Customizing Grids
Note: Columns are pasted to the left of the selected destination column. Rows are pasted above the selected destination row. Pasting inserts the column or row and does not overwrite the data in the destination row or column.
7 Select File > Save to save the report.
Specifying Row and Column Headings for GridsDefining row and column headings for the grid enables you to specify the information you want displayed in the row and column headings for the entire grid. You can specify one of the following member labels for row and column headings:
● The member name, which displays the member name as the heading.
● The alias or description, which displays the alias or description as the heading.
● The member name and alias or description, which displays the member name and alias or description as the heading.
Note: Whether or not you specify an alias or a description depends on your type of database connection. If you are reporting against a Analytic Services or Planning Details database connection, select Alias. If you are reporting against a Financial Management database connection, select Description.
When specifying row and column headings, you must define where you want row headings to be positioned in relation to the columns. For example, you might want your row headings to be positioned before column A.
Note: You cannot place row headings before columns that are sorted.
You can also suppress headings for repeating members in a segment. When you suppress headings, only the first instance of the heading for a member that is repeated is displayed. Headings for the additional repeating members are hidden.
If you are using the Entity dimension through a Financial Management database connection, you can select the checkbox for Short Name for Entities for the row, column, or grid using the relevant properties sheet. This option enables you to display the short name of the entity in your report, removing the parent portion of the entity that typically displays.
The standard display for an entity using Financial Management is “parent.child.” If you select Short Name for Entities on the relevant properties sheet, the entity displays as “child,” removing the “parent” from the display. For example, an entity that typically displays as “UnitedStates.Connecticut” displays as “Connecticut” when the Short Name for Entities check box is selected.
You may also want to select the alias table you want to use. You can select alias tables in your Analytic Services or Planning Details database connection. Although you may not specify aliases on the grid level, if you display aliases for a row or column, the system displays the alias table as selected on the grid level.
Specifying Row and Column Headings for Grids 117
The heading properties you specify on the grid apply to all rows and columns unless you specify otherwise. For more information on specifying row and column headings, see “Overriding Row and Column Headings for Grids” on page 117.
➤ To define row and column headings for the grid:
1 Open a report and select the grid.
2 Select one of the following member label options:
● Member Name, to show the member name as the heading.
● Alias:Default, to show the alias for a member from a Analytic Services or Planning Details database connection OR Description, to show a description for a member from a Financial Management database connection.
● Both, to show the member name and alias or description as the heading.
Note: The option that is displayed on the Properties sheet changes depending on your type of database connection. For example, if you are using Financial Management as your type of database connection, the Description option is displayed. In this case, the Alias:Default option is not displayed unless you are using a Analytic Services or Planning Details type of database connection.
3 Select a column. The row heading is positioned to the left of the selected column. Columns are represented alphabetically as Column A, Column B, Column C, and so on.
4 Optional: Select the Short Name for Entities check box to display the short name for entities in your Financial Management grid.
5 Optional: Select the Suppress Repeats check box to hide headings for repeating members in a segment.
6 Optional: Select the alias table to use when showing aliases. By default, this option is set to the default alias table for the type of database connection.
Note: Once in the grid, text can be aligned horizontally or vertically. For more information, see “Aligining Text in Text Boxes” on page 178.
Overriding Row and Column Headings for GridsDefining row and column headings enables you to override the heading properties you set for the grid. You can specify one of the following types of headings for rows or columns:
● Member Labels
❍ The member name, which displays the member name as the heading.
❍ The alias or description, which displays the alias or description as the heading.
118 Customizing Grids
❍ The member name and alias or description, which displays the member name and alias or description as the heading.
● Custom Headings
❍ Customized text, which displays the user-defined text as the heading.
❍ Text functions, which uses a text function to get data to display as the heading.
You can also suppress headings for repeating members in a segment. When you suppress headings, only the first instance of the heading for a member that is repeated is displayed. Headings for the additional repeating members are hidden.
➤ To override row and column headings for the grid:
1 Open a report and a formula row or column in the grid.
2 Do one of the following tasks:
● Select Member Labels and then select one of the following member labels options:
❍ Member Name, to display the member name as the heading.
❍ Alias:Default, to display an alias for a member from a Analytic Services or Planning Details database connection OR Description, to display a description for a member from a Financial Management database connection.
❍ Both, to display the member name and alias or description as the heading.
Note: The option that is displayed on the Properties sheet changes depending on your database connection. For example, if you are using Financial Management as your database connection, the Description option is displayed. In this case, the Alias:Default option is not displayed.
● Select Custom Heading and then do one or both of the following tasks:
❍ Enter a user-defined text heading to be displayed as the heading.
Tip: You can enter keyboard returns to create text headings for columns with multiple lines.
❍ Enter a text function, or click the Insert Function button, and select the text function you want to use for displaying data on the headings.
Note: For more information on adding a text function to a row or column heading, see “Using Text Functions to Display Information” on page 154.
3 Optional: Select the Short Name for Entities check box to display the short name for entities in your Financial Management grid.
About Row and Column Templates 119
Note: You must select the entire row or column to display the Suppress Repeats option in the Row and Column property sheets.
About Row and Column TemplatesRow and column templates enable you to select a contiguous set of rows or columns and save them as an object in the repository for reuse in one or more reports.
Working with row and column templates can involve the following tasks:
● Creating a Row and Column Template
● Inserting a Row and Column Template
● Unlinking a Row and Column Template
● Modifying an Row and Column Template
A row and column template comprises one or more row or column definitions. These row or column definitions may contain the following components:
● Database connection/dimension/member selections
● Formula rows and columns
● Expansions
● Headings, including customized formatting
● Text rows and columns, where only the text in the heading cells is saved
● Cell formatting
● Basic suppression (#Missing, #Zero, #Error)
When you create a row and column template, the following items are discarded:
● Cell formulas
● Secondary database connection specifications
● Text from the data cell area (text in the heading cells is retained)
● Conditional formatting
● Related Content
● Conditional suppression
After you create a row and column template, you can save it to the repository, with the following limitations:
● Formulas must refer to rows and columns within the selected rows or columns that comprise the template.
● Formulas outside the row and column template cannot refer to selected rows and columns that comprise or are part of a row and column template.
120 Customizing Grids
Note: Cell format inheritance must be set before creating the row and column template. You can format cells using the Format Cells dialog box. For more information, see “Inheriting Cell Formatting” on page 188. When inheriting formatting within a row and column template, you must use the Inherit Formatting from option on the Row and Column Template properties sheet, which indicates the options that are available for inheritance. For example, suppression, formatting, and row height or column width.
How Inheritance Works with Row and Column TemplatesWhen inheritance is used with linked row and column templates, certain formatting options are dynamic and vary from report to report. When a linked row or column template is used in a grid, the format inheritance is automatically reset to the first available non-template row above the row template or to the left of the column template. If you want to keep the format of a row/ column template consistent, or if you are experiencing formatting inconsistencies with inheritance and row or column templates, you can perform an action:
● Insert a hidden text row/column containing the formatting you wish to show in the row/column template and set the Inherit from on the Property sheet to reference the hidden row or column.
● Do not use inheritance, but rather set the row or column template with formats through the Format Dialog Box.
Property ValuesThe following tables describe the property values that are saved, inherited, or discarded in a row and column template.
Table 26 Saved or Inherited Property Values (User option)
Property Value Description
Row and Column Template database connection Saved by row or column
Heading - Suppress Repeats Saved by row or column
Display Line Item Details Saved by row or column
Headings Saved by row or column
Allow Expansions Saved by row or column
Calculations Saved by row or column
Hide Always Saved by row or column
Positive Number Formatting Saved by cell or inherited by cell - user option
Negative Number Formatting Saved by cell or inherited by cell - user option
Decimal Places Saved by cell or inherited by cell - user option
Scale Value Saved by cell or inherited by cell - user option
Top Border Saved by cell or inherited by cell - user option
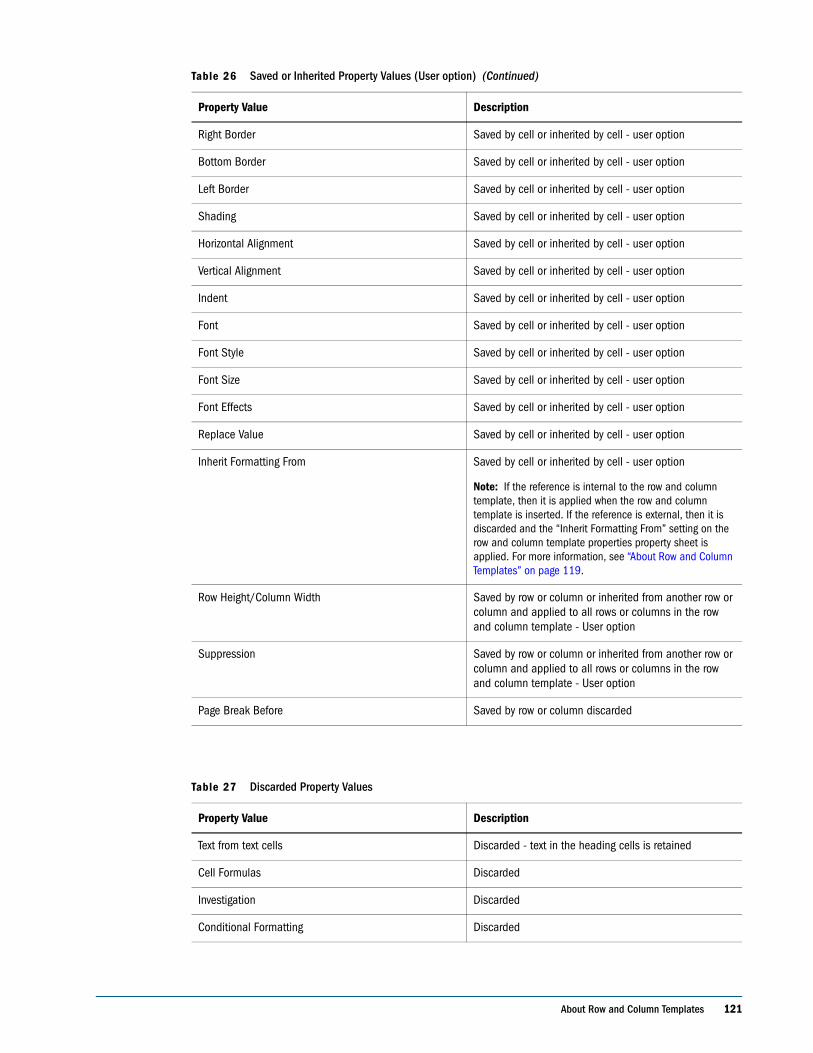
About Row and Column Templates 121
Right Border Saved by cell or inherited by cell - user option
Bottom Border Saved by cell or inherited by cell - user option
Left Border Saved by cell or inherited by cell - user option
Shading Saved by cell or inherited by cell - user option
Horizontal Alignment Saved by cell or inherited by cell - user option
Vertical Alignment Saved by cell or inherited by cell - user option
Indent Saved by cell or inherited by cell - user option
Font Saved by cell or inherited by cell - user option
Font Style Saved by cell or inherited by cell - user option
Font Size Saved by cell or inherited by cell - user option
Font Effects Saved by cell or inherited by cell - user option
Replace Value Saved by cell or inherited by cell - user option
Inherit Formatting From Saved by cell or inherited by cell - user option
Note: If the reference is internal to the row and column template, then it is applied when the row and column template is inserted. If the reference is external, then it is discarded and the “Inherit Formatting From” setting on the row and column template properties property sheet is applied. For more information, see “About Row and Column Templates” on page 119.
Row Height/Column Width Saved by row or column or inherited from another row or column and applied to all rows or columns in the row and column template - User option
Suppression Saved by row or column or inherited from another row or column and applied to all rows or columns in the row and column template - User option
Page Break Before Saved by row or column discarded
Table 27 Discarded Property Values
Property Value Description
Text from text cells Discarded - text in the heading cells is retained
Cell Formulas Discarded
Investigation Discarded
Conditional Formatting Discarded
Table 26 Saved or Inherited Property Values (User option) (Continued)
Property Value Description
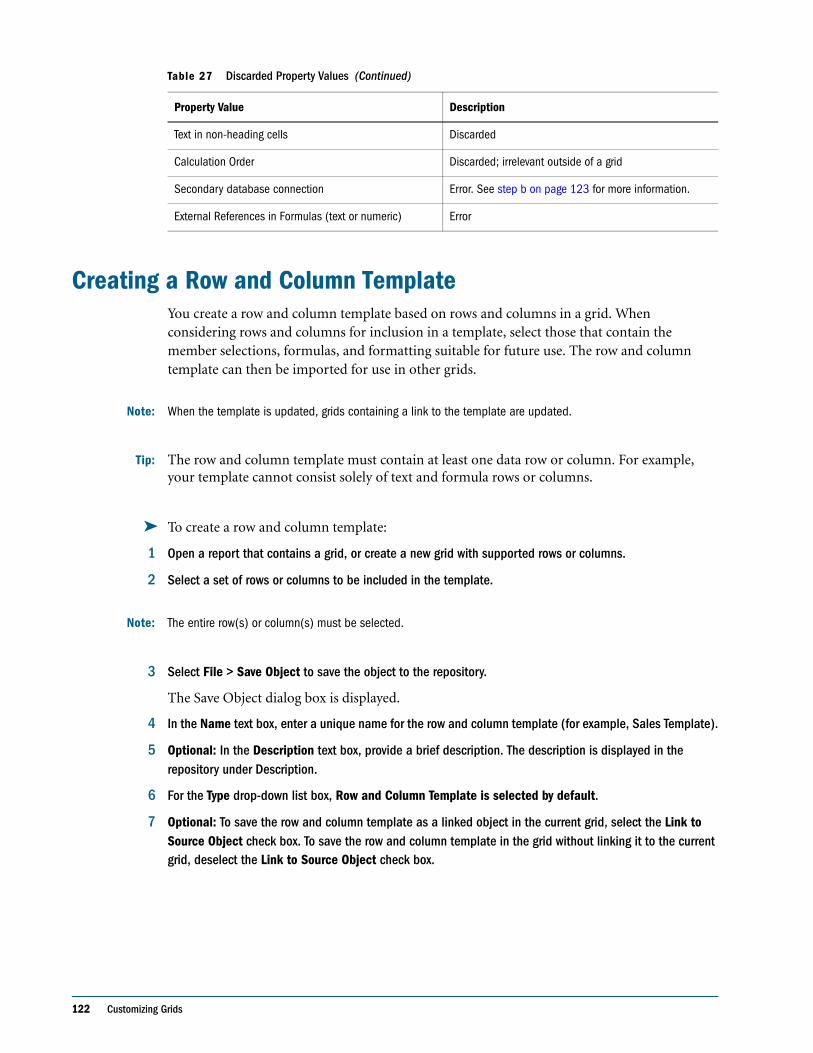
122 Customizing Grids
Creating a Row and Column TemplateYou create a row and column template based on rows and columns in a grid. When considering rows and columns for inclusion in a template, select those that contain the member selections, formulas, and formatting suitable for future use. The row and column template can then be imported for use in other grids.
Note: When the template is updated, grids containing a link to the template are updated.
Tip: The row and column template must contain at least one data row or column. For example, your template cannot consist solely of text and formula rows or columns.
➤ To create a row and column template:
1 Open a report that contains a grid, or create a new grid with supported rows or columns.
2 Select a set of rows or columns to be included in the template.
Note: The entire row(s) or column(s) must be selected.
3 Select File > Save Object to save the object to the repository.
The Save Object dialog box is displayed.
4 In the Name text box, enter a unique name for the row and column template (for example, Sales Template).
5 Optional: In the Description text box, provide a brief description. The description is displayed in the repository under Description.
6 For the Type drop-down list box, Row and Column Template is selected by default.
7 Optional: To save the row and column template as a linked object in the current grid, select the Link to Source Object check box. To save the row and column template in the grid without linking it to the current grid, deselect the Link to Source Object check box.
Text in non-heading cells Discarded
Calculation Order Discarded; irrelevant outside of a grid
Secondary database connection Error. See step b on page 123 for more information.
External References in Formulas (text or numeric) Error
Table 27 Discarded Property Values (Continued)
Property Value Description
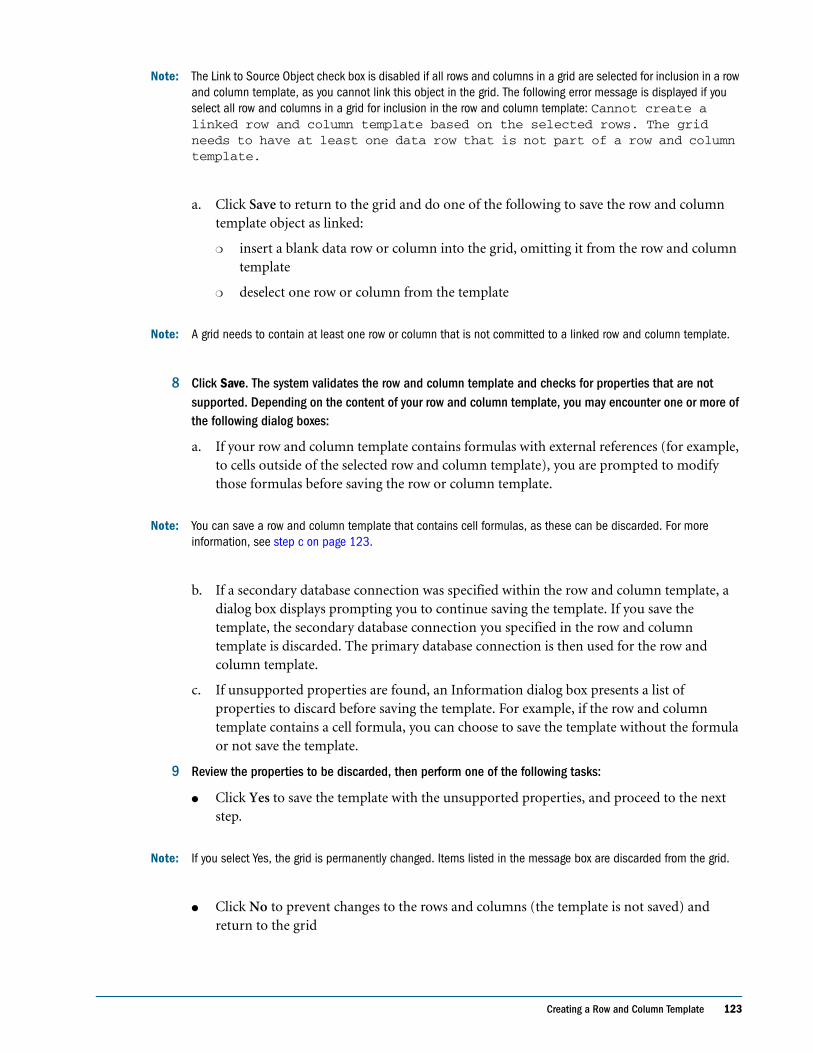
Creating a Row and Column Template 123
Note: The Link to Source Object check box is disabled if all rows and columns in a grid are selected for inclusion in a row and column template, as you cannot link this object in the grid. The following error message is displayed if you select all row and columns in a grid for inclusion in the row and column template: Cannot create a linked row and column template based on the selected rows. The grid needs to have at least one data row that is not part of a row and column template.
a. Click Save to return to the grid and do one of the following to save the row and column template object as linked:
❍ insert a blank data row or column into the grid, omitting it from the row and column template
❍ deselect one row or column from the template
Note: A grid needs to contain at least one row or column that is not committed to a linked row and column template.
8 Click Save. The system validates the row and column template and checks for properties that are not supported. Depending on the content of your row and column template, you may encounter one or more of the following dialog boxes:
a. If your row and column template contains formulas with external references (for example, to cells outside of the selected row and column template), you are prompted to modify those formulas before saving the row or column template.
Note: You can save a row and column template that contains cell formulas, as these can be discarded. For more information, see step c on page 123.
b. If a secondary database connection was specified within the row and column template, a dialog box displays prompting you to continue saving the template. If you save the template, the secondary database connection you specified in the row and column template is discarded. The primary database connection is then used for the row and column template.
c. If unsupported properties are found, an Information dialog box presents a list of properties to discard before saving the template. For example, if the row and column template contains a cell formula, you can choose to save the template without the formula or not save the template.
9 Review the properties to be discarded, then perform one of the following tasks:
● Click Yes to save the template with the unsupported properties, and proceed to the next step.
Note: If you select Yes, the grid is permanently changed. Items listed in the message box are discarded from the grid.
● Click No to prevent changes to the rows and columns (the template is not saved) and return to the grid
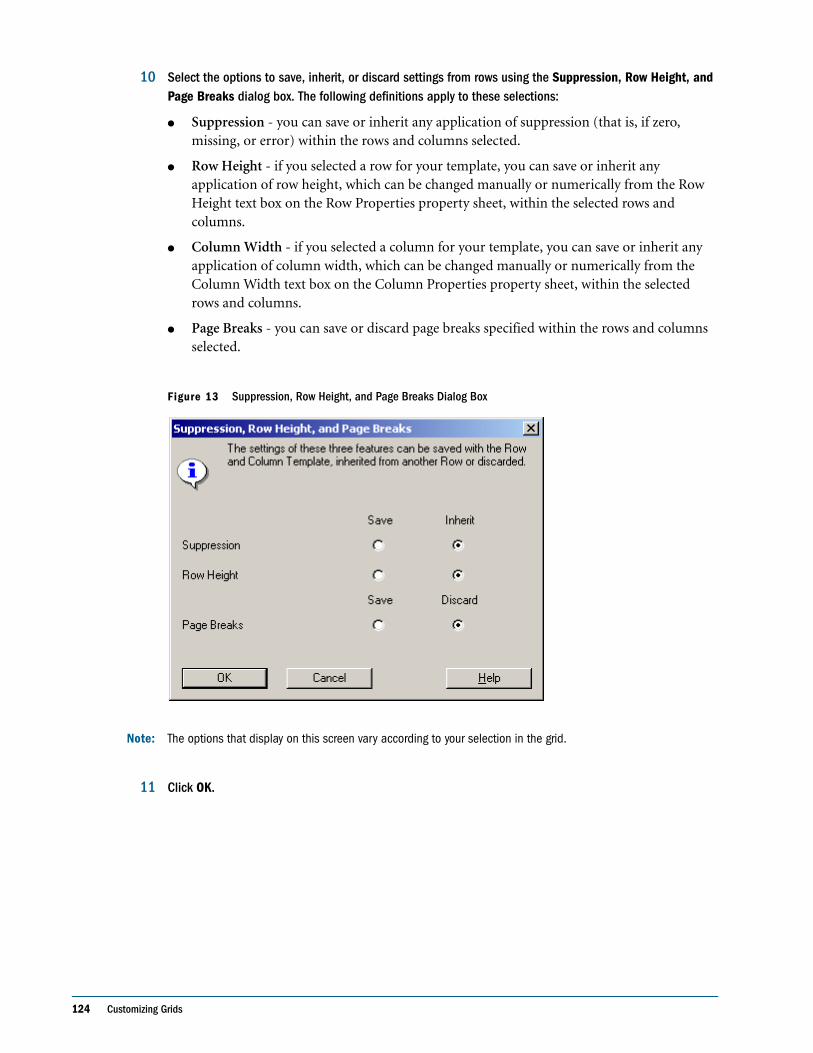
124 Customizing Grids
10 Select the options to save, inherit, or discard settings from rows using the Suppression, Row Height, and Page Breaks dialog box. The following definitions apply to these selections:
● Suppression - you can save or inherit any application of suppression (that is, if zero, missing, or error) within the rows and columns selected.
● Row Height - if you selected a row for your template, you can save or inherit any application of row height, which can be changed manually or numerically from the Row Height text box on the Row Properties property sheet, within the selected rows and columns.
● Column Width - if you selected a column for your template, you can save or inherit any application of column width, which can be changed manually or numerically from the Column Width text box on the Column Properties property sheet, within the selected rows and columns.
● Page Breaks - you can save or discard page breaks specified within the rows and columns selected.
Figure 13 Suppression, Row Height, and Page Breaks Dialog Box
Note: The options that display on this screen vary according to your selection in the grid.
11 Click OK.
Unlinking a Row and Column Template 125
Inserting a Row and Column TemplateAfter saving the row and column template to the repository as an object, you can insert it into an unlimited number of compatible grids. When a row or column template is inserted into a report, formulas outside of the template are adjusted accordingly. Only formulas within a grid are updated; not external formulas, which refer to the grid with the template, from text objects or another grid.
➤ To insert a row and column template:
1 Open a report and select a row or column adjacent to which you want to insert the row and column template.
Note: Row templates are inserted below the selected row. Column templates are inserted to the left of the selected cell.
2 Select Insert > Saved Object. The Insert Saved Object dialog box is displayed with a view of the Explore repository.
3 Select the row and column template to insert.
4 To link or unlink a row and column template to or from the repository as an object, perform an action:
● To create a link between the report and the template in the repository, select Link to Source Object. You can link the row and column template to the current grid so that the grid maintains a dynamic connection to the row and column template preserved in the repository.
Note: A template that is linked within a grid can only be modified through format inheritance. For more information, see “Inheriting Cell Formatting” on page 188.
● To use the template in the report without maintaining a dynamic link to the source object in the Explore repository, clear Link to Source Object. For more information, see “Unlinking a Row and Column Template” on page 125.
5 Click Insert.
Note: In a grid on a report, a row and column template is marked with yellow heading cells. Dynamic linking is displayed on the Row and Column Template Properties property sheet.
Unlinking a Row and Column TemplateAfter inserting a row and column template into a grid, you can unlink it. This enables you to use the row and column template as a structural template rather than a dynamically connected replica of the row and column template in the repository.
When you unlink a row and column template, the rows and columns in the template are converted into standard, unlinked rows and columns.
126 Customizing Grids
➤ To unlink a row and column template:
1 Open a report that contains a grid with a row and column template inserted.
2 Select the row and column template to unlink.
3 On the Row and Column Template Properties property sheet, clear the Link to Source Object check box.
4 When an Information dialog box asks whether to unlink this object, click Yes.
Modifying an Row and Column TemplateYou can modify a row and column template using one of the following methods:
● Create a new row and column template and save it using the same name as a row and column template located in the repository. For more information, see “Creating a Row and Column Template” on page 122.
● Unlink a row and column template from a grid, then modify and save it to the repository using the same name and folder of the row and column template in the repository.
Note: Either methods replace the original row and column template in the repository.
➤ To modify a row and column template by unlinking a row and column template:
1 Open a report and create a grid.
2 Select and unlink a row and column template from the repository, inserting the rows and columns into your grid. For more information, see “Unlinking a Row and Column Template” on page 125.
Note: Unlinking the template from the repository dissolves the template and inserts the rows and columns that comprised the template into your grid.
3 Modify the rows and columns as needed.
4 Save the row and column template to the repository using the same name and folder as the row and column template you want to replace.
5 Click OK to confirm the replacement of the original row and column template.
Setting Data Query Optimization OptionsWhen working with grids, you can set data query optimization options to enable you to optimize the efficiency of your specified data queries.
Because data queries extract one or more values from a multidimensional database connection, it is beneficial to speed up this process using the data query optimization settings. For example, you can specify suppression options on your servers and include or exclude the
Setting Data Query Optimization Options 127
Analytic Services sparse command, which is used to address the low probability that data exists for every combination of dimension members. For example, a dimension is sparse when intersections of data are empty.
You can also optimize certain types of Analytic Services and Workforce Planning Attribute dimension retrievals
Note: Using Workforce Planning, a dimension can have attribute associations that change across time periods or other dimensions. For example, an attribute dimension of “Status” associated with an “Employee” dimension allows for the change of employee status over time; In January, John Smith has the status of “Full Time”, in March his status changes to “Part Time”.
For reports with a sparse dimension and at least one of its associated attribute dimensions in the grid row, an option to optimize the query is added. Before the query is run, metadata queries are performed to determine the Attribute members associated with each Sparse dimension member. Because the filtering is performed before the query, when the query is executed, a smaller metadata set and combinations are used. This can result in retrieval performance improvement. Please note that the attribute dimension retrieval optimization only applies to reports with a sparse dimension with its associated attribute dimensions in the grid row.
The Attribute Query Optimization is applied only when the Analytic Services client and server versions are Release 7.1.2 or later and the preceding conditions are met. Also, note the following information:
● This option is displayed in Data Query Optimization if a release of Analytic Services prior to Release 7.1.2 is installed on the client and/or server. In this case, the Attribute Optimization does not function.
● This option also appears in Data Query Optimization if a Dense dimension and an Attribute dimension appear in the rows, without a Base (Sparse) dimension. In this case, the Attribute Optimization does not return data.
● Attribute Optimization only returns level 0 Attribute members. Parent Attribute member is not included in the query results if Attribute Optimization is enabled.
➤ To set data query optimization options:
1 Open or create a report that contains a grid.
2 Click Task > Data Query Optimization Settings. See Data Query Optimization Settings dialog box below with asymetric columns enabled.
Note: The options that display in the Data Query Optimization Setting dialog box, depend on your column selection and the type of database connection you are using. For example, The Asymmetric Columns Consolidation option is only displayed when two dimensions are on the column and there are more than four data columns in the grid. The Analytic Services Sparse Command option is only displayed when Analytic Services is the database connection.
Note: The ability to suppress rows can be applied to any data source (Financial Management, Planning, SAP BW, and Analytic Services). All other options on this dialog box apply to Analytic Services only.
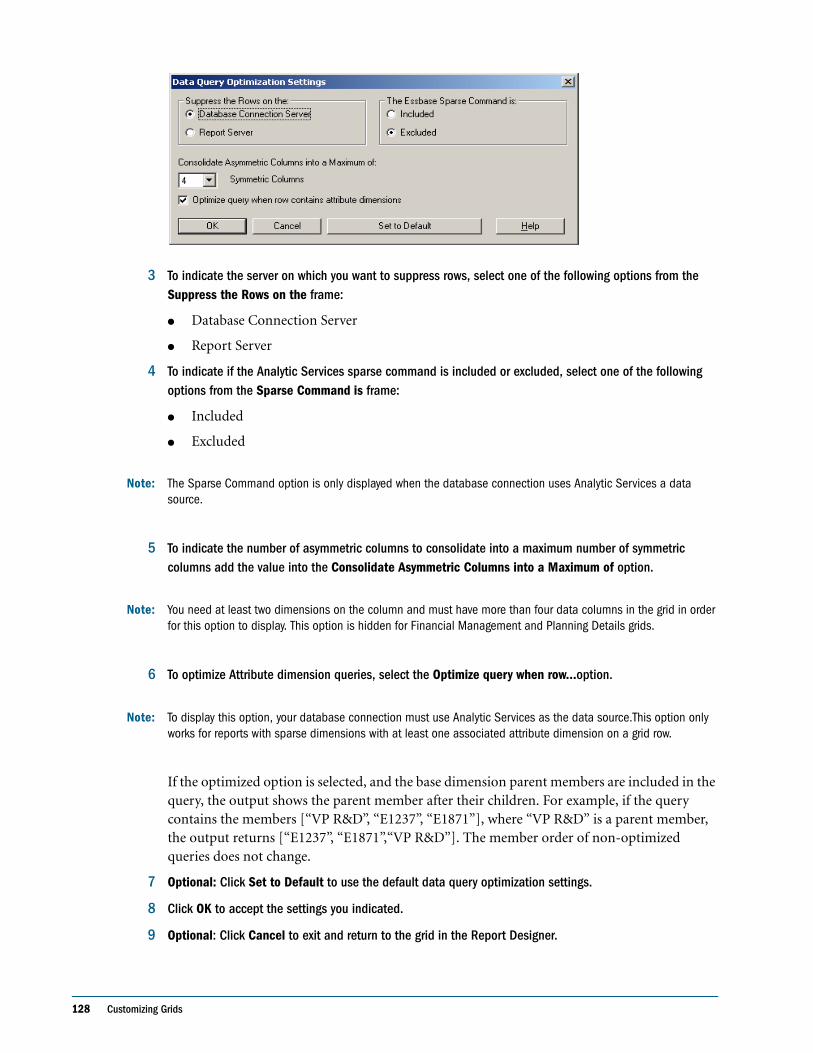
128 Customizing Grids
3 To indicate the server on which you want to suppress rows, select one of the following options from the Suppress the Rows on the frame:
● Database Connection Server
● Report Server
4 To indicate if the Analytic Services sparse command is included or excluded, select one of the following options from the Sparse Command is frame:
● Included
● Excluded
Note: The Sparse Command option is only displayed when the database connection uses Analytic Services a data source.
5 To indicate the number of asymmetric columns to consolidate into a maximum number of symmetric columns add the value into the Consolidate Asymmetric Columns into a Maximum of option.
Note: You need at least two dimensions on the column and must have more than four data columns in the grid in order for this option to display. This option is hidden for Financial Management and Planning Details grids.
6 To optimize Attribute dimension queries, select the Optimize query when row...option.
Note: To display this option, your database connection must use Analytic Services as the data source.This option only works for reports with sparse dimensions with at least one associated attribute dimension on a grid row.
If the optimized option is selected, and the base dimension parent members are included in the query, the output shows the parent member after their children. For example, if the query contains the members [“VP R&D”, “E1237”, “E1871”], where “VP R&D” is a parent member, the output returns [“E1237”, “E1871”,“VP R&D”]. The member order of non-optimized queries does not change.
7 Optional: Click Set to Default to use the default data query optimization settings.
8 Click OK to accept the settings you indicated.
9 Optional: Click Cancel to exit and return to the grid in the Report Designer.
Showing Supporting Detail for Planning 129
Enabling Expansions for Analytic ServicesFor Analytic Services database connections, a Analytic Services user can enable expansions for Hybrid Data. Hybrid Data is stored outside a Analytic Services cube in a relational database. This enables report viewers to include Hybrid Data in their report. For more information on setting up access to detail data within reports, see Chapter 7, “Providing for Detailed Data and Documents in Reports.”
Displaying Line Item Detail for Financial ManagementFor Financial Management database connections, a Financial Management user can select if they want to display line item detail for rows only on Account dimensions. A user can also select the location of the line item detail; before or after the parent member of the line item detail. To display line item detail, all dimensions must be set to a Level 0 member.
➤ To display line item detail for Financial Management:
1 Open a report and select a row in the grid.
2 In the Row Properties Sheet, select Display Line Item Details.
3 Optional: On the Grid Properties sheet, select the Position category and do one of the following in the Position of Line Item Detail box:
● To display line item detail before the parent member, click Before Members.
● To display line item detail after the parent member, click After Members. This is the default.
Showing Supporting Detail for PlanningWhen using the Planning Details database connection, and selecting a row, you can display supporting detail for a member. If supporting detail exists for one or more cells in the selected row, additional rows are inserted to show the supporting detail. In addition, you can control whether a page break is allowed within the rows of supporting detail.
➤ To show supporting detail for the Planning Details database connection:
1 Open a report and select a row in the grid that contains a member with supporting detail.
2 In the Row Properties sheet, select Display Supporting Details.
3 Specify whether to allow page breaks with the rows of supporting detail:
● To allow a page break within the rows of supporting detail, select the Allow Page Break Within check box.
● To keep the parent member and the supporting detail on the same page, deselect the Allow Page Break Within check box. If the supporting detail does not fit on the current page, the parent member and supporting detail is moved to the next page.
130 Customizing Grids
Note: If the supporting detail spans multiple pages, this option defaults to Allow Page Break Within and page breaks are used.
4 Optional: To position the supporting detail before or after the parent member, select the Grid Properties sheet, select the Position category and select an option in the Position of Supporting Detail box:
● To display supporting detail before the parent member, click Before Members.
● To display supporting detail after the parent member, click After Members. This is the default.
5 Optional: To indent each generation within the supporting detail:
a. Select the heading cell of the member that is going to display the supporting detail.
b. Select Format > Cells > Alignment tab.
c. In the Indent Increases for Each Generation by box, select a number by which you want to indent each generation in the supporting detail list.
Note: This property applies only to heading cells on the rows. It is enabled for Planning Details type of database connection only when Display Supporting Detail is selected. For more information on formatting, see Chapter 9, “Formatting Reports.”
6 Optional: To apply additional formatting to supporting detail, use conditional formatting. The following two options are useful for supporting detail:
● Supporting Detail. If, at runtime, supporting detail results from a cell, you can format the supporting detail.
● Relative Generation. You can format the different generations of supporting detail independently. For example, if the resulting hierarchy of a member includes four generations of supporting detail, you can specify the third generation to format. The conditions would resemble the following example:
Note: In order for all types of database connections to use relative generation, you must have selected a member relationship that returns members on multiple levels; for example, Children of...(Inclusive), Descendants of..., Descendants of ...(Inclusive), Parents of...(Inclusive), Ancestors of, Ancestors of...(Inclusive), and AllMembers. For Planning Details, you may use relative generation with a member or dynamic member if supporting detail is turned on.
Condition 1: IfSupporting Detail Is True AndRelative Generation (of) Market = 3
Note: For more information, see “About Conditional Formatting” on page 193.
Defining the Grid Point of View 131
Defining the Grid Point of ViewThe grid point of view (POV) enables designers to specify the members for a dimension on a grid without placing the dimension on the row, column, or page intersection. After a dimension is specified on the grid POV, the designer determines the ways that the viewer can select members, as follows:
● Any member. The viewer can select any member for the dimension.
● A member from list. The viewer can select from a limited list of members that the designer previously defines.
● Nothing, Lock Member Selection. The viewer cannot select any member for the dimension.
Note: To improve report performance, do not use dimensions with only one member selected (for the entire grid) into a row, column, or page axis. Although, it does not increase the potential cell count, it adds overhead to the entire query. Dimensions that are variable or set to one member should be left in the POV. For variable members, include the user POV and for fixed members, include the grid POV. The rules for each database connection for a grid are as follows: - If the dimension is on a grid axis (row, column, or page), use the member selected for that dimension. - If the dimension is set on the grid POV, use the member selected for the grid POV dimension. - Use the member selected for the user POV dimension.
Showing or Hiding the Grid POV BarAs a report designer, you can hide or display the grid POV bar. Hiding the grid POV prohibits you from changing the grid POV when viewing a report. By default, the grid POV bar is hidden. However, even when a POV bar is hidden, its values are still operative when running the report.
➤ To show or hide a grid POV bar:
1 Open a report.
2 Select the grid for which you want to show or hide its grid POV bar.
3 Do one of the following tasks in the Grid Properties sheet:
● To show the grid POV, select the Grid Point of View check box.
● To hide the grid POV, deselect the Grid Point of View check box.
Tip: As an alternative, you can also select a grid, right-click inside the grid, and select Grid Point of View.
132 Customizing Grids
Selecting Members for the Grid Point of ViewOn the grid point of view (POV) bar you can select members for dimensions that are not used in rows, columns, or the page axis. The members defined on the POV bar complete the criteria used to retrieve data for the grid. Each POV dimension can contain only one member.
Note: For Analytic Services and Planning database connections, Hyperion recommends excluding dimensions with security on it in the Grid POV since it may cause unexpected results for end users.
➤ To select a POV member for the grid POV:
1 Open a report.
2 To display the grid POVs, select Grid Point of View from the Grid Properties sheet.
3 On the grid POV, click on a dimension to display the Select Members dialog box.
4 In the Select Members dialog box, each dimension in displayed on a separate tab. Select the dimension listed on the tab, then select an associated member. Repeat for all dimension on the tabs.
5 Click OK. The members are displayed on the grid POV.
Setting Up a Grid Point of ViewA designer can set up a grid point of view (POV), to control or limit the selection of members available to end users who view or print the report.
For more information, see Chapter 2, “Selecting Members for Report Designers.”
➤ To set up a grid POV:
1 Open a report with members selected for dimensions on the grid POV.
2 Right-click a grid and select Grid Point of View Setup.
3 For each dimension presented in the dialog box, you can specify the availability of member selection to the end user:
● Any Member - All members are available.
● A Member from List - Only the members you specify are available. Click the click the
Lookup button, , in the Choices List column. The Select Members dialog box is displayed.
● Nothing, Lock Member Selection for a specific dimension - No members a re available.
4 When the Report Viewers May Select column is set to A Member from List, Select a member from the Select Members dialog box, then click OK. For more information on selecting members, see Chapter 2, “Selecting Members for Report Designers.”
5 Select the Show Dimension Name and Show Member Name check box to display the dimension name with the member name.
6 Select the Show Alias check box to display alias names.
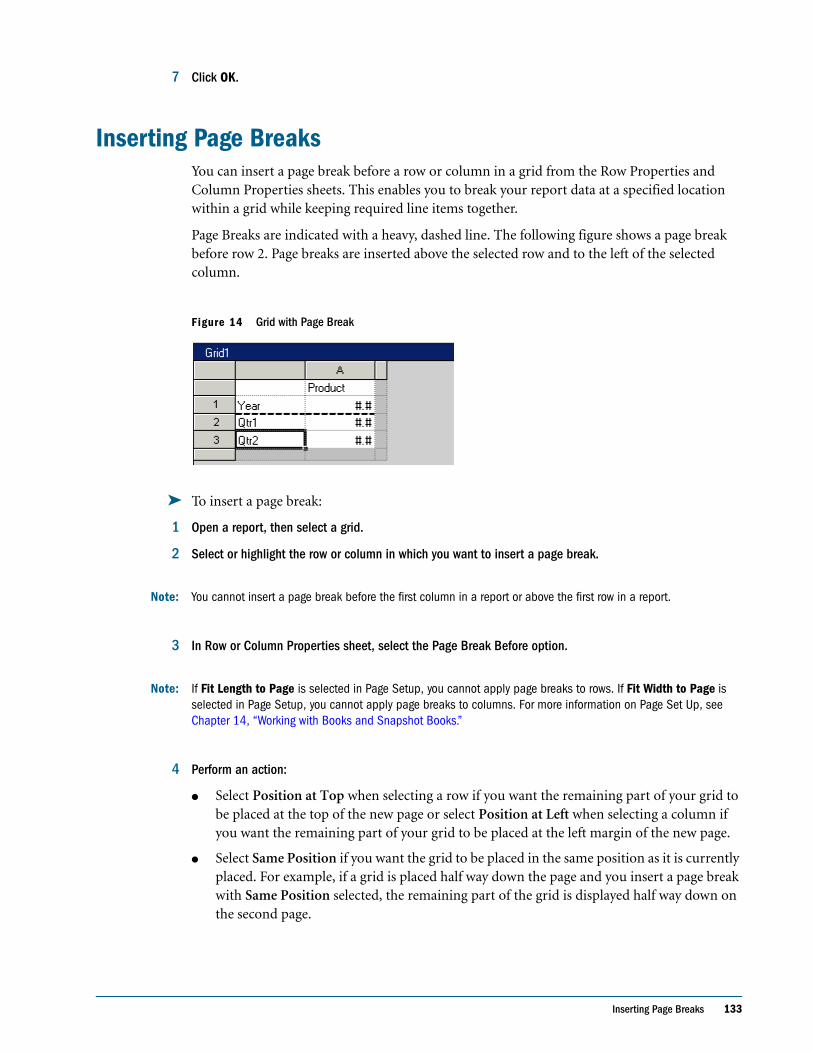
Inserting Page Breaks 133
7 Click OK.
Inserting Page BreaksYou can insert a page break before a row or column in a grid from the Row Properties and Column Properties sheets. This enables you to break your report data at a specified location within a grid while keeping required line items together.
Page Breaks are indicated with a heavy, dashed line. The following figure shows a page break before row 2. Page breaks are inserted above the selected row and to the left of the selected column.
Figure 14 Grid with Page Break
➤ To insert a page break:
1 Open a report, then select a grid.
2 Select or highlight the row or column in which you want to insert a page break.
Note: You cannot insert a page break before the first column in a report or above the first row in a report.
3 In Row or Column Properties sheet, select the Page Break Before option.
Note: If Fit Length to Page is selected in Page Setup, you cannot apply page breaks to rows. If Fit Width to Page is selected in Page Setup, you cannot apply page breaks to columns. For more information on Page Set Up, see Chapter 14, “Working with Books and Snapshot Books.”
4 Perform an action:
● Select Position at Top when selecting a row if you want the remaining part of your grid to be placed at the top of the new page or select Position at Left when selecting a column if you want the remaining part of your grid to be placed at the left margin of the new page.
● Select Same Position if you want the grid to be placed in the same position as it is currently placed. For example, if a grid is placed half way down the page and you insert a page break with Same Position selected, the remaining part of the grid is displayed half way down on the second page.
134 Customizing Grids
Defining Page Axis HeadingsA page axis heading prints the member name every time the page member changes. Members on the page axis can have their own custom heading.
For more information on printing the page dimension heading, see “Printing Page Dimension Headings” on page 175.
You specify how to print the page dimension heading using the following options:
➤ To define a page dimension heading:
1 Open a report and select the Pages list box on the grid.
2 On the Page Properties sheet, in the Headings area, select a dimension.
3 Do one of the following tasks:
● Select Member Labels and then select one of the following member labels options:
❍ Member Name, to display the member name as the heading.
❍ Alias:Default, to display an alias for a member from an Analytic Services or Planning Details database connection OR Description, to display a description for a member from a Financial Management database connection.
❍ Both, to display the member name and alias or description as the heading.
Note: The option that is displayed on the Properties sheet changes depending on your database connection. For example, if you are using Financial Management as your database connection, the Description option is displayed. In this case, the Alias:Default option is not displayed.
Table 28 Options for Page Dimension Headings
Option Description
New page, Position at Top
Prints a new page at the top of the next page. Use this option when chart is linked to a grid and you want to ensure the chart and grid print next to one another whenever the page member changes.
New page, Position Same
Prints a page at the specified grid location. Use this option in the following situations:
● The grid has horizontal and/or vertical alignment properties set and you want the grid to print in the same position on each page. For example, if you set the Grid position to Center/Middle, it is printed in the center of each page.
● When a chart is linked to a grid and you want to ensure the chart and grid print next to one another whenever the page member changes.
Same Page Prints the new page immediately after the data from the previous page.
Note: When a chart linked to a grid, the chart is printed once. The chart is not printed every time the page member changes.
Changing the Database Connection of Grids 135
● Select Custom Heading and then do one or both of the following tasks:
❍ Enter a user-defined text heading to be displayed as the heading.
Tip: You can enter keyboard returns to create text headings for columns with multiple lines.
❍ Enter a text function, or click the Insert Function button, and specify a text function to use a text function to get data to be displayed on the headings.
Note: For more information on adding a text function to a row or column heading, see “Using Text Functions to Display Information” on page 154.
4 Optional: To set formatting options, click the Format button.
5 Specify a height for the header.
6 In the Page Printing Positioning Option area, select one of the following options:
● New Page - Top
● New Page - Same
● Same Page
Note: For definitions of the Page Printing Positioning options, see Table 28 on page 134.
Changing the Database Connection of GridsWhen you change the database connection of a grid, you display data from another source. Because the dimension names for the new database may differ from the default database, the administrator needs to prepare a mapping schema to maintain the integrity of the data structure. If the structure of the specified database connection differs from that of the current database connection, the report cannot repopulate.
➤ To change the database connection of a grid:
1 Open a report and select a grid.
2 Select File > Change Database Connection.
3 The Change Database Connection in... dialog box is displayed.
4 In the Find all references to the database connection drop-down list, select the database connection you want to change.
5 In the Replace With drop-down list, select a database connection.
Note: If you want to create another database connection, select the New Database Connection button. For information on adding another database connection, see Chapter 11, “Managing the Explore Repository.”
136 Customizing Grids
Assigning Multiple Database Connection to GridsYou can populate a grid with data from multiple database connections. After you define a grid’s initial database connection and dimension layout, you can change the database connection for one or more rows or columns of the grid. You can define another database connection for each data row or data column.
You can preserve the members selected in the grid when changing database connections on a grid row or column. You must map all dimensions that are assigned to rows or columns in a grid from the current database connection to the new database connection. Dimensions on the point of view (POV) need not to be mapped.
➤ To assign multiple database connections to a grid:
1 Open a report.
2 In a grid, select one or more data rows or columns for which you want to change the database connection.
3 In the Row or Column Properties sheet, click the Select Database Connection button, .
4 In the Select a Database Connection dialog box, select a database connection from the Database Connection drop-down list, then Click OK.
Note: If you want to create another database connection, select the New Database Connection button. For information on adding another database connection, see Chapter 11, “Managing the Explore Repository.”
5 In the Map Dimensions Between... dialog box, map dimensions between the default database connection and the selected database connection. You do this by selecting a dimension from the pull-down list in the right column for each dimension in the left column.
6 Optional: Select an alias table for the new database connection.
7 Click OK.
Adding Auto Calculations to Data Rows and ColumnsYou can append auto calculations to the data rows and columns of your grids. For example, you might want to calculate the total of rows or columns that expand and contain multiple dimensions.
When you define an auto calculation for a data row or column, a row or column is inserted at runtime that contains the calculated value. This calculation goes against all members in a row or column and is displayed when you print or preview the report.
You can apply several formatting options. For each auto calculation, you can specify a heading for the calculated row or column and a group heading. You can specify the location of the calculation row or column in relation to the member, and you can insert blank rows before and after calculation rows and group headings. You can also specify page breaks within rows of calculation and after a calculation row.
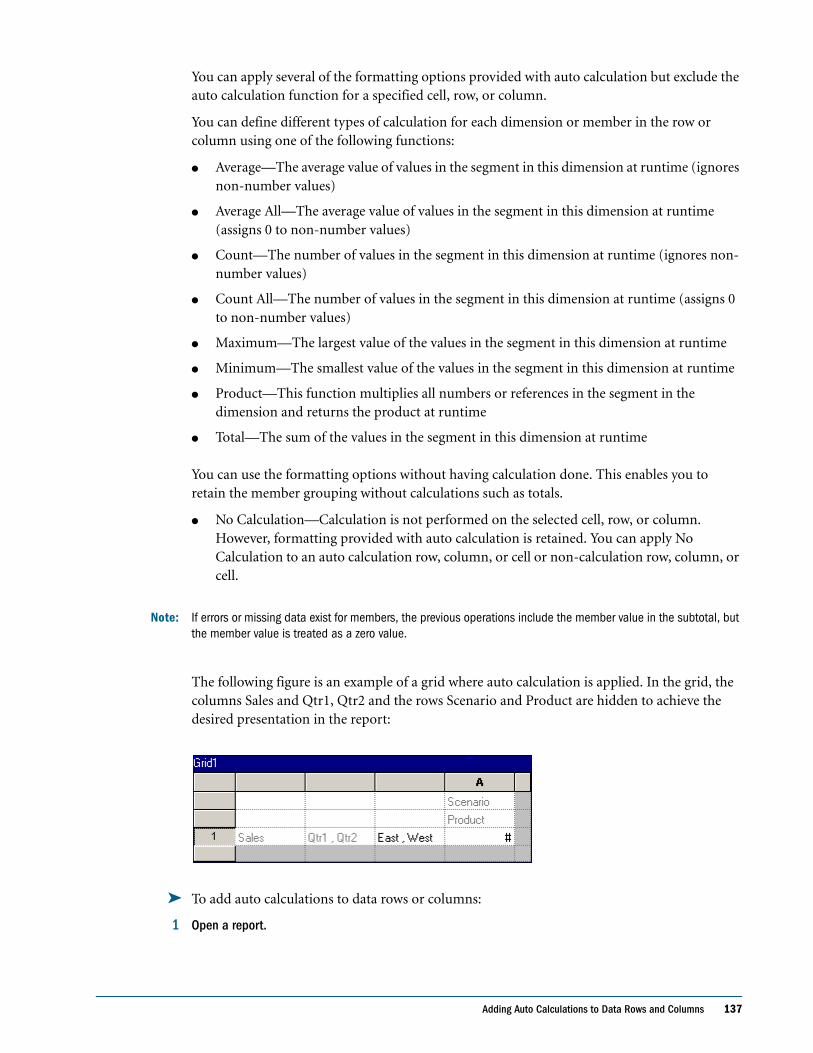
Adding Auto Calculations to Data Rows and Columns 137
You can apply several of the formatting options provided with auto calculation but exclude the auto calculation function for a specified cell, row, or column.
You can define different types of calculation for each dimension or member in the row or column using one of the following functions:
● Average—The average value of values in the segment in this dimension at runtime (ignores non-number values)
● Average All—The average value of values in the segment in this dimension at runtime (assigns 0 to non-number values)
● Count—The number of values in the segment in this dimension at runtime (ignores non-number values)
● Count All—The number of values in the segment in this dimension at runtime (assigns 0 to non-number values)
● Maximum—The largest value of the values in the segment in this dimension at runtime
● Minimum—The smallest value of the values in the segment in this dimension at runtime
● Product—This function multiplies all numbers or references in the segment in the dimension and returns the product at runtime
● Total—The sum of the values in the segment in this dimension at runtime
You can use the formatting options without having calculation done. This enables you to retain the member grouping without calculations such as totals.
● No Calculation—Calculation is not performed on the selected cell, row, or column. However, formatting provided with auto calculation is retained. You can apply No Calculation to an auto calculation row, column, or cell or non-calculation row, column, or cell.
Note: If errors or missing data exist for members, the previous operations include the member value in the subtotal, but the member value is treated as a zero value.
The following figure is an example of a grid where auto calculation is applied. In the grid, the columns Sales and Qtr1, Qtr2 and the rows Scenario and Product are hidden to achieve the desired presentation in the report:
➤ To add auto calculations to data rows or columns:
1 Open a report.
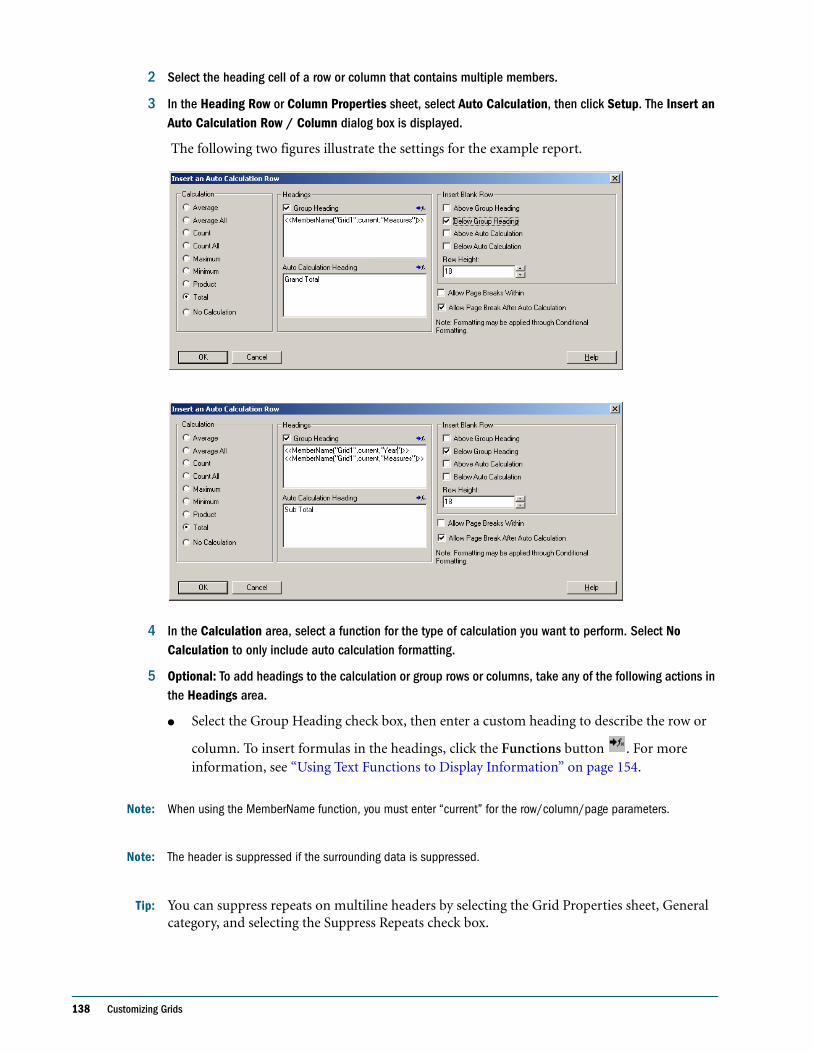
138 Customizing Grids
2 Select the heading cell of a row or column that contains multiple members.
3 In the Heading Row or Column Properties sheet, select Auto Calculation, then click Setup. The Insert an Auto Calculation Row / Column dialog box is displayed.
The following two figures illustrate the settings for the example report.
4 In the Calculation area, select a function for the type of calculation you want to perform. Select No Calculation to only include auto calculation formatting.
5 Optional: To add headings to the calculation or group rows or columns, take any of the following actions in the Headings area.
● Select the Group Heading check box, then enter a custom heading to describe the row or
column. To insert formulas in the headings, click the Functions button . For more information, see “Using Text Functions to Display Information” on page 154.
Note: When using the MemberName function, you must enter “current” for the row/column/page parameters.
Note: The header is suppressed if the surrounding data is suppressed.
Tip: You can suppress repeats on multiline headers by selecting the Grid Properties sheet, General category, and selecting the Suppress Repeats check box.
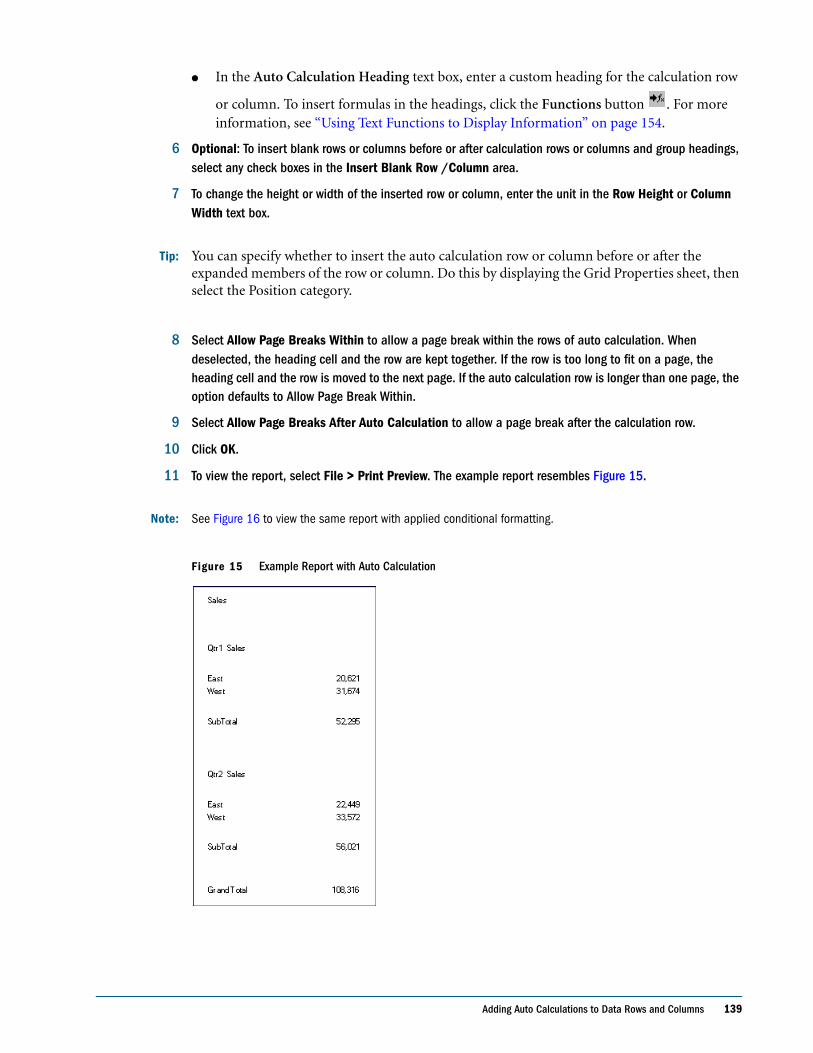
Adding Auto Calculations to Data Rows and Columns 139
● In the Auto Calculation Heading text box, enter a custom heading for the calculation row
or column. To insert formulas in the headings, click the Functions button . For more information, see “Using Text Functions to Display Information” on page 154.
6 Optional: To insert blank rows or columns before or after calculation rows or columns and group headings, select any check boxes in the Insert Blank Row /Column area.
7 To change the height or width of the inserted row or column, enter the unit in the Row Height or Column Width text box.
Tip: You can specify whether to insert the auto calculation row or column before or after the expanded members of the row or column. Do this by displaying the Grid Properties sheet, then select the Position category.
8 Select Allow Page Breaks Within to allow a page break within the rows of auto calculation. When deselected, the heading cell and the row are kept together. If the row is too long to fit on a page, the heading cell and the row is moved to the next page. If the auto calculation row is longer than one page, the option defaults to Allow Page Break Within.
9 Select Allow Page Breaks After Auto Calculation to allow a page break after the calculation row.
10 Click OK.
11 To view the report, select File > Print Preview. The example report resembles Figure 15.
Note: See Figure 16 to view the same report with applied conditional formatting.
Figure 15 Example Report with Auto Calculation
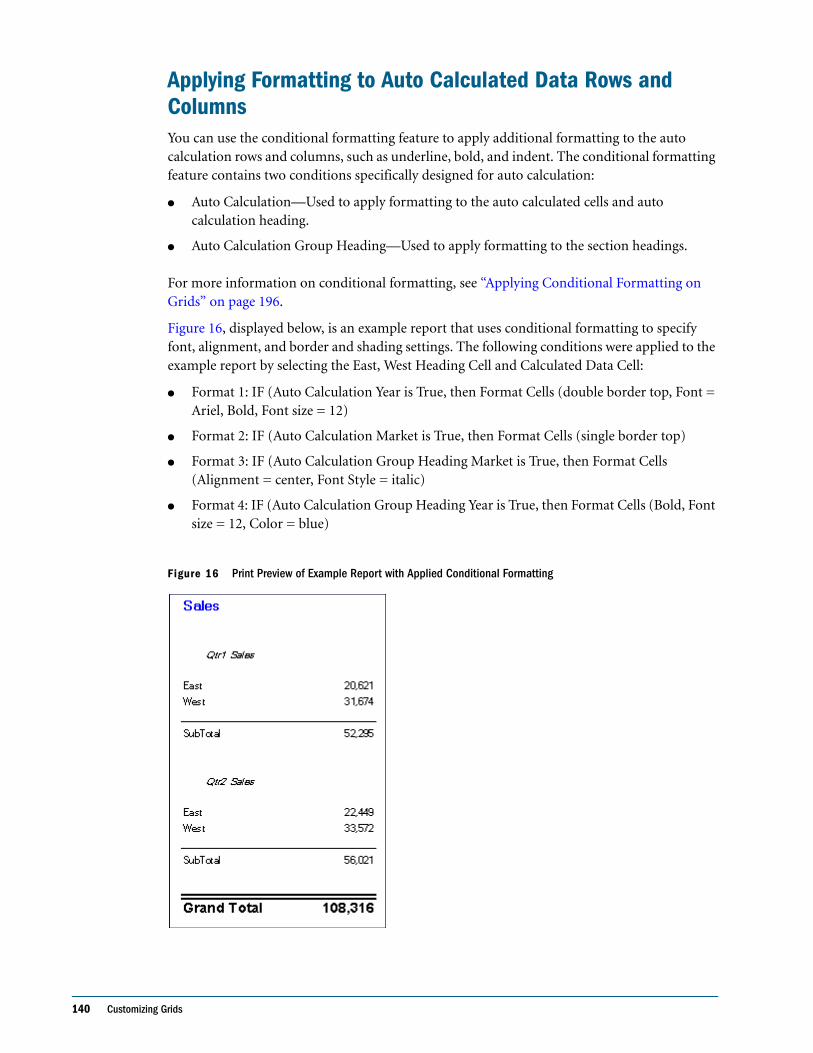
140 Customizing Grids
Applying Formatting to Auto Calculated Data Rows and ColumnsYou can use the conditional formatting feature to apply additional formatting to the auto calculation rows and columns, such as underline, bold, and indent. The conditional formatting feature contains two conditions specifically designed for auto calculation:
● Auto Calculation—Used to apply formatting to the auto calculated cells and auto calculation heading.
● Auto Calculation Group Heading—Used to apply formatting to the section headings.
For more information on conditional formatting, see “Applying Conditional Formatting on Grids” on page 196.
Figure 16, displayed below, is an example report that uses conditional formatting to specify font, alignment, and border and shading settings. The following conditions were applied to the example report by selecting the East, West Heading Cell and Calculated Data Cell:
● Format 1: IF (Auto Calculation Year is True, then Format Cells (double border top, Font = Ariel, Bold, Font size = 12)
● Format 2: IF (Auto Calculation Market is True, then Format Cells (single border top)
● Format 3: IF (Auto Calculation Group Heading Market is True, then Format Cells (Alignment = center, Font Style = italic)
● Format 4: IF (Auto Calculation Group Heading Year is True, then Format Cells (Bold, Font size = 12, Color = blue)
Figure 16 Print Preview of Example Report with Applied Conditional Formatting
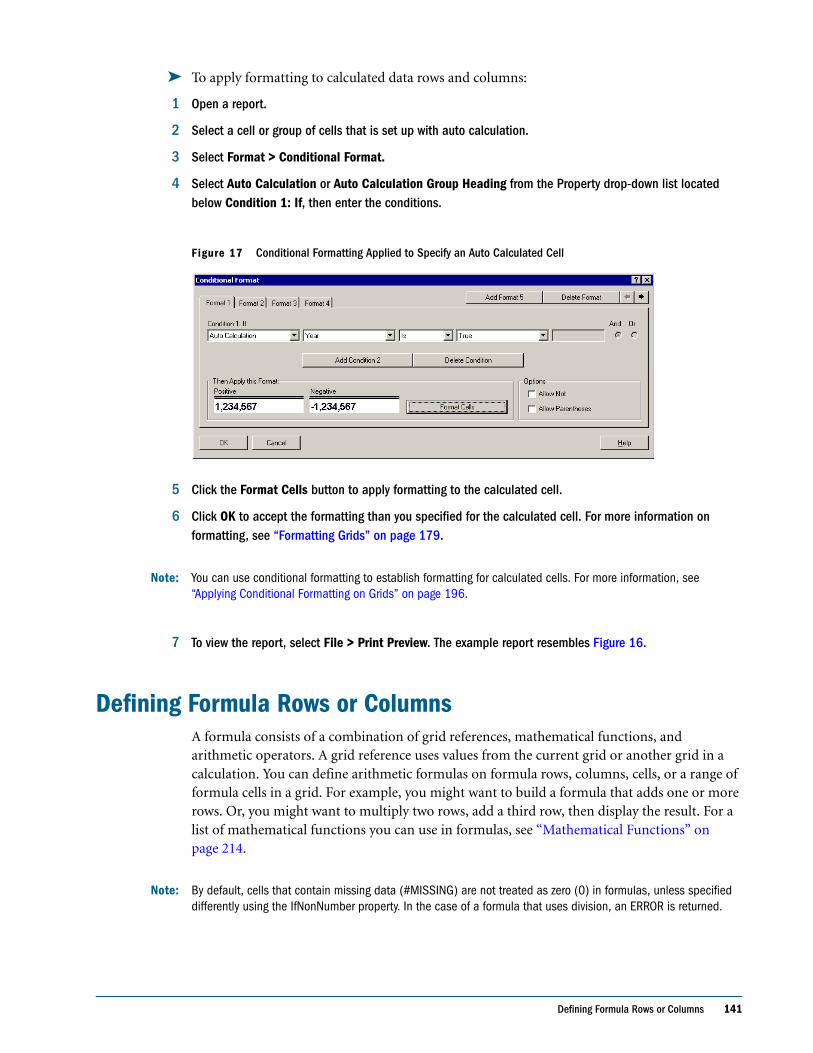
Defining Formula Rows or Columns 141
➤ To apply formatting to calculated data rows and columns:
1 Open a report.
2 Select a cell or group of cells that is set up with auto calculation.
3 Select Format > Conditional Format.
4 Select Auto Calculation or Auto Calculation Group Heading from the Property drop-down list located below Condition 1: If, then enter the conditions.
Figure 17 Conditional Formatting Applied to Specify an Auto Calculated Cell
5 Click the Format Cells button to apply formatting to the calculated cell.
6 Click OK to accept the formatting than you specified for the calculated cell. For more information on formatting, see “Formatting Grids” on page 179.
Note: You can use conditional formatting to establish formatting for calculated cells. For more information, see “Applying Conditional Formatting on Grids” on page 196.
7 To view the report, select File > Print Preview. The example report resembles Figure 16.
Defining Formula Rows or ColumnsA formula consists of a combination of grid references, mathematical functions, and arithmetic operators. A grid reference uses values from the current grid or another grid in a calculation. You can define arithmetic formulas on formula rows, columns, cells, or a range of formula cells in a grid. For example, you might want to build a formula that adds one or more rows. Or, you might want to multiply two rows, add a third row, then display the result. For a list of mathematical functions you can use in formulas, see “Mathematical Functions” on page 214.
Note: By default, cells that contain missing data (#MISSING) are not treated as zero (0) in formulas, unless specified differently using the IfNonNumber property. In the case of a formula that uses division, an ERROR is returned.
142 Customizing Grids
Note: When using the Financial Management database connection, the results varies, based on the settings of the MissingValuesAreZeroInFormulasInHFM option in the fr_repserver.properties file. If the property is set to one (1), the #Missing value is treated as a zero. However, if the property is set to zero (0), the #Missing value is treated as missing which results in #missing or #error values. The default setting is one (1).
To specify mathematical properties, you can use dot notation. Dot notation is a syntax that specifies properties for a grid or another property. You specify a property using a period ( . ) followed by the property name.
The following syntax describes how to define formula rows or columns:
gridname.row\column[x].property
For example, mygrid1.row[3].sum adds all elements in row 3 of mygrid1.
Note: When specifying the full gridname notation, you must also indicate the row, column, or cell.
The following example returns the sum of the nth column:
mygrid2.column[C].sum
You can omit references to the current grid, row, column, or cell. The following example returns the absolute value of the cell located at the intersection of row 5 and column B in the current grid:
ABS([5,B])
➤ To define formula rows or columns:
1 Open a report.
2 Select a row or column in a grid.
3 Select Insert > Row > Formula or Insert > Column > Formula.
4 Select the formula row or column, or a range of formula cells.
5 In the drop-down menu from the formula bar, select a function. For a list of mathematical functions, see “Mathematical Functions” on page 214.
6 Insert your cursor in the formula text box and enter the rest of the formula.
7 Repeat steps 4 through 6 as necessary to build your formula.
8 Select File > Print Preview to see the results of your formula.
Argument Description
gridname The name of the grid. Grid names cannot include spaces. For more information on grid references, see “Mathematical Functions” on page 214.
x The row or column, number, and property.
Defining Formula Rows or Columns 143
Defining Headings for Formula Rows and ColumnsYou can define a heading for a row or column. By default, the formula is shown as the heading for the row or column. You may also create a custom heading for the row or column.
➤ To define headings for formula rows and columns, select the heading cell, then do one of the following from the Headings area of the Row or Column Properties sheet:
● Select the Show Formula option. This is the default.
● Click the Custom Headings button. Enter text in the Custom Heading text box area.
Note: You can also insert a text function in your custom heading.
Expanding Rows or ColumnsIn the designer, you can use the design-time row, column, and cell to reference the calculated rows, columns, or cells.
The syntax for row or column is:
AXIS[Segment(Range)].Property
The syntax for a cell is:
CELL[Row Segment(Range), Column Segment(Range)].Property
Reference Definition
AXIS A row or column containing the expanded cells identified by the given row and column templates. The default is row. For example, [3] refers to row 3 and [C] refers to column C. The following reference: [3].sum in a column formula is calculated as the sum of row 3.
Optional.
CELL The intersection of the expanded cells, given the row and column template coordinates, respectively. For example, the following reference: [2,C] is the single cell where row 2 intersects column C.
Optional.
Segment A value that represents a row or column ID in the designer. Referenced segments refer to design-time rows or columns, which might expand in the viewer. View-time rows and columns are the expanded rows and columns. Use numbers for row IDs and letters for column IDs.
Note: If you are using an expanded formula row, the default segment is row. If you are using an expanded formula column, the default segment is column. For example, row [ 5 ] refers to expanded row 5. For more information on using segments, see “Expressing the Segment Argument” on page 144.
Optional.
144 Customizing Grids
Expressing the Segment ArgumentThe Segment argument is a value that represents a row or column ID in the designer. Referenced segments refer to design-time rows or columns, which might expand in the viewer. View-time rows and columns are the expanded rows and columns. You can use numbers for row IDs and letters for column IDs. You can refer to one or more segments in any standard formula. The following table explains the types of notation used for multiple segments in standard formulas.
You can use any combination of the above.
Example:
The following example points to segment rows 1, 3, 5, 6, 7, 8, 9, 10, 12, 13, 14, 15 and 17:
row[1; 3; 5:10; 12:15; 17]
Example:
Range The expanded cells used in the calculation of the function.
Range refers to view-time expanded rows and columns. Calculations are performed after suppression. Sorting is performed after calculations. For more information on sorting and suppression, see “Conditional Suppression” on page 202 and “Sorting Rows, Columns, and Pages” on page 191.
Use colons to refer to a range of expanded rows or columns. For example, (3:6) addresses rows 3, 4, 5, and 6. For more information on using ranges, see “Expressing the Range Argument” on page 145.
Optional.
Property A function applied to aggregate rows, columns, or cells. For more information on using properties, see “Property Arguments” on page 217.
Optional.
Table 29 Segment Notation
Type Notation Description Example
Single segment [ ] Single (design-time) segment
This expression points to segment 2: row[2]
Note: Previous releases support this notation.
Nonconsecutive segment
[;] Refers to multiple single rows or column segments.
This expression points to segment rows 2, 5, 7, 8 and 10:
row[2;5;7;8;10]
Note: Use a semi-colon rather than a comma to delineate row or column references.
Segment Range [:] Refers to a range of rows or column segments.
This expression points to segment rows 2, 3, 4 and 5:
row[2:5]
Reference Definition
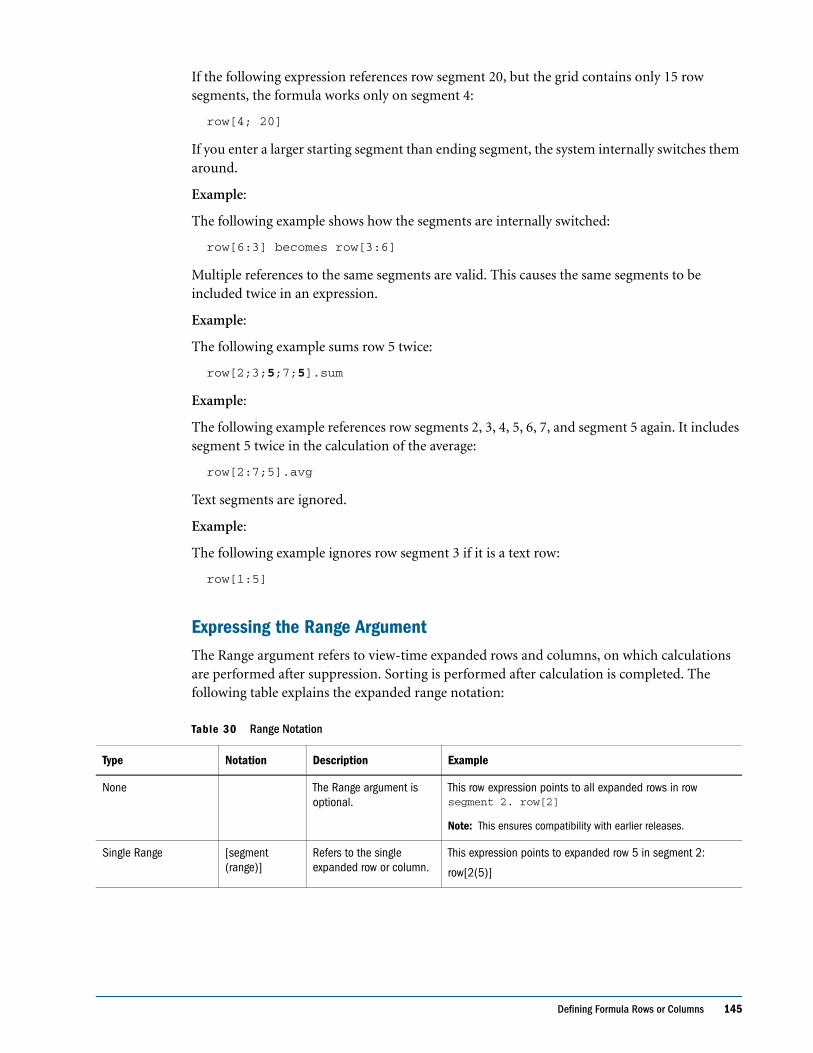
Defining Formula Rows or Columns 145
If the following expression references row segment 20, but the grid contains only 15 row segments, the formula works only on segment 4:
row[4; 20]
If you enter a larger starting segment than ending segment, the system internally switches them around.
Example:
The following example shows how the segments are internally switched:
row[6:3] becomes row[3:6]
Multiple references to the same segments are valid. This causes the same segments to be included twice in an expression.
Example:
The following example sums row 5 twice:
row[2;3;5;7;5].sum
Example:
The following example references row segments 2, 3, 4, 5, 6, 7, and segment 5 again. It includes segment 5 twice in the calculation of the average:
row[2:7;5].avg
Text segments are ignored.
Example:
The following example ignores row segment 3 if it is a text row:
row[1:5]
Expressing the Range ArgumentThe Range argument refers to view-time expanded rows and columns, on which calculations are performed after suppression. Sorting is performed after calculation is completed. The following table explains the expanded range notation:
Table 30 Range Notation
Type Notation Description Example
None The Range argument is optional.
This row expression points to all expanded rows in row segment 2. row[2]
Note: This ensures compatibility with earlier releases.
Single Range [segment (range)]
Refers to the single expanded row or column.
This expression points to expanded row 5 in segment 2:
row[2(5)]
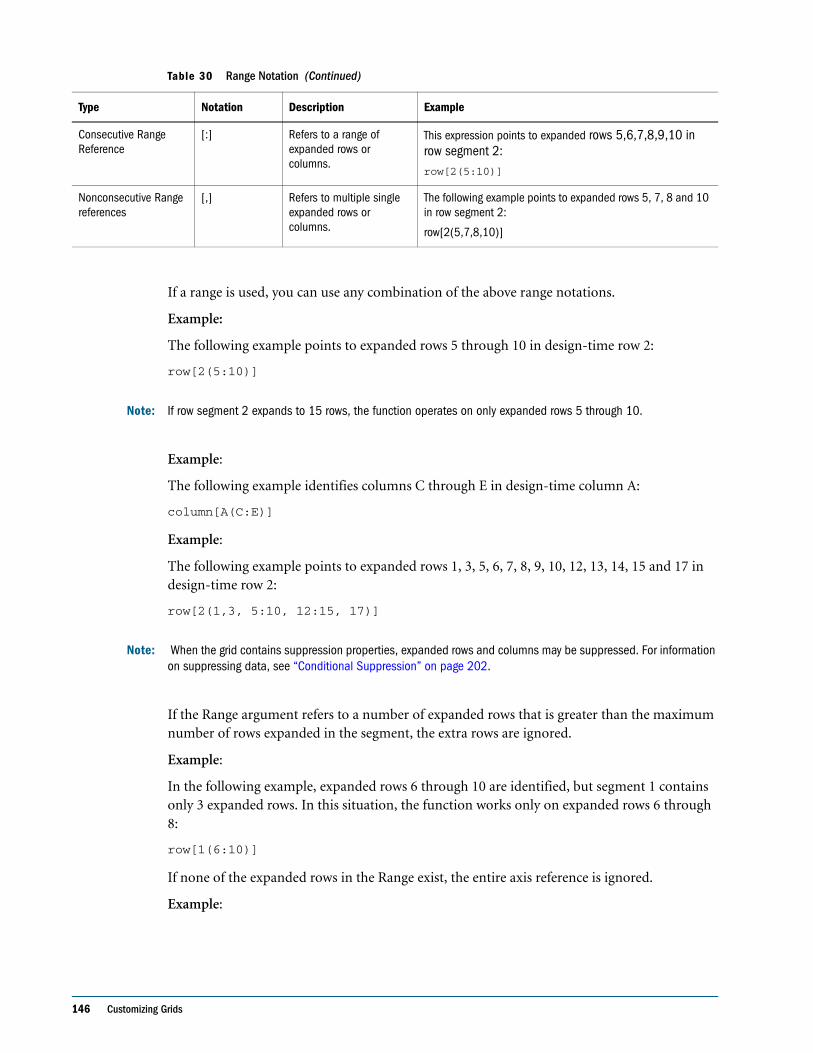
146 Customizing Grids
If a range is used, you can use any combination of the above range notations.
Example:
The following example points to expanded rows 5 through 10 in design-time row 2:
row[2(5:10)]
Note: If row segment 2 expands to 15 rows, the function operates on only expanded rows 5 through 10.
Example:
The following example identifies columns C through E in design-time column A:
column[A(C:E)]
Example:
The following example points to expanded rows 1, 3, 5, 6, 7, 8, 9, 10, 12, 13, 14, 15 and 17 in design-time row 2:
row[2(1,3, 5:10, 12:15, 17)]
Note: When the grid contains suppression properties, expanded rows and columns may be suppressed. For information on suppressing data, see “Conditional Suppression” on page 202.
If the Range argument refers to a number of expanded rows that is greater than the maximum number of rows expanded in the segment, the extra rows are ignored.
Example:
In the following example, expanded rows 6 through 10 are identified, but segment 1 contains only 3 expanded rows. In this situation, the function works only on expanded rows 6 through 8:
row[1(6:10)]
If none of the expanded rows in the Range exist, the entire axis reference is ignored.
Example:
Consecutive Range Reference
[:] Refers to a range of expanded rows or columns.
This expression points to expanded rows 5,6,7,8,9,10 in row segment 2:row[2(5:10)]
Nonconsecutive Range references
[,] Refers to multiple single expanded rows or columns.
The following example points to expanded rows 5, 7, 8 and 10 in row segment 2:
row[2(5,7,8,10)]
Table 30 Range Notation (Continued)
Type Notation Description Example
Defining Formula Rows or Columns 147
The following example ignores the reference to 23 if segment 3 only contains 10 expanded rows:
row[3(23)]
Example:
If you enter a larger starting range than ending range, the system internally switches them around.
Example:
The following example shows how the range is reversed:
row[1(7:5)] becomes row[1(5:7)]
Multiple references to the same expanded rows or columns are valid. However, this may cause the same rows or columns to be included twice in an expression.
Example:
The following example sums expanded row 5 twice:
row[2(3,5,7,5)].sum
Example:
The following example specifies expanded rows 3, 4, 5, 6, 7, and row 5. It includes row 5 twice in the calculation of the average:
row[2(3:7,5)].ave
Identifying Multiple Segments with Ranges
The syntax for a range in a segment range is:
AXIS[Segment Start : Segment End (Range Start : Range End)]
where Segment Start and Segment End refers to multiple segments.
Example:
The following example points to expanded rows 5, 6, and 7 in row segments 1, 2, 3, and 4:
row[1:4(5:7)]
Example:
The following example points to expanded rows 5, 7, and 9 in row segments 1, 2, 3, and 4:
row[1:4(5,7,9)]
If the segment argument refers to segments that do not exist in the axis, the segments are ignored. This includes suppressed rows or columns.
Example:
The following example points to expanded rows 4, 6, 7,8, 9, and 10 in row segment 1 and 4, 5, and 6 in row segment 3 and all expanded rows in row segment 7:
row[1(4, 6:10); 3(4:6); 7]
148 Customizing Grids
Multiple Calculation IterationsYou can specify the maximum number of calculation iterations for all grids and cells in the fr_repserver.properties file to resolve dependencies within references in formulas. During the calculation process of a grid, it may be necessary to evaluate a cell multiple times due to reference precedence. This usually occurs in grids with references to other grids. The maximum iteration property indicates the number of times a formula cell can be evaluated before it is marked as unresolved. Setting the maximum iteration property avoids the possibility of cells, with circular referencing, being evaluated an infinite amount of times. Circular referencing occurs when one cell refers to another cell, which then refers to the original cell.
If there are no circular references and calculation cells are returning #Error, you can increase the maximum iteration property value. For more information, see Hyperion System 9 BI+ Workspace Administrator’s Guide.
Using the Formula BarThe formula bar provides a central location for the administration of formulas and selection of members when setting up grids in Financial Reporting.
Note: You can type selected functions to pick members dynamically. See Table 17 on page 54 for a list of functions that can be used in the Formula Bar and Table 18 on page 56 for a list of functions that cannot be used in the Formula Bar.
The formula bar contains a text box for the entry of formulas and a drop-down list box of functions to choose from when building formulas. If you select a member in a grid, member selection is activated on the formula bar.
The formula bar is displayed below the toolbar so you can easily access its functionality. It is visible but disabled when you are not using grids.
The Financial Reporting formula bar is similar in functionality and appearance to the formula bar in Excel. You can use the formula bar to perform the following tasks on grids:
● Define, edit, and delete a formula in a cell, column, or row
● Modify member selection for a column or row
Example Report with FormulasYou can use the formula bar to create formulas that total data, average data, or perform other functions of your choosing. When creating formulas for rows that summarize data for the year, for example, you use the formula bar to select the functions and dimensions that return your result. The following example illustrates this information:
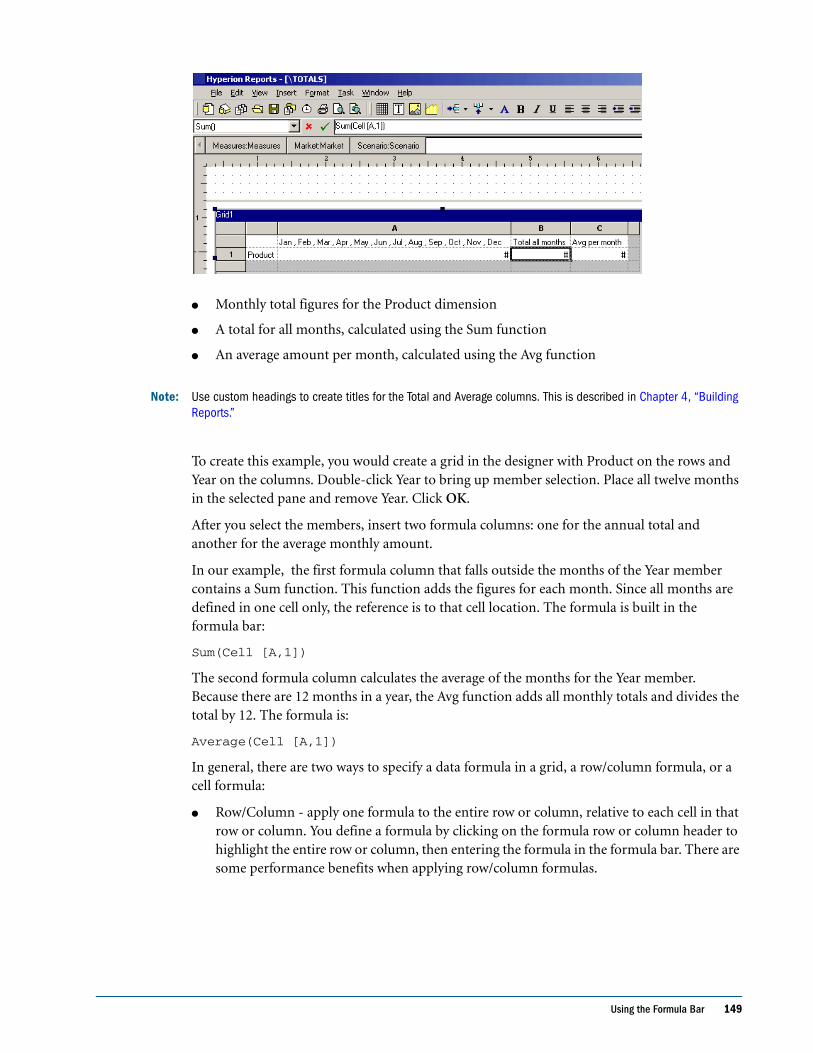
Using the Formula Bar 149
● Monthly total figures for the Product dimension
● A total for all months, calculated using the Sum function
● An average amount per month, calculated using the Avg function
Note: Use custom headings to create titles for the Total and Average columns. This is described in Chapter 4, “Building Reports.”
To create this example, you would create a grid in the designer with Product on the rows and Year on the columns. Double-click Year to bring up member selection. Place all twelve months in the selected pane and remove Year. Click OK.
After you select the members, insert two formula columns: one for the annual total and another for the average monthly amount.
In our example, the first formula column that falls outside the months of the Year member contains a Sum function. This function adds the figures for each month. Since all months are defined in one cell only, the reference is to that cell location. The formula is built in the formula bar:
Sum(Cell [A,1])
The second formula column calculates the average of the months for the Year member. Because there are 12 months in a year, the Avg function adds all monthly totals and divides the total by 12. The formula is:
Average(Cell [A,1])
In general, there are two ways to specify a data formula in a grid, a row/column formula, or a cell formula:
● Row/Column - apply one formula to the entire row or column, relative to each cell in that row or column. You define a formula by clicking on the formula row or column header to highlight the entire row or column, then entering the formula in the formula bar. There are some performance benefits when applying row/column formulas.
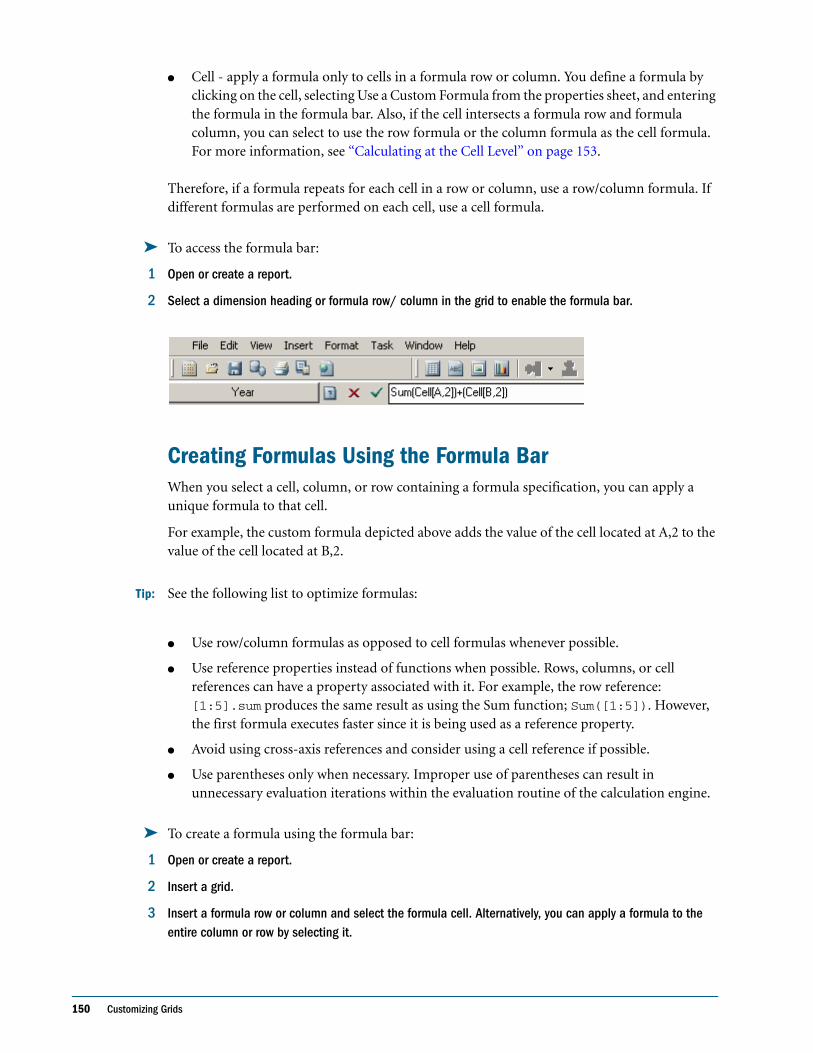
150 Customizing Grids
● Cell - apply a formula only to cells in a formula row or column. You define a formula by clicking on the cell, selecting Use a Custom Formula from the properties sheet, and entering the formula in the formula bar. Also, if the cell intersects a formula row and formula column, you can select to use the row formula or the column formula as the cell formula. For more information, see “Calculating at the Cell Level” on page 153.
Therefore, if a formula repeats for each cell in a row or column, use a row/column formula. If different formulas are performed on each cell, use a cell formula.
➤ To access the formula bar:
1 Open or create a report.
2 Select a dimension heading or formula row/ column in the grid to enable the formula bar.
Creating Formulas Using the Formula BarWhen you select a cell, column, or row containing a formula specification, you can apply a unique formula to that cell.
For example, the custom formula depicted above adds the value of the cell located at A,2 to the value of the cell located at B,2.
Tip: See the following list to optimize formulas:
● Use row/column formulas as opposed to cell formulas whenever possible.
● Use reference properties instead of functions when possible. Rows, columns, or cell references can have a property associated with it. For example, the row reference: [1:5].sum produces the same result as using the Sum function; Sum([1:5]). However, the first formula executes faster since it is being used as a reference property.
● Avoid using cross-axis references and consider using a cell reference if possible.
● Use parentheses only when necessary. Improper use of parentheses can result in unnecessary evaluation iterations within the evaluation routine of the calculation engine.
➤ To create a formula using the formula bar:
1 Open or create a report.
2 Insert a grid.
3 Insert a formula row or column and select the formula cell. Alternatively, you can apply a formula to the entire column or row by selecting it.
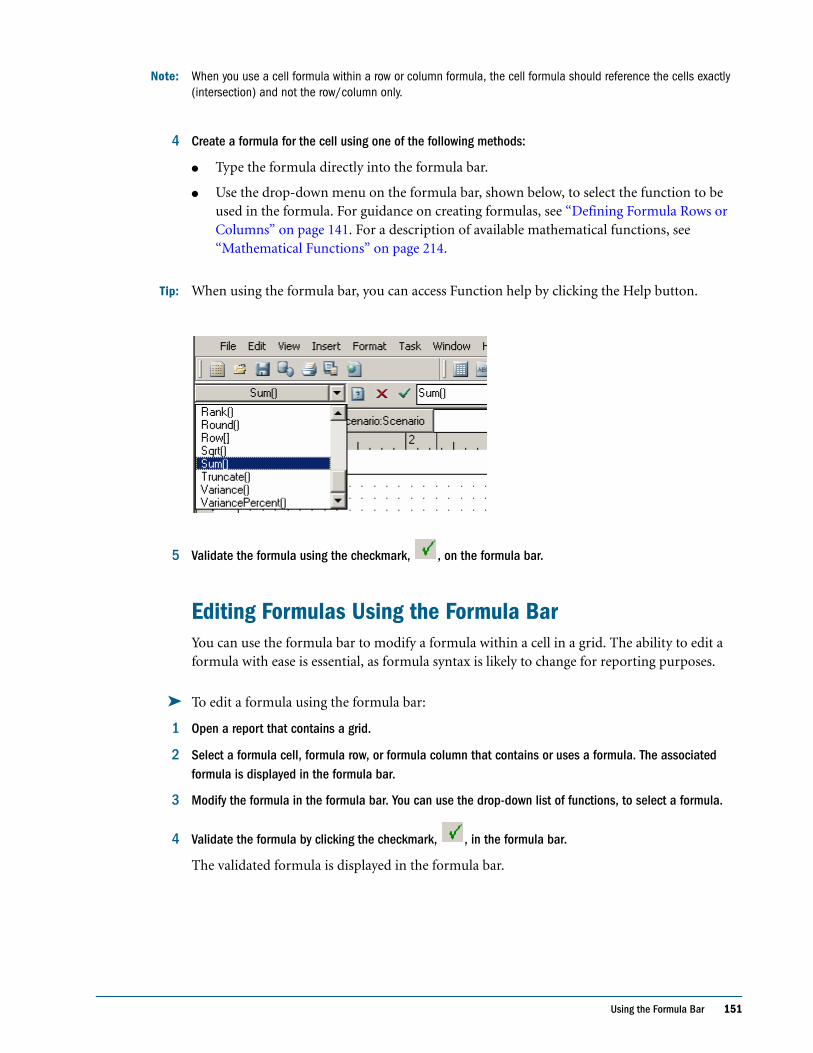
Using the Formula Bar 151
Note: When you use a cell formula within a row or column formula, the cell formula should reference the cells exactly (intersection) and not the row/column only.
4 Create a formula for the cell using one of the following methods:
● Type the formula directly into the formula bar.
● Use the drop-down menu on the formula bar, shown below, to select the function to be used in the formula. For guidance on creating formulas, see “Defining Formula Rows or Columns” on page 141. For a description of available mathematical functions, see “Mathematical Functions” on page 214.
Tip: When using the formula bar, you can access Function help by clicking the Help button.
5 Validate the formula using the checkmark, , on the formula bar.
Editing Formulas Using the Formula BarYou can use the formula bar to modify a formula within a cell in a grid. The ability to edit a formula with ease is essential, as formula syntax is likely to change for reporting purposes.
➤ To edit a formula using the formula bar:
1 Open a report that contains a grid.
2 Select a formula cell, formula row, or formula column that contains or uses a formula. The associated formula is displayed in the formula bar.
3 Modify the formula in the formula bar. You can use the drop-down list of functions, to select a formula.
4 Validate the formula by clicking the checkmark, , in the formula bar.
The validated formula is displayed in the formula bar.
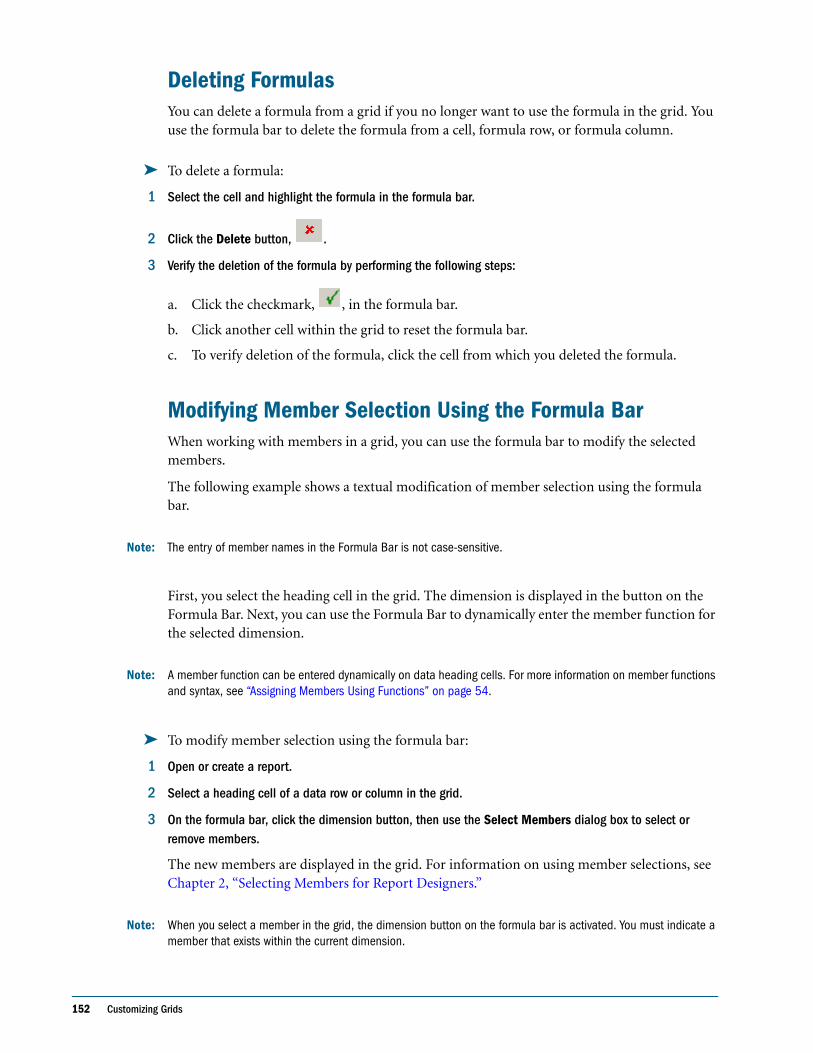
152 Customizing Grids
Deleting FormulasYou can delete a formula from a grid if you no longer want to use the formula in the grid. You use the formula bar to delete the formula from a cell, formula row, or formula column.
➤ To delete a formula:
1 Select the cell and highlight the formula in the formula bar.
2 Click the Delete button, .
3 Verify the deletion of the formula by performing the following steps:
a. Click the checkmark, , in the formula bar.
b. Click another cell within the grid to reset the formula bar.
c. To verify deletion of the formula, click the cell from which you deleted the formula.
Modifying Member Selection Using the Formula BarWhen working with members in a grid, you can use the formula bar to modify the selected members.
The following example shows a textual modification of member selection using the formula bar.
Note: The entry of member names in the Formula Bar is not case-sensitive.
First, you select the heading cell in the grid. The dimension is displayed in the button on the Formula Bar. Next, you can use the Formula Bar to dynamically enter the member function for the selected dimension.
Note: A member function can be entered dynamically on data heading cells. For more information on member functions and syntax, see “Assigning Members Using Functions” on page 54.
➤ To modify member selection using the formula bar:
1 Open or create a report.
2 Select a heading cell of a data row or column in the grid.
3 On the formula bar, click the dimension button, then use the Select Members dialog box to select or remove members.
The new members are displayed in the grid. For information on using member selections, see Chapter 2, “Selecting Members for Report Designers.”
Note: When you select a member in the grid, the dimension button on the formula bar is activated. You must indicate a member that exists within the current dimension.
Calculating at the Cell Level 153
● Modify the member name(s) in the text box on the formula bar.
● Dynamically enter a member function for a dimension using the formula bar. For member function syntax, see Table 17 on page 54.
Note: You cannot combine the use of numerical functions with member functions; that is, Sum(Children of (Product) (Inclusive))
4 Click to accept the member entry.
The grid is set to obtain data for the new member/member function.
Accessing Property Sheet FeaturesWhen you select a report component, a corresponding property sheet is displayed on the right side of the design area. When you select another component, the category and the property sheet features change. For example, when you select a cell, the Cell Properties sheet is displayed. You can use the property sheet to make modifications to the selected component.
In general, the property sheet enables you to set various options for the currently selected report component. For more information, see Chapter 1, “Getting Started with Financial Reporting.”
Calculating at the Cell LevelA cell in a formula row or column can contain a formula. You can create a custom cell-level formula on cells in a formula row or column. When you select a formula cell, the Cell Properties sheet allows you to choose a calculation preferences:
● If the cell is an intersection of a formula row and formula column, you can choose whether calculation is based on the row formula, the column formula, or a new custom formula.
● If a cell is located in a formula row, you can choose whether calculation is based on a row formula or a new custom formula.
● If a cell is located in a formula column, you can choose whether calculation is based on a column formula or a new custom formula.
The following table shows an example of a cell that is calculated to display the % variance. Cell D4 displays the % variance between the sum of Jan and the sum of Feb, specifically, ((356-350)/350) *100=1.71%. A cell level formula gives the intended result by placing a custom formula in the cell D4. The formula needed to get the correct result is (([B]-[A])/[A])* 100.
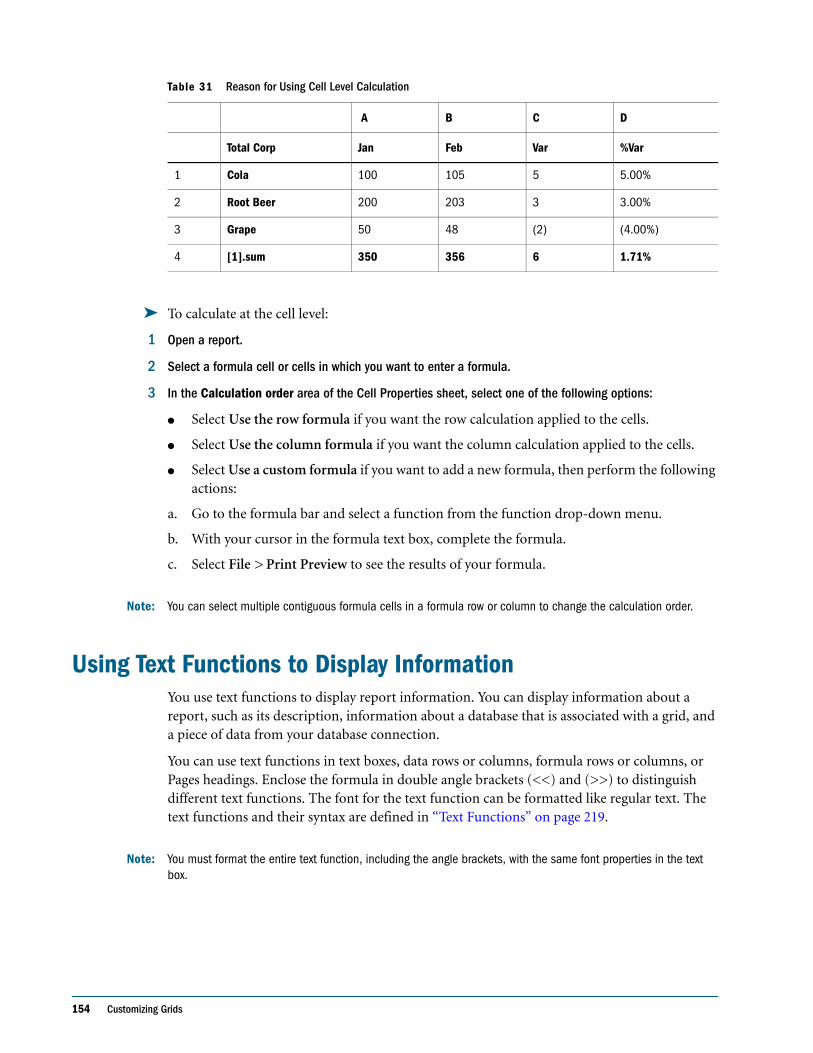
154 Customizing Grids
➤ To calculate at the cell level:
1 Open a report.
2 Select a formula cell or cells in which you want to enter a formula.
3 In the Calculation order area of the Cell Properties sheet, select one of the following options:
● Select Use the row formula if you want the row calculation applied to the cells.
● Select Use the column formula if you want the column calculation applied to the cells.
● Select Use a custom formula if you want to add a new formula, then perform the following actions:
a. Go to the formula bar and select a function from the function drop-down menu.
b. With your cursor in the formula text box, complete the formula.
c. Select File > Print Preview to see the results of your formula.
Note: You can select multiple contiguous formula cells in a formula row or column to change the calculation order.
Using Text Functions to Display InformationYou use text functions to display report information. You can display information about a report, such as its description, information about a database that is associated with a grid, and a piece of data from your database connection.
You can use text functions in text boxes, data rows or columns, formula rows or columns, or Pages headings. Enclose the formula in double angle brackets (<<) and (>>) to distinguish different text functions. The font for the text function can be formatted like regular text. The text functions and their syntax are defined in “Text Functions” on page 219.
Note: You must format the entire text function, including the angle brackets, with the same font properties in the text box.
Table 31 Reason for Using Cell Level Calculation
A B C D
Total Corp Jan Feb Var %Var
1 Cola 100 105 5 5.00%
2 Root Beer 200 203 3 3.00%
3 Grape 50 48 (2) (4.00%)
4 [1].sum 350 356 6 1.71%
Using Text Functions to Display Information 155
➤ To use text functions to display information:
1 Open a report, then select one of the following items:
● Select a text box.
● Select a heading cell, then Custom Heading from the property sheet.
● Select the Pages drop-down list in a grid, then Custom Heading from the property sheet.
2 Click the Insert Function button. The Insert Function dialog box is displayed.
3 To select the desired function, perform an action:
● Double-click the function in the Available Functions list to add it to the Selected Function list.
● Select a function from the Available Functions list and click the Add button, , to add it to the Selected Function list.
4 In the Select Function area, make your changes to the function’s parameters, then click OK.
Note: A report designer has the option to enable or disable error messages for text functions that are displayed in the grid or text object. The default is to display error messages. To disable this feature, from the Grid Properties sheet or the Text Properties sheet, de-select the Show Text Function Errors option.
5 Select File > Print Preview to run the report and display the data produced by the function.

156 Customizing Grids
Defining the User POV 157
C h a p t e r
6Defining the User POV
Every data value in a report is derived from the intersection of a member from each dimension in an Analytic Services, Planning Detail, or Financial Management database connection. Financial Reporting enables a designer to place these dimensions on the report grid or user point of view (POV). Report viewers can change the member selected for dimensions on the user POV. This enables report viewers to customize the reports to fit their needs. The user POV can also be used in books. For more information on selecting the user POV as a member in the book POV, see Chapter 14, “Working with Books and Snapshot Books.”
In a report, the member specified for a dimension in the user POV is used for all grids with that dimension on the user POV. For example, if you select the Budget member for the Scenario dimension, all grids in the report with scenario in the user POV use Budget when you retrieve data. The user POV is not displayed if all of the dimensions are placed on the grid.
The following criteria are used to show dimensions on the user POV bar:
● Dimensions not currently defined on a row, a column, or a page
● Dimensions on a row, a column, or a page that are flagged for the current POV
● Dimensions without a member selected on a grid POV
● Attribute dimensions dragged to the POV area in the Dimension Layout dialog box
In This Chapter Setting Up the User POV from the Report Designer . . . . . . . . . . . . . . . . . . . . . . . . . . . . . . . . . . . . . . . . . . . . . . . . 158
Selecting Members for the User POV from the Report Designer . . . . . . . . . . . . . . . . . . . . . . . . . . . . . . . . . . . . . . . 159
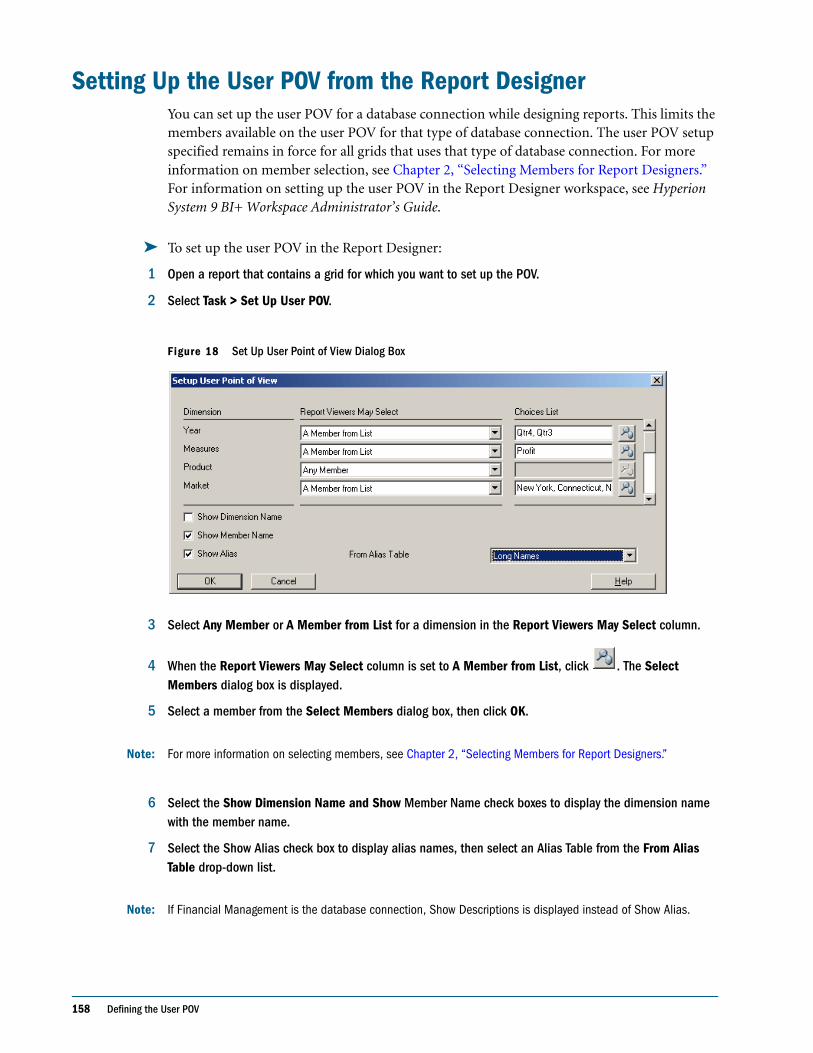
158 Defining the User POV
Setting Up the User POV from the Report DesignerYou can set up the user POV for a database connection while designing reports. This limits the members available on the user POV for that type of database connection. The user POV setup specified remains in force for all grids that uses that type of database connection. For more information on member selection, see Chapter 2, “Selecting Members for Report Designers.” For information on setting up the user POV in the Report Designer workspace, see Hyperion System 9 BI+ Workspace Administrator’s Guide.
➤ To set up the user POV in the Report Designer:
1 Open a report that contains a grid for which you want to set up the POV.
2 Select Task > Set Up User POV.
Figure 18 Set Up User Point of View Dialog Box
3 Select Any Member or A Member from List for a dimension in the Report Viewers May Select column.
4 When the Report Viewers May Select column is set to A Member from List, click . The Select Members dialog box is displayed.
5 Select a member from the Select Members dialog box, then click OK.
Note: For more information on selecting members, see Chapter 2, “Selecting Members for Report Designers.”
6 Select the Show Dimension Name and Show Member Name check boxes to display the dimension name with the member name.
7 Select the Show Alias check box to display alias names, then select an Alias Table from the From Alias Table drop-down list.
Note: If Financial Management is the database connection, Show Descriptions is displayed instead of Show Alias.
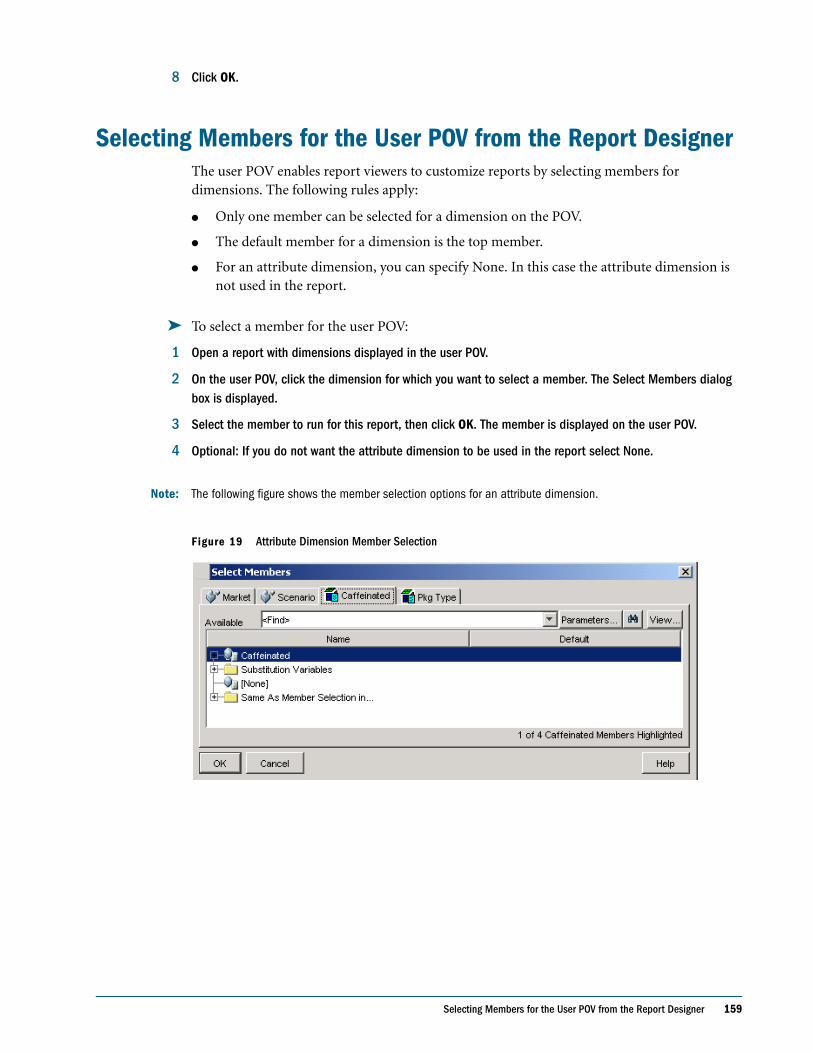
Selecting Members for the User POV from the Report Designer 159
8 Click OK.
Selecting Members for the User POV from the Report DesignerThe user POV enables report viewers to customize reports by selecting members for dimensions. The following rules apply:
● Only one member can be selected for a dimension on the POV.
● The default member for a dimension is the top member.
● For an attribute dimension, you can specify None. In this case the attribute dimension is not used in the report.
➤ To select a member for the user POV:
1 Open a report with dimensions displayed in the user POV.
2 On the user POV, click the dimension for which you want to select a member. The Select Members dialog box is displayed.
3 Select the member to run for this report, then click OK. The member is displayed on the user POV.
4 Optional: If you do not want the attribute dimension to be used in the report select None.
Note: The following figure shows the member selection options for an attribute dimension.
Figure 19 Attribute Dimension Member Selection

160 Defining the User POV
Providing for Detailed Data and Documents in Reports 161
C h a p t e r
7Providing for Detailed Data and
Documents in Reports
Providing Expansions and Related Content includes the following topics and tasks:
In This Chapter Setting Up Expansions to Access Detail Data Within Reports. . . . . . . . . . . . . . . . . . . . . . . . . . . . . . . . . . . . . . . . . 162
Positioning Expansion Rows and Columns . . . . . . . . . . . . . . . . . . . . . . . . . . . . . . . . . . . . . . . . . . . . . . . . . . . . . . 162
Attaching Cell Documents in a Report . . . . . . . . . . . . . . . . . . . . . . . . . . . . . . . . . . . . . . . . . . . . . . . . . . . . . . . . . 163
Setting Up Links to Related Content . . . . . . . . . . . . . . . . . . . . . . . . . . . . . . . . . . . . . . . . . . . . . . . . . . . . . . . . . . . 166
Creating Links to Related Content . . . . . . . . . . . . . . . . . . . . . . . . . . . . . . . . . . . . . . . . . . . . . . . . . . . . . . . . . . . . 167
Removing Access from Related Content . . . . . . . . . . . . . . . . . . . . . . . . . . . . . . . . . . . . . . . . . . . . . . . . . . . . . . . . 168
Modifying the Properties for Related Content . . . . . . . . . . . . . . . . . . . . . . . . . . . . . . . . . . . . . . . . . . . . . . . . . . . . 168
Expansions and Related Content are features that enable the designer to specify detailed levels of data in a report. You can design your report to allow end users to view detail data residing in the same report using Expansions or in a linked report using Related Content.
For example, you might want to provide the detail of a Market dimension by displaying the areas that comprise a market, such as East, West, North, and South.
● Using Expansion. You can set up viewing of same-report detail data by enabling expansion of summary rows and columns. A report set up with expansion enables end users to select a summary-level row or column and view its related detail in the same report.
● Using Related Content. You can select a data cell and set up links to objects in Financial
Reporting, Web Analysis, Application Builder J2EETM, and URLs. A report set up with Related Content enables end users to move between documents in different applications.
You can view a report that has expansion and Related Content enabled during the design phase by selecting File > Web Preview.
Note: The report designer must save the report as a Report type to view expansion and Related Content in the Report Designer workspace. Reports saved as snapshots lose this capability.
162 Providing for Detailed Data and Documents in Reports
Setting Up Expansions to Access Detail Data Within ReportsYou can design a report to display detail rows and columns of a grid at the request of the end user. You do this by enabling the expansion of a dimension that has parent-child relationships among its members. For example, if you enable the Time dimension to expand, users can expand a row that displays quarters into months.
Users access detail rows and columns by selecting summary rows and columns from reports that are displayed.
➤ To set up access to detail data within a report:
1 Open a report.
2 Select the row or column headings for which you want to enable expansion.
3 Select the Allow Expansion check box in the Heading Row or Heading Column Properties sheet.
Note: When Hybrid Data is available for a base-level member in Analytic Services, an expansion arrow is displayed next to the base-level member and you can expand into Hybrid Data. Expansions are not allowed on rows with line-item-detail or supporting detail, or on columns containing a row with line-item-detail. For more information on displaying line item details, see “Displaying Line Item Detail for Financial Management” on page 129
4 Double-click the dimension to select members to expand. For more information on selecting members, see Chapter 2, “Selecting Members for Report Designers.”
Positioning Expansion Rows and ColumnsYou can specify whether expanded items are displayed before or after the dimension’s summary-level row or column.
➤ To position expansion rows and columns:
1 Open a report.
2 Click the grid for which you want to specify expansion positions.
3 On the Grid Properties sheet, select the Position category.
4 Do one of the following in the Position of Expansions box:
● To display expansions after the summary-level row or column, click After Parent. This is the default.
● To display expansions before the summary-level row or column, click Before Parent.
Attaching Cell Documents in a Report 163
Attaching Cell Documents in a ReportCell documents that are attached at the data source can be accessed and printed to reports. The attached Microsoft Office documents (Word, Excel, or PowerPoint) prints at the end of a PDF or snapshot report. The documents is accessed in the HTML client when drilling into a cell through related content. In addition, you can insert a footnote into a text object or text cell of the report that lists information about the attached cell documents by selecting the ListOfCellDocuments option from the property sheet.
To include cell documents in a grid’s report, they must exist in Analytic Services (Linked Reporting Objects) or Financial Management (cell attachments). The data cell must be selected with the RetrieveCellDocument option. All cell documents have a POV associated with the data cell to which they are attached.
Note: In Analytic Services, Linked Reporting Objects are attached through the Excel Add-in. In Financial Management, cell documents are attached through the Financial Management Web client. For more information, refer to the respective product’s documentation.
A data cell can contain multiple cell documents. If a data cell contains cell documents in the Financial Management or Analytic Services data source, a designer can extract those documents, based on the given cell’s POV. Cell documents can be attached to reports contained in books and snapshot books.
Supported File Microsoft Office File TypesThe following types of Microsoft Office documents are supported as cell documents:
● Word files (*.doc, *.rtf), versions 2000, 2002, and 2003
● Excel files (*.xls, *.cls), versions 2000, 2002, and 2003
● PowerPoint files (*.ppt, *pps), versions 2000, 2002 and 2003
Supported Print and Print Preview OptionsThe following table describes the support matrix of cell document output for Financial Reporting Studio and Financial Reporting.
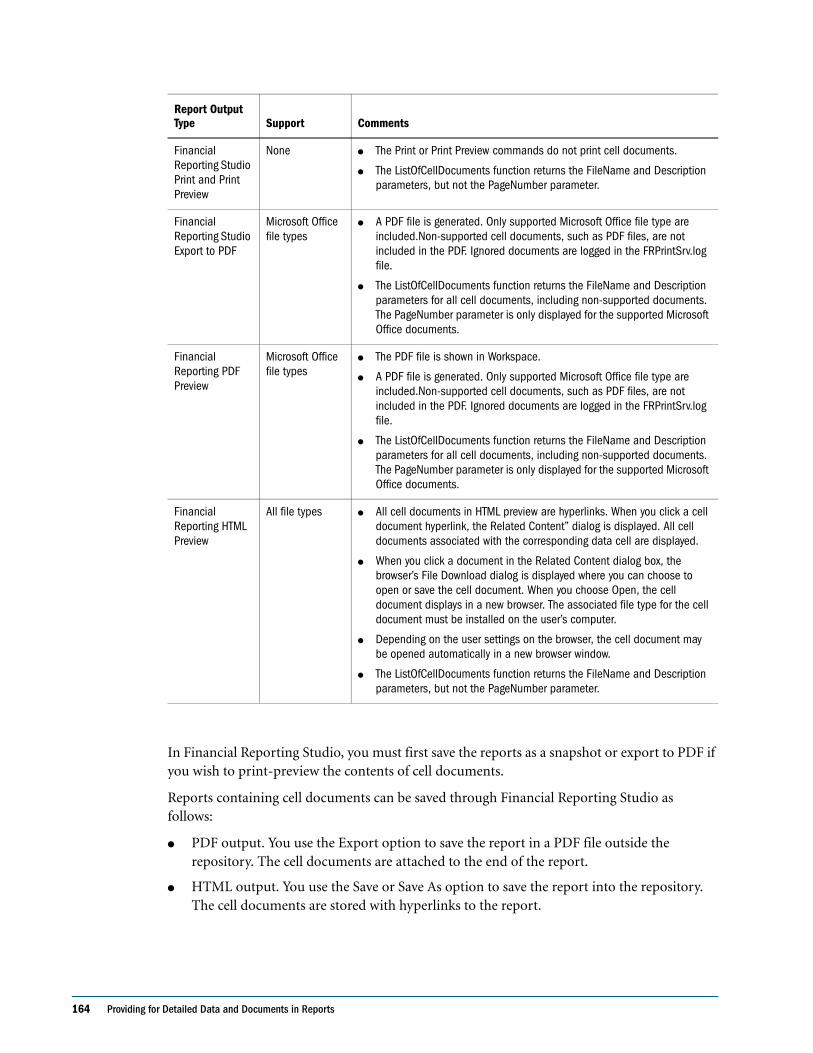
164 Providing for Detailed Data and Documents in Reports
In Financial Reporting Studio, you must first save the reports as a snapshot or export to PDF if you wish to print-preview the contents of cell documents.
Reports containing cell documents can be saved through Financial Reporting Studio as follows:
● PDF output. You use the Export option to save the report in a PDF file outside the repository. The cell documents are attached to the end of the report.
● HTML output. You use the Save or Save As option to save the report into the repository. The cell documents are stored with hyperlinks to the report.
Report Output Type Support Comments
Financial Reporting Studio Print and Print Preview
None ● The Print or Print Preview commands do not print cell documents.
● The ListOfCellDocuments function returns the FileName and Description parameters, but not the PageNumber parameter.
Financial Reporting Studio Export to PDF
Microsoft Office file types
● A PDF file is generated. Only supported Microsoft Office file type are included.Non-supported cell documents, such as PDF files, are not included in the PDF. Ignored documents are logged in the FRPrintSrv.log file.
● The ListOfCellDocuments function returns the FileName and Description parameters for all cell documents, including non-supported documents. The PageNumber parameter is only displayed for the supported Microsoft Office documents.
Financial Reporting PDF Preview
Microsoft Office file types
● The PDF file is shown in Workspace.
● A PDF file is generated. Only supported Microsoft Office file type are included.Non-supported cell documents, such as PDF files, are not included in the PDF. Ignored documents are logged in the FRPrintSrv.log file.
● The ListOfCellDocuments function returns the FileName and Description parameters for all cell documents, including non-supported documents. The PageNumber parameter is only displayed for the supported Microsoft Office documents.
Financial Reporting HTML Preview
All file types ● All cell documents in HTML preview are hyperlinks. When you click a cell document hyperlink, the Related Content” dialog is displayed. All cell documents associated with the corresponding data cell are displayed.
● When you click a document in the Related Content dialog box, the browser’s File Download dialog is displayed where you can choose to open or save the cell document. When you choose Open, the cell document displays in a new browser. The associated file type for the cell document must be installed on the user’s computer.
● Depending on the user settings on the browser, the cell document may be opened automatically in a new browser window.
● The ListOfCellDocuments function returns the FileName and Description parameters, but not the PageNumber parameter.
Printing Cell Documents 165
● Snapshot output. You can use the Save option to save the report as a snapshot in the repository or use the Export option to save the report as a snapshot outside the repository. The cell documents are attached to the end of the report.
➤ To attach cell documents:
1 In Financial Reporting Studio, create or select a report that uses a Financial Management or Analytic Services data source in the database connection.
2 Select a data type cell in a grid. On the Cell Properties sheet, select the Retrieve Cell Documents check box.
Note: For optimum retrieval performance, select Retrieve Cell Documents only for cells with attachments to include in the report.
3 If cell documents exist for the selected cell, they are appended to the report when printed. If no cell documents exist for the selected cell, no documents prints.
ConsiderationsPlease make note of the following items when working with Cell Attachment:
● Include the correct supported extensions for files.
● Files which are corrupt or improperly uploaded to the ADM provider (through Financial Management client or Analytic Services Add-in for Excel) will not print.
● We do not support Microsoft files containing macros or that trigger UI components requiring user input. Some MS files with macros perform operations when the file is opened which include the launching of dialogs requiring user input. Files that display dialogs or UI components requiring user input may not be available to print. Additionally, this may also hold up the completion of the PDF generation process. The server’s administrator may need to kill the application through Task Manage to resume printing activities. Because the application is launched under the SYSTEM account, it may not be visible since the process was not initiated by the login account.
● Documents containing file extensions that are not properly registered to print will fail.
Printing Cell DocumentsCell documents are printed top-down, in the order in which they are retrieved within a grid. For example, cell documents retrieved in cell A1 print before cell documents retrieved in cell B3. The print order of multiple documents within a cell is determined by the order in which the ADM retrieves the documents from the Financial Management or Analytic Services data source.
166 Providing for Detailed Data and Documents in Reports
You can use the Page Setup dialog box - Page Tab, to print cell documents with consecutive page numbers. This feature applies to Word and Excel documents only. The starting page of the first cell document is determined by the length of the report. Each document prints on a new page. If you do not select to print consecutive numbers on your cell documents, the page numbering reverts to the setting of each document.
For information on setting your print option for cell documents, see “Changing the Page Setup” on page 210.
Note: In Financial Management, when you upload files for attachments to cell, the file name truncates to 20 characters. You can change the document’s name. Make sure to retain the file name extension (.doc,.xls).
Printing a List of Attached Cell DocumentsYou can use the ListOfCellDocuments text function to display a list of all cell documents and attributes such as description and start page number that are retrieved in the report. The function can be entered into a text object, text cell, or text cell heading. See “ListOfCellDocuments” on page 244 for information on this function.
Setting Up Links to Related ContentRelated Content allows a designer to set up links to content from J2EE, Web Analysis, and Financial Reporting.
Related Content can be displayed from the local server and remote servers. Content from the local server is listed; content from remote servers is obtained through Hyperion or administrator-defined configuration in the RelatedContent.properties file.
Note: Before you can view remote servers through Shared Services, the remote servers must be registered. For information on how to register remote servers through Shared Services or through the RelatedContent.properties file, see Hyperion System 9 BI+ Workspace Administrator’s Guide.
Changing the Related Content Server for Multiple Reports or Grids in the RepositoryUsing Workspace, you can change the server for selected reports, grids, or both in the repository by specifying a new URL or a substitution variable. You may want to change the related content servers; for example, you might do this when moving your reports and grids from a development server to a production server.
For instructions on changing the related content server in the repository, see the Hyperion System 9 BI+ Workspace User’s Guide.
Creating Links to Related Content 167
Creating Links to Related ContentYou can design a report that provides access to another report or a URL through a hyperlink. You can create numerous links through a data cell on the report design. Links can be created to reports through your local Financial Reporting server, or remote Web Analysis, and J2EE servers, if they are registered through Shared Services or on the RelatedContent.properties file. End users can click a cell with Related Content links, then select a linked report from a Related Content menu.
When using Related Content on a report, the system sets the point of view (POV) of the report to that of the selected cell. For example, if the Gross Margin row of the Canada column is selected, the POV for the account is set to Gross Margin and the POV for the entity is set to Canada before the linked report is displayed.
Note: The POV context is not passed when you link to books through Related Content.
You can define Related Content for data cells and formula cells (but not text cells), within a row or column. You can specify the same report for a group of cells by selecting the desired cells in the grid and then defining the Related Content. Also, based on the type of Related Content selected, you can modify properties, such as their label and URL and default display options.
Object-level security is not enforced when you select Related Content, which enables you to select any report among the entire contents of each repository. However, object-level security is enforced when the report is requested for viewing.
➤ To create a link to Related Content:
1 Select a report for which you want to specify Related Content.
2 Select the rows, columns, formula, or data cells for which you want to provide a link to Related Content.
3 From the Property sheet, select the Add Related Content check box, then click the Setup button. The Add Related Content dialog box is displayed.
Each Hyperion server repository is listed as a node in a tree view. The local Financial Reporting repository is listed with the repositories from the remote servers: Hyperion J2EE, and Web Analysis. The remote servers are obtained from the RelatedContent.properties file or Shared Services.
4 You can link a folder for Related Content, which enables an end user to select from the complete contents of the folder, or expand the contents of a folder and select a report. To make a selection, perform any of the following actions:
● To select a folder, highlight the folder in the Available list, then click the arrow button to move the folder to the Selected Related Content area.
● To select a report object, expand the folder by clicking the node (+), highlight a report
object, then click the Add button, , to move the report to the Selected Related Content area.
5 You can modify the properties of the selected report object while you add the link or after you add the link:
168 Providing for Detailed Data and Documents in Reports
● To modify properties while selecting a report object, select the Show Properties dialog when adding content from Hyperion sources check box. As you select a report object to link, the Related Content Properties dialog box is displayed.
● To modify properties after selecting report objects, highlight the report object in the Selected Related Content list, then click the Properties button.
For information on changing properties, see the “Modifying the Properties for Related Content” on page 168.
6 Select as many additional links as needed.
Note: For information about changing the properties of the links, see “Modifying the Properties for Related Content” on page 168.
7 To change the position of a report object within the Selected Related Content list, select the object, then
click the Up arrow or Down arrow to move the report object up or down, respectively.
8 Click OK.
Removing Access from Related ContentYou can remove a link from your report to deny Related Content to end users.
➤ To remove access to a linked report:
1 Select a report that contains links to Related Content.
2 Select the rows, columns, formula, or data cells from which you want to remove a link for Related Content.
3 From the property sheet, select the Add Related Content check box, then click the Setup button. The Add Related Content dialog box is displayed.
4 Highlight the report object to remove in the Selected Related Content list and click the Remove arrow button.
5 Click OK.
Modifying the Properties for Related ContentYou can modify properties of a selected report object. Based on the type of report object selected, you can modify such properties such as its label or URL, and you can set default display options.
➤ To modify properties for linked objects:
1 Create a link to a related content in the Add Related Content dialog box. For information on creating a link, see “Creating Links to Related Content” on page 167.
Using Smart View for Office 169
2 In the Add Related Content dialog box, select a report object in the Selected Related Content list, then click the Properties button to display the Related Content Properties dialog box.
Related Content Properties Dialog boxThe items in the Related Content Properties dialog box that are displayed for editing depend on the report type you selected. For example, for Financial Reporting, all display options are provided for a report, snapshot, book, and snapshot book. However, for a custom link, only the label and a URL fields are available.
The following items are available for editing:
● Label - Enables you to change the name of the report object link.
● URL tabs - Displays the URL of the linked object which may be modified if needed.
● Display Options:
❍ In the Provide list. For Financial Reporting, select the formats that can be viewed by the end user; HTML and / or PDF. For Web Analysis, select whether the report can go to the Java Client, Workspace, or both.
❍ In the Default list. Select the format to link with the report name as the primary selection. The format not selected is listed as the secondary selection.
➤ Click Save As Default to update your current selections.
Using Smart View for OfficeSmart View provides a common Microsoft Office interface for the following Hyperion products:
● Analytic Services
● Financial Management
● Planning
● Financial Reporting
● Interactive Reporting
● Hyperion System 9BI+ Production ReportingTM
● Web Analysis
The centralized interface enables simultaneous use of multiple Hyperion products, and improves integration with Microsoft Office (2000, 2002, and 2003). The Smart View implementation provides the following Workspace functionality:
● Exports the current page of the current data object to Excel, Word, or PowerPoint
● Exposes Financial Management and Analytic Services functions in Excel, Word, and PowerPoint content

170 Providing for Detailed Data and Documents in Reports
● Notifies you when you can upgrade to new releases of Hyperion Smart View.
● For more information on using the capability, see Hyperion System 9 BI+ Workspace User’s Guide.
Previewing and Printing Reports 171
C h a p t e r
8Previewing and Printing Reports
You can preview and print reports and Snapshot reports from Financial Reporting Studio or a Web browser through Workspace. As you preview or print a report, the data is refreshed with new data, calculations, and formatting.
Snapshot reports contain data retrieved at the time the report is saved as a snapshot. The data in a snapshot report remains the same; changes in the database connection since the snapshot was last saved are not reflected when it is previewed or printed.
Note: For viewing and printing options provided through the Workspace. See the Hyperion System 9 BI+ Workspace User’s Guide.
In This Chapter Responding to Prompts when Previewing . . . . . . . . . . . . . . . . . . . . . . . . . . . . . . . . . . . . . . . . . . . . . . . . . . . . . . . 172
Previewing the Current User POV Settings . . . . . . . . . . . . . . . . . . . . . . . . . . . . . . . . . . . . . . . . . . . . . . . . . . . . . . . 172
Setting Preview Preferences . . . . . . . . . . . . . . . . . . . . . . . . . . . . . . . . . . . . . . . . . . . . . . . . . . . . . . . . . . . . . . . . . 173
Previewing Reports in a Web Browser . . . . . . . . . . . . . . . . . . . . . . . . . . . . . . . . . . . . . . . . . . . . . . . . . . . . . . . . . . 173
Previewing Reports in Financial Reporting Studio . . . . . . . . . . . . . . . . . . . . . . . . . . . . . . . . . . . . . . . . . . . . . . . . . 173
Printing Reports. . . . . . . . . . . . . . . . . . . . . . . . . . . . . . . . . . . . . . . . . . . . . . . . . . . . . . . . . . . . . . . . . . . . . . . . . . 174
Printing Tips for Report Designers. . . . . . . . . . . . . . . . . . . . . . . . . . . . . . . . . . . . . . . . . . . . . . . . . . . . . . . . . . . . . 174
172 Previewing and Printing Reports
Responding to Prompts when PreviewingIf the report is designed with prompts, those prompts are displayed when you preview the report. You must respond to the prompt and provide the requested information by selecting members from the prompt list. You can also edit the prompts manually. If the prompts contain alias names, you can edit the alias names by converting to member names. For more information on defining prompts, see Chapter 2, “Selecting Members for Report Designers.”
➤ To respond to a prompt when previewing:
1 From Studio Explore, open a report that has prompts.
2 Under the Selection column in the Respond to Prompts dialog box, perform an action:
● If the member is known, enter the member name in the text box for the respective prompt. If the text box is disabled, the prompt contains alias names. To edit the text box, select the Edit Member Names check box. If multiple members are provided for the prompt, members must be separated by commas.
Note: Selecting the Edit Member Names check box displays the member names in the text box, not the alias names. Edit the member name associated with that alias.
● Click the Go to Member Selection button. The Select Members dialog box opens. The default member is listed in the right panel - selected area. Click the Add to Selected arrow and Remove from Selected arrow located in the center panel of the dialog to move members between the panels.
For more information on defining members, see Chapter 2, “Selecting Members for Report Designers.”
3 Select OK.
4 Optional: To undo changes made to prompts, click Reset from the Respond to Prompts dialog box.
5 Click Run. The report or book is displayed.
Previewing the Current User POV SettingsIn Workspace, a user can preview the user POV before running a report and make changes to the user POV from. For example, it may save time for users to verify that the members on the user POV are appropriate before running the report instead of after the output is displayed.
For information on how a user can preview the user POV settings for a report or book from Workspace, see the Hyperion System 9 BI+ Workspace User’s Guide.
Previewing Reports in Financial Reporting Studio 173
Setting Preview PreferencesUsing Workspace, you can set preview preferences. You can preset how to view a report or book. The default settings for opening a report or book are PDF Preview or HTML Preview. For detailed information on this option, see the Hyperion System 9 BI+ Workspace User’s Guide.
Previewing Reports in a Web BrowserYou can use the Web Preview feature in Studio Explore or the Designer to preview reports in a Web browser through Workspace.
➤ To preview a report in a Web browser, open any type of report and click the Web Preview button on the toolbar. Workspace provides HTML and PDF preview and printing options.
For information on viewing reports and books using Workspace, see the Hyperion System 9 BI+ Workspace User’s Guide.
Previewing Reports in Financial Reporting StudioYou can preview a report to view the contents before saving changes or printing. You can zoom in or zoom out, scroll through the report, or print the report. When you preview a report, the data in the report is refreshed. Data in snapshot reports are not refreshed.
Books are previewed using a Web browser through Workspace. For information on previewing books and reports, see the Hyperion System 9 BI+ Workspace User’s Guide.
➤ To preview a report:
1 From Studio Explore, highlight a report or snapshot.
2 Select File > Print Preview.
3 Optional: Do one of the following tasks:
● Select Print to print the report.
● Select Next Page to display the next page of the report.
● Select Prev Page to display the previous page of the report.
● Select Two Page to preview two pages side-by-side.
● Select Zoom In to magnify the size of the page on the screen.
● Select Zoom Out to decrease the size of the page on the screen.
● Select Close to close the Print Preview window.
● Use the Page Up or Page Down keys on your keyboard to scroll up or down, respectively.
4 Click Close.
174 Previewing and Printing Reports
Printing Reports You can print any type of report. When you print a dynamic report, the data is refreshed. Data in snapshot reports is not refreshed. You can print a report in Explore or design area.
Books and snapshot books are printed through Workspace. For more information on printing books and snapshot books, see the Hyperion System 9 BI+ Workspace User’s Guide.
➤ To print a report:
1 From Studio Explore, open a report.
Respond to prompts that are displayed and make necessary changes.
2 Select File > Print or select the Print button from the toolbar.
Printing Tips for Report DesignersThe following topics describe how report objects are printed on a page. You can place report objects anywhere in a report. However, the printed results are determined by the report properties and data.
Note: When printing reports containing overlapping objects, objects may not print as displayed in the designer, requiring you to rearrange the objects in your report. For more information, see Chapter 4, “Building Reports.”
The following areas are described for designing reports from the Financial Reporting Studio:
● “Positioning and Alignment” on page 174
● “Printing Text Boxes” on page 175
● “Printing Grids” on page 175
● “Printing Page Dimension Headings” on page 175
● “Printing Page Members” on page 176
● “Printing Headers and Footers” on page 176
Positioning and AlignmentYou can set relative positioning on autosized report objects. This is an advanced positioning mechanism that gives you precise control over how report objects are positioned relative to one another. If none of the report objects in your report is autosized, then the relative positioning is ignored.
If you set the position of a report object to relative, all report objects within the design shift so that the distance between the autosized report object and fixed report objects remain the same.
Printing Tips for Report Designers 175
For example, GridA is autosized and has horizontal positioning set to Center, therefore, GridA is printed in the center of the page. ChartA is linked to GridA, and has its vertical position set to Relative and is placed one inch from the bottom edge of GridA. ChartA is printed one inch from the bottom of Grid A.
If the alignment for ChartA is not set to relative, it is printed on the absolute coordinates in the layout of the grid, so it might overwrite Grid A.
Printing Text BoxesYou can set the autosize property for a text box. When you print a report, the height of a text box increases or decreases to accommodate all text that is entered in the text box. The width of the text box does not change.
Note: When you autosize, the maximum number of lines for viewing is 27. To view all lines of text, deselect Autosize.
If the autosize property is not set when you print a report, the report is affected in these ways:
● The text box is printed at the height and width of the grid.
● Text that does not fit in the text box is truncated.
Printing Grids You can set the autosize property for a grid. When the autosize property is set and you print the grid, the height and width of the grid increase or decrease to accommodate all data in the grid.
When the autosize property is not set, the grid is printed at the height and width specified. If a row or column does not fit on a page, it is printed on subsequent pages. The columns are printed first using as many pages as needed, followed by the rows.
You use the positioning properties of the grid to align the grid on the page. Manually positioning the grid to the right or bottom of the page does not ensure that the grid will print on the right or bottom of the report.
When a grid is set to autosize, and does not fit on one page, it is printed on subsequent pages. The columns are printed first, starting on the left margin of the next page, followed by the rows, which are printed starting at the top of the next page.
Printing Page Dimension HeadingsYou can specify a page dimension heading for a grid using the Page Properties sheet. When you print a report, the page dimension heading is printed every time the page member changes.
The following list describes how the page dimension heading is printed:
● The text is left justified at the left edge of the grid.
● The text is autosized vertically, and the width is set to the width of the grid.
176 Previewing and Printing Reports
● The heading is printed above the first row in the grid each time the page member changes.
Printing Page MembersWhen you print a report, a new page is generated every time a page member changes. Using the Page Properties sheet, you can specify how to print the page using one of the following options:
● New Page, Top - The new page is printed at the top of the page. Use this option when a chart is linked to a grid and you want to ensure the chart and grid print next to one another every time the page member changes.
● New Page, Same - The new page is printed at the grid location specified. This option is used for the following situations:
❍ The grid has horizontal and/or vertical alignment properties set and you want the grid to print in the same position on each page. For example, if you set the grid position to Center/Middle, it is printed in the center of each page.
❍ When a chart is linked to a grid and you want to ensure the chart and grid print next to one another every time the page member changes.
● Same Page - The new page is printed immediately after the data from the previous page.
Note: If a chart is linked to a grid, the chart is printed once; not every time the page member changes.
Printing Headers and FootersYou can place an autosized text box in the header. However, if the text box height expands beyond the header, it prints beyond the header boundary.
You can place an autosized text box in the footer. However, if the text box height expands beyond the footer, the text is truncated.
Note: If an object is placed near the top or bottom of the page, it might overlap the header or the footer.
Formatting Reports 177
C h a p t e r
9Formatting Reports
Formatting reports enables you to specify how report components, such as text boxes, grids, images, and charts, appear in your reports. For example, you can specify fonts and add borders. When you format a report, you define the properties of the components. The formatting you apply affects the printed and online report presentation.
Note: Each object has default formatting properties. You can use the default format properties if you do not want to format your report.
In This Chapter Formatting Text Boxes . . . . . . . . . . . . . . . . . . . . . . . . . . . . . . . . . . . . . . . . . . . . . . . . . . . . . . . . . . . . . . . . . . . . . 178
Formatting Grids . . . . . . . . . . . . . . . . . . . . . . . . . . . . . . . . . . . . . . . . . . . . . . . . . . . . . . . . . . . . . . . . . . . . . . . . . 179
About Conditional Formatting. . . . . . . . . . . . . . . . . . . . . . . . . . . . . . . . . . . . . . . . . . . . . . . . . . . . . . . . . . . . . . . . 193
Conditional Suppression . . . . . . . . . . . . . . . . . . . . . . . . . . . . . . . . . . . . . . . . . . . . . . . . . . . . . . . . . . . . . . . . . . . 202
Formatting Images. . . . . . . . . . . . . . . . . . . . . . . . . . . . . . . . . . . . . . . . . . . . . . . . . . . . . . . . . . . . . . . . . . . . . . . . 209
Changing the Page Setup. . . . . . . . . . . . . . . . . . . . . . . . . . . . . . . . . . . . . . . . . . . . . . . . . . . . . . . . . . . . . . . . . . . 210
For general information about report objects, including overlapping objects, see Chapter 4, “Building Reports.” For information about formatting charts, see Chapter 3, “Customizing Charts.”
178 Formatting Reports
Formatting Text BoxesYou can format the text in text boxes using the following attributes:
● “Specifying Fonts for Text Boxes” on page 178
● “Aligining Text in Text Boxes” on page 178
● “Adding Borders and Shading to Text Boxes” on page 179
Specifying Fonts for Text BoxesYou can change the font of text in a text box.
➤ To specify a font:
1 Open a report and select text within a text box.
2 Select Format > Font.
3 Specify the font, font style, size, and color.
4 To place a line through the selected text, select Strikeout.
5 To place a line beneath the selected text, select Underline.
6 Click OK.
Aligining Text in Text BoxesYou can align text in text boxes horizontally. You can also increase or decrease the margin of text in text boxes using the indent option.
The following table explains the text alignment and indentation option settings:
➤ To align text in a text box:
1 Open a report and create a text box or select an existing text box.
2 In the Text Properties property sheet, select one of the following from the Position Object on Report - Horizontal drop-down list.
Table 32 Text Alignment and Indentation Options
Setting Task
Alignment Select Left, Center, or Right to specify the horizontal alignment for text in text boxes. For example, if you select Center, Financial Reporting aligns the text in the center of the text box.
Indent Select the number of spaces to indent the text to the right for left-aligned text.
Note: Indent functionality is limited to left-aligned text.
Formatting Text Boxes 179
● Select None to position the printed text at its current location regardless of whether report objects above it or to its left change in size.
● Select Relative to position the printed text relative to report objects to its left.
● Select Left to position the text box on the left side of the report.
● Select Center to position the text box in the center of the report.
● Select Right to position the text box on the right side of the report.
3 Select one of the following from the Position Object on Report - Vertical drop-down list.
● Select None to position the printed text at its current location regardless of whether report objects above it or to its left change in size.
● Select Relative to position the printed text relative to report objects above it.
● Select Top to position the text box at the top of the report.
● Select Middle to position the text box in the middle of the report.
● Select Bottom to position the text box on the bottom of the report.
Adding Borders and Shading to Text BoxesYou can add a border around a text box, and you can shade the area inside a text box.
➤ To add borders, shading, or both to a text box:
1 Open a report and select a text box.
2 In the Text Properties sheet:
● To place a border around the text box, select the Show Border check box.
● To add shading to the text box, select a shade from the Shading drop-down list.
Formatting GridsFinancial Reporting Studio enables you to perform a variety of formatting options when working with grids. You can use the following functionality to format grids in the designer:
● “Expanding the View of a Grid” on page 180
● “Formatting Numbers in Grids” on page 180
● “Aligning Text in Grids” on page 182
● “Modifying Font Options” on page 184
● “Adding Borders or Shading” on page 185
● “Replacing Text” on page 187
● “Inheriting Cell Formatting” on page 188
● “Copying Cell Formatting” on page 189
● “Hiding Rows, Columns, or Grids” on page 190
180 Formatting Reports
● “Sorting Rows, Columns, and Pages” on page 191
● “Applying Conditional Formatting on Grids” on page 196
Expanding the View of a GridYou can expand the view of a grid to the size of the Report Designer workspace. This is especially helpful when your grid contains many rows and columns. The expanded view enables you to locate cells more easily.
➤ To expand the view of a grid:
1 Right-click the title bar of the grid.
2 Select Zoom.
3 To return to the original view, right-click the title bar of the grid and deselect Zoom.
Formatting Best PracticesCell formatting has precedence over row/column formatting and grid formatting. Cell formatting allows you to make exceptions to row/column formatting and grid formatting. Row/column formatting has precedence over grid formatting. Row/column formatting allows you to make exceptions to grid formatting. Therefore, the correct sequence in formatting a report is to first format the grid, then apply different formatting to rows/columns, then apply specific cell formatting.
Note: Conditional formatting takes precedence over all other formatting and replaces formatting previously set at the grid, row/column, or cell level. For example, if you use conditional formatting to change cell colors, yet want to retain a specific number of decimal places applied with regular formatting, you must specify both formats using conditional formatting.
Formatting Numbers in GridsYou can format how numbers are displayed in a grid. You can specify the following options for an entire grid or for individual cells, rows, or columns:
● Positive number symbols, including prefixes and suffixes
● Negative number symbols, including prefixes and suffixes and an option to display negative numbers in red
● Grouping and Decimal Symbols can be determined by the user’s preferences settings or defined explicitly on the cells in a grid
➤ To format numbers in a grid:
1 Create a grid in a report in the Report Designer, or open an existing report containing a grid.
2 Select a cell.
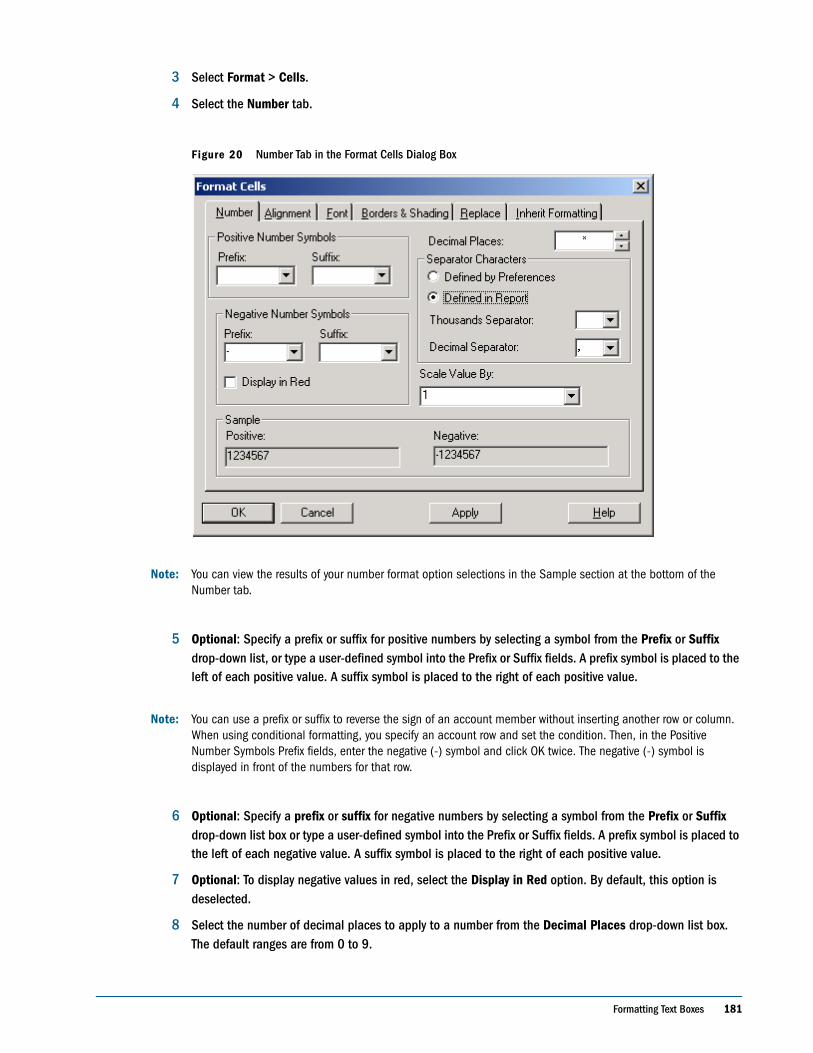
Formatting Text Boxes 181
3 Select Format > Cells.
4 Select the Number tab.
Figure 20 Number Tab in the Format Cells Dialog Box
Note: You can view the results of your number format option selections in the Sample section at the bottom of the Number tab.
5 Optional: Specify a prefix or suffix for positive numbers by selecting a symbol from the Prefix or Suffix drop-down list, or type a user-defined symbol into the Prefix or Suffix fields. A prefix symbol is placed to the left of each positive value. A suffix symbol is placed to the right of each positive value.
Note: You can use a prefix or suffix to reverse the sign of an account member without inserting another row or column. When using conditional formatting, you specify an account row and set the condition. Then, in the Positive Number Symbols Prefix fields, enter the negative (-) symbol and click OK twice. The negative (-) symbol is displayed in front of the numbers for that row.
6 Optional: Specify a prefix or suffix for negative numbers by selecting a symbol from the Prefix or Suffix drop-down list box or type a user-defined symbol into the Prefix or Suffix fields. A prefix symbol is placed to the left of each negative value. A suffix symbol is placed to the right of each positive value.
7 Optional: To display negative values in red, select the Display in Red option. By default, this option is deselected.
8 Select the number of decimal places to apply to a number from the Decimal Places drop-down list box. The default ranges are from 0 to 9.
182 Formatting Reports
9 Select one of the following for Grouping and Decimal Symbols:
● Defined by Preferences if you want to use the symbols specified in the user’s Preferences dialog box. This enables you to determine which symbols are used.
● Defined in Report if you want to specify thousands and decimal separators for the current report:
❍ Select a character for separating thousands in values from the Thousands Separator drop-down list. For example, you can select comma ( , ) to display a value (1,000) or you can select period ( . ) to display a value (1.000). The options are: comma ( , ), period ( . ), underscore ( _ ), and Space. Alternatively, you can specify another symbol in the drop-down by highlighting the field and typing another symbol.
❍ Select a character to represent decimal points (for example, 1,000.06) from the Decimal Separator drop-down list box. The options are: comma ( , ), period ( . ), underscore ( _ ), and Space. Alternatively, you can specify another symbol in the drop-down by highlighting the field and typing another symbol.
10 Select or enter a number from the Scale Value By drop-down list box by which to multiply values for scaling purposes. The default scaling option is 1, which does not scale values. If you select .001 instead, a value of 2,000 is displayed as 2. The options are: percentages, tens, hundreds, thousands, ten thousands, hundred thousands, millions, or billions. Alternatively, you can specify an amount in the drop-down box.
11 Click Apply to apply the number formatting you specified for the selected cells.
12 Click OK to save the number formatting and close the dialog box.
Aligning Text in GridsYou can specify options for aligning and indenting text in selected cells. You can select options for horizontal and vertical alignment. You can also specify the number of character spaces to indent text from the margins of selected cells.
➤ To align text in grids:
1 Create a grid in a report in the Report Designer, or open an existing report containing a grid.
2 Select the cells you want to format.
3 Select Format > Cells to access the Format Cells dialog box.
4 Select the Alignment tab to specify alignment for the selected cells.
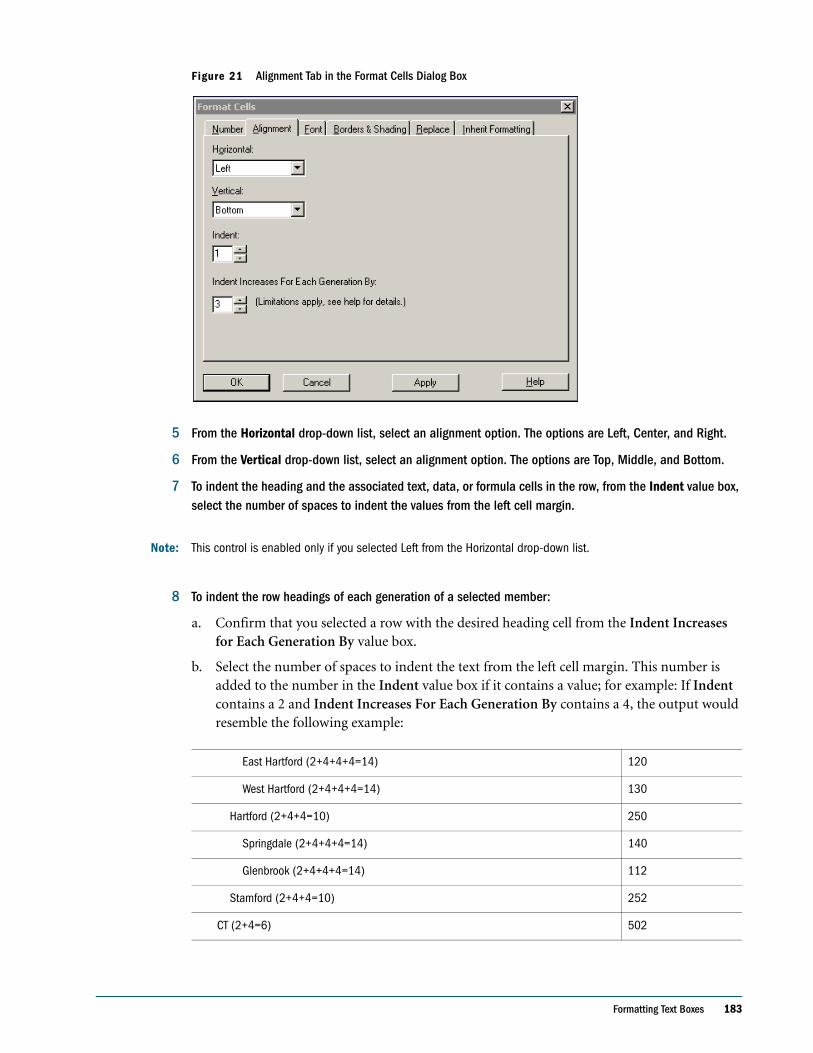
Formatting Text Boxes 183
Figure 21 Alignment Tab in the Format Cells Dialog Box
5 From the Horizontal drop-down list, select an alignment option. The options are Left, Center, and Right.
6 From the Vertical drop-down list, select an alignment option. The options are Top, Middle, and Bottom.
7 To indent the heading and the associated text, data, or formula cells in the row, from the Indent value box, select the number of spaces to indent the values from the left cell margin.
Note: This control is enabled only if you selected Left from the Horizontal drop-down list.
8 To indent the row headings of each generation of a selected member:
a. Confirm that you selected a row with the desired heading cell from the Indent Increases for Each Generation By value box.
b. Select the number of spaces to indent the text from the left cell margin. This number is added to the number in the Indent value box if it contains a value; for example: If Indent contains a 2 and Indent Increases For Each Generation By contains a 4, the output would resemble the following example:
East Hartford (2+4+4+4=14) 120
West Hartford (2+4+4+4=14) 130
Hartford (2+4+4=10) 250
Springdale (2+4+4+4=14) 140
Glenbrook (2+4+4+4=14) 112
Stamford (2+4+4=10) 252
CT (2+4=6) 502
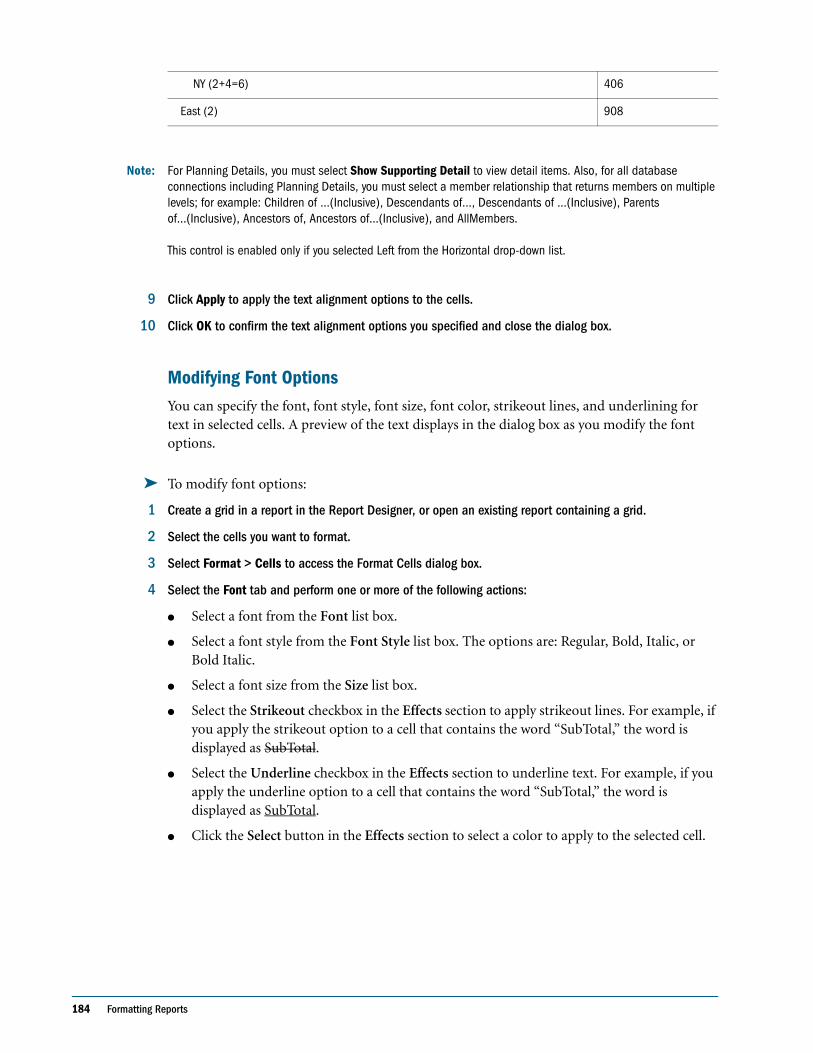
184 Formatting Reports
Note: For Planning Details, you must select Show Supporting Detail to view detail items. Also, for all database connections including Planning Details, you must select a member relationship that returns members on multiple levels; for example: Children of ...(Inclusive), Descendants of..., Descendants of ...(Inclusive), Parents of...(Inclusive), Ancestors of, Ancestors of...(Inclusive), and AllMembers. This control is enabled only if you selected Left from the Horizontal drop-down list.
9 Click Apply to apply the text alignment options to the cells.
10 Click OK to confirm the text alignment options you specified and close the dialog box.
Modifying Font OptionsYou can specify the font, font style, font size, font color, strikeout lines, and underlining for text in selected cells. A preview of the text displays in the dialog box as you modify the font options.
➤ To modify font options:
1 Create a grid in a report in the Report Designer, or open an existing report containing a grid.
2 Select the cells you want to format.
3 Select Format > Cells to access the Format Cells dialog box.
4 Select the Font tab and perform one or more of the following actions:
● Select a font from the Font list box.
● Select a font style from the Font Style list box. The options are: Regular, Bold, Italic, or Bold Italic.
● Select a font size from the Size list box.
● Select the Strikeout checkbox in the Effects section to apply strikeout lines. For example, if you apply the strikeout option to a cell that contains the word “SubTotal,” the word is displayed as SubTotal.
● Select the Underline checkbox in the Effects section to underline text. For example, if you apply the underline option to a cell that contains the word “SubTotal,” the word is displayed as SubTotal.
● Click the Select button in the Effects section to select a color to apply to the selected cell.
NY (2+4=6) 406
East (2) 908
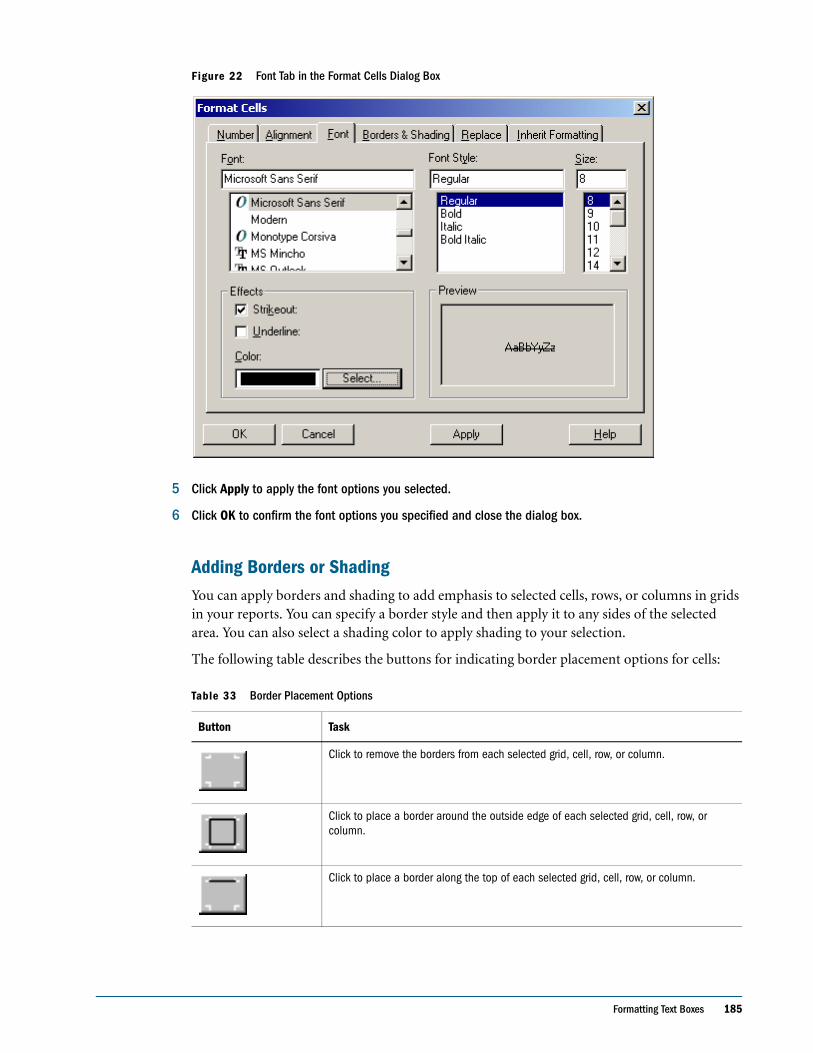
Formatting Text Boxes 185
Figure 22 Font Tab in the Format Cells Dialog Box
5 Click Apply to apply the font options you selected.
6 Click OK to confirm the font options you specified and close the dialog box.
Adding Borders or ShadingYou can apply borders and shading to add emphasis to selected cells, rows, or columns in grids in your reports. You can specify a border style and then apply it to any sides of the selected area. You can also select a shading color to apply shading to your selection.
The following table describes the buttons for indicating border placement options for cells:
Table 33 Border Placement Options
Button Task
Click to remove the borders from each selected grid, cell, row, or column.
Click to place a border around the outside edge of each selected grid, cell, row, or column.
Click to place a border along the top of each selected grid, cell, row, or column.
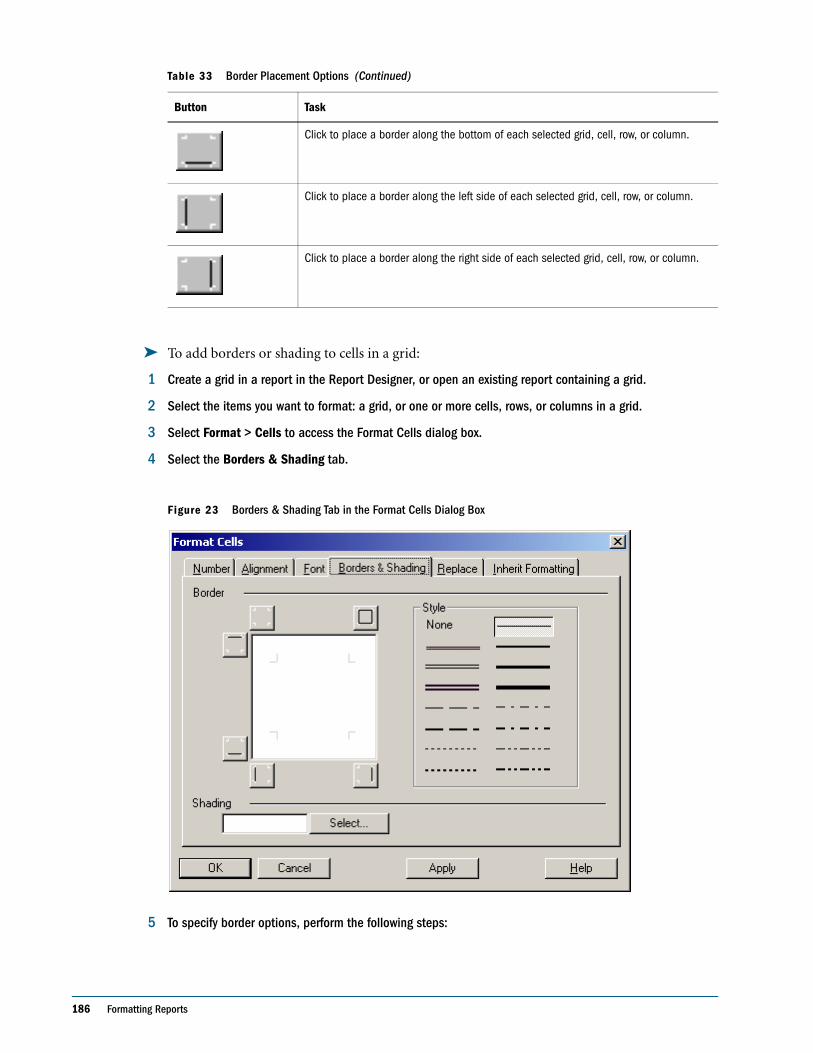
186 Formatting Reports
➤ To add borders or shading to cells in a grid:
1 Create a grid in a report in the Report Designer, or open an existing report containing a grid.
2 Select the items you want to format: a grid, or one or more cells, rows, or columns in a grid.
3 Select Format > Cells to access the Format Cells dialog box.
4 Select the Borders & Shading tab.
Figure 23 Borders & Shading Tab in the Format Cells Dialog Box
5 To specify border options, perform the following steps:
Click to place a border along the bottom of each selected grid, cell, row, or column.
Click to place a border along the left side of each selected grid, cell, row, or column.
Click to place a border along the right side of each selected grid, cell, row, or column.
Table 33 Border Placement Options (Continued)
Button Task
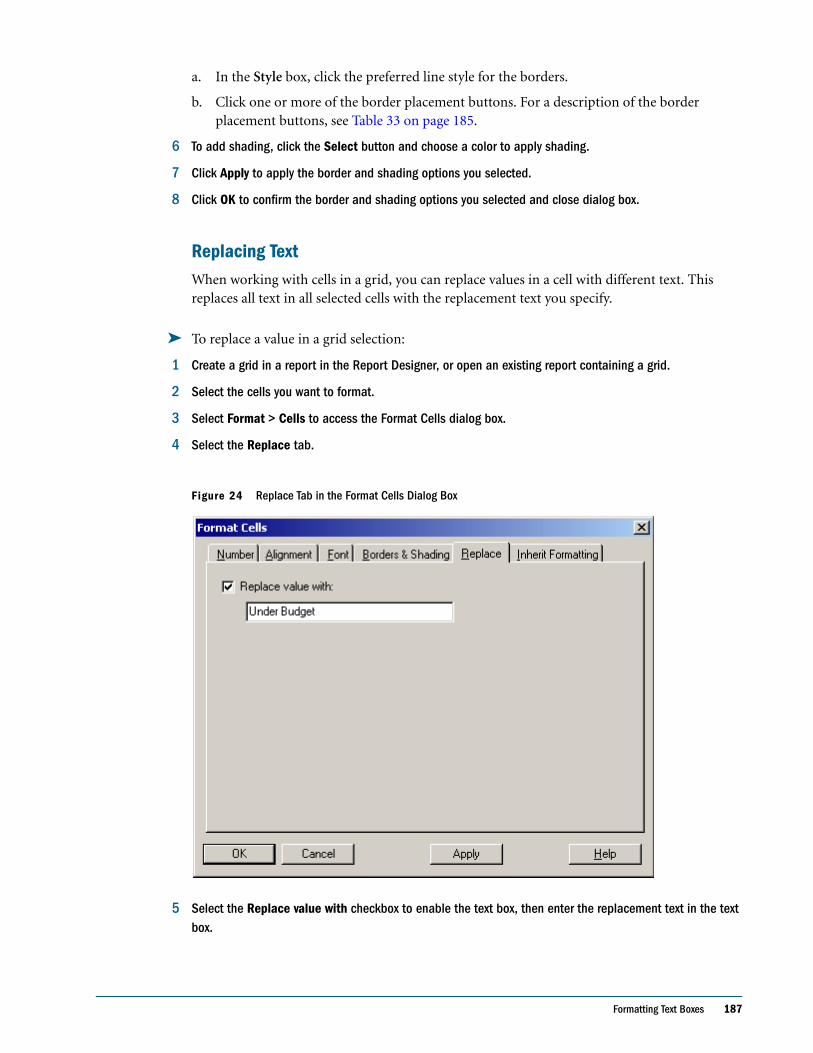
Formatting Text Boxes 187
a. In the Style box, click the preferred line style for the borders.
b. Click one or more of the border placement buttons. For a description of the border placement buttons, see Table 33 on page 185.
6 To add shading, click the Select button and choose a color to apply shading.
7 Click Apply to apply the border and shading options you selected.
8 Click OK to confirm the border and shading options you selected and close dialog box.
Replacing TextWhen working with cells in a grid, you can replace values in a cell with different text. This replaces all text in all selected cells with the replacement text you specify.
➤ To replace a value in a grid selection:
1 Create a grid in a report in the Report Designer, or open an existing report containing a grid.
2 Select the cells you want to format.
3 Select Format > Cells to access the Format Cells dialog box.
4 Select the Replace tab.
Figure 24 Replace Tab in the Format Cells Dialog Box
5 Select the Replace value with checkbox to enable the text box, then enter the replacement text in the text box.
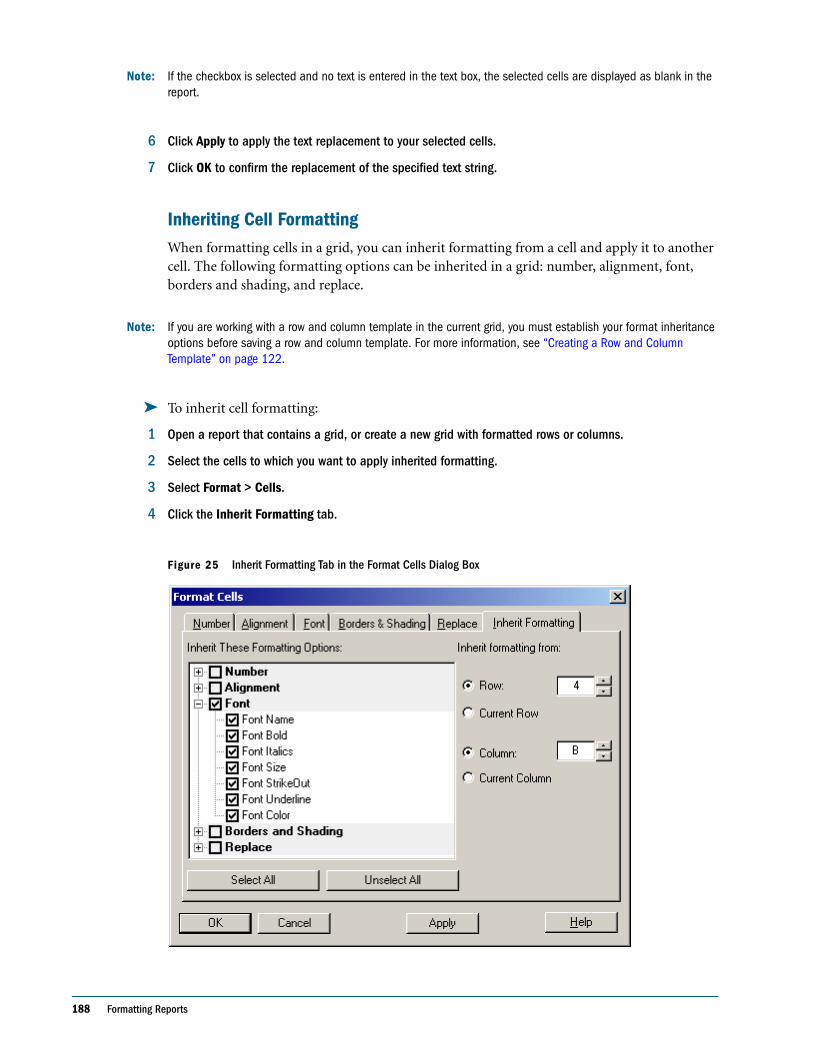
188 Formatting Reports
Note: If the checkbox is selected and no text is entered in the text box, the selected cells are displayed as blank in the report.
6 Click Apply to apply the text replacement to your selected cells.
7 Click OK to confirm the replacement of the specified text string.
Inheriting Cell FormattingWhen formatting cells in a grid, you can inherit formatting from a cell and apply it to another cell. The following formatting options can be inherited in a grid: number, alignment, font, borders and shading, and replace.
Note: If you are working with a row and column template in the current grid, you must establish your format inheritance options before saving a row and column template. For more information, see “Creating a Row and Column Template” on page 122.
➤ To inherit cell formatting:
1 Open a report that contains a grid, or create a new grid with formatted rows or columns.
2 Select the cells to which you want to apply inherited formatting.
3 Select Format > Cells.
4 Click the Inherit Formatting tab.
Figure 25 Inherit Formatting Tab in the Format Cells Dialog Box
Formatting Text Boxes 189
5 In the Inherit These Formatting Options area, expand the plus (+) symbols and click the box to select the formatting options to inherit, including number, alignment, font, borders and shading, and replace text, as illustrated in Figure 25.
Note: To select all formatting options, click Select All. To deselect all formatting options, click Unselect All.
Tip: To specify the row or column from which you want to inherit formatting, you must first specify the options you want to inherit (number, alignment, font, borders and shading, and replace).
6 In the Inherit formatting from area, select the row or column from which to inherit formatting, using the up and down arrows. Choose from the following inheritance options:
● Select the current row and another column
Tip: Use the up and down arrow keys to make your selection.
● Select the current column and another row
● Select another row and another column
Note: You can only inherit from a cell that does not have previously defined inheritance. For example, if you format column A and then inherit formatting into column B, you cannot then inherit formatting from column B into column C. You can, however, format column A, select columns B and C, and inherit formatting for column B and C from column A.
7 Click Apply.
8 Click OK.
Note: If you have inherited formatting and then modify the format of the cell to which you inherited formatting, the inheritance you established no longer applies. For example, if you inherit the font name property in cell A4 from cell B4 and you subsequently modify the font name in cell A4, the format inheritance no longer exists. This breaks the formatting link that was previously established between the two cells.
Copying Cell FormattingYou can copy cell formatting from a cell or range of cells and apply it to a destination cell or range of cells in a grid using Format Painter.
Note: Format Painter does not copy inherited formatting or conditional formatting.
➤ To copy cell formatting:
1 Create a grid in a report, or open an existing report containing a grid.
190 Formatting Reports
2 Format a cell or range of cells using grid formatting. For more information, see “Formatting Grids” on page 179.
3 Select the cell or range of cells containing the formatting to copy.
4 Click .
5 Select the destination cell or range of cells to apply the copied formatting. The formatting is changed when you release the mouse.
Hiding Rows, Columns, or GridsYou can hide rows, columns, or an entire grid so that their values are not displayed when you print or view a report. You might want to hide a grid, for example, if you include a chart based on the grid data and want to display only the chart on the report. When the grid is hidden, the grid’s title bar changes from blue to gray.
The data and calculations in rows or columns are evaluated, regardless of the formatting that is applied to them.
➤ To hide a grid:
1 Create a grid in a report in the Report Designer, or open an existing report containing a grid.
2 Select a grid.
3 In the Grid Properties property sheet, select Suppression category.
4 Select the Hide Grid check box.
➤ To hide a row or column:
1 Create a grid in a report in the Report Designer, or open an existing report containing a grid.
2 Select a row or column.
3 Select the Hide Always check box.
Note: You can specify whether the data values of hidden row or column are taken into account during suppression. For information on this option, see the next topic, “Controlling the Evaluation of Suppression in Hidden Rows or Columns.’
Controlling the Evaluation of Suppression in Hidden Rows or ColumnsWhen evaluating suppression, you can include or ignore the values and calculations in a hidden row or column. This option is enabled only when the Hide Always check box is selected for the row or column.
Formatting Text Boxes 191
➤ To specify if hidden rows or columns are taken into account during suppression:
1 Select a hidden row or column.
2 Perform an action:
● To include values and calculations, deselect the Suppression Ignores Row or Column check box. This is the default setting.
● To ignore values and calculations, select the Suppression Ignores Row or Column check box.
Note: Hidden cells are ignored when suppression is evaluated unless they are specifically referenced using conditional suppression. For more information, see “Conditional Suppression” on page 202.
Sorting Rows, Columns, and PagesYou can sort a range of consecutive rows or columns in a grid based on the values in a specified column or row. You can also sort columns, rows, and pages based on their headings. If you select a range of columns, the system sorts the columns based on the values in a specified row. If you select a range of rows, the system sorts the rows based on the values in a specified column. If the column or row by which you sort contains multiple members, the sort is based only on the values of the first member.
You can sort columns or rows in ascending or descending order. When you sort in ascending order the lowest number, the beginning of the alphabet, or the earliest date appears first in the sorted list. When you sort in descending order, the highest number, the end of the alphabet, or the latest date appears first in the sorted list.
You can sort only multiple ranges of columns or rows. Suppressed rows or columns are not sorted.
➤ To sort a range of rows and columns:
1 Create a grid in a report in the Report Designer, or open an existing report containing a grid.
2 Set up sorting for the grid:
a. Select a grid to display Grid Properties sheet.
b. Select the General category.
c. Select Sort, and click Setup to display the Sort Dialog box.
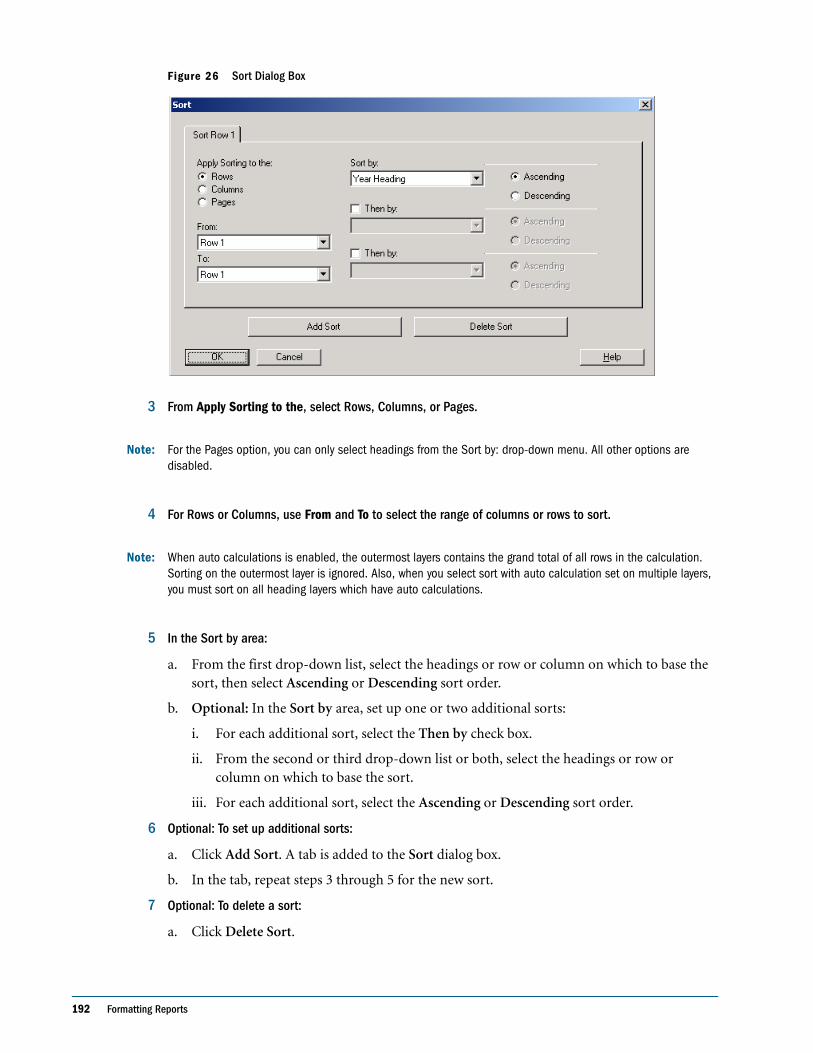
192 Formatting Reports
Figure 26 Sort Dialog Box
3 From Apply Sorting to the, select Rows, Columns, or Pages.
Note: For the Pages option, you can only select headings from the Sort by: drop-down menu. All other options are disabled.
4 For Rows or Columns, use From and To to select the range of columns or rows to sort.
Note: When auto calculations is enabled, the outermost layers contains the grand total of all rows in the calculation. Sorting on the outermost layer is ignored. Also, when you select sort with auto calculation set on multiple layers, you must sort on all heading layers which have auto calculations.
5 In the Sort by area:
a. From the first drop-down list, select the headings or row or column on which to base the sort, then select Ascending or Descending sort order.
b. Optional: In the Sort by area, set up one or two additional sorts:
i. For each additional sort, select the Then by check box.
ii. From the second or third drop-down list or both, select the headings or row or column on which to base the sort.
iii. For each additional sort, select the Ascending or Descending sort order.
6 Optional: To set up additional sorts:
a. Click Add Sort. A tab is added to the Sort dialog box.
b. In the tab, repeat steps 3 through 5 for the new sort.
7 Optional: To delete a sort:
a. Click Delete Sort.
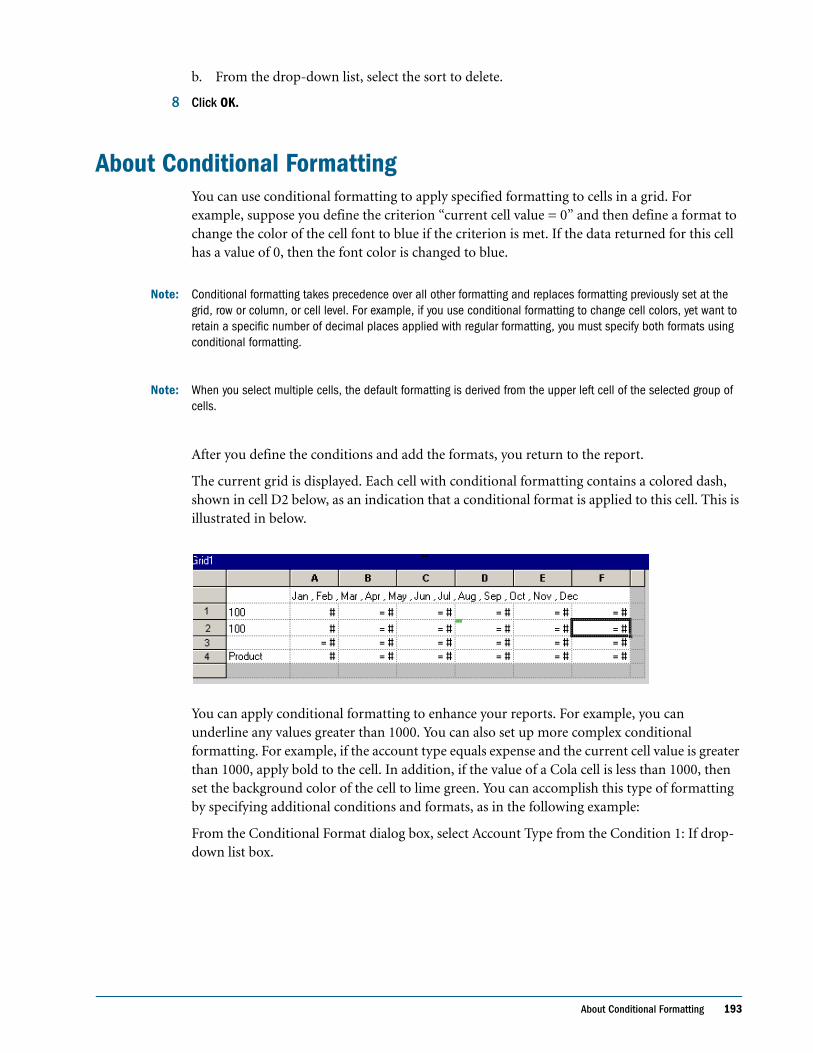
About Conditional Formatting 193
b. From the drop-down list, select the sort to delete.
8 Click OK.
About Conditional FormattingYou can use conditional formatting to apply specified formatting to cells in a grid. For example, suppose you define the criterion “current cell value = 0” and then define a format to change the color of the cell font to blue if the criterion is met. If the data returned for this cell has a value of 0, then the font color is changed to blue.
Note: Conditional formatting takes precedence over all other formatting and replaces formatting previously set at the grid, row or column, or cell level. For example, if you use conditional formatting to change cell colors, yet want to retain a specific number of decimal places applied with regular formatting, you must specify both formats using conditional formatting.
Note: When you select multiple cells, the default formatting is derived from the upper left cell of the selected group of cells.
After you define the conditions and add the formats, you return to the report.
The current grid is displayed. Each cell with conditional formatting contains a colored dash, shown in cell D2 below, as an indication that a conditional format is applied to this cell. This is illustrated in below.
You can apply conditional formatting to enhance your reports. For example, you can underline any values greater than 1000. You can also set up more complex conditional formatting. For example, if the account type equals expense and the current cell value is greater than 1000, apply bold to the cell. In addition, if the value of a Cola cell is less than 1000, then set the background color of the cell to lime green. You can accomplish this type of formatting by specifying additional conditions and formats, as in the following example:
From the Conditional Format dialog box, select Account Type from the Condition 1: If drop-down list box.
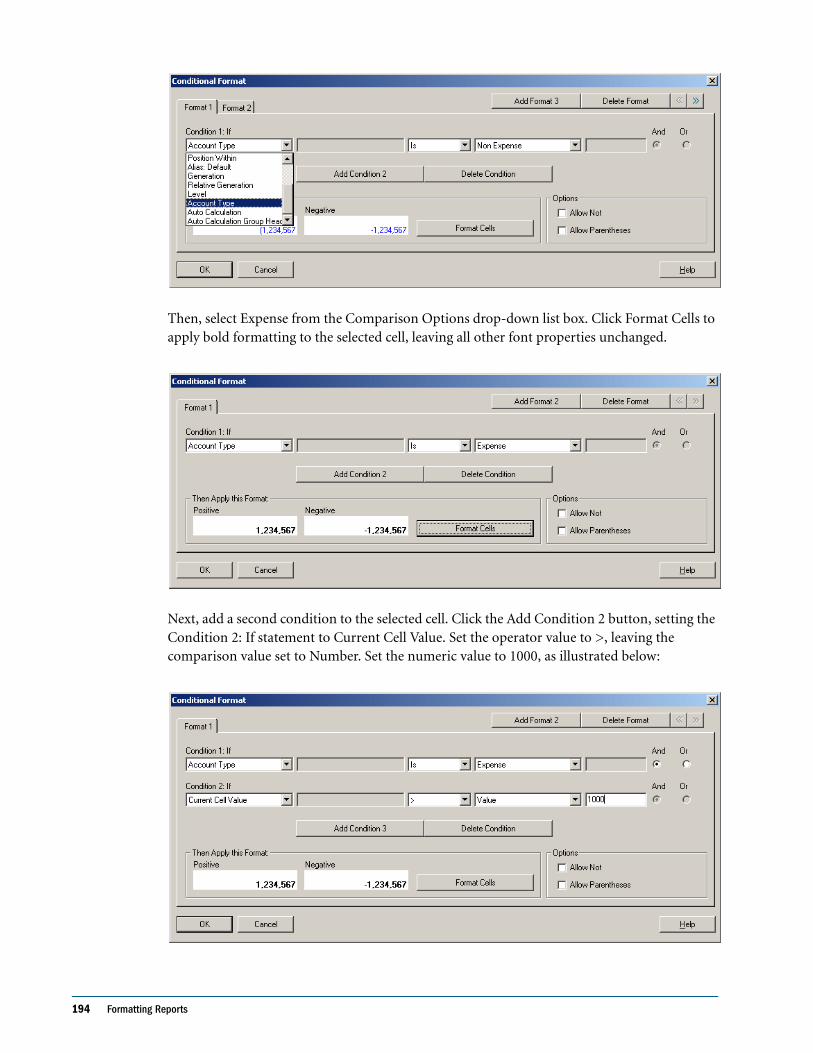
194 Formatting Reports
Then, select Expense from the Comparison Options drop-down list box. Click Format Cells to apply bold formatting to the selected cell, leaving all other font properties unchanged.
Next, add a second condition to the selected cell. Click the Add Condition 2 button, setting the Condition 2: If statement to Current Cell Value. Set the operator value to >, leaving the comparison value set to Number. Set the numeric value to 1000, as illustrated below:
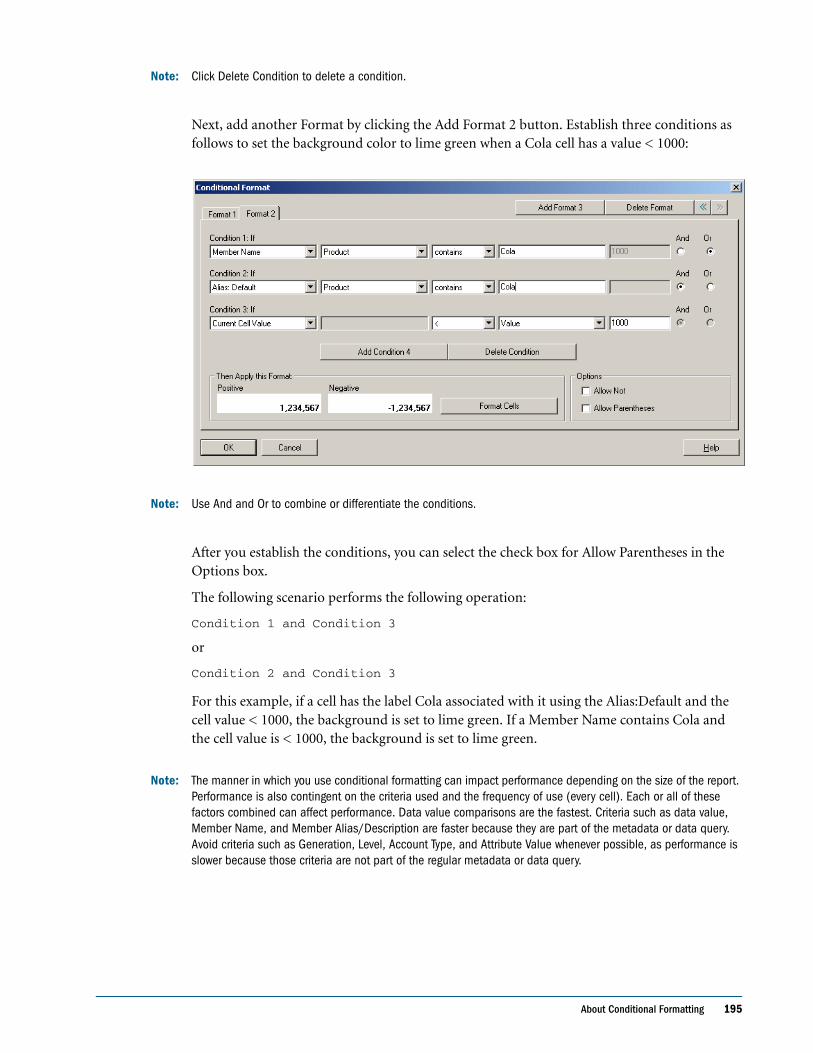
About Conditional Formatting 195
Note: Click Delete Condition to delete a condition.
Next, add another Format by clicking the Add Format 2 button. Establish three conditions as follows to set the background color to lime green when a Cola cell has a value < 1000:
Note: Use And and Or to combine or differentiate the conditions.
After you establish the conditions, you can select the check box for Allow Parentheses in the Options box.
The following scenario performs the following operation:
Condition 1 and Condition 3
or
Condition 2 and Condition 3
For this example, if a cell has the label Cola associated with it using the Alias:Default and the cell value < 1000, the background is set to lime green. If a Member Name contains Cola and the cell value is < 1000, the background is set to lime green.
Note: The manner in which you use conditional formatting can impact performance depending on the size of the report. Performance is also contingent on the criteria used and the frequency of use (every cell). Each or all of these factors combined can affect performance. Data value comparisons are the fastest. Criteria such as data value, Member Name, and Member Alias/Description are faster because they are part of the metadata or data query. Avoid criteria such as Generation, Level, Account Type, and Attribute Value whenever possible, as performance is slower because those criteria are not part of the regular metadata or data query.
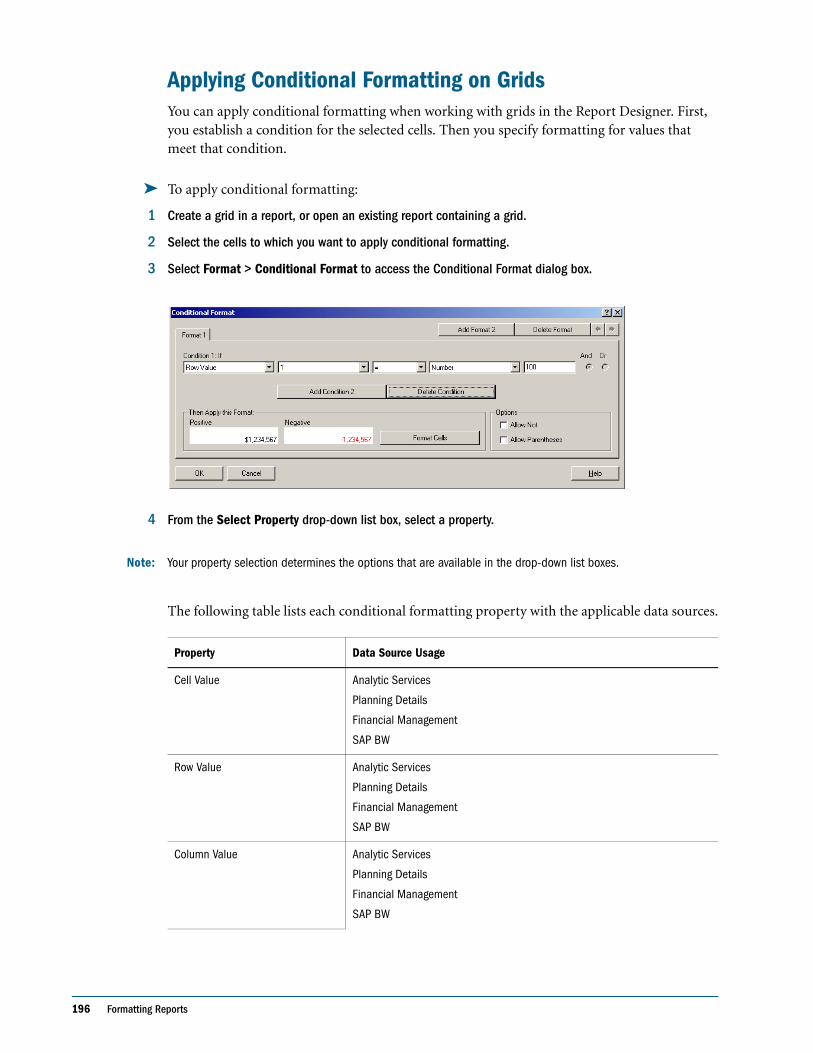
196 Formatting Reports
Applying Conditional Formatting on GridsYou can apply conditional formatting when working with grids in the Report Designer. First, you establish a condition for the selected cells. Then you specify formatting for values that meet that condition.
➤ To apply conditional formatting:
1 Create a grid in a report, or open an existing report containing a grid.
2 Select the cells to which you want to apply conditional formatting.
3 Select Format > Conditional Format to access the Conditional Format dialog box.
4 From the Select Property drop-down list box, select a property.
Note: Your property selection determines the options that are available in the drop-down list boxes.
The following table lists each conditional formatting property with the applicable data sources.
Property Data Source Usage
Cell Value Analytic Services
Planning Details
Financial Management
SAP BW
Row Value Analytic Services
Planning Details
Financial Management
SAP BW
Column Value Analytic Services
Planning Details
Financial Management
SAP BW
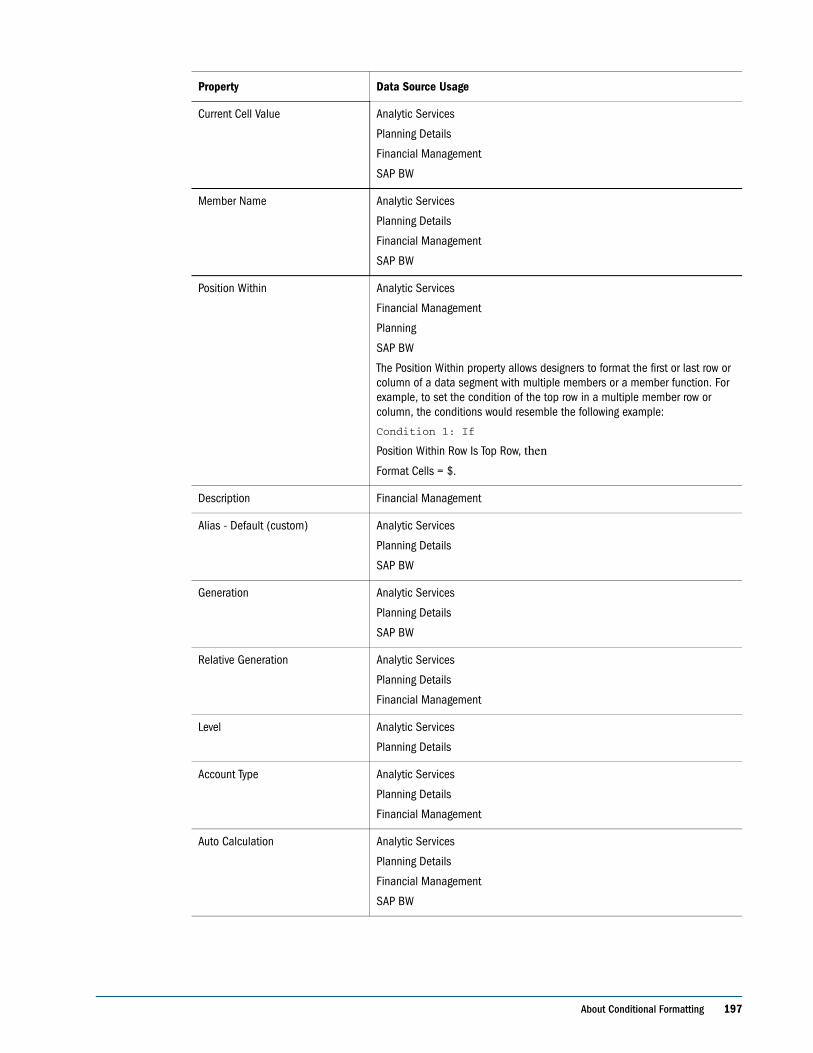
About Conditional Formatting 197
Current Cell Value Analytic Services
Planning Details
Financial Management
SAP BW
Member Name Analytic Services
Planning Details
Financial Management
SAP BW
Position Within Analytic Services
Financial Management
Planning
SAP BW
The Position Within property allows designers to format the first or last row or column of a data segment with multiple members or a member function. For example, to set the condition of the top row in a multiple member row or column, the conditions would resemble the following example:
Condition 1: If
Position Within Row Is Top Row, then
Format Cells = $.
Description Financial Management
Alias - Default (custom) Analytic Services
Planning Details
SAP BW
Generation Analytic Services
Planning Details
SAP BW
Relative Generation Analytic Services
Planning Details
Financial Management
Level Analytic Services
Planning Details
Account Type Analytic Services
Planning Details
Financial Management
Auto Calculation Analytic Services
Planning Details
Financial Management
SAP BW
Property Data Source Usage
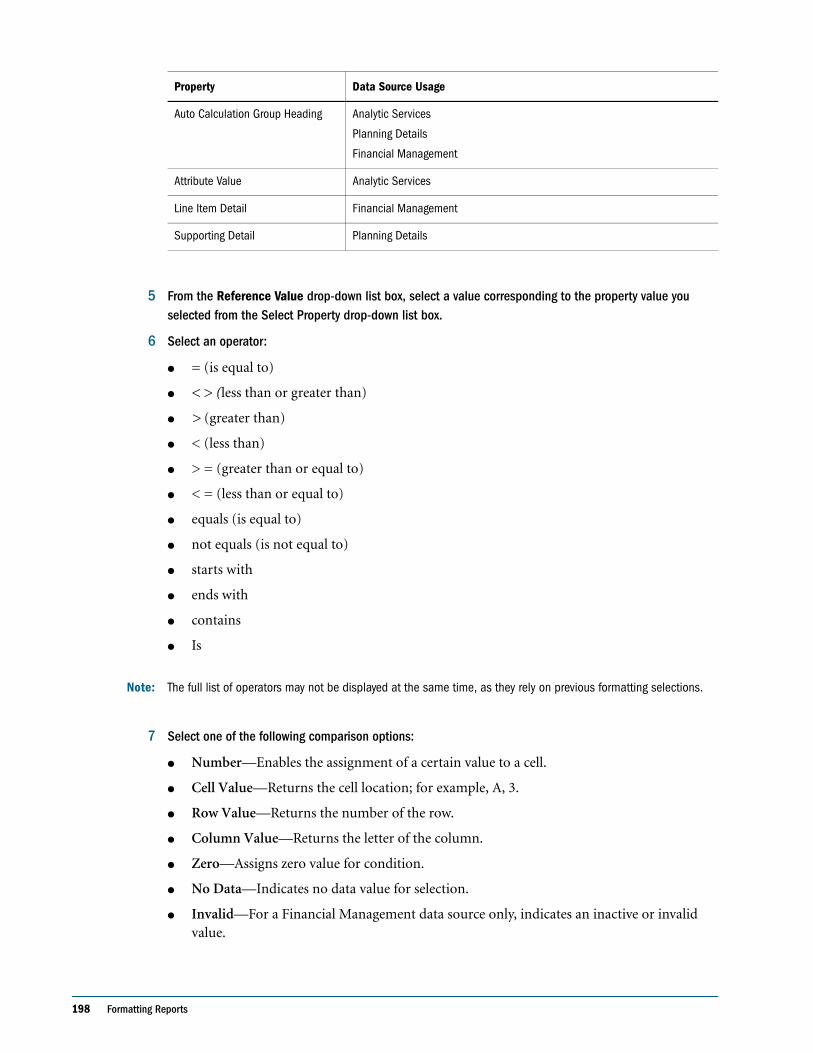
198 Formatting Reports
5 From the Reference Value drop-down list box, select a value corresponding to the property value you selected from the Select Property drop-down list box.
6 Select an operator:
● = (is equal to)
● < > (less than or greater than)
● > (greater than)
● < (less than)
● > = (greater than or equal to)
● < = (less than or equal to)
● equals (is equal to)
● not equals (is not equal to)
● starts with
● ends with
● contains
● Is
Note: The full list of operators may not be displayed at the same time, as they rely on previous formatting selections.
7 Select one of the following comparison options:
● Number—Enables the assignment of a certain value to a cell.
● Cell Value—Returns the cell location; for example, A, 3.
● Row Value—Returns the number of the row.
● Column Value—Returns the letter of the column.
● Zero—Assigns zero value for condition.
● No Data—Indicates no data value for selection.
● Invalid—For a Financial Management data source only, indicates an inactive or invalid value.
Auto Calculation Group Heading Analytic Services
Planning Details
Financial Management
Attribute Value Analytic Services
Line Item Detail Financial Management
Supporting Detail Planning Details
Property Data Source Usage
About Conditional Formatting 199
● Error—Assigns the condition as an error.
● String—Enables the definition of a string for the condition.
● 0, 1, 2,...—Indicates the number of levels or generations in the selected dimension.
Note: The options in the drop-down list depend on your property selection.
8 To add another condition, click the Add Format 2 button. Repeat step 4 through step 7 to continue adding conditions.
Note: The number on this button changes to as many as 7 as you add conditions.
9 Select And to combine this condition with the next condition, or select Or to distinguish this condition from the next condition.
10 Click Format Cells to assign a format to the condition. For more information, see “Formatting Grids” on page 179.
11 Use the Allow Not and Allow Parentheses check boxes, located in the Options section of the Conditional Format dialog box, to establish logic for conditions:
● Allow Not enables you to negate a condition.
● Allow Parentheses enables you to define precedence, or order of consideration for conditions, and specify the set of conditions as intended.
12 When you finish adding conditions for Format 1, perform an action:
● To return to the grid in your report, click OK.
● To add another format to your selection, click Add Format 2. For more information, see “Adding Conditional Formats” on page 200.
Deleting ConditionsYou can delete a condition if it is no longer applicable to the grid, cell, row, or column. This functionality enables you to delete a single condition rather than an entire format, which can hold as many as seven conditions. For information on deleting formats, see “Deleting Conditional Formats” on page 201.
➤ To delete conditions:
1 Create a grid in a report in the Report Designer, or open an existing report containing a grid with conditional formatting applied.
2 Select a grid or one or more cells, rows, or columns in a grid to which conditional formatting is applied.
3 Select Format > Conditional Format.
4 In the Conditional Format dialog box, click the Delete Format button. Use the drop-down list to select the condition to delete.
200 Formatting Reports
5 Click OK.
Adding Conditional FormatsYou can specify as many as seven formats when applying conditional formatting. For each format, you can create as many as seven conditions.
Additional formats are added to enable the application of multiple formats when different conditions are met. After a condition, or conditions, is formatted, you can add another format that is tied to the cell.
For example, you can create one format that contains row and column numerical conditions to be applied to the selected cell. Then, you can create another format that specifies text color, shading, or alignment for the selected cell.
➤ To add a format:
1 Create a grid in a report in the Report Designer, or open an existing report containing a grid.
2 Select the cells you want to format.
3 Select Format > Conditional Format to access the Conditional Format dialog box.
4 Add a condition to the cell, as described in “Applying Conditional Formatting on Grids” on page 196.
5 Click the Add Format #, where # is the number of the next format to be added.
6 Specify conditions to be included in the format.
7 To add more conditions and formats, repeat step 4 through step 6 as needed.
8 When completed, click OK.
Changing the Order of Conditional FormatsAfter you add multiple formats, you can change the order in which the conditions are evaluated and formats are applied to the selected cells. For example, suppose you specified a blue format for cells with a value of zero. In the second format, you specified a column value equal to the cell value and a row value equal to a specific number. Then, you specified a third format for the selected cell.
Using the arrows in the upper right corner of Conditional Format dialog box, you can change the order in which the formats are applied to a selected cell. The order of the formats is significant, because formats are absolute. The conditions created in the first format take precedence over the other formats and conditions.
➤ To change the order of the conditional formats:
1 Create a grid in a report in the Report Designer or open an existing report containing a grid.
2 Select the cells whose format order you want to modify.
3 Select Format > Conditional Format.
About Conditional Formatting 201
4 Add three formats, as described in “Adding Conditional Formats” on page 200.
5 Select the format tab whose order you want to change.
6 Do either of the following:
● To move a formatted tab to the left, click the Move Left button, .
● To move a formatted tab to the right, click the Move Format Tab Right button, .
7 Click OK to return to the grid.
Deleting Conditional FormatsYou can delete a format when the conditions it contains are no longer applicable. For example, if a format contains six conditions and you delete the format, you delete all six conditions contained in that one format.
➤ To delete a format:
1 Create a grid in a report in the Report Designer, or open an existing report containing a grid.
2 Select a cell containing a numerical value with conditional formatting.
Note: Cells with conditional formatting are indicated with a colored bar.
3 Click Format > Conditional Format.
4 Click Delete Format. From the drop-down list, select the format number you want to delete.
5 Click OK to return to the grid.
Changing Row Height and Column WidthYou can change row heights and column widths in grids. You can apply these changes to the entire grid or to specific rows or columns.
➤ To change row height and column width:
1 Create a grid in a report in the Report Designer, or open an existing report containing a grid.
2 Select the rows or columns to format.
3 Perform an action:
● To specify the row height, select a row and enter a value in the Row Height field on the Row Properties property sheet.
Tip: You can also use the arrows to increase or decrease the value.
202 Formatting Reports
● To specify the column width, select a column and enter a value in the Column Width field on the Column Properties property sheet.
Tip: You can also drag the handle of a row or column in the grid to the desired size. If you make a row or column too small to see, when the pointer becomes a split line, drag the row or column handle until the row or column is visible.
Merging Cells into One CellYou can combine two or more cells into one cell in a grid. For example, you can combine several cells to create one data cell, text cell, or formula cell. When you merge cells, the value and format of the upper-left cell is placed into the resulting merged cell. When the merged cell is separated into individual cells, all resulting cells inherit the formatting of the previously merged cell.
➤ To merge cells:
1 Open a report that contains a grid.
2 Select the cells to merge.
3 Right-click the selected cells, then select Merge.
Tip: To change the formatting of the merged cell, such as changing the alignment and font selection, select Format > Cells.
➤ To separate a merged cell into individual cells:
1 Open a report that contains a grid.
2 Select the merged cell.
3 Right-click the selected cell, then select Merge. The resulting cells inherit the formatting of the previously merged cell.
Conditional SuppressionYou can suppress the display of rows, columns, or grids using one or both of the following methods:
● Use the Basic option to suppress rows, columns, or grids based upon If Zero, If Missing, and If Error. For procedures, see “Using the Basic Option in Conditional Suppression” on page 204.
● Use the Advanced option to suppress rows, columns, or grids based on a variety of attributes. For example, you can specify that if a row contains cells with values below 100, the entire row is suppressed. For more information on using this type of conditional suppression, see “Using the Advanced Option in Conditional Suppression” on page 205.
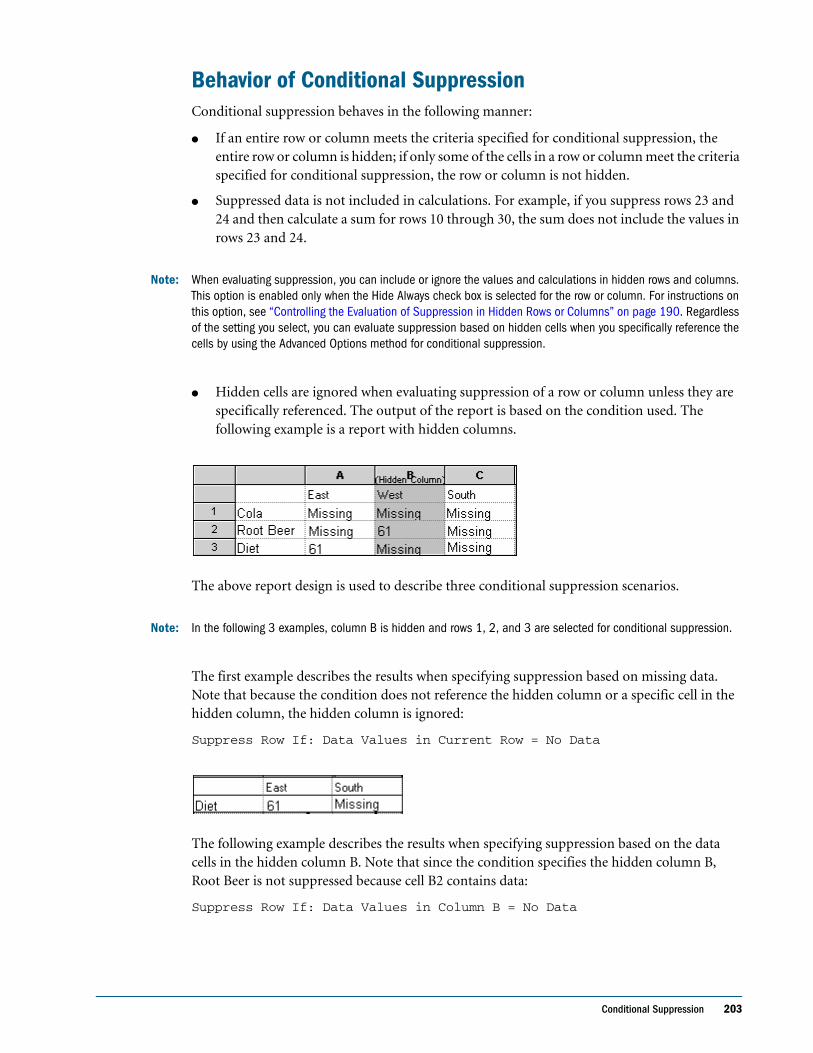
Conditional Suppression 203
Behavior of Conditional SuppressionConditional suppression behaves in the following manner:
● If an entire row or column meets the criteria specified for conditional suppression, the entire row or column is hidden; if only some of the cells in a row or column meet the criteria specified for conditional suppression, the row or column is not hidden.
● Suppressed data is not included in calculations. For example, if you suppress rows 23 and 24 and then calculate a sum for rows 10 through 30, the sum does not include the values in rows 23 and 24.
Note: When evaluating suppression, you can include or ignore the values and calculations in hidden rows and columns. This option is enabled only when the Hide Always check box is selected for the row or column. For instructions on this option, see “Controlling the Evaluation of Suppression in Hidden Rows or Columns” on page 190. Regardless of the setting you select, you can evaluate suppression based on hidden cells when you specifically reference the cells by using the Advanced Options method for conditional suppression.
● Hidden cells are ignored when evaluating suppression of a row or column unless they are specifically referenced. The output of the report is based on the condition used. The following example is a report with hidden columns.
The above report design is used to describe three conditional suppression scenarios.
Note: In the following 3 examples, column B is hidden and rows 1, 2, and 3 are selected for conditional suppression.
The first example describes the results when specifying suppression based on missing data. Note that because the condition does not reference the hidden column or a specific cell in the hidden column, the hidden column is ignored:
Suppress Row If: Data Values in Current Row = No Data
The following example describes the results when specifying suppression based on the data cells in the hidden column B. Note that since the condition specifies the hidden column B, Root Beer is not suppressed because cell B2 contains data:
Suppress Row If: Data Values in Column B = No Data
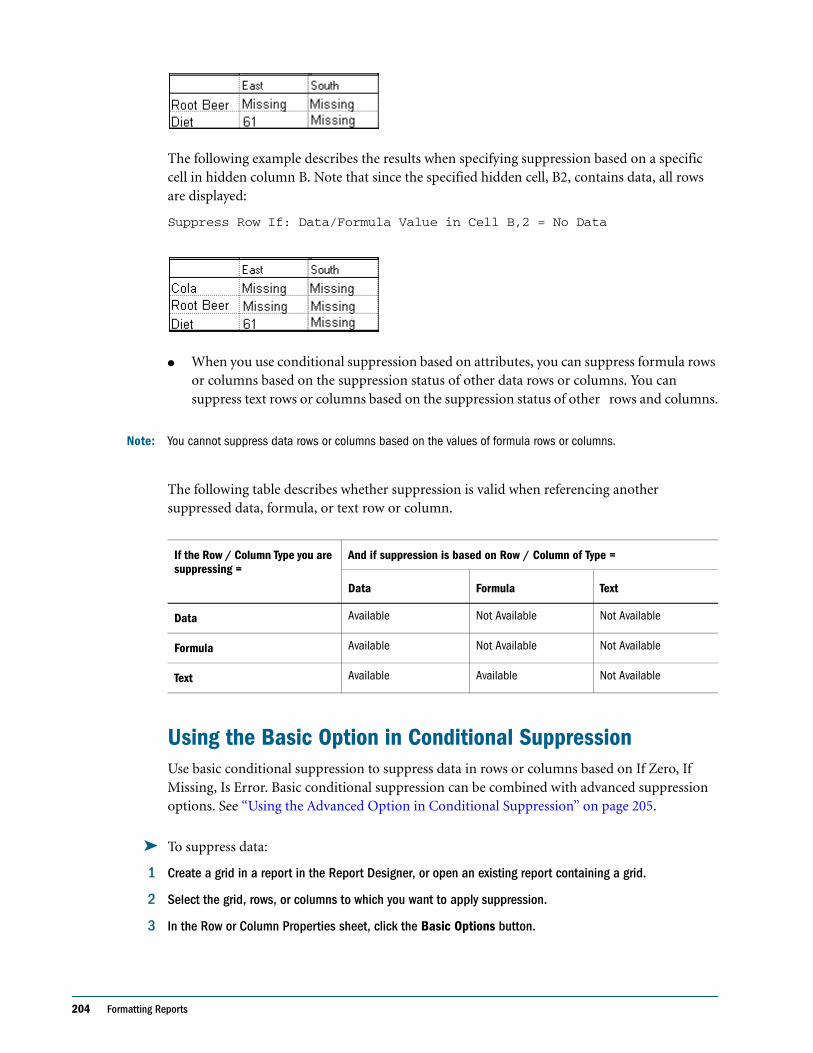
204 Formatting Reports
The following example describes the results when specifying suppression based on a specific cell in hidden column B. Note that since the specified hidden cell, B2, contains data, all rows are displayed:
Suppress Row If: Data/Formula Value in Cell B,2 = No Data
● When you use conditional suppression based on attributes, you can suppress formula rows or columns based on the suppression status of other data rows or columns. You can suppress text rows or columns based on the suppression status of other rows and columns.
Note: You cannot suppress data rows or columns based on the values of formula rows or columns.
The following table describes whether suppression is valid when referencing another suppressed data, formula, or text row or column.
Using the Basic Option in Conditional SuppressionUse basic conditional suppression to suppress data in rows or columns based on If Zero, If Missing, Is Error. Basic conditional suppression can be combined with advanced suppression options. See “Using the Advanced Option in Conditional Suppression” on page 205.
➤ To suppress data:
1 Create a grid in a report in the Report Designer, or open an existing report containing a grid.
2 Select the grid, rows, or columns to which you want to apply suppression.
3 In the Row or Column Properties sheet, click the Basic Options button.
If the Row / Column Type you are suppressing =
And if suppression is based on Row / Column of Type =
Data Formula Text
Data Available Not Available Not Available
Formula Available Not Available Not Available
Text Available Available Not Available
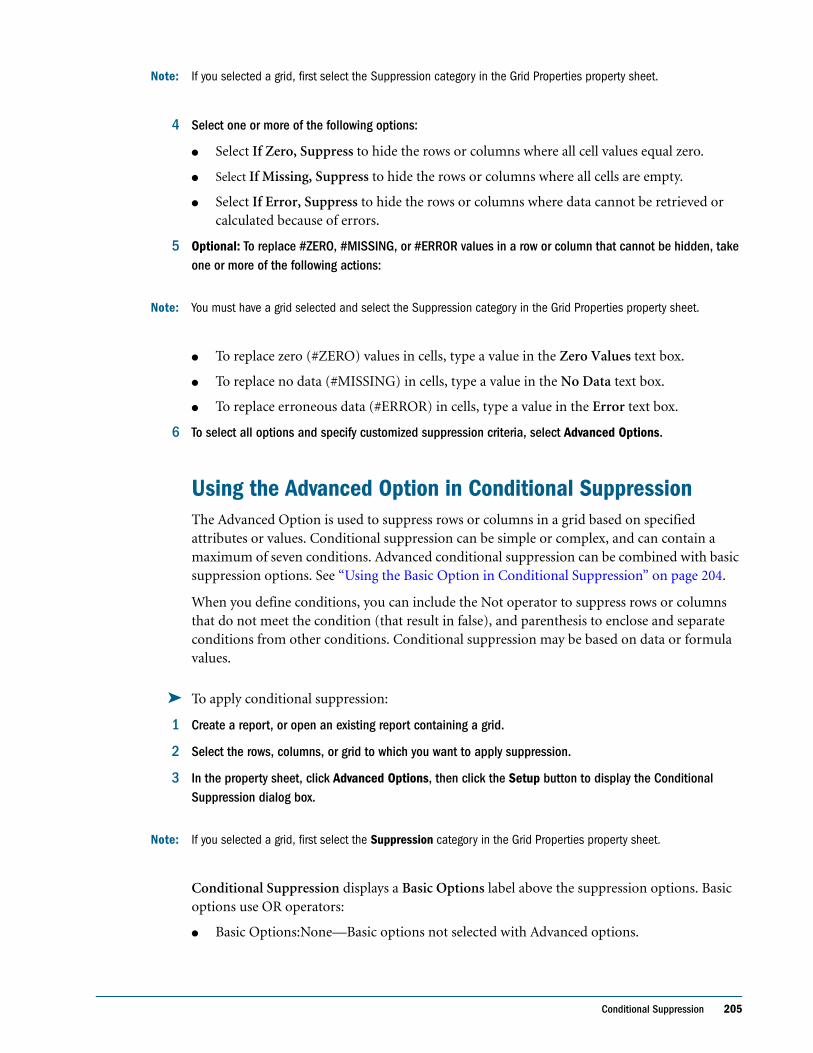
Conditional Suppression 205
Note: If you selected a grid, first select the Suppression category in the Grid Properties property sheet.
4 Select one or more of the following options:
● Select If Zero, Suppress to hide the rows or columns where all cell values equal zero.
● Select If Missing, Suppress to hide the rows or columns where all cells are empty.
● Select If Error, Suppress to hide the rows or columns where data cannot be retrieved or calculated because of errors.
5 Optional: To replace #ZERO, #MISSING, or #ERROR values in a row or column that cannot be hidden, take one or more of the following actions:
Note: You must have a grid selected and select the Suppression category in the Grid Properties property sheet.
● To replace zero (#ZERO) values in cells, type a value in the Zero Values text box.
● To replace no data (#MISSING) in cells, type a value in the No Data text box.
● To replace erroneous data (#ERROR) in cells, type a value in the Error text box.
6 To select all options and specify customized suppression criteria, select Advanced Options.
Using the Advanced Option in Conditional SuppressionThe Advanced Option is used to suppress rows or columns in a grid based on specified attributes or values. Conditional suppression can be simple or complex, and can contain a maximum of seven conditions. Advanced conditional suppression can be combined with basic suppression options. See “Using the Basic Option in Conditional Suppression” on page 204.
When you define conditions, you can include the Not operator to suppress rows or columns that do not meet the condition (that result in false), and parenthesis to enclose and separate conditions from other conditions. Conditional suppression may be based on data or formula values.
➤ To apply conditional suppression:
1 Create a report, or open an existing report containing a grid.
2 Select the rows, columns, or grid to which you want to apply suppression.
3 In the property sheet, click Advanced Options, then click the Setup button to display the Conditional Suppression dialog box.
Note: If you selected a grid, first select the Suppression category in the Grid Properties property sheet.
Conditional Suppression displays a Basic Options label above the suppression options. Basic options use OR operators:
● Basic Options:None—Basic options not selected with Advanced options.
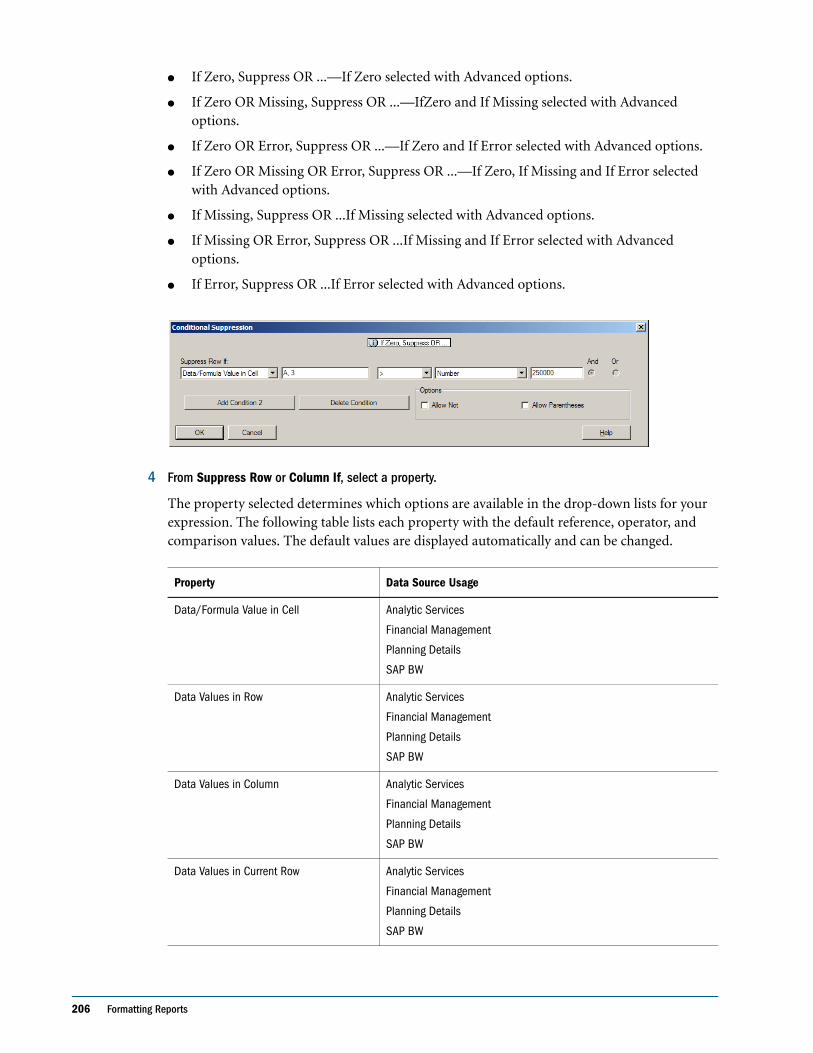
206 Formatting Reports
● If Zero, Suppress OR ...—If Zero selected with Advanced options.
● If Zero OR Missing, Suppress OR ...—IfZero and If Missing selected with Advanced options.
● If Zero OR Error, Suppress OR ...—If Zero and If Error selected with Advanced options.
● If Zero OR Missing OR Error, Suppress OR ...—If Zero, If Missing and If Error selected with Advanced options.
● If Missing, Suppress OR ...If Missing selected with Advanced options.
● If Missing OR Error, Suppress OR ...If Missing and If Error selected with Advanced options.
● If Error, Suppress OR ...If Error selected with Advanced options.
4 From Suppress Row or Column If, select a property.
The property selected determines which options are available in the drop-down lists for your expression. The following table lists each property with the default reference, operator, and comparison values. The default values are displayed automatically and can be changed.
Property Data Source Usage
Data/Formula Value in Cell Analytic Services
Financial Management
Planning Details
SAP BW
Data Values in Row Analytic Services
Financial Management
Planning Details
SAP BW
Data Values in Column Analytic Services
Financial Management
Planning Details
SAP BW
Data Values in Current Row Analytic Services
Financial Management
Planning Details
SAP BW
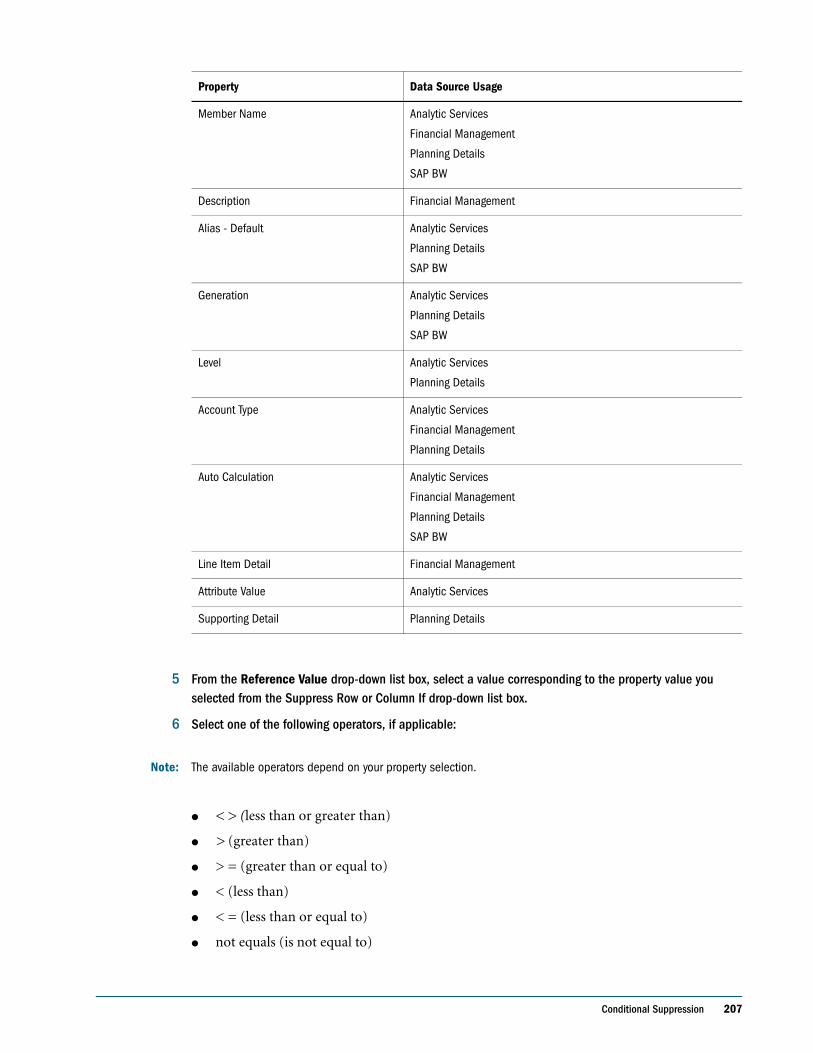
Conditional Suppression 207
5 From the Reference Value drop-down list box, select a value corresponding to the property value you selected from the Suppress Row or Column If drop-down list box.
6 Select one of the following operators, if applicable:
Note: The available operators depend on your property selection.
● < > (less than or greater than)
● > (greater than)
● > = (greater than or equal to)
● < (less than)
● < = (less than or equal to)
● not equals (is not equal to)
Member Name Analytic Services
Financial Management
Planning Details
SAP BW
Description Financial Management
Alias - Default Analytic Services
Planning Details
SAP BW
Generation Analytic Services
Planning Details
SAP BW
Level Analytic Services
Planning Details
Account Type Analytic Services
Financial Management
Planning Details
Auto Calculation Analytic Services
Financial Management
Planning Details
SAP BW
Line Item Detail Financial Management
Attribute Value Analytic Services
Supporting Detail Planning Details
Property Data Source Usage
208 Formatting Reports
● starts with
● ends with
● contains
● Is
7 Select one of the following comparison options, if applicable:
Note: The available comparison options depend on your property selection.
● Number—Enables the assignment of a certain value to a cell.
● Cell Value—Returns the cell location; for example: A, 3.
● Row Value—Returns the number of the row.
● Column Value—Returns the letter of the column.
● Zero—Assigns zero value for condition.
● No Data—Indicates no data value for selection.
● Invalid—For a Financial Management data source only, indicates an inactive or invalid value.
● Error—Assigns the condition as an error.
● string—Enables the definition of a string for the condition.
● 1, 2, 3,...—Indicates the number of levels or generations in the selected dimension.
● Non Expense—Assigns the condition as a nonexpense.
● Expense—Assigns the condition as an expense.
● True—Assigns a True value to the condition.
8 To add another condition, click the Add Condition 2 button.
Note: The number on this button is increased to as many as 7 as you add conditions.
9 To combine the current condition with the following condition, select one of the following operators:
● Select And if both combined conditions must be met.
● Select Or if only one of the combined conditions must be met.
10 Optional: In the Options area, add one of the following logic options to your condition:
● Select Allow Not to allow suppression only if the condition is not met.
● Select Allow Parentheses to define precedence, or order of consideration for the conditions, then specify the set of conditions as intended.
11 To add another condition, click the Add Condition 3 button.
12 Click OK to return to the grid in your report.
Formatting Images 209
Deleting Conditional SuppressionYou can delete conditional suppression if it is no longer applicable. This functionality enables you to delete one condition at a time, which can hold as many as seven conditions.
➤ To delete conditional suppression:
1 Open a report that contains a grid with conditional suppression.
2 Select the rows, columns, or grid to which conditional suppression is applied. The Advanced Options button in the property sheet is selected.
3 In the property sheet, click Setup to display the Conditional Suppression dialog box.
Note: If you selected a grid, first select the Suppression category in the Grid Properties property sheet.
4 In the Conditional Suppression dialog box, click Delete Condition. In the drop-down list, click the condition to delete. Repeat to delete additional conditions.
5 Click OK.
Formatting ImagesYou can format the display of images in your report. For example, once you place an image, you can stretch the image, insert a page break before the image, and specify horizontal and vertical positions for the image.
➤ To format images in a report:
1 Open a report and select an image to format.
2 To expand or shrink the image to fill the size of the image boundary on the Report Designer workspace, select Stretch on the Image Properties property sheet.
Tip: To resize the image manually, click and drag a handle. If the stretch option is not selected, only the box around the image is resized.
3 Optional: To set the horizontal positioning of a printed image, do one of the following tasks in the Horizontal drop-down list box:
● To position the printed image relative to an object to its left, select Relative.
● To position the printed image to the left side of the report, select Left.
● To position the printed image in the middle of the report, select Center.
● To position the printed image to the right of the report, select Right.
● To position the printed image at its current location regardless of whether report objects to its left change in size, select None.
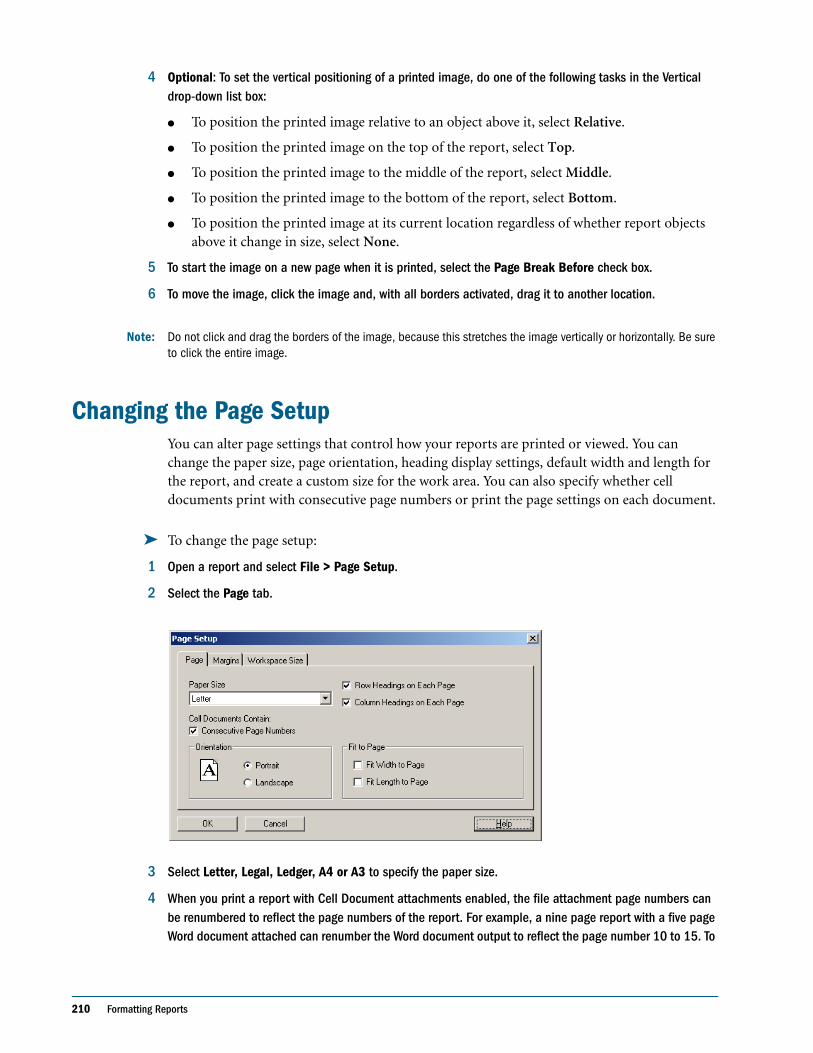
210 Formatting Reports
4 Optional: To set the vertical positioning of a printed image, do one of the following tasks in the Vertical drop-down list box:
● To position the printed image relative to an object above it, select Relative.
● To position the printed image on the top of the report, select Top.
● To position the printed image to the middle of the report, select Middle.
● To position the printed image to the bottom of the report, select Bottom.
● To position the printed image at its current location regardless of whether report objects above it change in size, select None.
5 To start the image on a new page when it is printed, select the Page Break Before check box.
6 To move the image, click the image and, with all borders activated, drag it to another location.
Note: Do not click and drag the borders of the image, because this stretches the image vertically or horizontally. Be sure to click the entire image.
Changing the Page SetupYou can alter page settings that control how your reports are printed or viewed. You can change the paper size, page orientation, heading display settings, default width and length for the report, and create a custom size for the work area. You can also specify whether cell documents print with consecutive page numbers or print the page settings on each document.
➤ To change the page setup:
1 Open a report and select File > Page Setup.
2 Select the Page tab.
3 Select Letter, Legal, Ledger, A4 or A3 to specify the paper size.
4 When you print a report with Cell Document attachments enabled, the file attachment page numbers can be renumbered to reflect the page numbers of the report. For example, a nine page report with a five page Word document attached can renumber the Word document output to reflect the page number 10 to 15. To
Changing the Page Setup 211
print consecutive page numbers on cell documents, select Consecutive Page Numbers. To print the page numbers as specified on each cell document, clear Consecutive Page Numbers. To learn more about cell documents, see “Attaching Cell Documents in a Report” on page 163.
5 Select Portrait or Landscape to set the orientation.
6 Set the display of row and column headings on your report:
a. To display the row heading on every page of the report, select the Row Headings on Each Page check box. Clear this check box to display the row heading only once, on the first page of the report.
b. To display the column heading on every page of the report, select the Column Headings on Each Page check box. Clear this setting to display the column heading only once, on the first page of the report.
Note: The default selections include row headings and column headings on each page.
7 Optional: Enable the following options to fit the length or width of your report on one page.
● To scale the width of the report so that it fits on one page, select the Fit Width to Page check box. Deselect this setting to retain the original dimensions specified in the Design mode.
● To scale the length of the report so that it fits on one page, select the Fit Length to Page check box. Deselect this setting to retain the original dimensions specified in the Design mode.
Note: If you select Fit Width to Page, you cannot insert a column page break. If you select Fit Length to Page, you cannot insert a row page break.
8 Select the Margins tab and enter values in the margin text boxes. You can specify a value for the top, bottom, left, and right margins. To adjust the margins, use one of the following methods:
● Use the up and down scroll arrows to adjust the margins of your report by increments of 100th of an inch.
● Type the margin settings for your report, in inches.
Note: The Margins tab shows a preview of your report using the margins you specify.
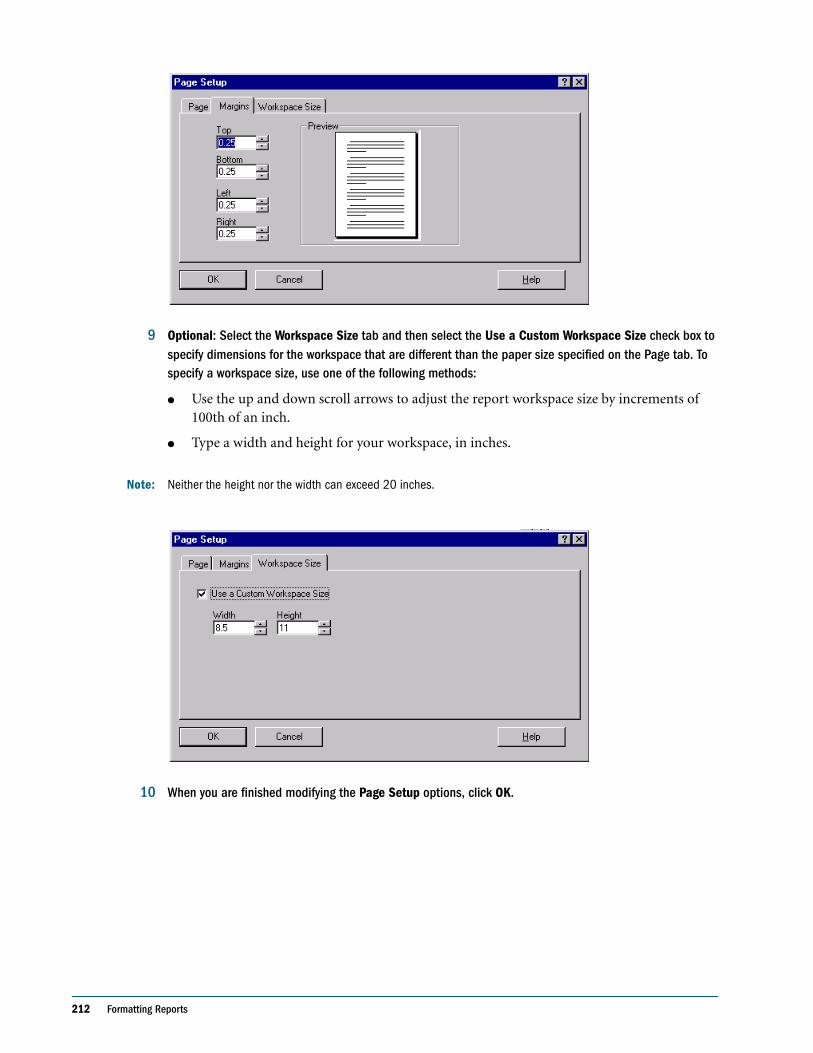
212 Formatting Reports
9 Optional: Select the Workspace Size tab and then select the Use a Custom Workspace Size check box to specify dimensions for the workspace that are different than the paper size specified on the Page tab. To specify a workspace size, use one of the following methods:
● Use the up and down scroll arrows to adjust the report workspace size by increments of 100th of an inch.
● Type a width and height for your workspace, in inches.
Note: Neither the height nor the width can exceed 20 inches.
10 When you are finished modifying the Page Setup options, click OK.
Using Functions 213
C h a p t e r
10 10Using Functions
You use functions to create formulas. A formula is a series of functions and operators that produce data shown in a report. Financial Reporting functions are organized into two groups: mathematical functions and text functions. This chapter provides information about how to use functions.
In This Chapter Mathematical Functions. . . . . . . . . . . . . . . . . . . . . . . . . . . . . . . . . . . . . . . . . . . . . . . . . . . . . . . . . . . . . . . . . . . . 214
Text Functions . . . . . . . . . . . . . . . . . . . . . . . . . . . . . . . . . . . . . . . . . . . . . . . . . . . . . . . . . . . . . . . . . . . . . . . . . . . 219
List of Functions . . . . . . . . . . . . . . . . . . . . . . . . . . . . . . . . . . . . . . . . . . . . . . . . . . . . . . . . . . . . . . . . . . . . . . . . . 226
Mathematical Operators in Expressions . . . . . . . . . . . . . . . . . . . . . . . . . . . . . . . . . . . . . . . . . . . . . . . . . . . . . . . . 277
Mathematical Operands in Expressions . . . . . . . . . . . . . . . . . . . . . . . . . . . . . . . . . . . . . . . . . . . . . . . . . . . . . . . . 278
Natural Precedence . . . . . . . . . . . . . . . . . . . . . . . . . . . . . . . . . . . . . . . . . . . . . . . . . . . . . . . . . . . . . . . . . . . . . . . 279
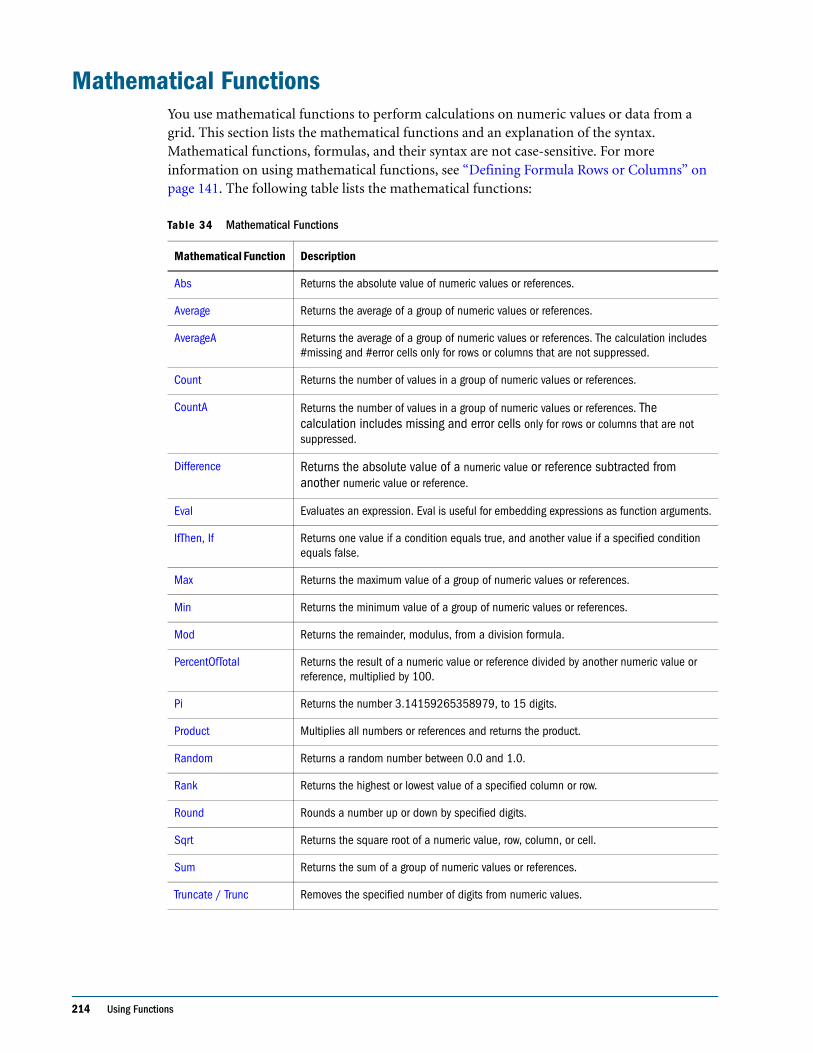
214 Using Functions
Mathematical FunctionsYou use mathematical functions to perform calculations on numeric values or data from a grid. This section lists the mathematical functions and an explanation of the syntax. Mathematical functions, formulas, and their syntax are not case-sensitive. For more information on using mathematical functions, see “Defining Formula Rows or Columns” on page 141. The following table lists the mathematical functions:
Table 34 Mathematical Functions
Mathematical Function Description
Abs Returns the absolute value of numeric values or references.
Average Returns the average of a group of numeric values or references.
AverageA Returns the average of a group of numeric values or references. The calculation includes #missing and #error cells only for rows or columns that are not suppressed.
Count Returns the number of values in a group of numeric values or references.
CountA Returns the number of values in a group of numeric values or references. The calculation includes missing and error cells only for rows or columns that are not suppressed.
Difference Returns the absolute value of a numeric value or reference subtracted from another numeric value or reference.
Eval Evaluates an expression. Eval is useful for embedding expressions as function arguments.
IfThen, If Returns one value if a condition equals true, and another value if a specified condition equals false.
Max Returns the maximum value of a group of numeric values or references.
Min Returns the minimum value of a group of numeric values or references.
Mod Returns the remainder, modulus, from a division formula.
PercentOfTotal Returns the result of a numeric value or reference divided by another numeric value or reference, multiplied by 100.
Pi Returns the number 3.14159265358979, to 15 digits.
Product Multiplies all numbers or references and returns the product.
Random Returns a random number between 0.0 and 1.0.
Rank Returns the highest or lowest value of a specified column or row.
Round Rounds a number up or down by specified digits.
Sqrt Returns the square root of a numeric value, row, column, or cell.
Sum Returns the sum of a group of numeric values or references.
Truncate / Trunc Removes the specified number of digits from numeric values.

Mathematical Functions 215
The syntax for mathematical functions is as follows:
FunctionName(arguments)
ArgumentsMathematical functions accept numeric values, row, column, or cell references, or embedded functions as arguments. There are four types of arguments:
● Numeric Arguments
● Property Arguments
● Row, Column, or Cell Reference Arguments
● Embedded Functions as Arguments
Numeric ArgumentsThe syntax for a numeric argument is
(numeral1, numeral2,...numeraln)
where numerals 1 through n are any numbers including decimals and negative values. For example, the expression Average(10,20,30) returns the value 20.
Row, Column, or Cell Reference ArgumentsThe row, column, or cell argument identifies a row, column, or cell in a grid. The syntax is:
FunctionName(GridName.GridElement[segment(range)].Property)
Variance / Var Evaluates the difference between the specified values based on the account type for the current account.
VariancePercent / VarPer
Evaluates the difference, in percent, between the specified values based on account type for the current account.
Table 35 Mathematical Functions
Variable Description
FunctionName The name of a mathematical function.
arguments A numeric value, a row, column, or cell reference, or an embedded function.
Table 34 Mathematical Functions (Continued)
Mathematical Function Description
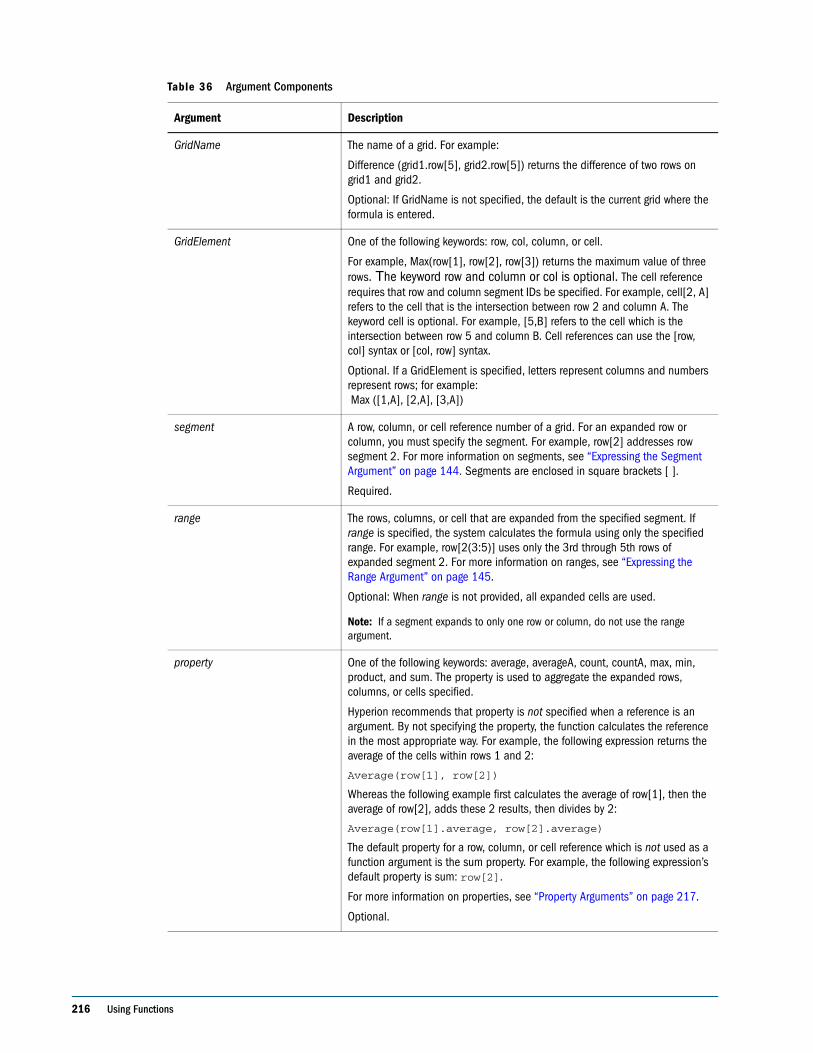
216 Using Functions
Table 36 Argument Components
Argument Description
GridName The name of a grid. For example:
Difference (grid1.row[5], grid2.row[5]) returns the difference of two rows on grid1 and grid2.
Optional: If GridName is not specified, the default is the current grid where the formula is entered.
GridElement One of the following keywords: row, col, column, or cell.
For example, Max(row[1], row[2], row[3]) returns the maximum value of three rows. The keyword row and column or col is optional. The cell reference requires that row and column segment IDs be specified. For example, cell[2, A] refers to the cell that is the intersection between row 2 and column A. The keyword cell is optional. For example, [5,B] refers to the cell which is the intersection between row 5 and column B. Cell references can use the [row, col] syntax or [col, row] syntax.
Optional. If a GridElement is specified, letters represent columns and numbers represent rows; for example: Max ([1,A], [2,A], [3,A])
segment A row, column, or cell reference number of a grid. For an expanded row or column, you must specify the segment. For example, row[2] addresses row segment 2. For more information on segments, see “Expressing the Segment Argument” on page 144. Segments are enclosed in square brackets [ ].
Required.
range The rows, columns, or cell that are expanded from the specified segment. If range is specified, the system calculates the formula using only the specified range. For example, row[2(3:5)] uses only the 3rd through 5th rows of expanded segment 2. For more information on ranges, see “Expressing the Range Argument” on page 145.
Optional: When range is not provided, all expanded cells are used.
Note: If a segment expands to only one row or column, do not use the range argument.
property One of the following keywords: average, averageA, count, countA, max, min, product, and sum. The property is used to aggregate the expanded rows, columns, or cells specified.
Hyperion recommends that property is not specified when a reference is an argument. By not specifying the property, the function calculates the reference in the most appropriate way. For example, the following expression returns the average of the cells within rows 1 and 2:
Average(row[1], row[2])
Whereas the following example first calculates the average of row[1], then the average of row[2], adds these 2 results, then divides by 2:
Average(row[1].average, row[2].average)
The default property for a row, column, or cell reference which is not used as a function argument is the sum property. For example, the following expression’s default property is sum: row[2].
For more information on properties, see “Property Arguments” on page 217.
Optional.
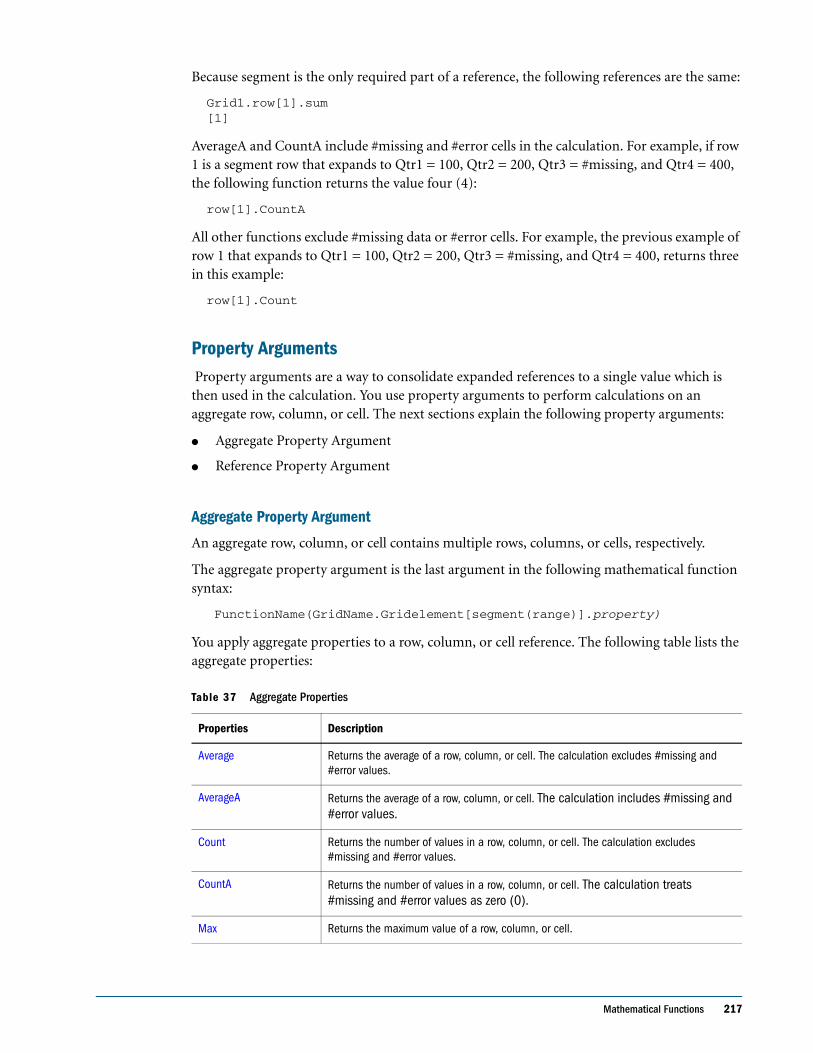
Mathematical Functions 217
Because segment is the only required part of a reference, the following references are the same:
Grid1.row[1].sum [1]
AverageA and CountA include #missing and #error cells in the calculation. For example, if row 1 is a segment row that expands to Qtr1 = 100, Qtr2 = 200, Qtr3 = #missing, and Qtr4 = 400, the following function returns the value four (4):
row[1].CountA
All other functions exclude #missing data or #error cells. For example, the previous example of row 1 that expands to Qtr1 = 100, Qtr2 = 200, Qtr3 = #missing, and Qtr4 = 400, returns three in this example:
row[1].Count
Property Arguments Property arguments are a way to consolidate expanded references to a single value which is then used in the calculation. You use property arguments to perform calculations on an aggregate row, column, or cell. The next sections explain the following property arguments:
● Aggregate Property Argument
● Reference Property Argument
Aggregate Property Argument
An aggregate row, column, or cell contains multiple rows, columns, or cells, respectively.
The aggregate property argument is the last argument in the following mathematical function syntax:
FunctionName(GridName.Gridelement[segment(range)].property)
You apply aggregate properties to a row, column, or cell reference. The following table lists the aggregate properties:
Table 37 Aggregate Properties
Properties Description
Average Returns the average of a row, column, or cell. The calculation excludes #missing and #error values.
AverageA Returns the average of a row, column, or cell. The calculation includes #missing and #error values.
Count Returns the number of values in a row, column, or cell. The calculation excludes #missing and #error values.
CountA Returns the number of values in a row, column, or cell. The calculation treats #missing and #error values as zero (0).
Max Returns the maximum value of a row, column, or cell.
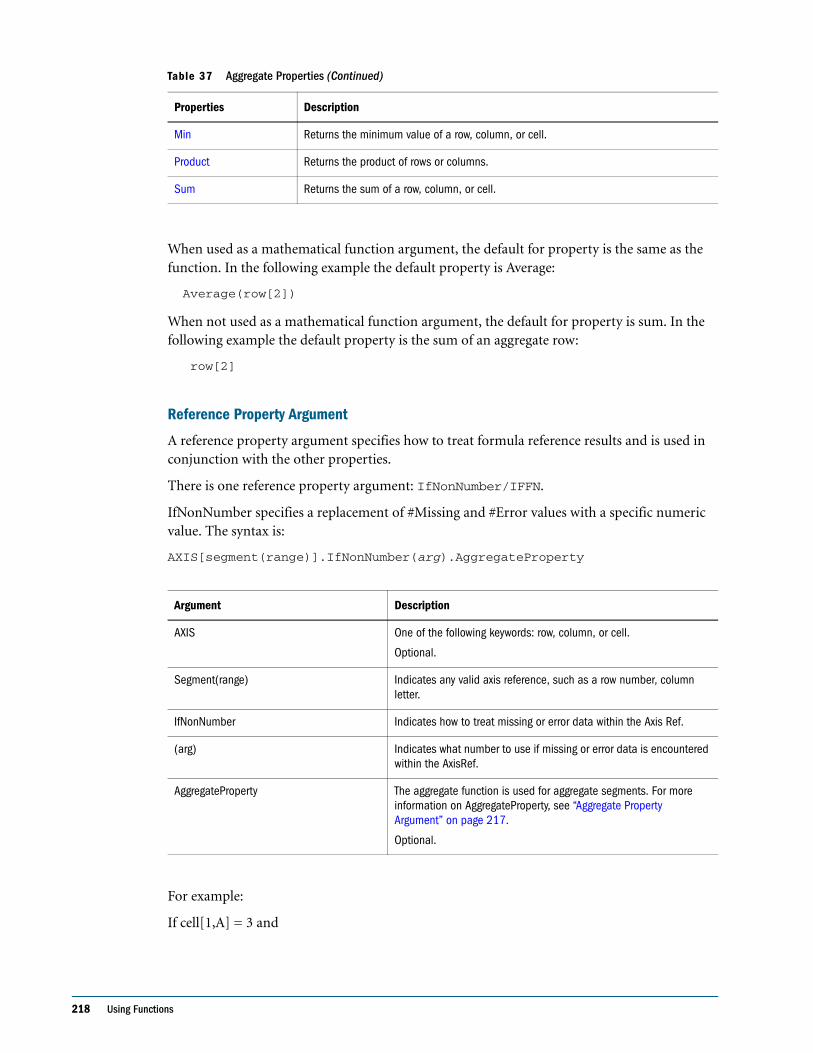
218 Using Functions
When used as a mathematical function argument, the default for property is the same as the function. In the following example the default property is Average:
Average(row[2])
When not used as a mathematical function argument, the default for property is sum. In the following example the default property is the sum of an aggregate row:
row[2]
Reference Property Argument
A reference property argument specifies how to treat formula reference results and is used in conjunction with the other properties.
There is one reference property argument: IfNonNumber/IFFN.
IfNonNumber specifies a replacement of #Missing and #Error values with a specific numeric value. The syntax is:
AXIS[segment(range)].IfNonNumber(arg).AggregateProperty
For example:
If cell[1,A] = 3 and
Min Returns the minimum value of a row, column, or cell.
Product Returns the product of rows or columns.
Sum Returns the sum of a row, column, or cell.
Argument Description
AXIS One of the following keywords: row, column, or cell.
Optional.
Segment(range) Indicates any valid axis reference, such as a row number, column letter.
IfNonNumber Indicates how to treat missing or error data within the Axis Ref.
(arg) Indicates what number to use if missing or error data is encountered within the AxisRef.
AggregateProperty The aggregate function is used for aggregate segments. For more information on AggregateProperty, see “Aggregate Property Argument” on page 217.
Optional.
Table 37 Aggregate Properties (Continued)
Properties Description
Text Functions 219
cell[1,B] = #Missing,
The expression:
cell[1,A] / cell[1,B]
returns #Error.
The expression:
cell[1,A] / cell[1,B].ifNonnumber(1)
replaces cell[1,B] with 1 and returns a 3.
Note: If you use suppression for #Missing or #Error in a grid, and the grid contains a formula row or column that uses the IfNonNumber property, #Missing and #Error remain suppressed.
Note: When using a Financial Management database connection, and the MissingValuesAreZeroInFormulasInHFM option in the fr_repserver.properties file is set to one (1), the #Missing value is zero regardless of the setting of the IfNonNumber property. However, if the file is set to zero, the IfNonNumber property behaves as described.
Embedded Functions as ArgumentsYou can embed functions as arguments within a function.
Example:
In the following example, the function Average is embedded in the function Sum:
sum(row[3:5], avg(row[4:6], 40, 50), row[7; 9], 70, 80)
● Row segments 3, 4 and 5
● The average of row segments 4, 5 and 6, with the numbers 40 and 50
● Row segments 7 and 9
● The numbers 70 and 80
Text FunctionsText functions return report information, such as the report name or the report description. You use text functions in grids or in text objects. You enclose text functions in braces as follows:
<< TextFunction (arguments) >>
You can use spaces between arguments. All of the arguments are enclosed in quotes, except for numeric arguments.
Note: Arguments related to date formatting are case-sensitive.
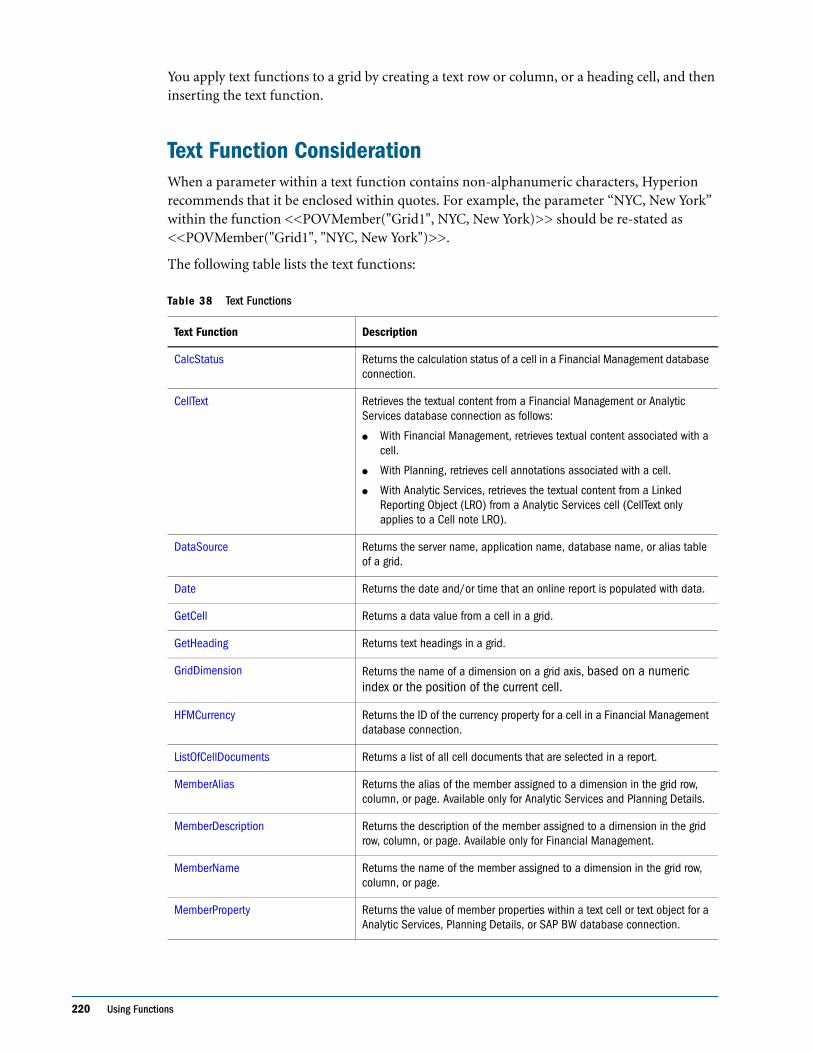
220 Using Functions
You apply text functions to a grid by creating a text row or column, or a heading cell, and then inserting the text function.
Text Function ConsiderationWhen a parameter within a text function contains non-alphanumeric characters, Hyperion recommends that it be enclosed within quotes. For example, the parameter “NYC, New York” within the function <<POVMember("Grid1", NYC, New York)>> should be re-stated as <<POVMember("Grid1", "NYC, New York")>>.
The following table lists the text functions:
Table 38 Text Functions
Text Function Description
CalcStatus Returns the calculation status of a cell in a Financial Management database connection.
CellText Retrieves the textual content from a Financial Management or Analytic Services database connection as follows:
● With Financial Management, retrieves textual content associated with a cell.
● With Planning, retrieves cell annotations associated with a cell.
● With Analytic Services, retrieves the textual content from a Linked Reporting Object (LRO) from a Analytic Services cell (CellText only applies to a Cell note LRO).
DataSource Returns the server name, application name, database name, or alias table of a grid.
Date Returns the date and/or time that an online report is populated with data.
GetCell Returns a data value from a cell in a grid.
GetHeading Returns text headings in a grid.
GridDimension Returns the name of a dimension on a grid axis, based on a numeric index or the position of the current cell.
HFMCurrency Returns the ID of the currency property for a cell in a Financial Management database connection.
ListOfCellDocuments Returns a list of all cell documents that are selected in a report.
MemberAlias Returns the alias of the member assigned to a dimension in the grid row, column, or page. Available only for Analytic Services and Planning Details.
MemberDescription Returns the description of the member assigned to a dimension in the grid row, column, or page. Available only for Financial Management.
MemberName Returns the name of the member assigned to a dimension in the grid row, column, or page.
MemberProperty Returns the value of member properties within a text cell or text object for a Analytic Services, Planning Details, or SAP BW database connection.
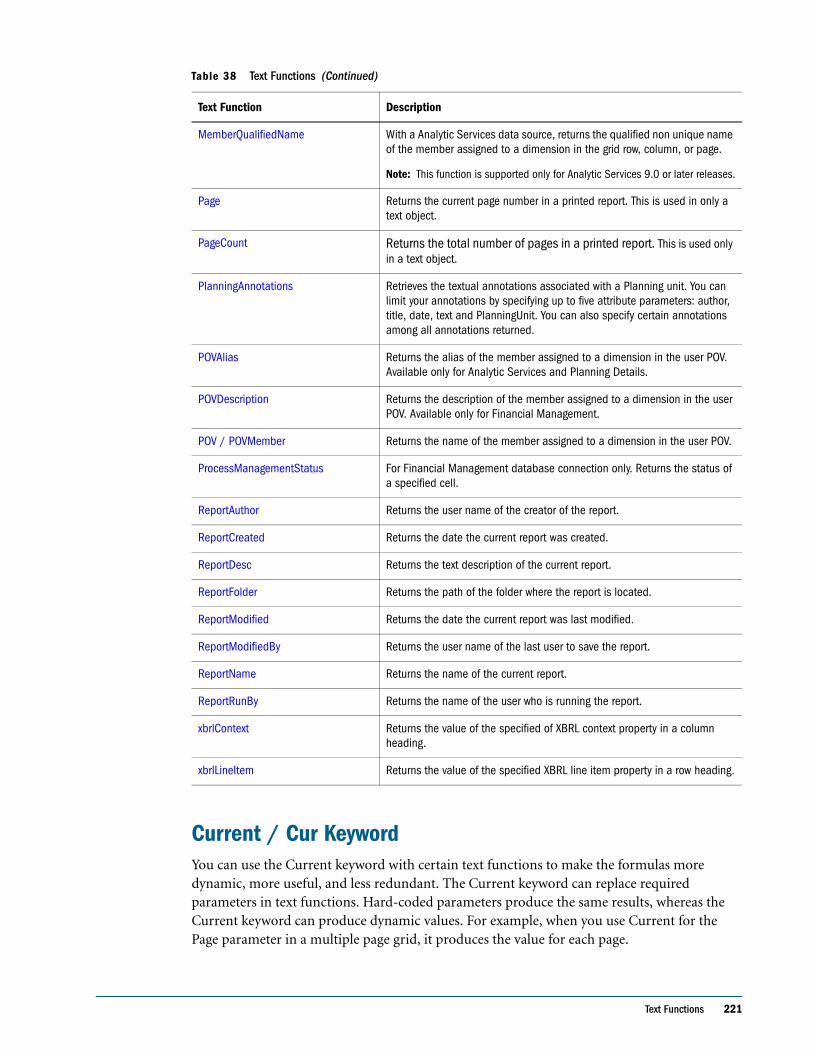
Text Functions 221
Current / Cur Keyword You can use the Current keyword with certain text functions to make the formulas more dynamic, more useful, and less redundant. The Current keyword can replace required parameters in text functions. Hard-coded parameters produce the same results, whereas the Current keyword can produce dynamic values. For example, when you use Current for the Page parameter in a multiple page grid, it produces the value for each page.
MemberQualifiedName With a Analytic Services data source, returns the qualified non unique name of the member assigned to a dimension in the grid row, column, or page.
Note: This function is supported only for Analytic Services 9.0 or later releases.
Page Returns the current page number in a printed report. This is used in only a text object.
PageCount Returns the total number of pages in a printed report. This is used only in a text object.
PlanningAnnotations Retrieves the textual annotations associated with a Planning unit. You can limit your annotations by specifying up to five attribute parameters: author, title, date, text and PlanningUnit. You can also specify certain annotations among all annotations returned.
POVAlias Returns the alias of the member assigned to a dimension in the user POV. Available only for Analytic Services and Planning Details.
POVDescription Returns the description of the member assigned to a dimension in the user POV. Available only for Financial Management.
POV / POVMember Returns the name of the member assigned to a dimension in the user POV.
ProcessManagementStatus For Financial Management database connection only. Returns the status of a specified cell.
ReportAuthor Returns the user name of the creator of the report.
ReportCreated Returns the date the current report was created.
ReportDesc Returns the text description of the current report.
ReportFolder Returns the path of the folder where the report is located.
ReportModified Returns the date the current report was last modified.
ReportModifiedBy Returns the user name of the last user to save the report.
ReportName Returns the name of the current report.
ReportRunBy Returns the name of the user who is running the report.
xbrlContext Returns the value of the specified of XBRL context property in a column heading.
xbrlLineItem Returns the value of the specified XBRL line item property in a row heading.
Table 38 Text Functions (Continued)
Text Function Description
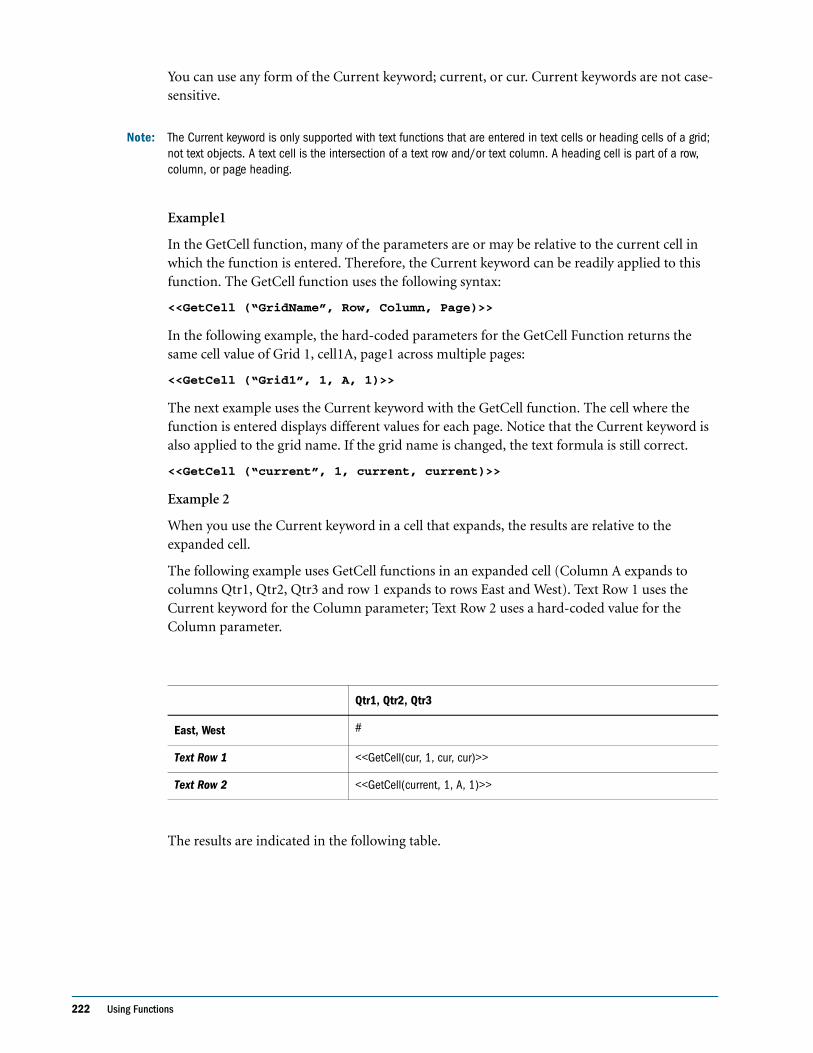
222 Using Functions
You can use any form of the Current keyword; current, or cur. Current keywords are not case-sensitive.
Note: The Current keyword is only supported with text functions that are entered in text cells or heading cells of a grid; not text objects. A text cell is the intersection of a text row and/or text column. A heading cell is part of a row, column, or page heading.
Example1
In the GetCell function, many of the parameters are or may be relative to the current cell in which the function is entered. Therefore, the Current keyword can be readily applied to this function. The GetCell function uses the following syntax:
<<GetCell (“GridName”, Row, Column, Page)>>
In the following example, the hard-coded parameters for the GetCell Function returns the same cell value of Grid 1, cell1A, page1 across multiple pages:
<<GetCell (“Grid1”, 1, A, 1)>>
The next example uses the Current keyword with the GetCell function. The cell where the function is entered displays different values for each page. Notice that the Current keyword is also applied to the grid name. If the grid name is changed, the text formula is still correct.
<<GetCell (“current”, 1, current, current)>>
Example 2
When you use the Current keyword in a cell that expands, the results are relative to the expanded cell.
The following example uses GetCell functions in an expanded cell (Column A expands to columns Qtr1, Qtr2, Qtr3 and row 1 expands to rows East and West). Text Row 1 uses the Current keyword for the Column parameter; Text Row 2 uses a hard-coded value for the Column parameter.
The results are indicated in the following table.
Qtr1, Qtr2, Qtr3
East, West #
Text Row 1 <<GetCell(cur, 1, cur, cur)>>
Text Row 2 <<GetCell(current, 1, A, 1)>>
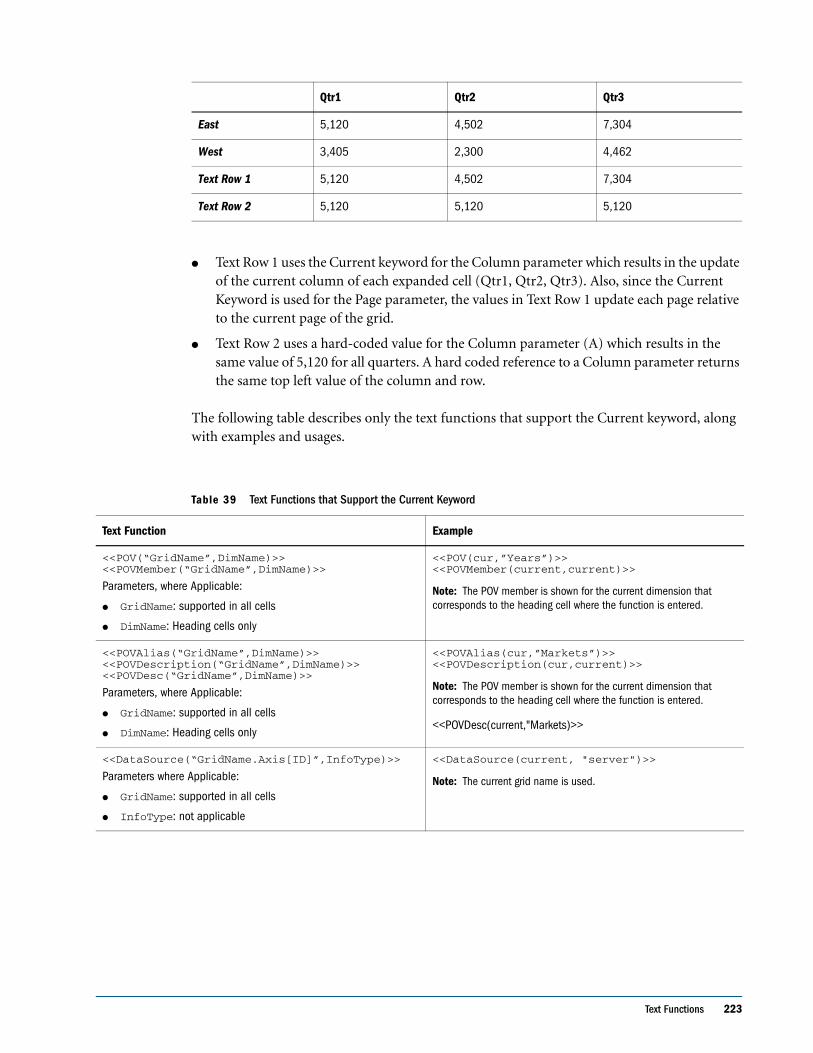
Text Functions 223
● Text Row 1 uses the Current keyword for the Column parameter which results in the update of the current column of each expanded cell (Qtr1, Qtr2, Qtr3). Also, since the Current Keyword is used for the Page parameter, the values in Text Row 1 update each page relative to the current page of the grid.
● Text Row 2 uses a hard-coded value for the Column parameter (A) which results in the same value of 5,120 for all quarters. A hard coded reference to a Column parameter returns the same top left value of the column and row.
The following table describes only the text functions that support the Current keyword, along with examples and usages.
Qtr1 Qtr2 Qtr3
East 5,120 4,502 7,304
West 3,405 2,300 4,462
Text Row 1 5,120 4,502 7,304
Text Row 2 5,120 5,120 5,120
Table 39 Text Functions that Support the Current Keyword
Text Function Example
<<POV(“GridName”,DimName)>><<POVMember(“GridName”,DimName)>>
Parameters, where Applicable:
● GridName: supported in all cells
● DimName: Heading cells only
<<POV(cur,”Years”)>><<POVMember(current,current)>>
Note: The POV member is shown for the current dimension that corresponds to the heading cell where the function is entered.
<<POVAlias(“GridName”,DimName)>><<POVDescription(“GridName”,DimName)>><<POVDesc(“GridName”,DimName)>>
Parameters, where Applicable:
● GridName: supported in all cells
● DimName: Heading cells only
<<POVAlias(cur,”Markets”)>><<POVDescription(cur,current)>>
Note: The POV member is shown for the current dimension that corresponds to the heading cell where the function is entered.
<<POVDesc(current,"Markets)>>
<<DataSource(“GridName.Axis[ID]”,InfoType)>>
Parameters where Applicable:
● GridName: supported in all cells
● InfoType: not applicable
<<DataSource(current, "server")>>
Note: The current grid name is used.
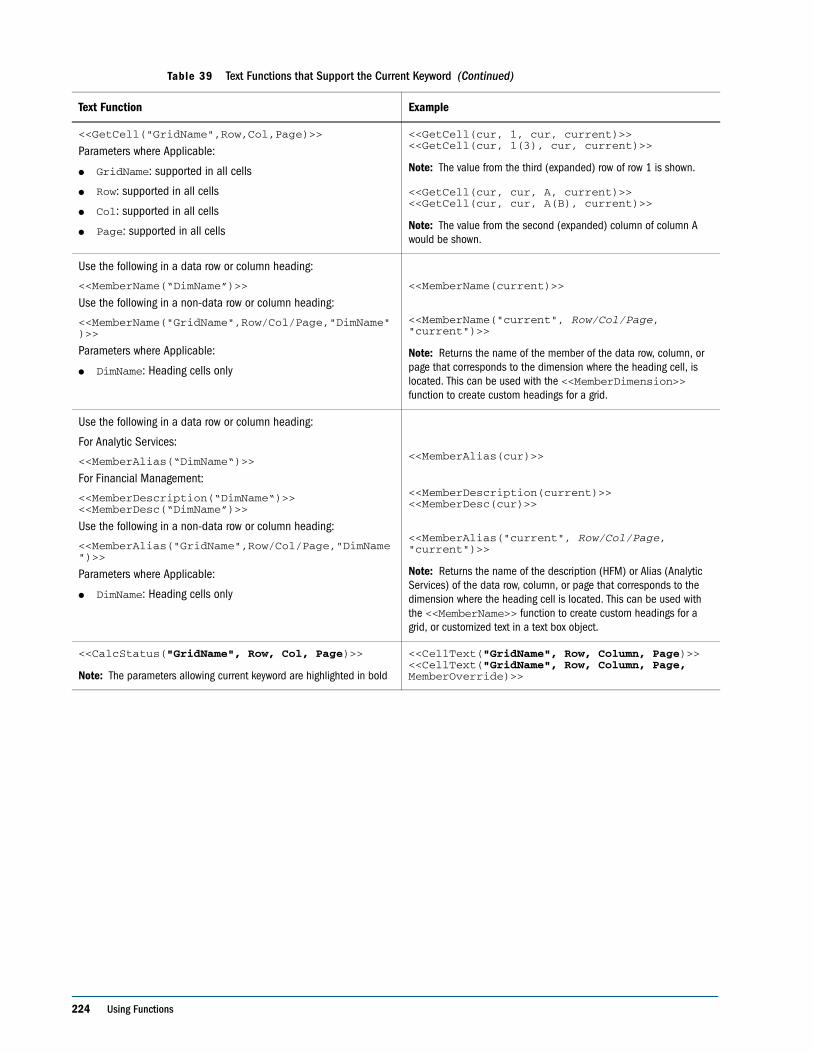
224 Using Functions
<<GetCell("GridName",Row,Col,Page)>>
Parameters where Applicable:
● GridName: supported in all cells
● Row: supported in all cells
● Col: supported in all cells
● Page: supported in all cells
<<GetCell(cur, 1, cur, current)>><<GetCell(cur, 1(3), cur, current)>>
Note: The value from the third (expanded) row of row 1 is shown.
<<GetCell(cur, cur, A, current)>><<GetCell(cur, cur, A(B), current)>>
Note: The value from the second (expanded) column of column A would be shown.
Use the following in a data row or column heading:
<<MemberName(“DimName”)>>
Use the following in a non-data row or column heading:
<<MemberName("GridName",Row/Col/Page,"DimName")>>
Parameters where Applicable:
● DimName: Heading cells only
<<MemberName(current)>> <<MemberName("current", Row/Col/Page, "current")>>
Note: Returns the name of the member of the data row, column, or page that corresponds to the dimension where the heading cell, is located. This can be used with the <<MemberDimension>> function to create custom headings for a grid.
Use the following in a data row or column heading:
For Analytic Services:
<<MemberAlias(“DimName“)>>
For Financial Management:
<<MemberDescription(“DimName“)>><<MemberDesc(“DimName”)>>
Use the following in a non-data row or column heading:
<<MemberAlias("GridName",Row/Col/Page,"DimName")>>
Parameters where Applicable:
● DimName: Heading cells only
<<MemberAlias(cur)>>
<<MemberDescription(current)>><<MemberDesc(cur)>> <<MemberAlias("current", Row/Col/Page, "current")>>
Note: Returns the name of the description (HFM) or Alias (Analytic Services) of the data row, column, or page that corresponds to the dimension where the heading cell is located. This can be used with the <<MemberName>> function to create custom headings for a grid, or customized text in a text box object.
<<CalcStatus("GridName", Row, Col, Page)>>
Note: The parameters allowing current keyword are highlighted in bold
<<CellText("GridName", Row, Column, Page)>><<CellText("GridName", Row, Column, Page, MemberOverride)>>
Table 39 Text Functions that Support the Current Keyword (Continued)
Text Function Example
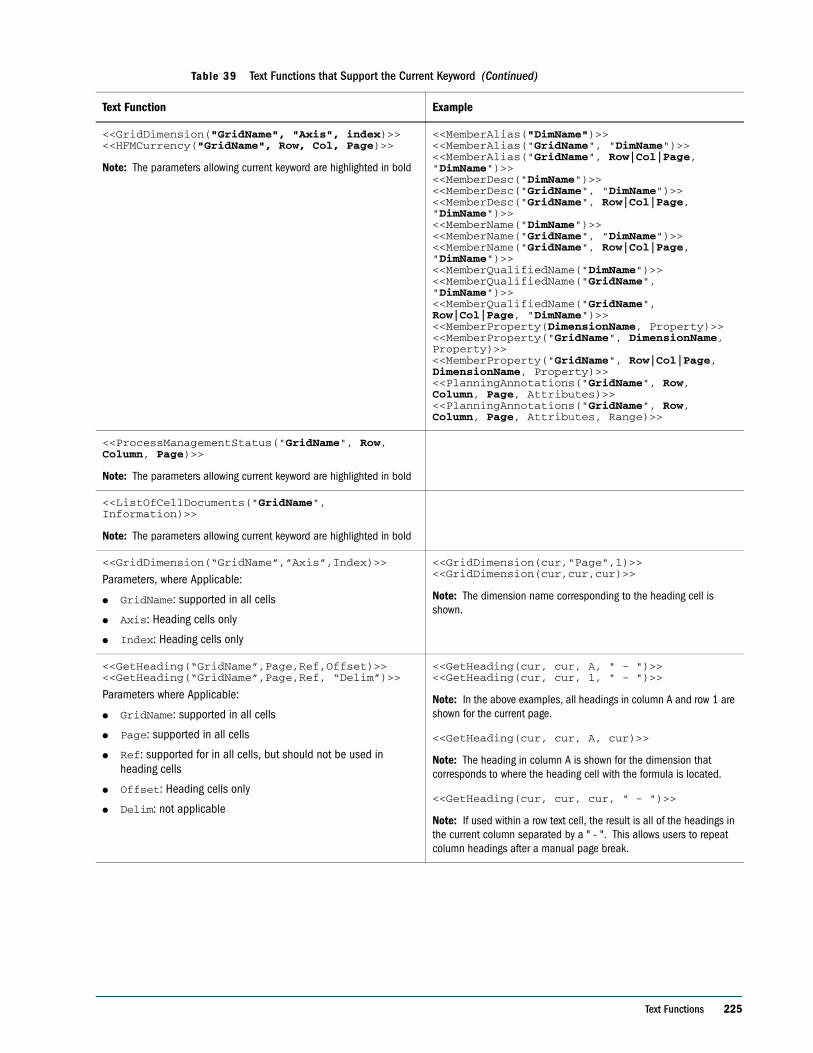
Text Functions 225
<<GridDimension("GridName", "Axis", index)>><<HFMCurrency("GridName", Row, Col, Page)>>
Note: The parameters allowing current keyword are highlighted in bold
<<MemberAlias("DimName")>><<MemberAlias("GridName", "DimName")>> <<MemberAlias("GridName", Row|Col|Page, "DimName")>><<MemberDesc("DimName")>><<MemberDesc("GridName", "DimName")>><<MemberDesc("GridName", Row|Col|Page, "DimName")>><<MemberName("DimName")>><<MemberName("GridName", "DimName")>><<MemberName("GridName", Row|Col|Page, "DimName")>><<MemberQualifiedName("DimName")>><<MemberQualifiedName("GridName", "DimName")>><<MemberQualifiedName("GridName", Row|Col|Page, "DimName")>><<MemberProperty(DimensionName, Property)>> <<MemberProperty("GridName", DimensionName, Property)>> <<MemberProperty("GridName", Row|Col|Page, DimensionName, Property)>><<PlanningAnnotations("GridName", Row, Column, Page, Attributes)>><<PlanningAnnotations("GridName", Row, Column, Page, Attributes, Range)>>
<<ProcessManagementStatus("GridName", Row, Column, Page)>>
Note: The parameters allowing current keyword are highlighted in bold
<<ListOfCellDocuments("GridName", Information)>>
Note: The parameters allowing current keyword are highlighted in bold
<<GridDimension(“GridName”,”Axis”,Index)>>
Parameters, where Applicable:
● GridName: supported in all cells
● Axis: Heading cells only
● Index: Heading cells only
<<GridDimension(cur,"Page",1)>><<GridDimension(cur,cur,cur)>>
Note: The dimension name corresponding to the heading cell is shown.
<<GetHeading(“GridName”,Page,Ref,Offset)>><<GetHeading(“GridName”,Page,Ref, “Delim”)>>
Parameters where Applicable:
● GridName: supported in all cells
● Page: supported in all cells
● Ref: supported for in all cells, but should not be used in heading cells
● Offset: Heading cells only
● Delim: not applicable
<<GetHeading(cur, cur, A, " - ")>><<GetHeading(cur, cur, 1, " - ")>>
Note: In the above examples, all headings in column A and row 1 are shown for the current page.
<<GetHeading(cur, cur, A, cur)>>
Note: The heading in column A is shown for the dimension that corresponds to where the heading cell with the formula is located.
<<GetHeading(cur, cur, cur, " - ")>>
Note: If used within a row text cell, the result is all of the headings in the current column separated by a " - ". This allows users to repeat column headings after a manual page break.
Table 39 Text Functions that Support the Current Keyword (Continued)
Text Function Example
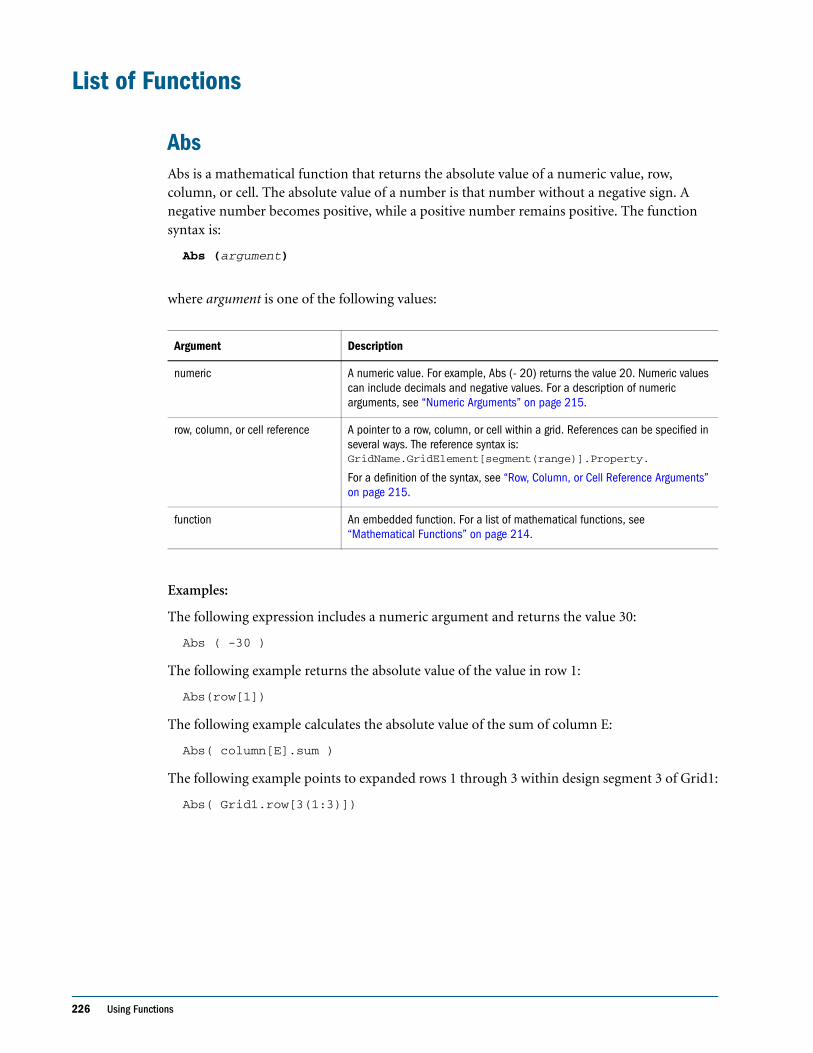
226 Using Functions
List of Functions
AbsAbs is a mathematical function that returns the absolute value of a numeric value, row, column, or cell. The absolute value of a number is that number without a negative sign. A negative number becomes positive, while a positive number remains positive. The function syntax is:
Abs (argument)
where argument is one of the following values:
Examples:
The following expression includes a numeric argument and returns the value 30:
Abs ( -30 )
The following example returns the absolute value of the value in row 1:
Abs(row[1])
The following example calculates the absolute value of the sum of column E:
Abs( column[E].sum )
The following example points to expanded rows 1 through 3 within design segment 3 of Grid1:
Abs( Grid1.row[3(1:3)])
Argument Description
numeric A numeric value. For example, Abs (- 20) returns the value 20. Numeric values can include decimals and negative values. For a description of numeric arguments, see “Numeric Arguments” on page 215.
row, column, or cell reference A pointer to a row, column, or cell within a grid. References can be specified in several ways. The reference syntax is: GridName.GridElement[segment(range)].Property.
For a definition of the syntax, see “Row, Column, or Cell Reference Arguments” on page 215.
function An embedded function. For a list of mathematical functions, see “Mathematical Functions” on page 214.
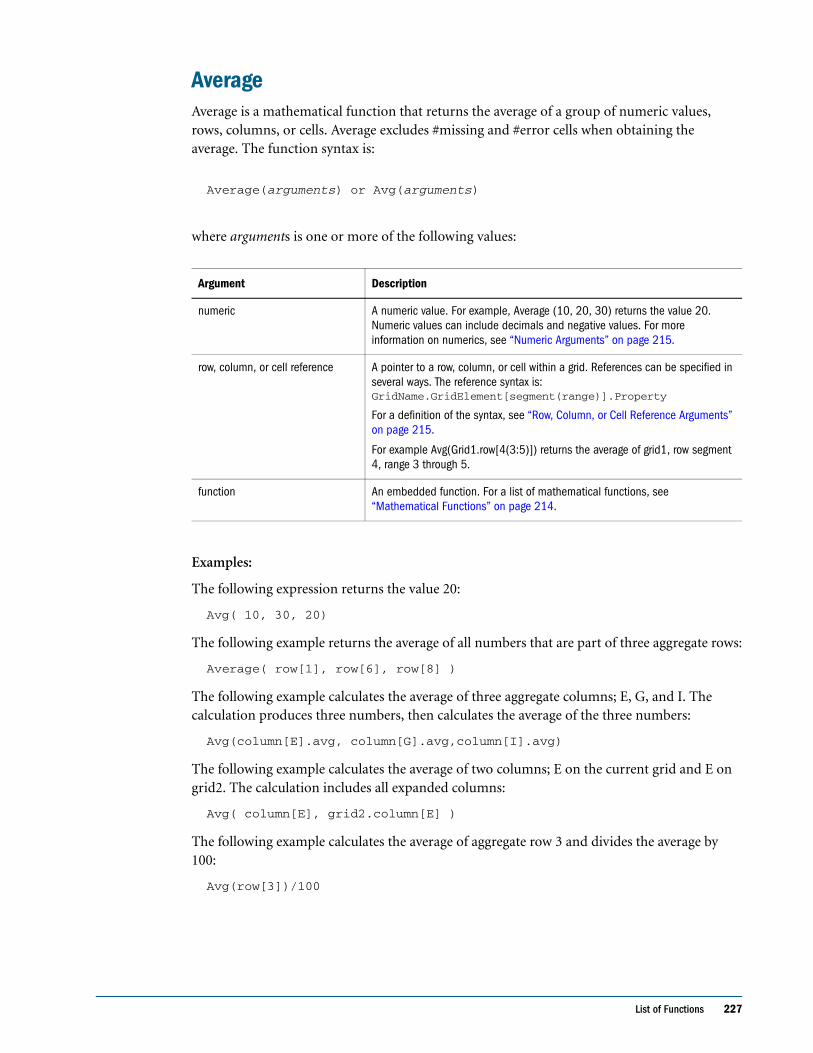
List of Functions 227
AverageAverage is a mathematical function that returns the average of a group of numeric values, rows, columns, or cells. Average excludes #missing and #error cells when obtaining the average. The function syntax is:
Average(arguments) or Avg(arguments)
where arguments is one or more of the following values:
Examples:
The following expression returns the value 20:
Avg( 10, 30, 20)
The following example returns the average of all numbers that are part of three aggregate rows:
Average( row[1], row[6], row[8] )
The following example calculates the average of three aggregate columns; E, G, and I. The calculation produces three numbers, then calculates the average of the three numbers:
Avg(column[E].avg, column[G].avg,column[I].avg)
The following example calculates the average of two columns; E on the current grid and E on grid2. The calculation includes all expanded columns:
Avg( column[E], grid2.column[E] )
The following example calculates the average of aggregate row 3 and divides the average by 100:
Avg(row[3])/100
Argument Description
numeric A numeric value. For example, Average (10, 20, 30) returns the value 20. Numeric values can include decimals and negative values. For more information on numerics, see “Numeric Arguments” on page 215.
row, column, or cell reference A pointer to a row, column, or cell within a grid. References can be specified in several ways. The reference syntax is: GridName.GridElement[segment(range)].Property
For a definition of the syntax, see “Row, Column, or Cell Reference Arguments” on page 215.
For example Avg(Grid1.row[4(3:5)]) returns the average of grid1, row segment 4, range 3 through 5.
function An embedded function. For a list of mathematical functions, see “Mathematical Functions” on page 214.
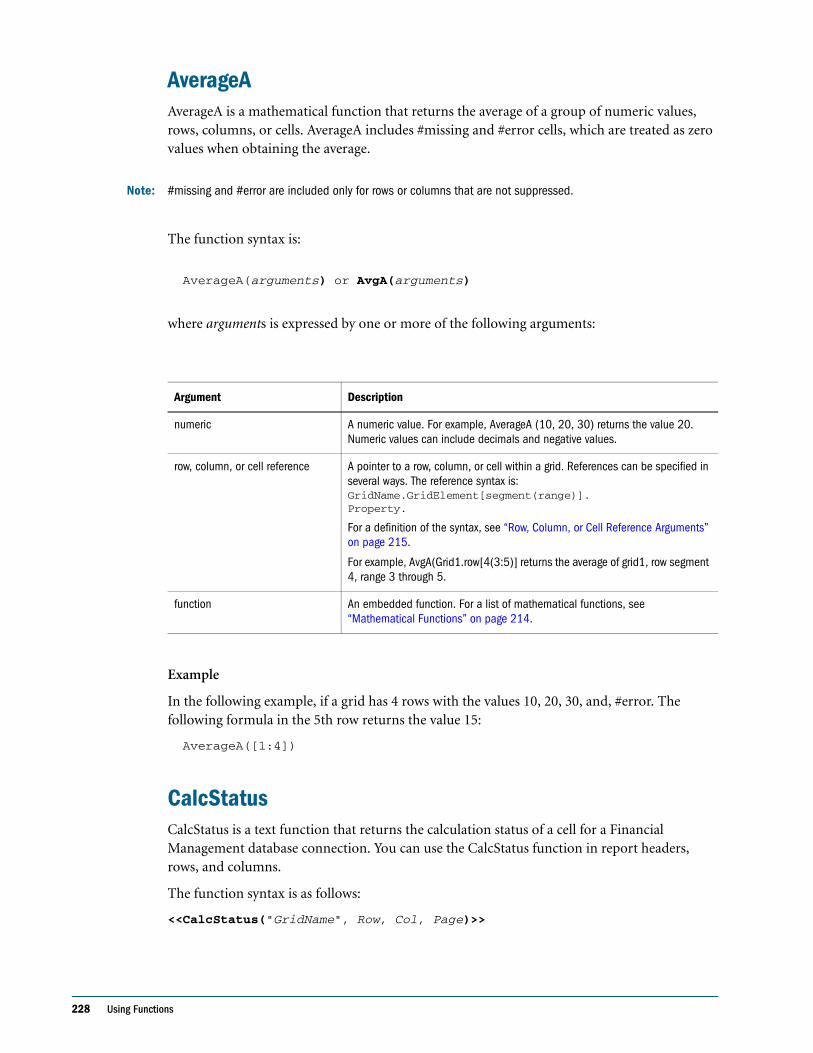
228 Using Functions
AverageAAverageA is a mathematical function that returns the average of a group of numeric values, rows, columns, or cells. AverageA includes #missing and #error cells, which are treated as zero values when obtaining the average.
Note: #missing and #error are included only for rows or columns that are not suppressed.
The function syntax is:
AverageA(arguments) or AvgA(arguments)
where arguments is expressed by one or more of the following arguments:
Example
In the following example, if a grid has 4 rows with the values 10, 20, 30, and, #error. The following formula in the 5th row returns the value 15:
AverageA([1:4])
CalcStatusCalcStatus is a text function that returns the calculation status of a cell for a Financial Management database connection. You can use the CalcStatus function in report headers, rows, and columns.
The function syntax is as follows:
<<CalcStatus("GridName", Row, Col, Page)>>
Argument Description
numeric A numeric value. For example, AverageA (10, 20, 30) returns the value 20. Numeric values can include decimals and negative values.
row, column, or cell reference A pointer to a row, column, or cell within a grid. References can be specified in several ways. The reference syntax is: GridName.GridElement[segment(range)]. Property.
For a definition of the syntax, see “Row, Column, or Cell Reference Arguments” on page 215.
For example, AvgA(Grid1.row[4(3:5)] returns the average of grid1, row segment 4, range 3 through 5.
function An embedded function. For a list of mathematical functions, see “Mathematical Functions” on page 214.
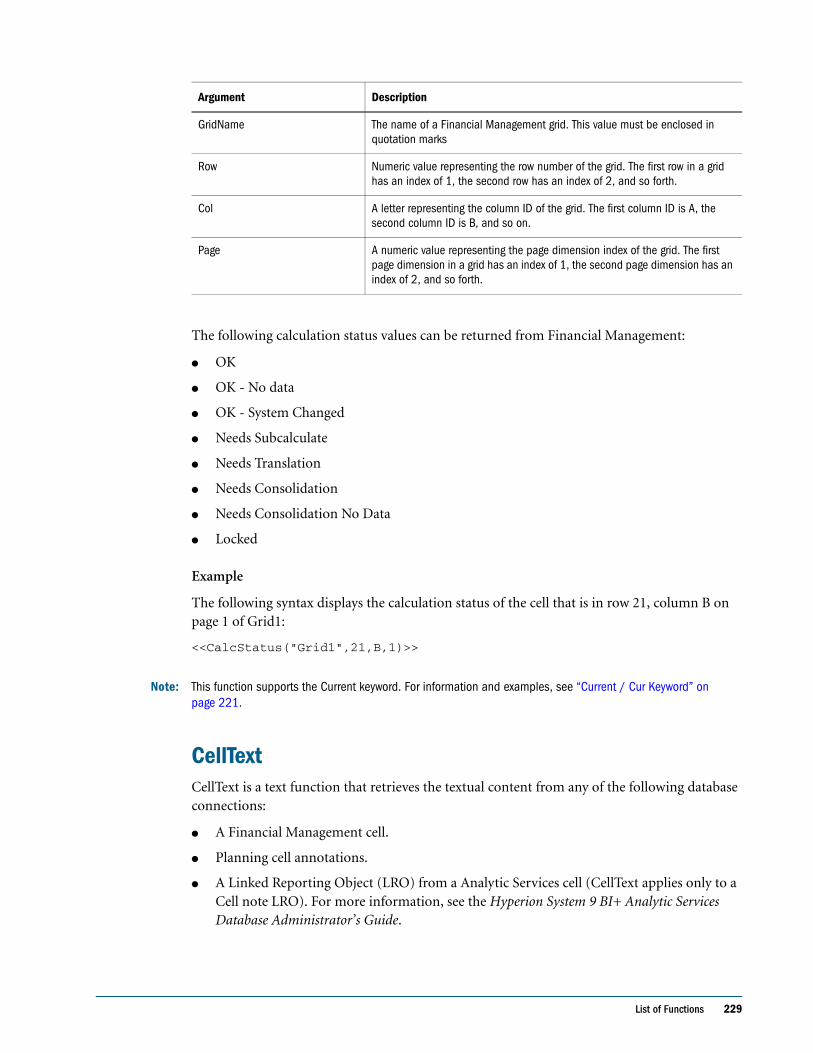
List of Functions 229
The following calculation status values can be returned from Financial Management:
● OK
● OK - No data
● OK - System Changed
● Needs Subcalculate
● Needs Translation
● Needs Consolidation
● Needs Consolidation No Data
● Locked
Example
The following syntax displays the calculation status of the cell that is in row 21, column B on page 1 of Grid1:
<<CalcStatus("Grid1",21,B,1)>>
Note: This function supports the Current keyword. For information and examples, see “Current / Cur Keyword” on page 221.
CellTextCellText is a text function that retrieves the textual content from any of the following database connections:
● A Financial Management cell.
● Planning cell annotations.
● A Linked Reporting Object (LRO) from a Analytic Services cell (CellText applies only to a Cell note LRO). For more information, see the Hyperion System 9 BI+ Analytic Services Database Administrator’s Guide.
Argument Description
GridName The name of a Financial Management grid. This value must be enclosed in quotation marks
Row Numeric value representing the row number of the grid. The first row in a grid has an index of 1, the second row has an index of 2, and so forth.
Col A letter representing the column ID of the grid. The first column ID is A, the second column ID is B, and so on.
Page A numeric value representing the page dimension index of the grid. The first page dimension in a grid has an index of 1, the second page dimension has an index of 2, and so forth.
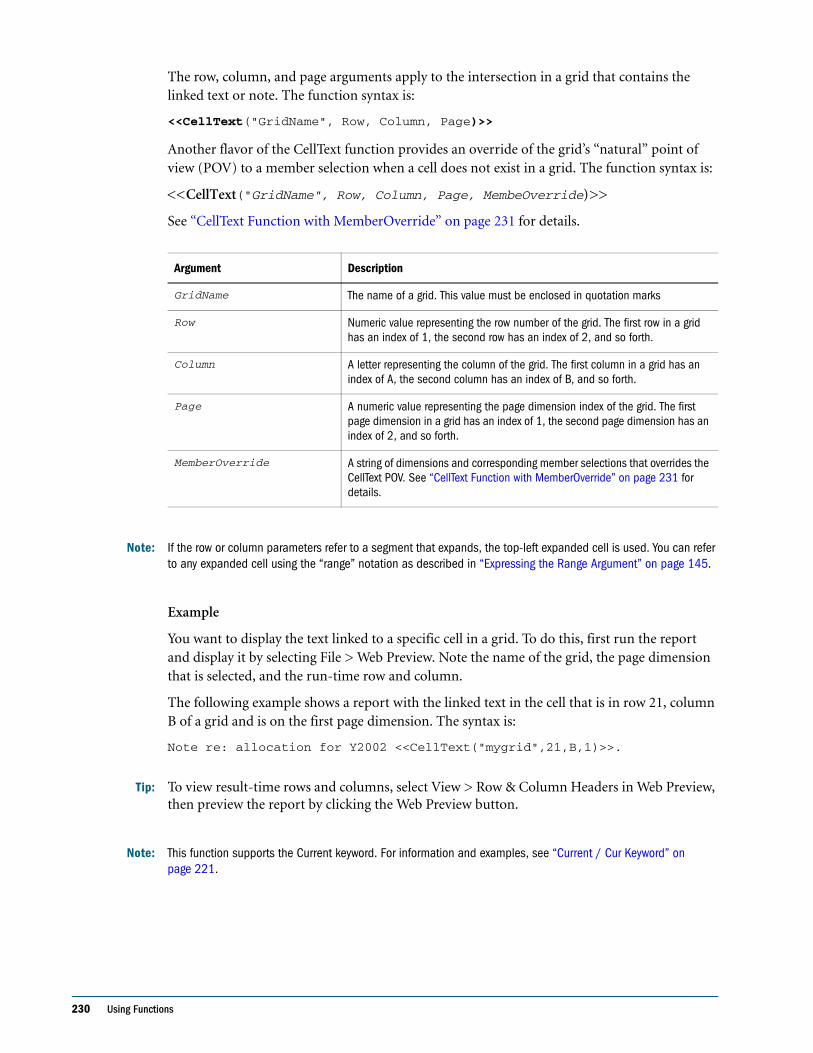
230 Using Functions
The row, column, and page arguments apply to the intersection in a grid that contains the linked text or note. The function syntax is:
<<CellText("GridName", Row, Column, Page)>>
Another flavor of the CellText function provides an override of the grid’s “natural” point of view (POV) to a member selection when a cell does not exist in a grid. The function syntax is:
<<CellText("GridName", Row, Column, Page, MembeOverride)>>
See “CellText Function with MemberOverride” on page 231 for details.
Note: If the row or column parameters refer to a segment that expands, the top-left expanded cell is used. You can refer to any expanded cell using the “range” notation as described in “Expressing the Range Argument” on page 145.
Example
You want to display the text linked to a specific cell in a grid. To do this, first run the report and display it by selecting File > Web Preview. Note the name of the grid, the page dimension that is selected, and the run-time row and column.
The following example shows a report with the linked text in the cell that is in row 21, column B of a grid and is on the first page dimension. The syntax is:
Note re: allocation for Y2002 <<CellText("mygrid",21,B,1)>>.
Tip: To view result-time rows and columns, select View > Row & Column Headers in Web Preview, then preview the report by clicking the Web Preview button.
Note: This function supports the Current keyword. For information and examples, see “Current / Cur Keyword” on page 221.
Argument Description
GridName The name of a grid. This value must be enclosed in quotation marks
Row Numeric value representing the row number of the grid. The first row in a grid has an index of 1, the second row has an index of 2, and so forth.
Column A letter representing the column of the grid. The first column in a grid has an index of A, the second column has an index of B, and so forth.
Page A numeric value representing the page dimension index of the grid. The first page dimension in a grid has an index of 1, the second page dimension has an index of 2, and so forth.
MemberOverride A string of dimensions and corresponding member selections that overrides the CellText POV. See “CellText Function with MemberOverride” on page 231 for details.
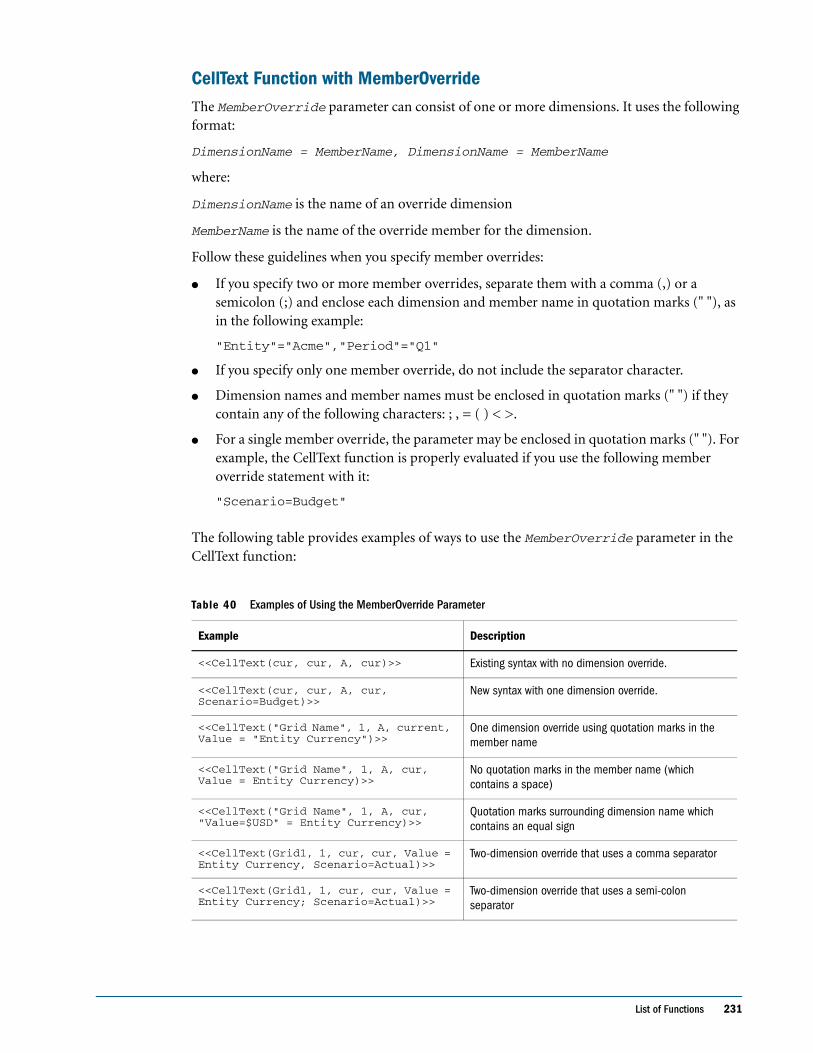
List of Functions 231
CellText Function with MemberOverrideThe MemberOverride parameter can consist of one or more dimensions. It uses the following format:
DimensionName = MemberName, DimensionName = MemberName
where:
DimensionName is the name of an override dimension
MemberName is the name of the override member for the dimension.
Follow these guidelines when you specify member overrides:
● If you specify two or more member overrides, separate them with a comma (,) or a semicolon (;) and enclose each dimension and member name in quotation marks (" "), as in the following example:
"Entity"="Acme","Period"="Q1"
● If you specify only one member override, do not include the separator character.
● Dimension names and member names must be enclosed in quotation marks (" ") if they contain any of the following characters: ; , = ( ) < >.
● For a single member override, the parameter may be enclosed in quotation marks (" "). For example, the CellText function is properly evaluated if you use the following member override statement with it:
"Scenario=Budget"
The following table provides examples of ways to use the MemberOverride parameter in the CellText function:
Table 40 Examples of Using the MemberOverride Parameter
Example Description
<<CellText(cur, cur, A, cur)>> Existing syntax with no dimension override.
<<CellText(cur, cur, A, cur, Scenario=Budget)>>
New syntax with one dimension override.
<<CellText("Grid Name", 1, A, current, Value = "Entity Currency")>>
One dimension override using quotation marks in the member name
<<CellText("Grid Name", 1, A, cur, Value = Entity Currency)>>
No quotation marks in the member name (which contains a space)
<<CellText("Grid Name", 1, A, cur, "Value=$USD" = Entity Currency)>>
Quotation marks surrounding dimension name which contains an equal sign
<<CellText(Grid1, 1, cur, cur, Value = Entity Currency, Scenario=Actual)>>
Two-dimension override that uses a comma separator
<<CellText(Grid1, 1, cur, cur, Value = Entity Currency; Scenario=Actual)>>
Two-dimension override that uses a semi-colon separator
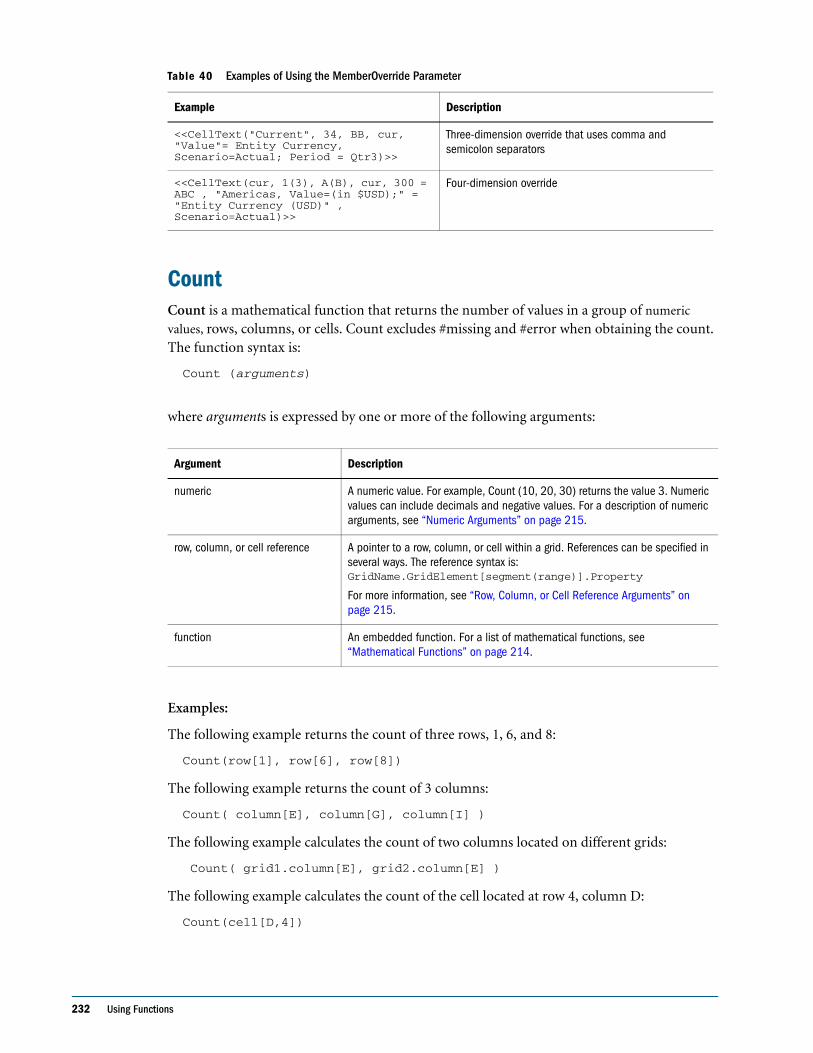
232 Using Functions
CountCount is a mathematical function that returns the number of values in a group of numeric
values, rows, columns, or cells. Count excludes #missing and #error when obtaining the count. The function syntax is:
Count (arguments)
where arguments is expressed by one or more of the following arguments:
Examples:
The following example returns the count of three rows, 1, 6, and 8:
Count(row[1], row[6], row[8])
The following example returns the count of 3 columns:
Count( column[E], column[G], column[I] )
The following example calculates the count of two columns located on different grids:
Count( grid1.column[E], grid2.column[E] )
The following example calculates the count of the cell located at row 4, column D:
Count(cell[D,4])
<<CellText("Current", 34, BB, cur, "Value"= Entity Currency, Scenario=Actual; Period = Qtr3)>>
Three-dimension override that uses comma and semicolon separators
<<CellText(cur, 1(3), A(B), cur, 300 = ABC , "Americas, Value=(in $USD);" = "Entity Currency (USD)" , Scenario=Actual)>>
Four-dimension override
Argument Description
numeric A numeric value. For example, Count (10, 20, 30) returns the value 3. Numeric values can include decimals and negative values. For a description of numeric arguments, see “Numeric Arguments” on page 215.
row, column, or cell reference A pointer to a row, column, or cell within a grid. References can be specified in several ways. The reference syntax is: GridName.GridElement[segment(range)].Property
For more information, see “Row, Column, or Cell Reference Arguments” on page 215.
function An embedded function. For a list of mathematical functions, see “Mathematical Functions” on page 214.
Table 40 Examples of Using the MemberOverride Parameter
Example Description
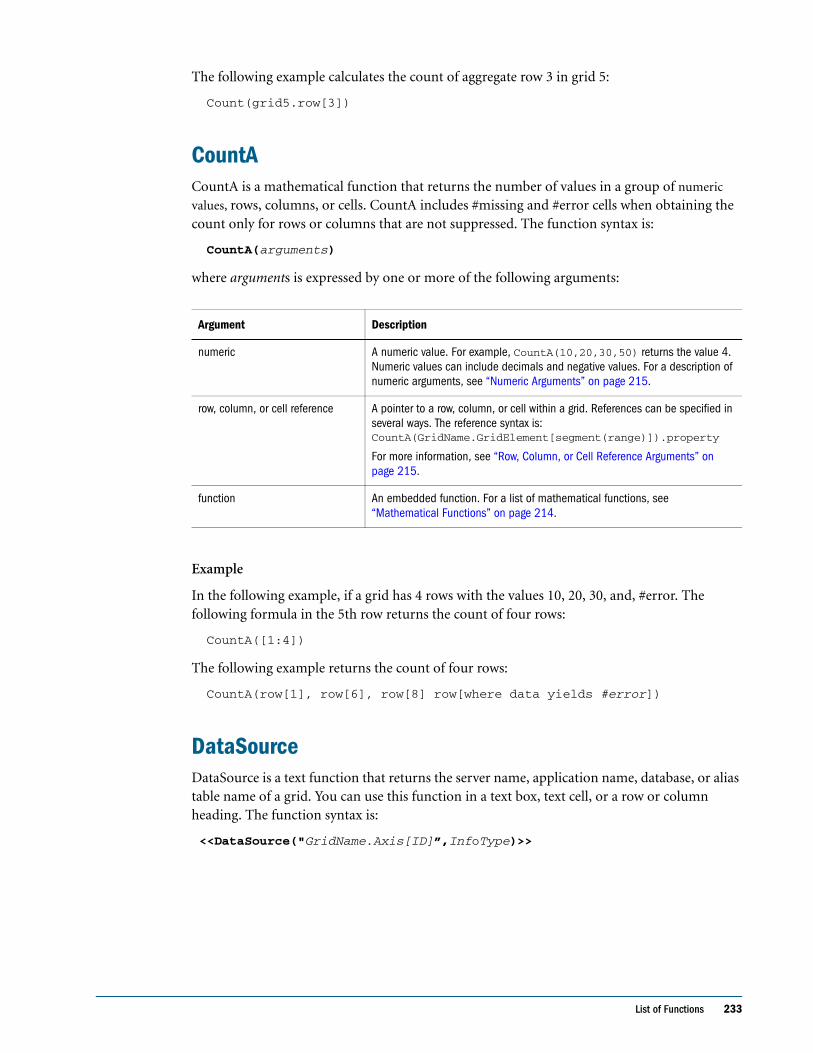
List of Functions 233
The following example calculates the count of aggregate row 3 in grid 5:
Count(grid5.row[3])
CountACountA is a mathematical function that returns the number of values in a group of numeric
values, rows, columns, or cells. CountA includes #missing and #error cells when obtaining the count only for rows or columns that are not suppressed. The function syntax is:
CountA(arguments)
where arguments is expressed by one or more of the following arguments:
Example
In the following example, if a grid has 4 rows with the values 10, 20, 30, and, #error. The following formula in the 5th row returns the count of four rows:
CountA([1:4])
The following example returns the count of four rows:
CountA(row[1], row[6], row[8] row[where data yields #error])
DataSourceDataSource is a text function that returns the server name, application name, database, or alias table name of a grid. You can use this function in a text box, text cell, or a row or column heading. The function syntax is:
<<DataSource("GridName.Axis[ID]”,InfoType)>>
Argument Description
numeric A numeric value. For example, CountA(10,20,30,50) returns the value 4. Numeric values can include decimals and negative values. For a description of numeric arguments, see “Numeric Arguments” on page 215.
row, column, or cell reference A pointer to a row, column, or cell within a grid. References can be specified in several ways. The reference syntax is: CountA(GridName.GridElement[segment(range)]).property
For more information, see “Row, Column, or Cell Reference Arguments” on page 215.
function An embedded function. For a list of mathematical functions, see “Mathematical Functions” on page 214.
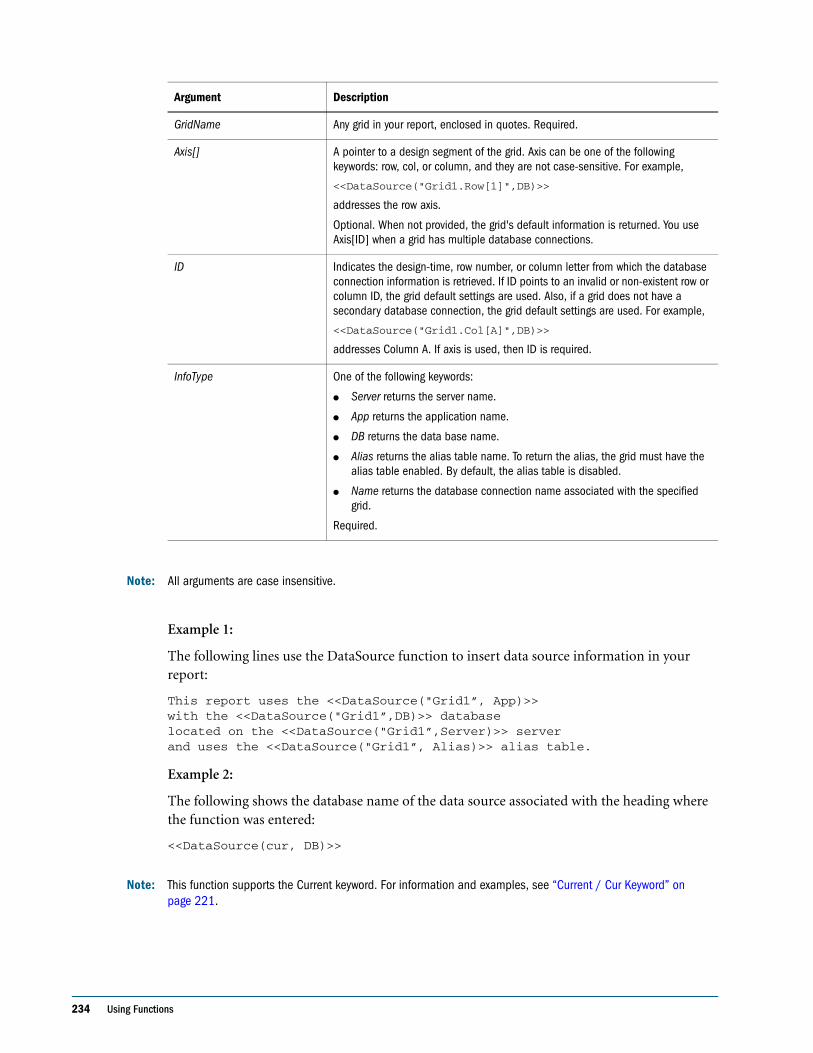
234 Using Functions
Note: All arguments are case insensitive.
Example 1:
The following lines use the DataSource function to insert data source information in your report:
This report uses the <<DataSource("Grid1”, App)>>with the <<DataSource("Grid1”,DB)>> databaselocated on the <<DataSource("Grid1”,Server)>> serverand uses the <<DataSource("Grid1”, Alias)>> alias table.
Example 2:
The following shows the database name of the data source associated with the heading where the function was entered:
<<DataSource(cur, DB)>>
Note: This function supports the Current keyword. For information and examples, see “Current / Cur Keyword” on page 221.
Argument Description
GridName Any grid in your report, enclosed in quotes. Required.
Axis[] A pointer to a design segment of the grid. Axis can be one of the following keywords: row, col, or column, and they are not case-sensitive. For example,
<<DataSource("Grid1.Row[1]",DB)>>
addresses the row axis.
Optional. When not provided, the grid's default information is returned. You use Axis[ID] when a grid has multiple database connections.
ID Indicates the design-time, row number, or column letter from which the database connection information is retrieved. If ID points to an invalid or non-existent row or column ID, the grid default settings are used. Also, if a grid does not have a secondary database connection, the grid default settings are used. For example,
<<DataSource("Grid1.Col[A]",DB)>>
addresses Column A. If axis is used, then ID is required.
InfoType One of the following keywords:
● Server returns the server name.
● App returns the application name.
● DB returns the data base name.
● Alias returns the alias table name. To return the alias, the grid must have the alias table enabled. By default, the alias table is disabled.
● Name returns the database connection name associated with the specified grid.
Required.
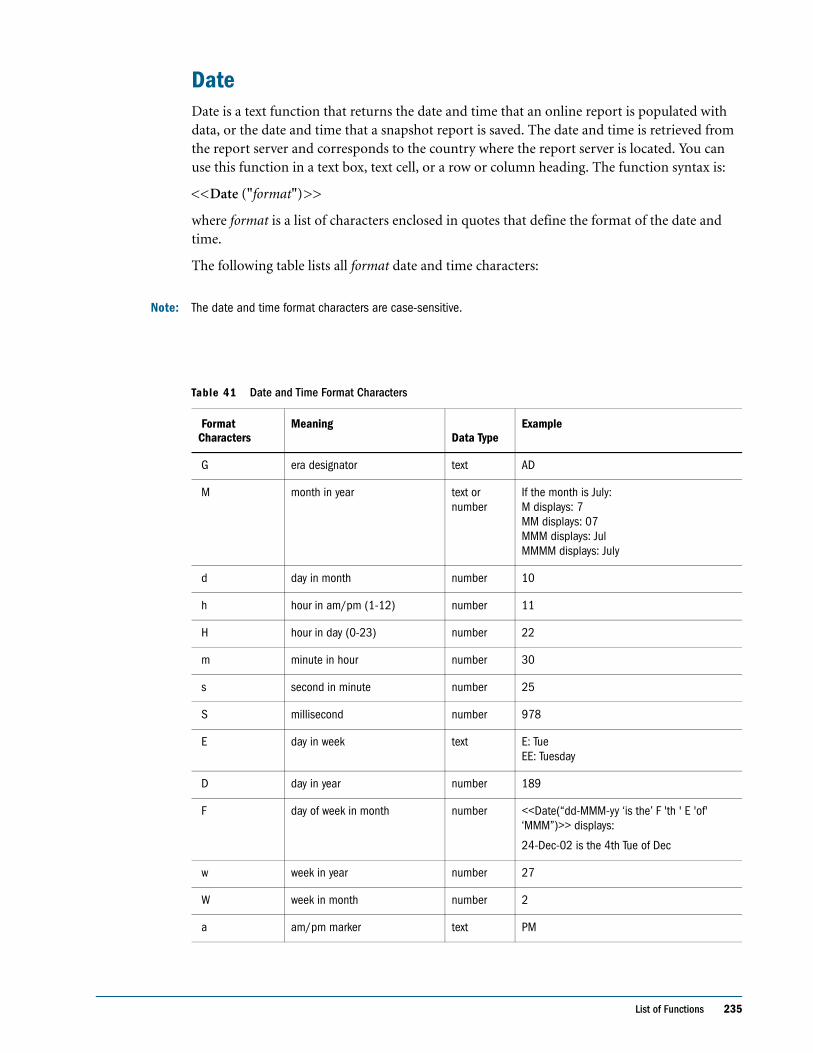
List of Functions 235
DateDate is a text function that returns the date and time that an online report is populated with data, or the date and time that a snapshot report is saved. The date and time is retrieved from the report server and corresponds to the country where the report server is located. You can use this function in a text box, text cell, or a row or column heading. The function syntax is:
<<Date ("format")>>
where format is a list of characters enclosed in quotes that define the format of the date and time.
The following table lists all format date and time characters:
Note: The date and time format characters are case-sensitive.
Table 41 Date and Time Format Characters
Format Characters
Meaning Data Type
Example
G era designator text AD
M month in year text or number
If the month is July: M displays: 7 MM displays: 07 MMM displays: Jul MMMM displays: July
d day in month number 10
h hour in am/pm (1-12) number 11
H hour in day (0-23) number 22
m minute in hour number 30
s second in minute number 25
S millisecond number 978
E day in week text E: Tue EE: Tuesday
D day in year number 189
F day of week in month number <<Date(“dd-MMM-yy ‘is the’ F 'th ' E 'of' ‘MMM”)>> displays:
24-Dec-02 is the 4th Tue of Dec
w week in year number 27
W week in month number 2
a am/pm marker text PM
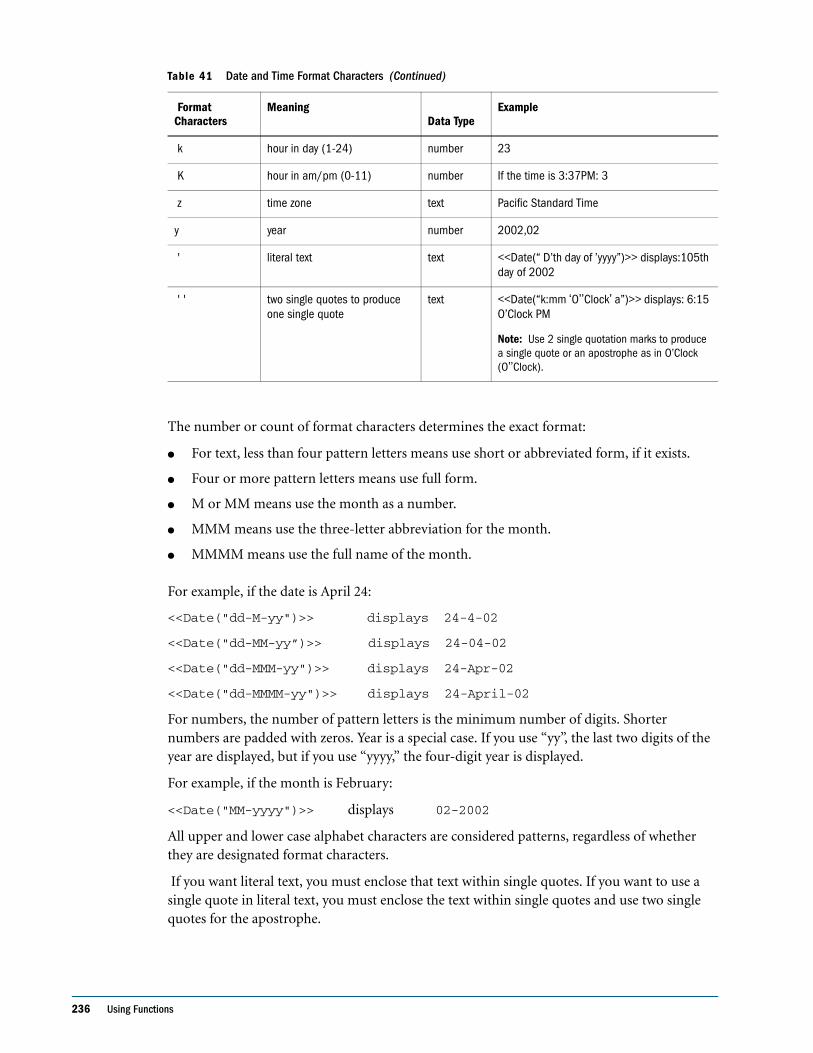
236 Using Functions
The number or count of format characters determines the exact format:
● For text, less than four pattern letters means use short or abbreviated form, if it exists.
● Four or more pattern letters means use full form.
● M or MM means use the month as a number.
● MMM means use the three-letter abbreviation for the month.
● MMMM means use the full name of the month.
For example, if the date is April 24:
<<Date("dd-M-yy")>> displays 24-4-02
<<Date("dd-MM-yy”)>> displays 24-04-02
<<Date("dd-MMM-yy")>> displays 24-Apr-02
<<Date("dd-MMMM-yy")>> displays 24-April-02
For numbers, the number of pattern letters is the minimum number of digits. Shorter numbers are padded with zeros. Year is a special case. If you use “yy”, the last two digits of the year are displayed, but if you use “yyyy,” the four-digit year is displayed.
For example, if the month is February:
<<Date("MM-yyyy")>> displays 02-2002
All upper and lower case alphabet characters are considered patterns, regardless of whether they are designated format characters.
If you want literal text, you must enclose that text within single quotes. If you want to use a single quote in literal text, you must enclose the text within single quotes and use two single quotes for the apostrophe.
k hour in day (1-24) number 23
K hour in am/pm (0-11) number If the time is 3:37PM: 3
z time zone text Pacific Standard Time
y year number 2002,02
' literal text text <<Date(“ D’th day of ’yyyy”)>> displays:105th day of 2002
' ' two single quotes to produce one single quote
text <<Date(“k:mm ‘O’’Clock’ a”)>> displays: 6:15 O’Clock PM
Note: Use 2 single quotation marks to produce a single quote or an apostrophe as in O’Clock (O’’Clock).
Table 41 Date and Time Format Characters (Continued)
Format Characters
Meaning Data Type
Example
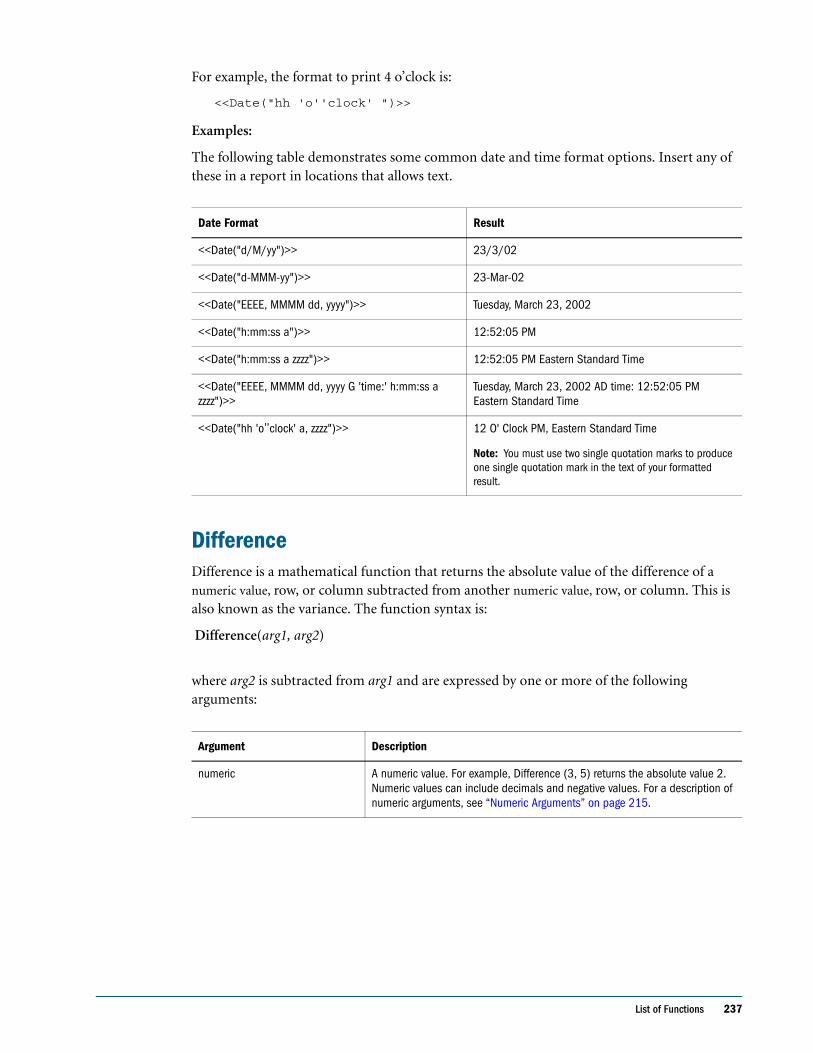
List of Functions 237
For example, the format to print 4 o’clock is:
<<Date("hh 'o''clock' ")>>
Examples:
The following table demonstrates some common date and time format options. Insert any of these in a report in locations that allows text.
DifferenceDifference is a mathematical function that returns the absolute value of the difference of a numeric value, row, or column subtracted from another numeric value, row, or column. This is also known as the variance. The function syntax is:
Difference(arg1, arg2)
where arg2 is subtracted from arg1 and are expressed by one or more of the following arguments:
Date Format Result
<<Date("d/M/yy")>> 23/3/02
<<Date("d-MMM-yy")>> 23-Mar-02
<<Date("EEEE, MMMM dd, yyyy")>> Tuesday, March 23, 2002
<<Date("h:mm:ss a")>> 12:52:05 PM
<<Date("h:mm:ss a zzzz")>> 12:52:05 PM Eastern Standard Time
<<Date("EEEE, MMMM dd, yyyy G 'time:' h:mm:ss a zzzz")>>
Tuesday, March 23, 2002 AD time: 12:52:05 PM Eastern Standard Time
<<Date("hh 'o’’clock' a, zzzz")>> 12 O' Clock PM, Eastern Standard Time
Note: You must use two single quotation marks to produce one single quotation mark in the text of your formatted result.
Argument Description
numeric A numeric value. For example, Difference (3, 5) returns the absolute value 2. Numeric values can include decimals and negative values. For a description of numeric arguments, see “Numeric Arguments” on page 215.
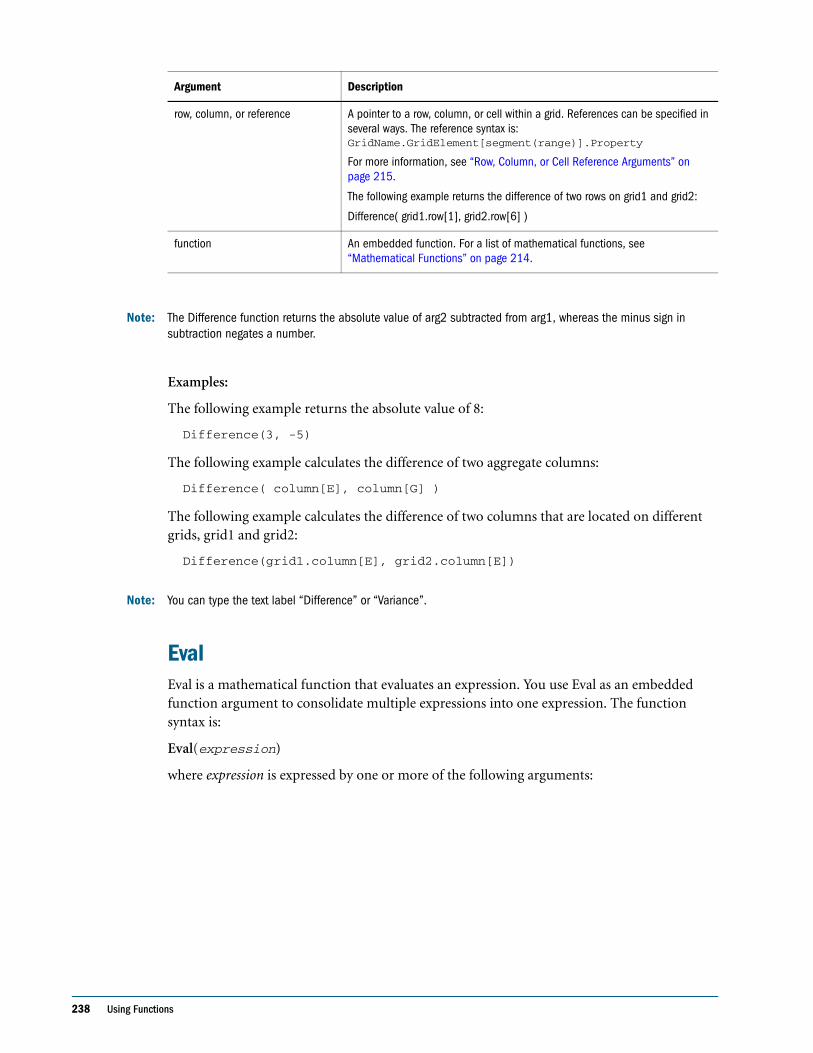
238 Using Functions
Note: The Difference function returns the absolute value of arg2 subtracted from arg1, whereas the minus sign in subtraction negates a number.
Examples:
The following example returns the absolute value of 8:
Difference(3, -5)
The following example calculates the difference of two aggregate columns:
Difference( column[E], column[G] )
The following example calculates the difference of two columns that are located on different grids, grid1 and grid2:
Difference(grid1.column[E], grid2.column[E])
Note: You can type the text label “Difference” or “Variance”.
EvalEval is a mathematical function that evaluates an expression. You use Eval as an embedded function argument to consolidate multiple expressions into one expression. The function syntax is:
Eval(expression)
where expression is expressed by one or more of the following arguments:
row, column, or reference A pointer to a row, column, or cell within a grid. References can be specified in several ways. The reference syntax is: GridName.GridElement[segment(range)].Property
For more information, see “Row, Column, or Cell Reference Arguments” on page 215.
The following example returns the difference of two rows on grid1 and grid2:
Difference( grid1.row[1], grid2.row[6] )
function An embedded function. For a list of mathematical functions, see “Mathematical Functions” on page 214.
Argument Description
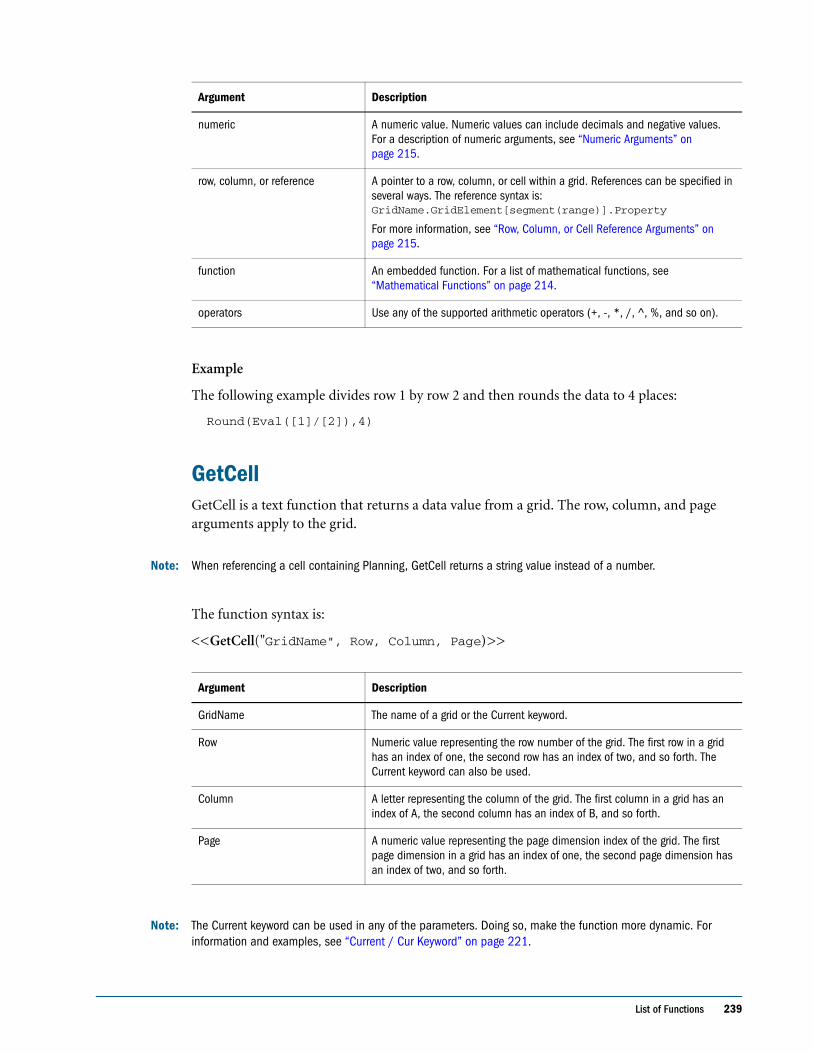
List of Functions 239
Example
The following example divides row 1 by row 2 and then rounds the data to 4 places:
Round(Eval([1]/[2]),4)
GetCellGetCell is a text function that returns a data value from a grid. The row, column, and page arguments apply to the grid.
Note: When referencing a cell containing Planning, GetCell returns a string value instead of a number.
The function syntax is:
<<GetCell("GridName", Row, Column, Page)>>
Note: The Current keyword can be used in any of the parameters. Doing so, make the function more dynamic. For information and examples, see “Current / Cur Keyword” on page 221.
Argument Description
numeric A numeric value. Numeric values can include decimals and negative values. For a description of numeric arguments, see “Numeric Arguments” on page 215.
row, column, or reference A pointer to a row, column, or cell within a grid. References can be specified in several ways. The reference syntax is: GridName.GridElement[segment(range)].Property
For more information, see “Row, Column, or Cell Reference Arguments” on page 215.
function An embedded function. For a list of mathematical functions, see “Mathematical Functions” on page 214.
operators Use any of the supported arithmetic operators (+, -, *, /, ^, %, and so on).
Argument Description
GridName The name of a grid or the Current keyword.
Row Numeric value representing the row number of the grid. The first row in a grid has an index of one, the second row has an index of two, and so forth. The Current keyword can also be used.
Column A letter representing the column of the grid. The first column in a grid has an index of A, the second column has an index of B, and so forth.
Page A numeric value representing the page dimension index of the grid. The first page dimension in a grid has an index of one, the second page dimension has an index of two, and so forth.
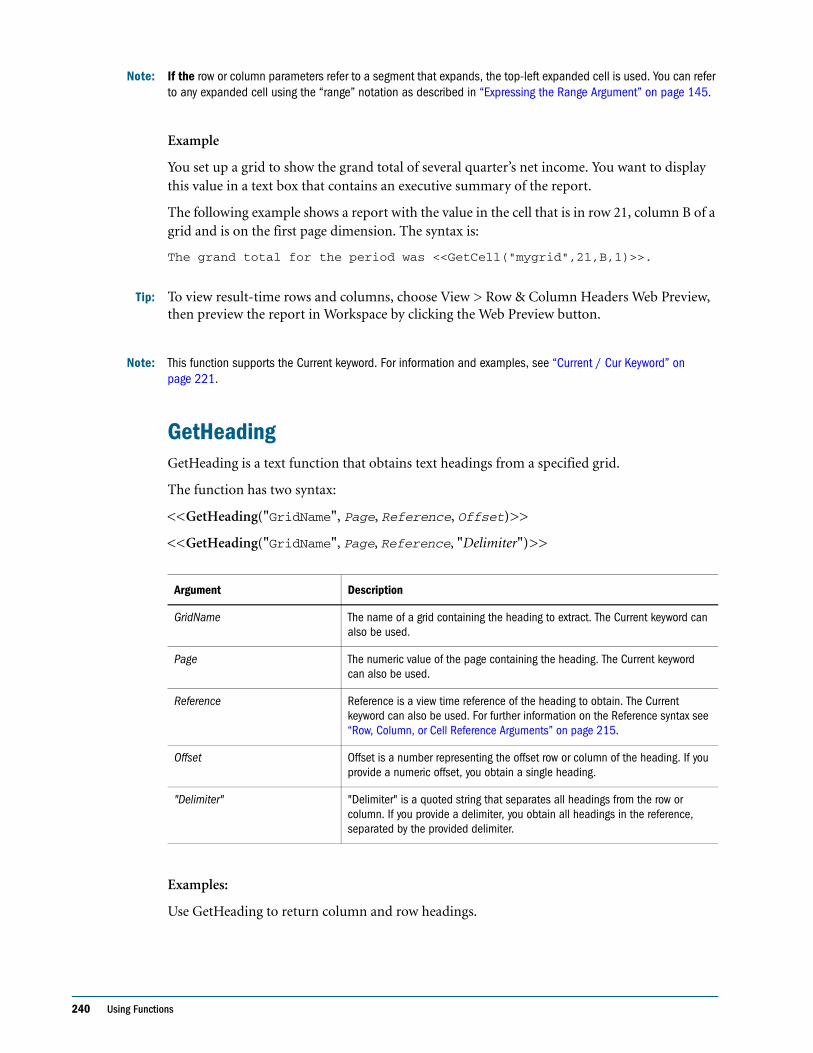
240 Using Functions
Note: If the row or column parameters refer to a segment that expands, the top-left expanded cell is used. You can refer to any expanded cell using the “range” notation as described in “Expressing the Range Argument” on page 145.
Example
You set up a grid to show the grand total of several quarter’s net income. You want to display this value in a text box that contains an executive summary of the report.
The following example shows a report with the value in the cell that is in row 21, column B of a grid and is on the first page dimension. The syntax is:
The grand total for the period was <<GetCell("mygrid",21,B,1)>>.
Tip: To view result-time rows and columns, choose View > Row & Column Headers Web Preview, then preview the report in Workspace by clicking the Web Preview button.
Note: This function supports the Current keyword. For information and examples, see “Current / Cur Keyword” on page 221.
GetHeadingGetHeading is a text function that obtains text headings from a specified grid.
The function has two syntax:
<<GetHeading("GridName", Page, Reference, Offset)>>
<<GetHeading("GridName", Page, Reference, "Delimiter")>>
Examples:
Use GetHeading to return column and row headings.
Argument Description
GridName The name of a grid containing the heading to extract. The Current keyword can also be used.
Page The numeric value of the page containing the heading. The Current keyword can also be used.
Reference Reference is a view time reference of the heading to obtain. The Current keyword can also be used. For further information on the Reference syntax see “Row, Column, or Cell Reference Arguments” on page 215.
Offset Offset is a number representing the offset row or column of the heading. If you provide a numeric offset, you obtain a single heading.
"Delimiter" "Delimiter" is a quoted string that separates all headings from the row or column. If you provide a delimiter, you obtain all headings in the reference, separated by the provided delimiter.
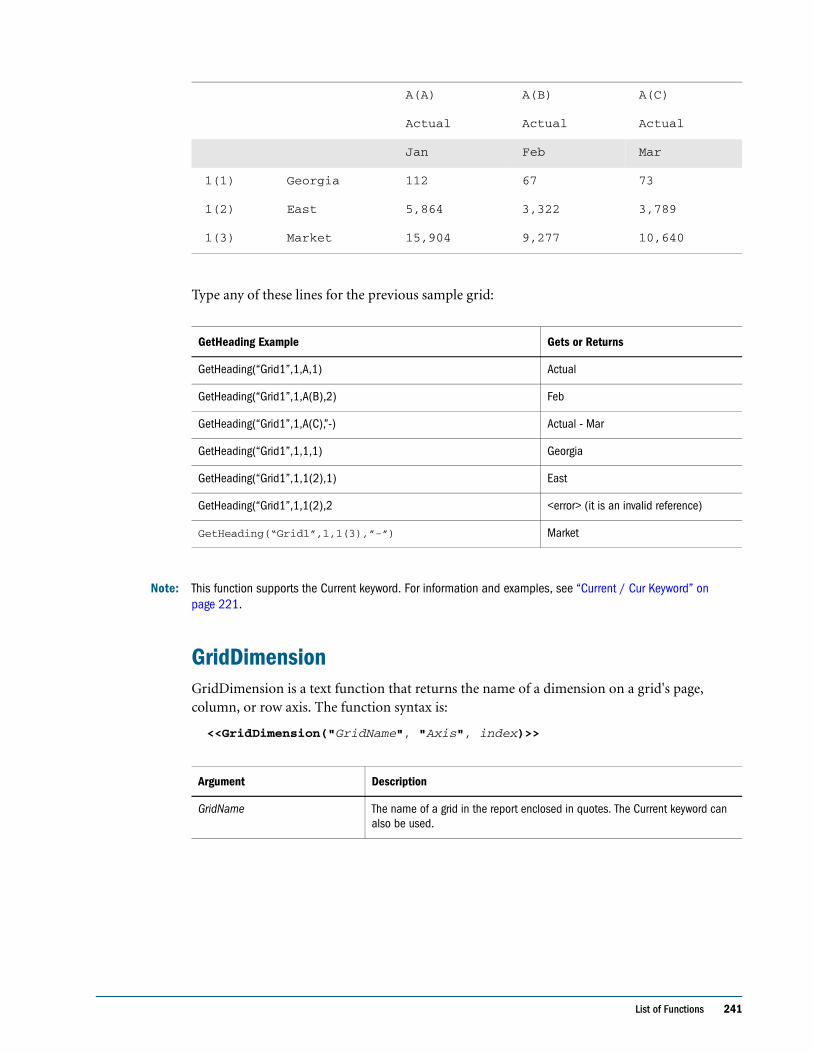
List of Functions 241
Type any of these lines for the previous sample grid:
Note: This function supports the Current keyword. For information and examples, see “Current / Cur Keyword” on page 221.
GridDimensionGridDimension is a text function that returns the name of a dimension on a grid's page, column, or row axis. The function syntax is:
<<GridDimension("GridName", "Axis", index)>>
A(A) A(B) A(C)
Actual Actual Actual
Jan Feb Mar
1(1) Georgia 112 67 73
1(2) East 5,864 3,322 3,789
1(3) Market 15,904 9,277 10,640
GetHeading Example Gets or Returns
GetHeading(“Grid1”,1,A,1) Actual
GetHeading(“Grid1”,1,A(B),2) Feb
GetHeading(“Grid1”,1,A(C),”-) Actual - Mar
GetHeading(“Grid1”,1,1,1) Georgia
GetHeading(“Grid1”,1,1(2),1) East
GetHeading(“Grid1”,1,1(2),2 <error> (it is an invalid reference)
GetHeading(“Grid1”,1,1(3),”-”) Market
Argument Description
GridName The name of a grid in the report enclosed in quotes. The Current keyword can also be used.
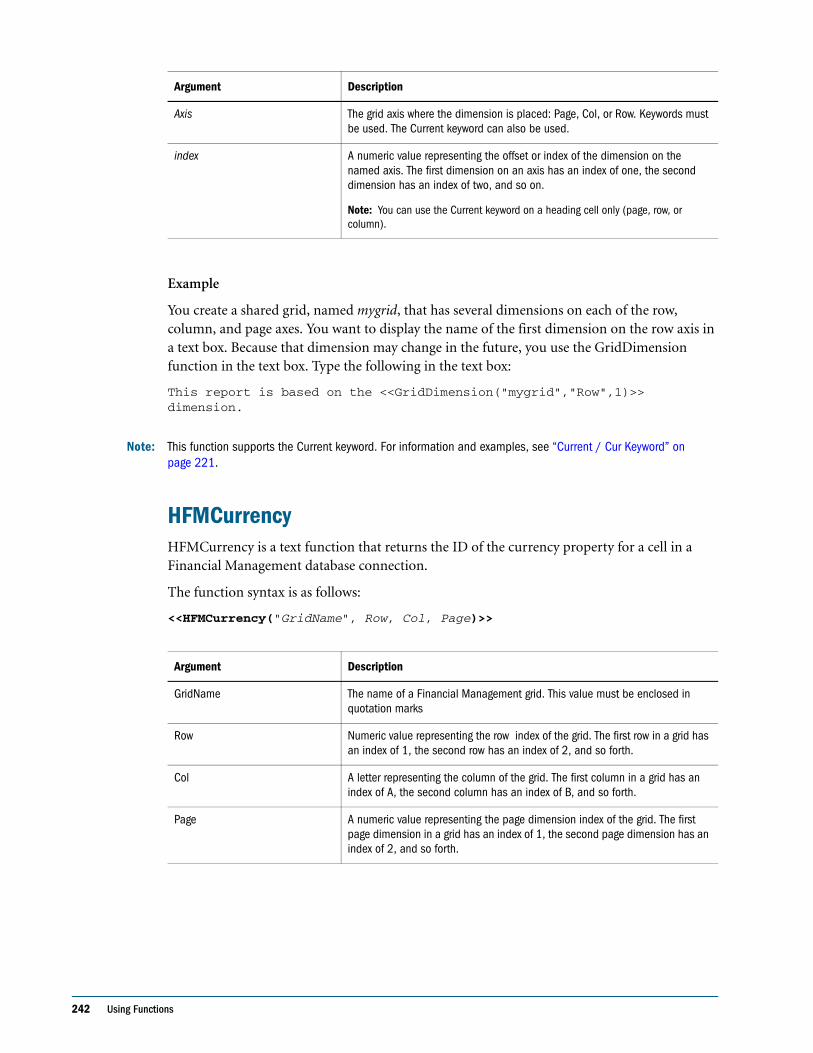
242 Using Functions
Example
You create a shared grid, named mygrid, that has several dimensions on each of the row, column, and page axes. You want to display the name of the first dimension on the row axis in a text box. Because that dimension may change in the future, you use the GridDimension function in the text box. Type the following in the text box:
This report is based on the <<GridDimension("mygrid","Row",1)>> dimension.
Note: This function supports the Current keyword. For information and examples, see “Current / Cur Keyword” on page 221.
HFMCurrencyHFMCurrency is a text function that returns the ID of the currency property for a cell in a Financial Management database connection.
The function syntax is as follows:
<<HFMCurrency("GridName", Row, Col, Page)>>
Axis The grid axis where the dimension is placed: Page, Col, or Row. Keywords must be used. The Current keyword can also be used.
index A numeric value representing the offset or index of the dimension on the named axis. The first dimension on an axis has an index of one, the second dimension has an index of two, and so on.
Note: You can use the Current keyword on a heading cell only (page, row, or column).
Argument Description
GridName The name of a Financial Management grid. This value must be enclosed in quotation marks
Row Numeric value representing the row index of the grid. The first row in a grid has an index of 1, the second row has an index of 2, and so forth.
Col A letter representing the column of the grid. The first column in a grid has an index of A, the second column has an index of B, and so forth.
Page A numeric value representing the page dimension index of the grid. The first page dimension in a grid has an index of 1, the second page dimension has an index of 2, and so forth.
Argument Description
List of Functions 243
A designer can map the string returned from Financial Management to another string by way of a properties file change. The mappings are defined in fr_repserver.properties in the HFM Entity Currency section. For example, a designer might add these lines to HFM Entity Currency section:
EntityCurrency_USD=$EntityCurrency_EUR=_
If USD is returned from Financial Management, the U.S. dollar symbol ( $ ) is displayed; if EUR is returned from Financial Management, the European euro symbol ( _ ) is displayed. The properties file includes these and other examples as comments.
Example
The following syntax displays the currency property for the cell that is in row 21, column B on page 1 of Grid1:
<<HFMCurrency("Grid1",21,B,1)>>
Note: This function supports the Current keyword. For information and examples, see “Current / Cur Keyword” on page 221.
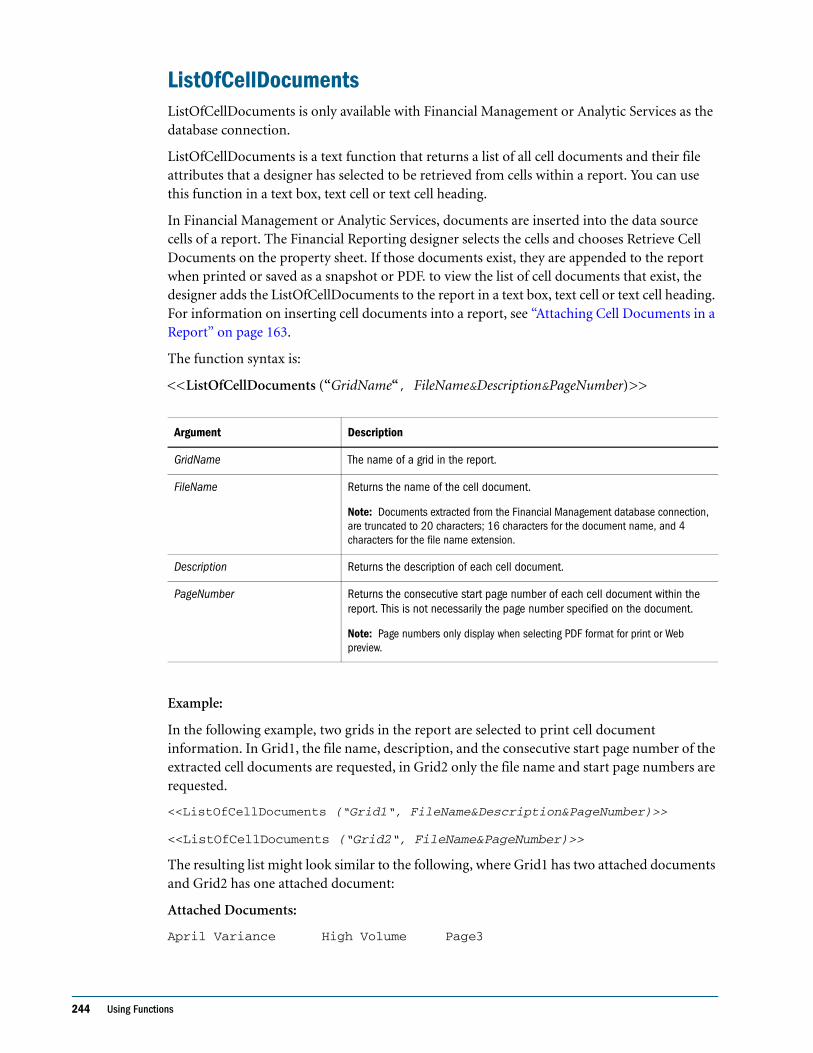
244 Using Functions
ListOfCellDocumentsListOfCellDocuments is only available with Financial Management or Analytic Services as the database connection.
ListOfCellDocuments is a text function that returns a list of all cell documents and their file attributes that a designer has selected to be retrieved from cells within a report. You can use this function in a text box, text cell or text cell heading.
In Financial Management or Analytic Services, documents are inserted into the data source cells of a report. The Financial Reporting designer selects the cells and chooses Retrieve Cell Documents on the property sheet. If those documents exist, they are appended to the report when printed or saved as a snapshot or PDF. to view the list of cell documents that exist, the designer adds the ListOfCellDocuments to the report in a text box, text cell or text cell heading. For information on inserting cell documents into a report, see “Attaching Cell Documents in a Report” on page 163.
The function syntax is:
<<ListOfCellDocuments (“GridName“, FileName&Description&PageNumber)>>
Example:
In the following example, two grids in the report are selected to print cell document information. In Grid1, the file name, description, and the consecutive start page number of the extracted cell documents are requested, in Grid2 only the file name and start page numbers are requested.
<<ListOfCellDocuments (“Grid1“, FileName&Description&PageNumber)>>
<<ListOfCellDocuments (“Grid2“, FileName&PageNumber)>>
The resulting list might look similar to the following, where Grid1 has two attached documents and Grid2 has one attached document:
Attached Documents:
April Variance High Volume Page3
Argument Description
GridName The name of a grid in the report.
FileName Returns the name of the cell document.
Note: Documents extracted from the Financial Management database connection, are truncated to 20 characters; 16 characters for the document name, and 4 characters for the file name extension.
Description Returns the description of each cell document.
PageNumber Returns the consecutive start page number of each cell document within the report. This is not necessarily the page number specified on the document.
Note: Page numbers only display when selecting PDF format for print or Web preview.
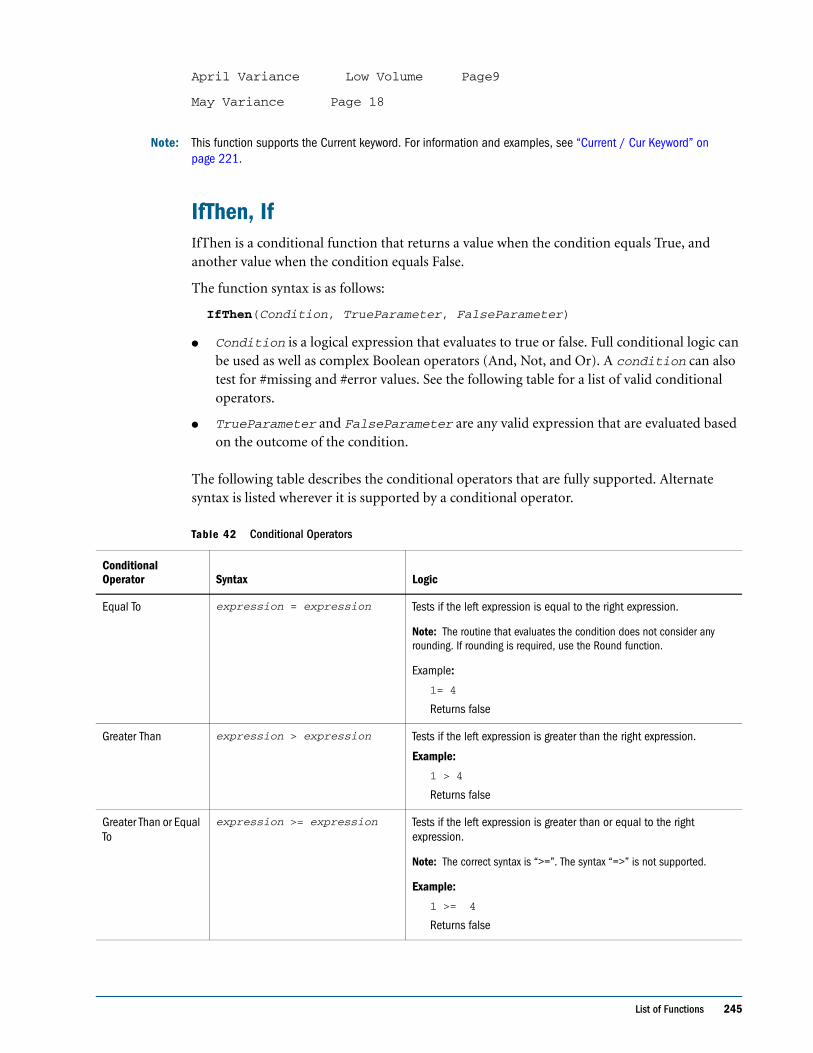
List of Functions 245
April Variance Low Volume Page9
May Variance Page 18
Note: This function supports the Current keyword. For information and examples, see “Current / Cur Keyword” on page 221.
IfThen, IfIfThen is a conditional function that returns a value when the condition equals True, and another value when the condition equals False.
The function syntax is as follows:
IfThen(Condition, TrueParameter, FalseParameter)
● Condition is a logical expression that evaluates to true or false. Full conditional logic can be used as well as complex Boolean operators (And, Not, and Or). A condition can also test for #missing and #error values. See the following table for a list of valid conditional operators.
● TrueParameter and FalseParameter are any valid expression that are evaluated based on the outcome of the condition.
The following table describes the conditional operators that are fully supported. Alternate syntax is listed wherever it is supported by a conditional operator.
Table 42 Conditional Operators
Conditional Operator Syntax Logic
Equal To expression = expression Tests if the left expression is equal to the right expression.
Note: The routine that evaluates the condition does not consider any rounding. If rounding is required, use the Round function.
Example:
1= 4
Returns false
Greater Than expression > expression Tests if the left expression is greater than the right expression.
Example:
1 > 4
Returns false
Greater Than or Equal To
expression >= expression Tests if the left expression is greater than or equal to the right expression.
Note: The correct syntax is “>=”. The syntax “=>” is not supported.
Example:
1 >= 4
Returns false
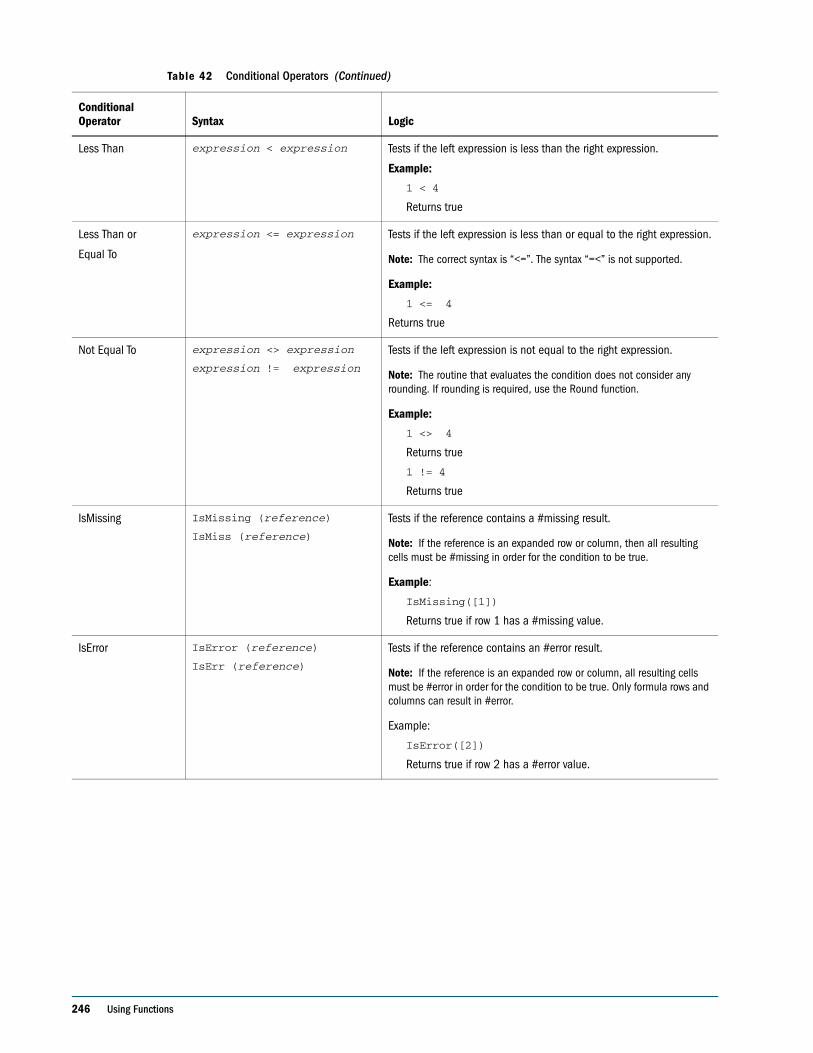
246 Using Functions
Less Than expression < expression Tests if the left expression is less than the right expression.
Example:
1 < 4
Returns true
Less Than or
Equal To
expression <= expression Tests if the left expression is less than or equal to the right expression.
Note: The correct syntax is “<=”. The syntax “=<” is not supported.
Example:
1 <= 4
Returns true
Not Equal To expression <> expression
expression != expression
Tests if the left expression is not equal to the right expression.
Note: The routine that evaluates the condition does not consider any rounding. If rounding is required, use the Round function.
Example:
1 <> 4
Returns true
1 != 4
Returns true
IsMissing IsMissing (reference)
IsMiss (reference)
Tests if the reference contains a #missing result.
Note: If the reference is an expanded row or column, then all resulting cells must be #missing in order for the condition to be true.
Example:
IsMissing([1])
Returns true if row 1 has a #missing value.
IsError IsError (reference)
IsErr (reference)
Tests if the reference contains an #error result.
Note: If the reference is an expanded row or column, all resulting cells must be #error in order for the condition to be true. Only formula rows and columns can result in #error.
Example:
IsError([2])
Returns true if row 2 has a #error value.
Table 42 Conditional Operators (Continued)
Conditional Operator Syntax Logic
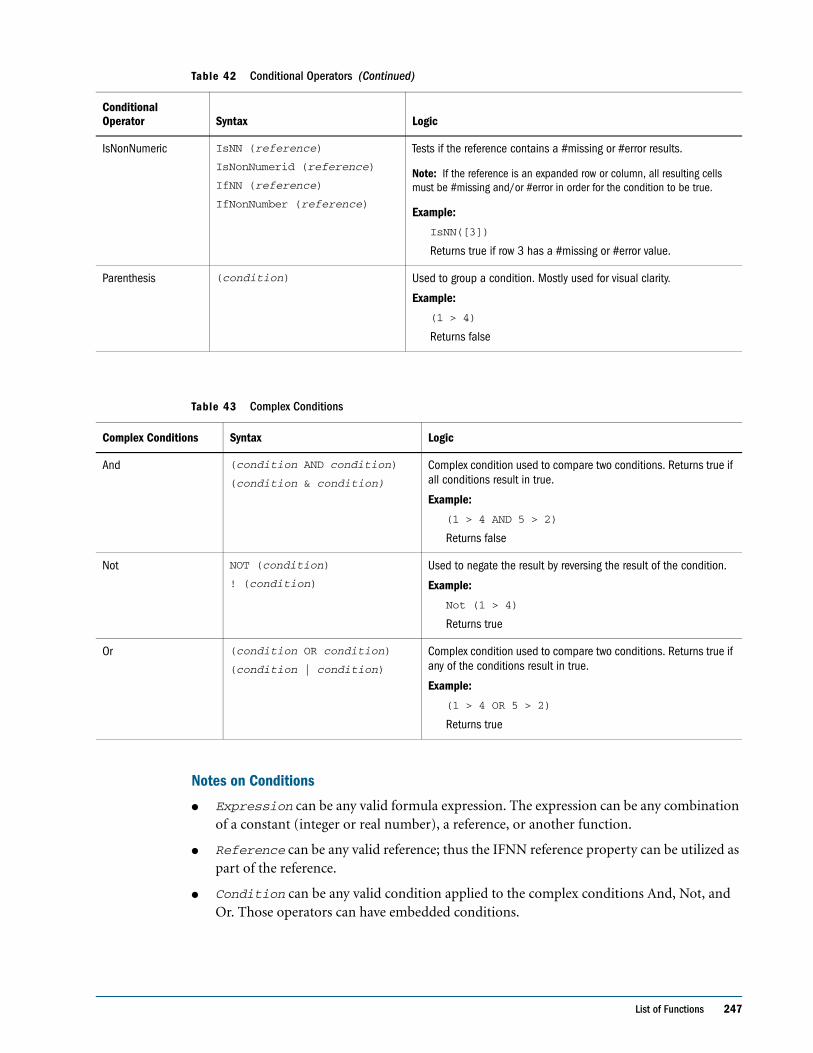
List of Functions 247
Notes on Conditions
● Expression can be any valid formula expression. The expression can be any combination of a constant (integer or real number), a reference, or another function.
● Reference can be any valid reference; thus the IFNN reference property can be utilized as part of the reference.
● Condition can be any valid condition applied to the complex conditions And, Not, and Or. Those operators can have embedded conditions.
IsNonNumeric IsNN (reference)
IsNonNumerid (reference)
IfNN (reference)
IfNonNumber (reference)
Tests if the reference contains a #missing or #error results.
Note: If the reference is an expanded row or column, all resulting cells must be #missing and/or #error in order for the condition to be true.
Example:
IsNN([3])
Returns true if row 3 has a #missing or #error value.
Parenthesis (condition) Used to group a condition. Mostly used for visual clarity.
Example:
(1 > 4)
Returns false
Table 43 Complex Conditions
Complex Conditions Syntax Logic
And (condition AND condition)
(condition & condition)
Complex condition used to compare two conditions. Returns true if all conditions result in true.
Example:
(1 > 4 AND 5 > 2)
Returns false
Not NOT (condition)
! (condition)
Used to negate the result by reversing the result of the condition.
Example:
Not (1 > 4)
Returns true
Or (condition OR condition)
(condition | condition)
Complex condition used to compare two conditions. Returns true if any of the conditions result in true.
Example:
(1 > 4 OR 5 > 2)
Returns true
Table 42 Conditional Operators (Continued)
Conditional Operator Syntax Logic
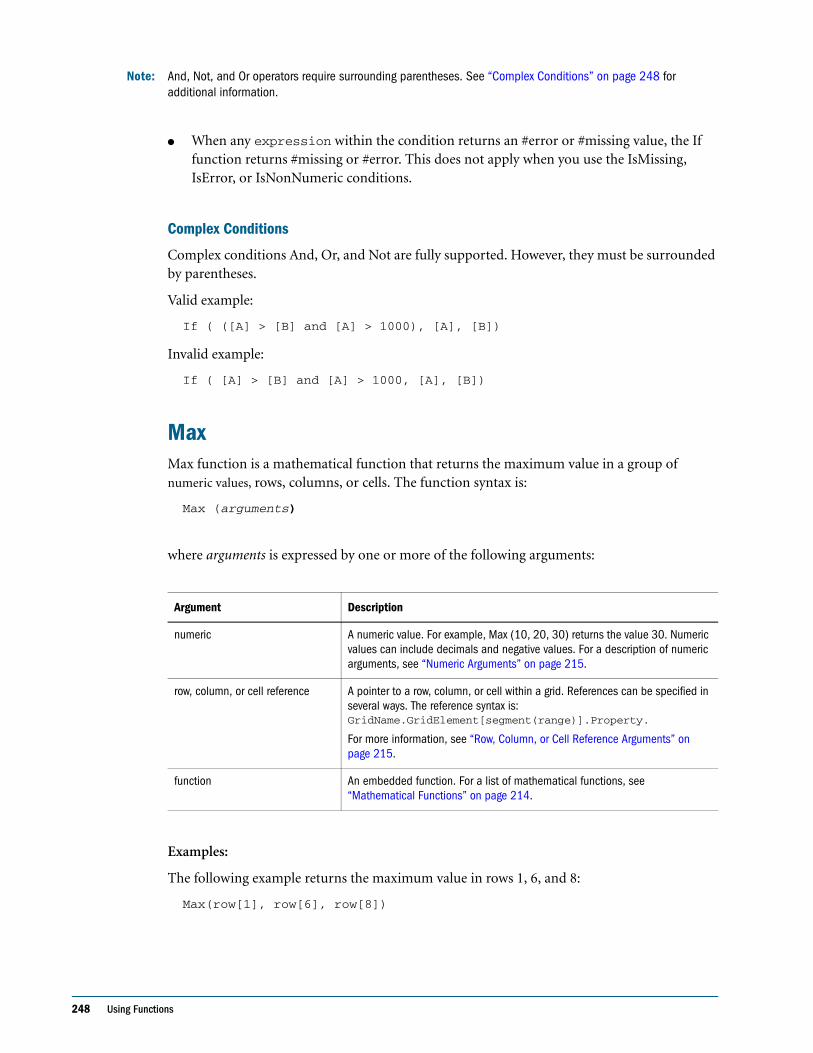
248 Using Functions
Note: And, Not, and Or operators require surrounding parentheses. See “Complex Conditions” on page 248 for additional information.
● When any expression within the condition returns an #error or #missing value, the If function returns #missing or #error. This does not apply when you use the IsMissing, IsError, or IsNonNumeric conditions.
Complex Conditions
Complex conditions And, Or, and Not are fully supported. However, they must be surrounded by parentheses.
Valid example:
If ( ([A] > [B] and [A] > 1000), [A], [B])
Invalid example:
If ( [A] > [B] and [A] > 1000, [A], [B])
MaxMax function is a mathematical function that returns the maximum value in a group of numeric values, rows, columns, or cells. The function syntax is:
Max (arguments)
where arguments is expressed by one or more of the following arguments:
Examples:
The following example returns the maximum value in rows 1, 6, and 8:
Max(row[1], row[6], row[8])
Argument Description
numeric A numeric value. For example, Max (10, 20, 30) returns the value 30. Numeric values can include decimals and negative values. For a description of numeric arguments, see “Numeric Arguments” on page 215.
row, column, or cell reference A pointer to a row, column, or cell within a grid. References can be specified in several ways. The reference syntax is: GridName.GridElement[segment(range)].Property.
For more information, see “Row, Column, or Cell Reference Arguments” on page 215.
function An embedded function. For a list of mathematical functions, see “Mathematical Functions” on page 214.
List of Functions 249
The following example calculates the maximum of the sums of aggregate rows:
Max(row[1].sum, row[2].sum, row[3].sum)
MemberAliasThis function is available only with Analytic Services or Planning Details as the database connection.
MemberAlias is a text function. Based on the syntax used, it returns the alias of the member assigned to a dimension in the row, column, page, or Point of View (POV).
● The following syntax returns the alias of a row heading, column heading or page. The syntax can be deployed from any heading cell, text cell or text box object and can reference any grid in a current report.
<<MemberAlias(“GridName“, Row/Col/Page, “DimName“)>>
● The following syntax returns the alias in a row heading, column heading, or page. The syntax can be deployed from any row, column or page heading in a grid that is designated as a custom heading. To designate a custom heading, click the page, row heading or column heading, then select Custom Heading on the property sheet. You can add the function in the space provided below the custom heading.
<<MemberAlias(“DimName“)>>
● The following syntax returns the alias of a grid or user POV. The syntax can be deployed from any text cell or text box object and can reference any grid and corresponding POV in a current report.
<<MemberAlias(“GridName“, “POV DimName“)>>
where:
● GridName is the name of the grid.
● Row/Col/Page is the numeric identifier of the row, the alphabetical identifier of the column, or the numeric identifier of the page.
● DimName is the name of a dimension in the grid row, column, or page.
● POV DimName is the name of the dimension on the grid or user POV.
Example:
The following examples yield the alias Diet Root Beer, which is the alias that is assigned to the Product dimension in Grid1, column A:
<<MemberAlias("Grid1", A, "Product")>>
<<MemberAlias(current, A, "Product")>>
The following examples yields the alias for the Year dimension. The syntax is placed on the grid’s custom heading:
<<MemberAlias("Year")>>
<<MemberAlias(current)>>
250 Using Functions
The following examples yields the alias for the Scenario dimension for the POV associated with Grid1:
<<MemberAlias("Grid1", "Scenario")>>
<<MemberAlias(current, "Scenario")>>
Note: This function supports the Current keyword when used in a grid (not text box object). For information and examples, see “Current / Cur Keyword” on page 221.
MemberDescriptionThis function is available only with Financial Management as the database connection.
MemberDescription is a text function. Based on the syntax used, it returns the description of the member assigned to a dimension in the row, column, page, or Point of View (POV).
● The following syntax returns the description of a row heading, column heading or page. The syntax can be deployed from any heading cell, text cell or text box object and can reference any grid in a current report.
<<MemberDescription("GridName", Row/Col/Page, "DimName")>>
● The following syntax returns the description in a row heading, column heading, or page. The syntax can be deployed from any row, column or page heading in a grid that is designated as a custom heading. To designate a custom heading, click the page, row heading or column heading, then select Custom Heading on the property sheet. You can add the function in the space provided below the custom heading.
<<MemberDescription("DimName")>>
● The following syntax returns the description of a grid or user POV. The syntax can be deployed from any text cell or text box object and can reference any grid and corresponding POV in a current report.
<<MemberDescription("GridName", "POV DimName")>>
where:
● GridName is the name of the grid.
● Row/Col/Page is the numeric identifier of the row, the alphabetical identifier of the column, or the numeric identifier of the page.
● DimName is the name of a dimension in the grid row, column, or page.
● POV DimName is the name of the dimension on the grid or user POV.
Example:
The following examples yield the description that is assigned to the Product dimension in Grid1, column A:
<<MemberDescription("Grid1", A, "Product")>>
<<MemberDescription(current, A, "Product")>>
List of Functions 251
The following examples yields the description for the Year dimension. The syntax is placed on the grid’s custom heading:
<<MemberDescription(“Year”)>>
<<MemberDescription(Current)>>
The following examples yields the description for the Scenario dimension for the POV associated with Grid1:
<<MemberDescription(“Grid1”, “Scenario”)>>
<<MemberDescription(current, “Scenario”)>>
Note: This function supports the Current keyword when used in a grid (not text box object). For information and examples, see “Current / Cur Keyword” on page 221.
MemberNameMemberName is a text function. Based on the syntax used, it returns the name of the member assigned to a dimension in the row, column, page, or Point of View (POV).
● The following syntax returns the name of a row heading, column heading or page. The syntax can be deployed from any heading cell, text cell or text box object and can reference any grid in a current report.
<<MemberName(“GridName”, Row/Col/Page, “DimName“)>>
● The following syntax returns the name in a row heading, column heading, or page. The syntax can be deployed from any row, column or page heading in a grid that is designated as a custom heading. To designate a custom heading, click the page, row heading or column heading, then select Custom Heading on the property sheet. You can add the function in the space provided below the custom heading.
<<MemberName("DimName")>>
● The following syntax returns the name of a grid or user POV. The syntax can be deployed from any text cell or text box object and can reference any grid and corresponding POV in a current report.
<<MemberName(“GridName“, “POV DimName“)>>
where:
● GridName is the name of the grid.
● Row/Col/Page is the numeric identifier of the row, the alphabetical identifier of the column, or the numeric identifier of the page.
● DimName is the name of a dimension in the grid row, column, or page.
● POV DimName is the name of the dimension on the grid or user POV.
Example:
252 Using Functions
The following examples yield the name that is assigned to the Product dimension in Grid1, column A:
<<MemberName("Grid1", A, "Product")>>
<<MemberName(current, A, "Product")>>
The following example yields the name for the Year dimension. The syntax is placed on the grid’s custom heading:
<<MemberName(“Year”)>>
The following examples yields the name for the Scenario dimension for the POV associated with Grid1:
<<MemberName("Grid1", "Scenario")>>
<<MemberName(current, "Scenario")>>
Note: This function supports the Current keyword when used in a grid (not text box object). For information and examples, see “Current / Cur Keyword” on page 221.
MemberPropertyThis function is applicable to Planning Details, Analytic Services, and SAP BW database connections.
MemberProperty is a text function. Based on the syntax used, it returns the member property value of a dimension in the row, column, page, or Point of View (POV). You can use this function to display a member property in a text row or column.
● The following syntax returns the member property of a row heading, column heading or page. The syntax can be deployed from any heading cell, text cell or text box object and can reference any grid in a current report.
<<MemberProperty("GridName", Row/Col/Page, DimName, Property)>>
● The following syntax returns the member property in a row heading, column heading, or page. The syntax can be deployed from any row, column or page heading in a grid that is designated as a custom heading. To designate a custom heading, click the page, row heading or column heading, then select Custom Heading on the property sheet. You can add the function in the space provided below the custom heading.
<<MemberProperty("DimName", Property)>>
● The following syntax returns the member property of a grid or user POV. The syntax can be deployed from any text cell or text box object and can reference any grid and corresponding POV in a current report.
<<MemberProperty("GridName", POV DimName, Property)>>
where:
● GridName is the name of the grid.
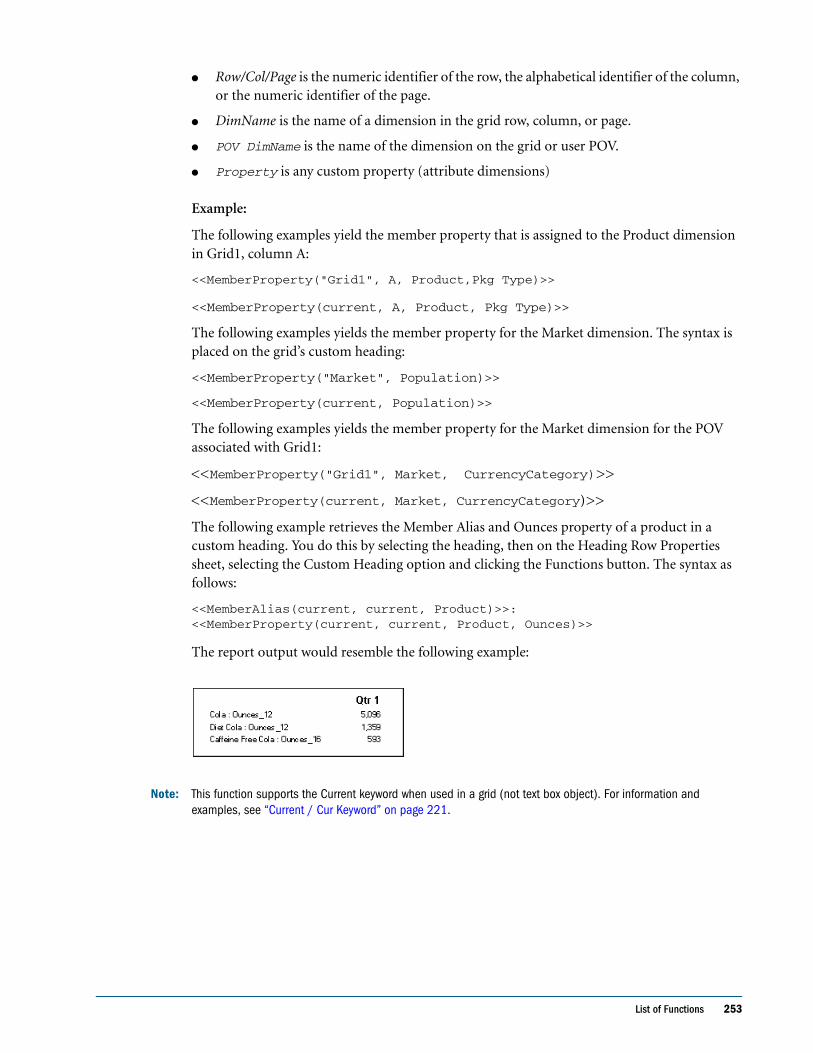
List of Functions 253
● Row/Col/Page is the numeric identifier of the row, the alphabetical identifier of the column, or the numeric identifier of the page.
● DimName is the name of a dimension in the grid row, column, or page.
● POV DimName is the name of the dimension on the grid or user POV.
● Property is any custom property (attribute dimensions)
Example:
The following examples yield the member property that is assigned to the Product dimension in Grid1, column A:
<<MemberProperty("Grid1", A, Product,Pkg Type)>>
<<MemberProperty(current, A, Product, Pkg Type)>>
The following examples yields the member property for the Market dimension. The syntax is placed on the grid’s custom heading:
<<MemberProperty("Market", Population)>>
<<MemberProperty(current, Population)>>
The following examples yields the member property for the Market dimension for the POV associated with Grid1:
<<MemberProperty("Grid1", Market, CurrencyCategory)>>
<<MemberProperty(current, Market, CurrencyCategory)>>
The following example retrieves the Member Alias and Ounces property of a product in a custom heading. You do this by selecting the heading, then on the Heading Row Properties sheet, selecting the Custom Heading option and clicking the Functions button. The syntax as follows:
<<MemberAlias(current, current, Product)>>: <<MemberProperty(current, current, Product, Ounces)>>
The report output would resemble the following example:
Note: This function supports the Current keyword when used in a grid (not text box object). For information and examples, see “Current / Cur Keyword” on page 221.
254 Using Functions
MemberQualifiedNameMemberQualifiedName is a text function for use with Analytic Services data sources. Based on the syntax used, it returns the qualified name of a non unique member assigned to a dimension in the row, column, page, or Point of View (POV). A nonentity member is a child of multiple parents.
Note: This function is supported only for Analytic Services 9.0 or later releases.
For example, if a member named 100 that is a child of the Product1 member and the Product 2 member, then 100 is a non unique member name. The MemberQualifiedName function shows the qualified names in reports. The qualified member names in this example are [Product1].[100] and [Product2].[100].
● The following syntax returns the name of a row heading, column heading or page. The syntax can be deployed from any heading cell, text cell or text box object and can reference any grid in a current report.
<<MemberQualifiedName(“GridName”, Row/Col/Page, “DimName“)>>
● The following syntax returns the qualified name in a row heading, column heading, or page. The syntax can be deployed from any row, column or page heading in a grid that is designated as a custom heading. To designate a custom heading, click the page, row heading or column heading, then select Custom Heading on the property sheet. You can add the function in the space provided below the custom heading.
<<MemberQualifiedName("DimName")>>
● The following syntax returns the name of a grid or user POV. The syntax can be deployed from any text cell or text box object and can reference any grid and corresponding POV in a current report.
<<MemberQualfiedName(“GridName“, “POV DimName“)>>
where:
● GridName is the name of the grid.
● Row/Col/Page is the numeric identifier of the row, the alphabetical identifier of the column, or the numeric identifier of the page.
● DimName is the name of a dimension in the grid row, column, or page.
● POV DimName is the name of the dimension on the grid or user POV.
Example:
The following examples yield the qualified non unique name that is assigned to a the Product dimension in Grid1, column A:
<<MemberQualifiedName("Grid1", A, "Product")>>
<<MemberQualifiedName(current, A, "Product")>>
List of Functions 255
The following examples yields the name for the Year dimension. The syntax is placed on the grid’s custom heading:
<<MemberQualifiedName("Year")>>
The following examples yields the qualified non unique name for the Scenario dimension for the POV associated with Grid1:
<<MemberQualifiedName("Grid1", "Scenario")>>
<<MemberQualifiedName(current, "Scenario")>>
Note: This function supports the Current keyword when used in a grid (not text box object). For information and examples, see “Current / Cur Keyword” on page 221.
MinMin is a mathematical function that returns the minimum value in a group of numeric values,
rows, columns, or cells. The function syntax is as follows:
Min (arguments)
where arguments is expressed by one or more of the following arguments:
Examples:
The following example returns the minimum value in rows 1, 6, and 8:
Min (row[1], row[6], row[8])
The following example calculates the minimum of the sums of aggregate rows:
Min(row[1].sum, row[2].sum, row[3].sum)
ModMod is a mathematical function that returns the remainder, or modulus, from a division. The function syntax is:
Argument Description
numeric A numeric value. For example, Min (10, 20, 30) returns the value 10. Numeric values can include decimals and negative values. For a description of numeric arguments, see “Numeric Arguments” on page 215.
row, column, or cell reference A pointer to a row, column, or cell within a grid. References can be specified in several ways. The reference syntax is: GridName.GridElement[segment(range)].Property
For more information, see “Row, Column, or Cell Reference Arguments” on page 215.
function An embedded function. For a list of mathematical functions, see “Mathematical Functions” on page 214.
256 Using Functions
Mod (arg1, arg2)
where arg2 is the divisor and arg1 and arg2 are expressed by the following arguments:
Example:
The following example divides 10 by 5 and returns the remainder of 0:
Mod (10,5) = 0
PagePage is a text function that returns the current page number of a printed report. You can use this function in a text object to display the current page in a printed report. The function syntax is:
<<Page()>>
Note: The page function works for printed reports only. Online reports display [[PageCount( )]] for the page number.
Example:
If the current page is eight, the following example yields: Page 8.
Page <<PAGE()>>
Note: The page axis on a grid is different from the page number in a printed report.
Argument Description
numeric A numeric value. For example, Mod (6, 4) returns the value 2. Numeric values can include decimals and negative values. For a description of numeric arguments, see “Numeric Arguments” on page 215.
row, column, or cell reference A pointer to a row, column, or cell within a grid. References can be specified in several ways. The reference syntax is: GridName.GridElement[segment(range)].Property
For more information, see “Row, Column, or Cell Reference Arguments” on page 215.
function An embedded function. For a list of mathematical functions, see “Mathematical Functions” on page 214.
List of Functions 257
PageCountPageCount is a text function that returns the total number of pages in a printed report. You can use this function in a text object. The function syntax is:
<<PageCount()>>
Note: The PageCount function works for printed reports only. Online reports display [[PageCount( )]] for the page number.
Example:
If the current page count is 6, the following example yields: The total number of pages are: 6.
The total number of pages is: <<PageCount()>>
PercentOfTotalPercentOfTotal is a mathematical function that returns the result of a numeric value, row, column, or cell divided by another numeric value, row, column, or cell which is multiplied by 100. The function syntax is:
PercentOfTotal (arg1, arg2)
● where arg1 is a component of the running total (arg2). Normally, this is a row or column reference.
● where arg2 is the running total relative to arg1. Normally this is a cell reference containing the grand total.
● arg1 is divided by arg2, with the result multiplied by 100. Arg1 and arg2 are expressed by one or more of the following arguments:
Note: This function requires two arguments.
Examples:
Argument Description
numeric A numeric value. For example, PercentofTotal (100, 20) returns the value 500.
Numeric values can include decimals and negative values. For a description of numeric arguments, see “Numeric Arguments” on page 215.
row, column, or cell reference A pointer to a row, column, or cell within a grid. References can be specified in several ways. The reference syntax is: GridName.GridElement[segment(range)].Property
For more information, see “Row, Column, or Cell Reference Arguments” on page 215.
function An embedded function. For a list of mathematical functions, see “Mathematical Functions” on page 214.
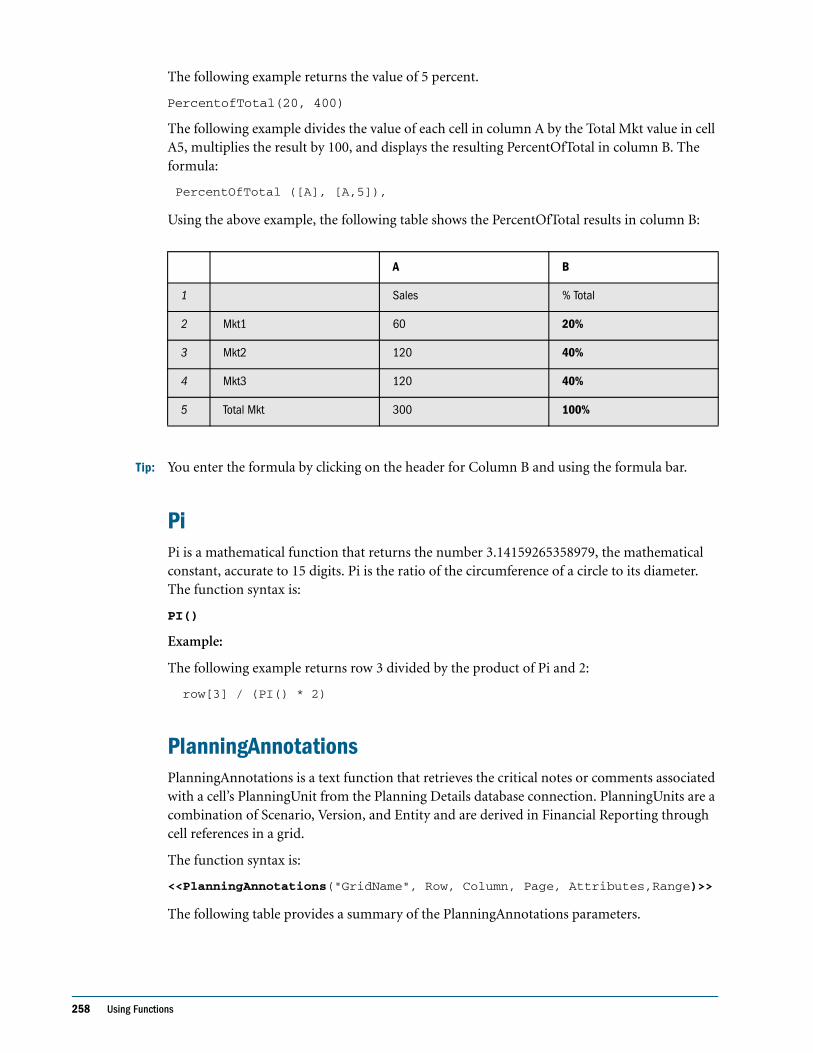
258 Using Functions
The following example returns the value of 5 percent.
PercentofTotal(20, 400)
The following example divides the value of each cell in column A by the Total Mkt value in cell A5, multiplies the result by 100, and displays the resulting PercentOfTotal in column B. The formula:
PercentOfTotal ([A], [A,5]),
Using the above example, the following table shows the PercentOfTotal results in column B:
Tip: You enter the formula by clicking on the header for Column B and using the formula bar.
PiPi is a mathematical function that returns the number 3.14159265358979, the mathematical constant, accurate to 15 digits. Pi is the ratio of the circumference of a circle to its diameter. The function syntax is:
PI()
Example:
The following example returns row 3 divided by the product of Pi and 2:
row[3] / (PI() * 2)
PlanningAnnotationsPlanningAnnotations is a text function that retrieves the critical notes or comments associated with a cell’s PlanningUnit from the Planning Details database connection. PlanningUnits are a combination of Scenario, Version, and Entity and are derived in Financial Reporting through cell references in a grid.
The function syntax is:
<<PlanningAnnotations("GridName", Row, Column, Page, Attributes,Range)>>
The following table provides a summary of the PlanningAnnotations parameters.
A B
1 Sales % Total
2 Mkt1 60 20%
3 Mkt2 120 40%
4 Mkt3 120 40%
5 Total Mkt 300 100%
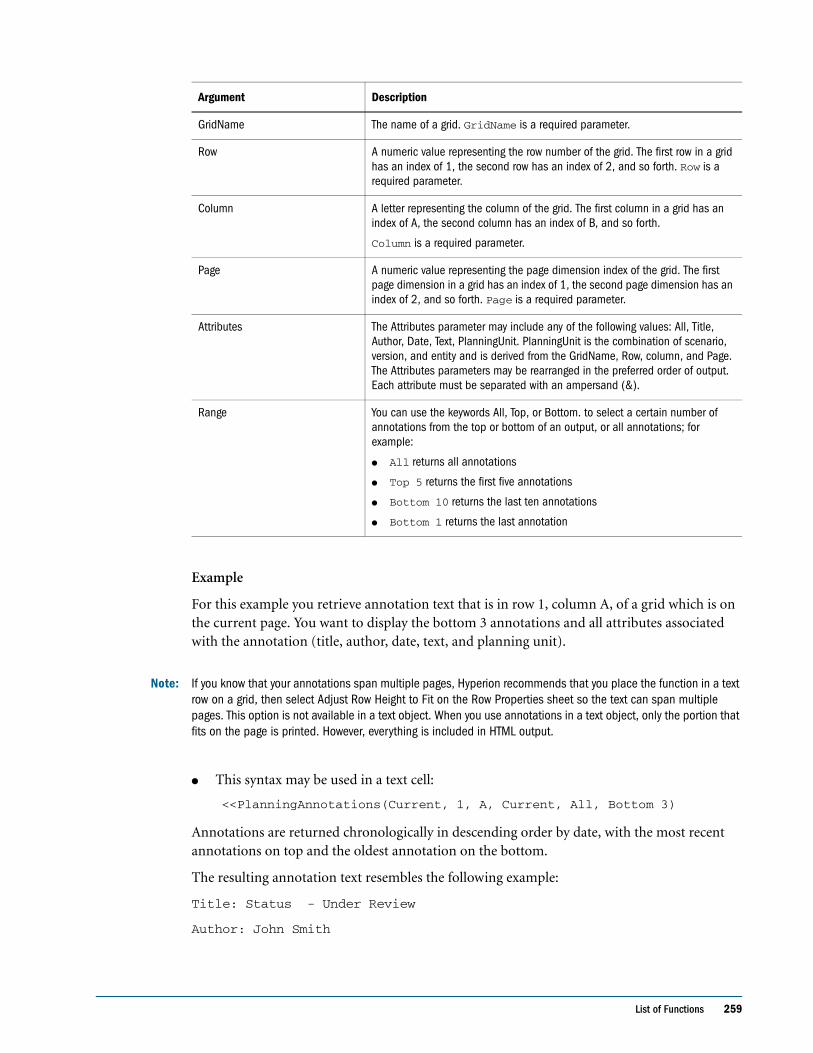
List of Functions 259
Example
For this example you retrieve annotation text that is in row 1, column A, of a grid which is on the current page. You want to display the bottom 3 annotations and all attributes associated with the annotation (title, author, date, text, and planning unit).
Note: If you know that your annotations span multiple pages, Hyperion recommends that you place the function in a text row on a grid, then select Adjust Row Height to Fit on the Row Properties sheet so the text can span multiple pages. This option is not available in a text object. When you use annotations in a text object, only the portion that fits on the page is printed. However, everything is included in HTML output.
● This syntax may be used in a text cell:
<<PlanningAnnotations(Current, 1, A, Current, All, Bottom 3)
Annotations are returned chronologically in descending order by date, with the most recent annotations on top and the oldest annotation on the bottom.
The resulting annotation text resembles the following example:
Title: Status - Under Review
Author: John Smith
Argument Description
GridName The name of a grid. GridName is a required parameter.
Row A numeric value representing the row number of the grid. The first row in a grid has an index of 1, the second row has an index of 2, and so forth. Row is a required parameter.
Column A letter representing the column of the grid. The first column in a grid has an index of A, the second column has an index of B, and so forth.
Column is a required parameter.
Page A numeric value representing the page dimension index of the grid. The first page dimension in a grid has an index of 1, the second page dimension has an index of 2, and so forth. Page is a required parameter.
Attributes The Attributes parameter may include any of the following values: All, Title, Author, Date, Text, PlanningUnit. PlanningUnit is the combination of scenario, version, and entity and is derived from the GridName, Row, column, and Page. The Attributes parameters may be rearranged in the preferred order of output. Each attribute must be separated with an ampersand (&).
Range You can use the keywords All, Top, or Bottom. to select a certain number of annotations from the top or bottom of an output, or all annotations; for example:
● All returns all annotations
● Top 5 returns the first five annotations
● Bottom 10 returns the last ten annotations
● Bottom 1 returns the last annotation
260 Using Functions
Date: Mar 25, 2003 10:32:49 AM
Planning Unit: Budget, 1st Draft, East
Text: Please review and approve
— — — — — — — — — — — — — — — — —
Title: Status - Not Signed Off
Author: Mary Brown
Date: Mar 21, 2003 2:59:11 PM
Planning Unit: Budget, 1st Draft, West
Text: Sorry, Try Again
— — — — — — — — — — — — — — — — —
Title: Status - Under Review
Author: Admin
Date: Mar 21, 2003 2:54:16 PM
Planning Unit: Budget, 1st Draft, South
Text: Please review and approve budget for 1st draft
Note: This function supports the Current keyword when used in a grid (not text box object). For information and examples, see “Current / Cur Keyword” on page 221.
Specifying Demarcations Between AnnotationsThe default demarcation symbols that separate Planning Details unit annotations are a series of em dash characters (—). You can specify another demarcation symbol by configuring the PUASeparator in the fr_repserver.properties file.
Note: This change affects all reports that retrieve Planning Details unit annotations.
➤ To enter new demarcation symbols:
1 Log off Financial Reporting, if not already done so.
2 Locate the fr_repserver.properties file and open it for editing; for example:
C:\Hyperion\BIPlus\lib\fr_repserver.properties
3 Locate PUASeparator and repeat the number of demarcation symbols you want to use; for example:
PUASeparator= — — — — — — — — — — — — — — — — —
4 Save and close the file.
5 Restart the Report Server service, then log on to Financial Reporting.
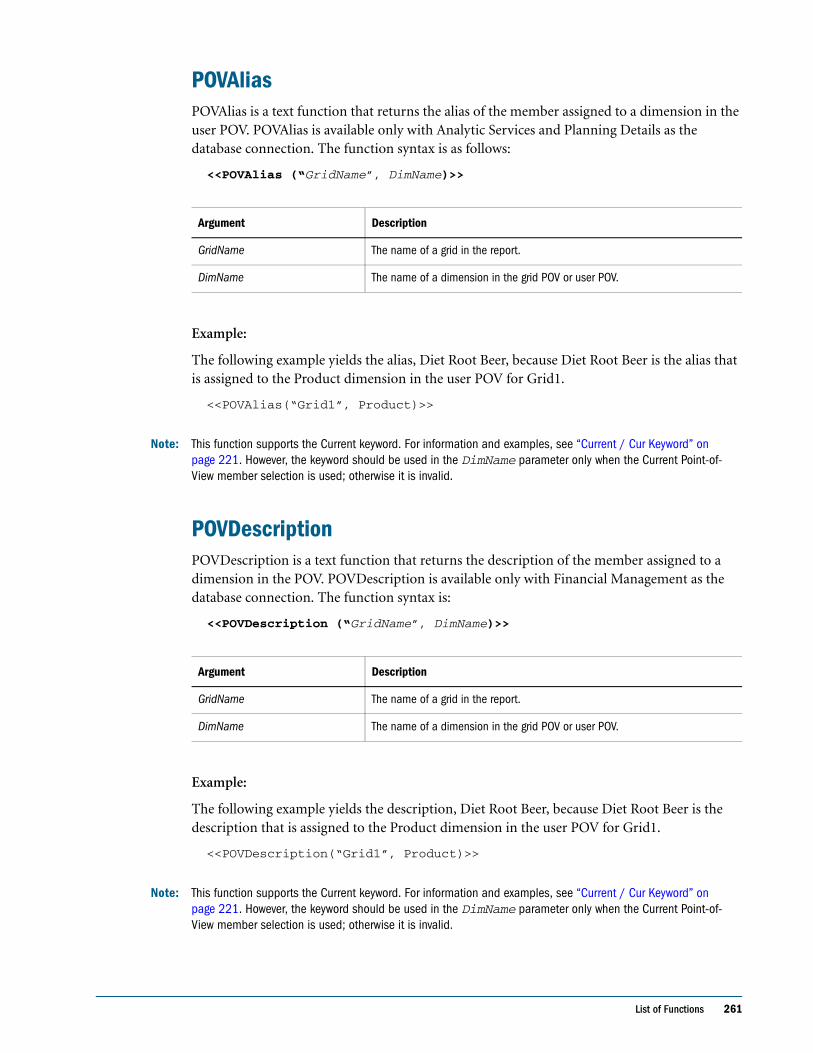
List of Functions 261
POVAliasPOVAlias is a text function that returns the alias of the member assigned to a dimension in the user POV. POVAlias is available only with Analytic Services and Planning Details as the database connection. The function syntax is as follows:
<<POVAlias (“GridName”, DimName)>>
Example:
The following example yields the alias, Diet Root Beer, because Diet Root Beer is the alias that is assigned to the Product dimension in the user POV for Grid1.
<<POVAlias(“Grid1”, Product)>>
Note: This function supports the Current keyword. For information and examples, see “Current / Cur Keyword” on page 221. However, the keyword should be used in the DimName parameter only when the Current Point-of-View member selection is used; otherwise it is invalid.
POVDescriptionPOVDescription is a text function that returns the description of the member assigned to a dimension in the POV. POVDescription is available only with Financial Management as the database connection. The function syntax is:
<<POVDescription (“GridName”, DimName)>>
Example:
The following example yields the description, Diet Root Beer, because Diet Root Beer is the description that is assigned to the Product dimension in the user POV for Grid1.
<<POVDescription(“Grid1”, Product)>>
Note: This function supports the Current keyword. For information and examples, see “Current / Cur Keyword” on page 221. However, the keyword should be used in the DimName parameter only when the Current Point-of-View member selection is used; otherwise it is invalid.
Argument Description
GridName The name of a grid in the report.
DimName The name of a dimension in the grid POV or user POV.
Argument Description
GridName The name of a grid in the report.
DimName The name of a dimension in the grid POV or user POV.

262 Using Functions
POV / POVMemberPOVMember is a text function that returns the member name of the member assigned to a dimension in the POV. The function syntax is:
<<POVMember (“GridName”, DimName)>>
Example:
The following example yields the member, 200, because 200 is the member that is assigned to the Product dimension in the user POV for Grid1.
<<POVMember(“Grid1”,Product)>>
Note: This function supports the Current keyword. For information and examples, see “Current / Cur Keyword” on page 221. However, the keyword should be used in the DimName parameter only when the Current Point-of-View member selection is used; otherwise it is invalid.
ProcessManagementStatusThis function is available only with Financial Management as the database connection.
ProcessManagementStatus is a text function that returns the status of a cell in a Financial Management database connection. The possible process levels are Not Started, First Pass, Submitted, Approved, Published, Not Supported, Review Levels 1 through 10. You can use this function in a text box, a text cell, or a text row or column heading.
The function syntax is as follows:
<<ProcessManagementStatus("GridName", Row, Col, Page)>>
Argument Description
GridName The name of a grid in the report.
DimName The name of a dimension in the user POV.
Argument Description
GridName The name of a Financial Management grid. This value must be enclosed in quotation marks
Row Numeric value representing the row index of the grid. The first row in a grid has an index of 1, the second row has an index of 2, and so forth.
Col A letter representing the column of the grid. The first column in a grid has an index of A, the second column has an index of B, and so forth.
Page A numeric value representing the page dimension index of the grid. The first page dimension in a grid has an index of 1, the second page dimension has an index of 2, and so forth.
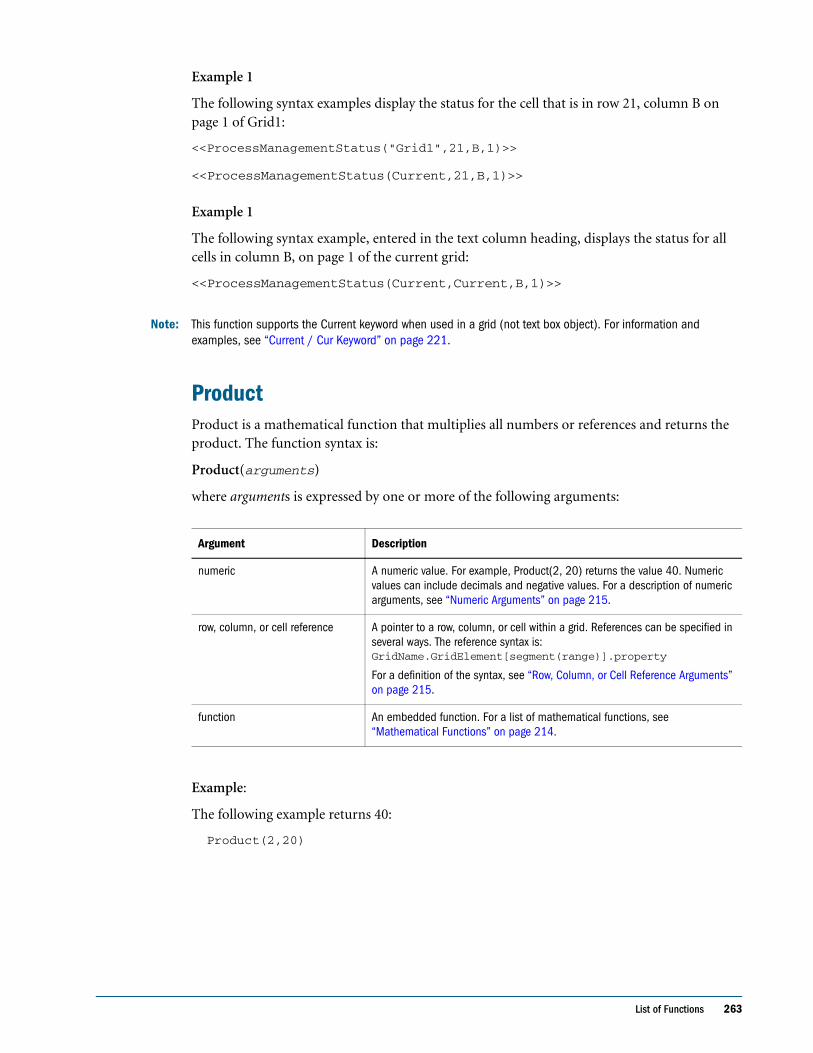
List of Functions 263
Example 1
The following syntax examples display the status for the cell that is in row 21, column B on page 1 of Grid1:
<<ProcessManagementStatus("Grid1",21,B,1)>>
<<ProcessManagementStatus(Current,21,B,1)>>
Example 1
The following syntax example, entered in the text column heading, displays the status for all cells in column B, on page 1 of the current grid:
<<ProcessManagementStatus(Current,Current,B,1)>>
Note: This function supports the Current keyword when used in a grid (not text box object). For information and examples, see “Current / Cur Keyword” on page 221.
ProductProduct is a mathematical function that multiplies all numbers or references and returns the product. The function syntax is:
Product(arguments)
where arguments is expressed by one or more of the following arguments:
Example:
The following example returns 40:
Product(2,20)
Argument Description
numeric A numeric value. For example, Product(2, 20) returns the value 40. Numeric values can include decimals and negative values. For a description of numeric arguments, see “Numeric Arguments” on page 215.
row, column, or cell reference A pointer to a row, column, or cell within a grid. References can be specified in several ways. The reference syntax is: GridName.GridElement[segment(range)].property
For a definition of the syntax, see “Row, Column, or Cell Reference Arguments” on page 215.
function An embedded function. For a list of mathematical functions, see “Mathematical Functions” on page 214.
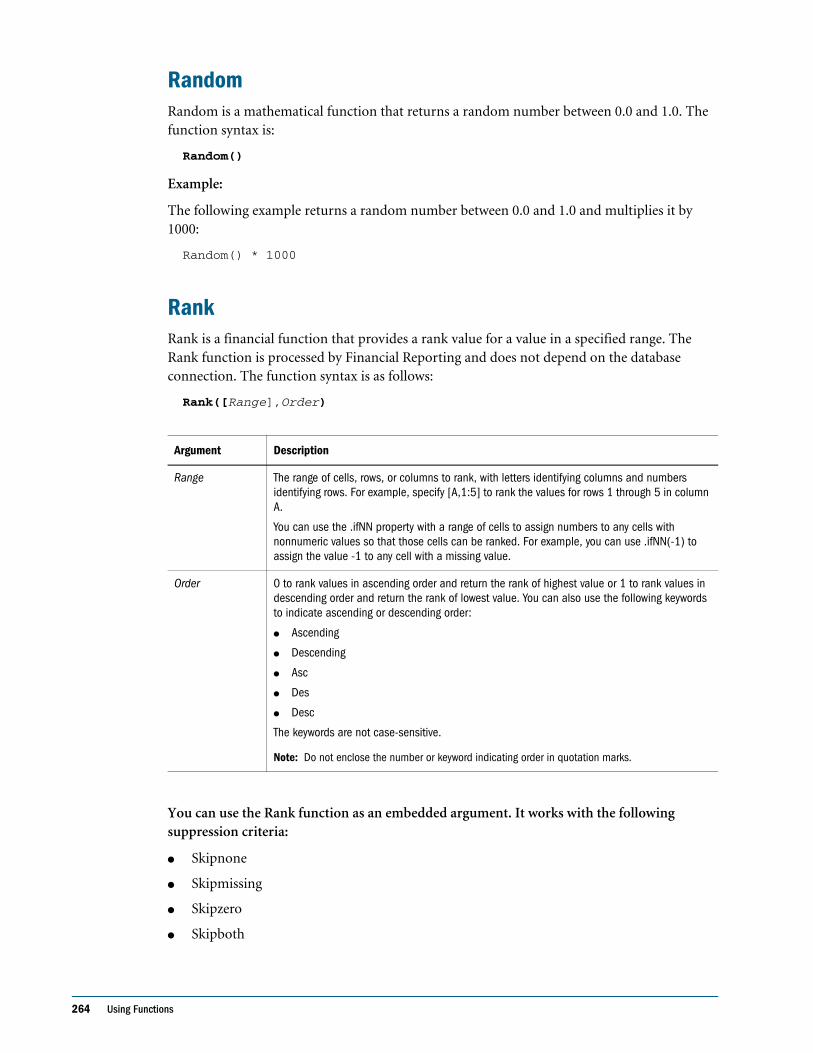
264 Using Functions
RandomRandom is a mathematical function that returns a random number between 0.0 and 1.0. The function syntax is:
Random()
Example:
The following example returns a random number between 0.0 and 1.0 and multiplies it by 1000:
Random() * 1000
RankRank is a financial function that provides a rank value for a value in a specified range. The Rank function is processed by Financial Reporting and does not depend on the database connection. The function syntax is as follows:
Rank([Range],Order)
You can use the Rank function as an embedded argument. It works with the following suppression criteria:
● Skipnone
● Skipmissing
● Skipzero
● Skipboth
Argument Description
Range The range of cells, rows, or columns to rank, with letters identifying columns and numbers identifying rows. For example, specify [A,1:5] to rank the values for rows 1 through 5 in column A.
You can use the .ifNN property with a range of cells to assign numbers to any cells with nonnumeric values so that those cells can be ranked. For example, you can use .ifNN(-1) to assign the value -1 to any cell with a missing value.
Order 0 to rank values in ascending order and return the rank of highest value or 1 to rank values in descending order and return the rank of lowest value. You can also use the following keywords to indicate ascending or descending order:
● Ascending
● Descending
● Asc
● Des
● Desc
The keywords are not case-sensitive.
Note: Do not enclose the number or keyword indicating order in quotation marks.
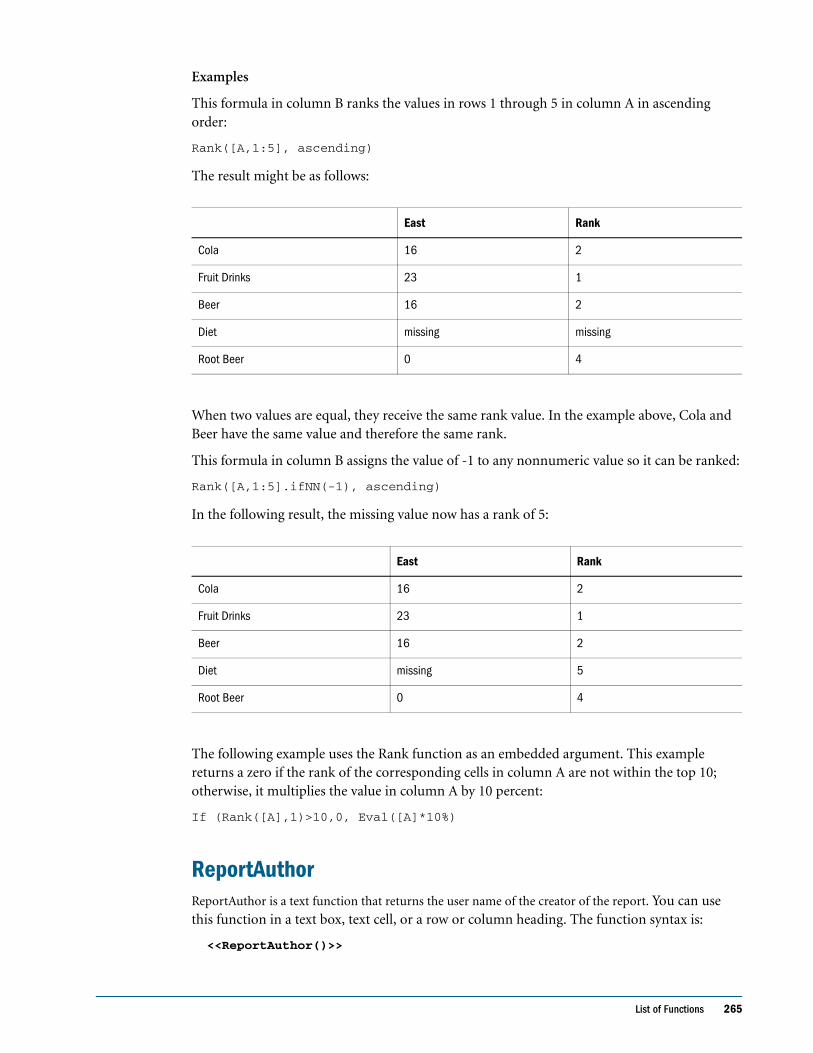
List of Functions 265
Examples
This formula in column B ranks the values in rows 1 through 5 in column A in ascending order:
Rank([A,1:5], ascending)
The result might be as follows:
When two values are equal, they receive the same rank value. In the example above, Cola and Beer have the same value and therefore the same rank.
This formula in column B assigns the value of -1 to any nonnumeric value so it can be ranked:
Rank([A,1:5].ifNN(-1), ascending)
In the following result, the missing value now has a rank of 5:
The following example uses the Rank function as an embedded argument. This example returns a zero if the rank of the corresponding cells in column A are not within the top 10; otherwise, it multiplies the value in column A by 10 percent:
If (Rank([A],1)>10,0, Eval([A]*10%)
ReportAuthorReportAuthor is a text function that returns the user name of the creator of the report. You can use this function in a text box, text cell, or a row or column heading. The function syntax is:
<<ReportAuthor()>>
East Rank
Cola 16 2
Fruit Drinks 23 1
Beer 16 2
Diet missing missing
Root Beer 0 4
East Rank
Cola 16 2
Fruit Drinks 23 1
Beer 16 2
Diet missing 5
Root Beer 0 4
266 Using Functions
Example:
The following example returns the name of the report author:
<<ReportAuthor()>>
ReportCreatedReportCreated is a text function that returns the creation date of the current report. You can use this function in a text box, text cell, or a row or column heading. The function syntax is:
<<ReportCreated( “format” )>>
where format is a list of characters that define the format of the date and time. For a detailed description of date and time formats see Table 41 on page 235.
Note: The date and time format is case-sensitive. ReportCreated returns a value only after the report is saved.
Example:
The following example inserts the report creation date in the body of a report:
<<ReportName()>> - Created on <<ReportCreated(“d-MM-yy”)>>
ReportDescReportDesc is a text function that returns the text description of the current report. You can use this function in a text box, text cell, or a row or column heading. The report description is a report property. The function syntax is:
<<ReportDesc()>>
Example:
The following example inserts a report description in the body of a report:
<<ReportDesc()>>
Note: You can define a report description when you save the report. Afterward, you can change the description changed in the repository or when you save the report again with the Save As command.
ReportFolderReportFolder is a text function that returns the path of the folder where the report is located.You can use this function in a text box, text cell, or a row or column heading.
The function syntax is:
<<Reportfolder()>>
Example:
The following example inserts the path of the folder where the report is located:
List of Functions 267
<<Reportfolder( )>>
The following considerations provide additional information when using ReportFolder:
● The report must be located in a folder other than the root folder. The root folder is not considered a report folder and returns an empty string.
● The report must first be saved to a folder in order to return the correct string. An unsaved report returns an empty string.
● If you open a report containing a ReportFolder function, save it to a new folder, then Print Preview the report, the previous location of the folder is displayed. This is by design for performance reasons. To re-evaluate the report, modify a grid or report object, then Print Preview to see the new folder location.
ReportModifiedReportModified is a text function that returns the date the current report was last modified. You can use this function in a text box, text cell, or a row or column heading. The function syntax is:
<<ReportModified("format")>>
where format is a list of characters enclosed in quotes that define the format of the date and time. For a detailed description of date and time formats, see Table 41 on page 235.
Note: The date and time format is case-sensitive. ReportModified returns a value only after the report is saved.
Example:
The following example inserts the date Jan 19, 2002. That is the date the report was last modified:
Report Modified: <<ReportModified("MMM dd, yyyy")>>
ReportModifiedByReportModifiedBy is a text function that returns the user name of the last user to save the report. You can use this function in a text box, text cell, or a row or column heading. The function syntax is:
<<ReportModifiedBy()>>
Example:
The following example inserts the user name of the last user to save the report:
<<ReportModifiedBy()>>
268 Using Functions
ReportNameReportName is a text function that returns the name of the current report. You can use this function in a text box, text cell, or a row or column heading. The function syntax is:
<<ReportName()>>
Example:
The following example inserts the report name:
<<ReportName( )>>
ReportRunByReportRunBy is a text function that returns the username of the user who is running the report. You can use this function in a text box, text cell, or a row or column heading. The function syntax is:
<<ReportRunBy()>>
Example:
The following example inserts the username of the user who is running the report:
<<ReportRunBy()>>
RoundRound is a mathematical function that rounds a number up or down by the specified digits. The function syntax is:
Round (arg1, integer)
where arg1 is expressed by one or more of the following arguments:
Integer specifies the number of digits to which you want to round the number:
● If integer is greater than zero, the number rounds to the specified number of decimal places.
Argument Description
numeric A numeric value. For example, Round(81.3987,3) returns the value 81.399. Numeric values can include decimals and negative values. For a description of numeric arguments, see “Numeric Arguments” on page 215.
row, column, or cell reference A pointer to a row, column, or cell within a grid. References can be specified in several ways. The reference syntax is: GridName.GridElement[segment(range)].property
For more information, see “Row, Column, or Cell Reference Arguments” on page 215.
function An embedded function. For a list of mathematical functions, see “Mathematical Functions” on page 214.
List of Functions 269
● If integer is zero, the number rounds to the nearest integer.
● If integer is less than zero, the number is rounded to the left of the decimal point.
Examples:
The following example rounds to 3 decimals:
Round(3594.5567,3) = 3594.557
The following example rounds to the nearest integer:
Round(3594.5567,0) = 3595
The following example rounds to the thousands. This is also known as scaling:
Round(3594.5567,-3) = 4000
SqrtSqrt is a mathematical function that returns the square root of a numeric value, row, column, or cell. The syntax for the Sqrt function is:
Sqrt (argument)
where argument is expressed by one of the following arguments:
Example
The following example returns the value of 4:
Sqrt(16)
SumSum is a mathematical function that returns the summation of a group of numeric values, rows, columns, or cells.
The syntax for the Sum function is:
Argument Description
numeric A numeric value. For example, Sqrt(100) returns the value 10. Numeric values can include decimals and negative values. For a description of numeric arguments, see “Numeric Arguments” on page 215.
row, column, or cell reference A pointer to a row, column, or cell within a grid. References can be specified in several ways. The reference syntax is: GridName.GridElement[segment(range)].property
For more information, see “Row, Column, or Cell Reference Arguments” on page 215.
function An embedded function. For a list of mathematical functions, see “Mathematical Functions” on page 214.
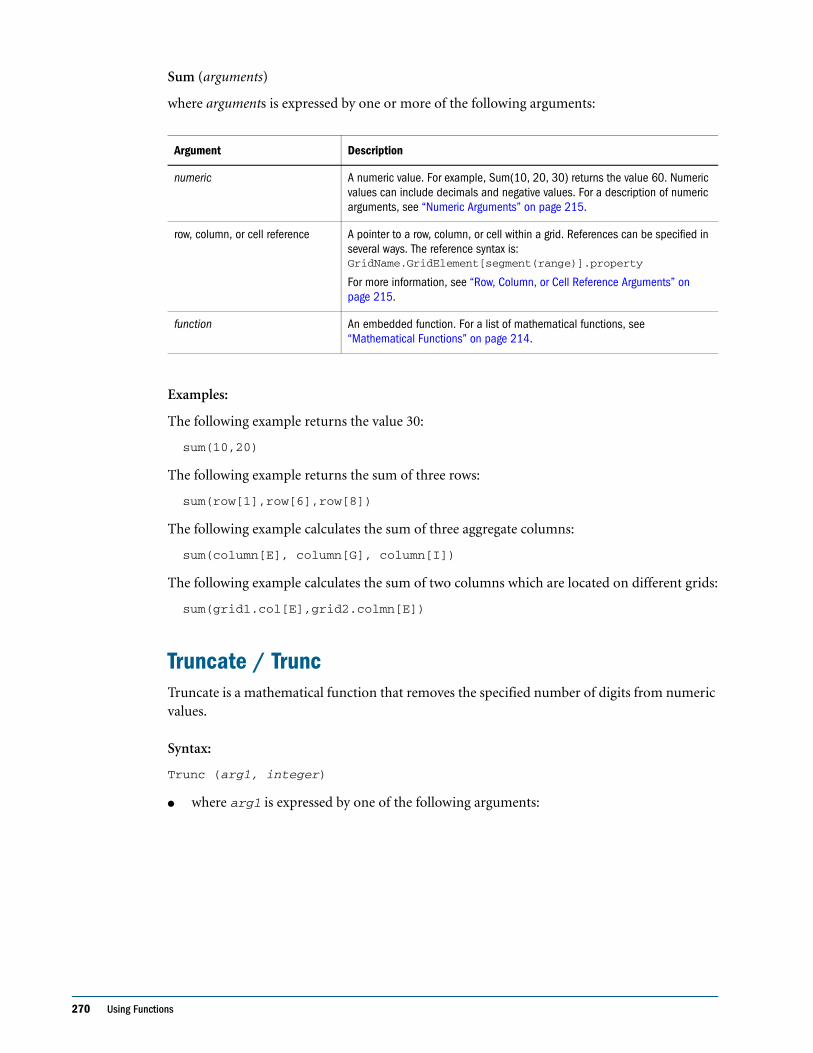
270 Using Functions
Sum (arguments)
where arguments is expressed by one or more of the following arguments:
Examples:
The following example returns the value 30:
sum(10,20)
The following example returns the sum of three rows:
sum(row[1],row[6],row[8])
The following example calculates the sum of three aggregate columns:
sum(column[E], column[G], column[I])
The following example calculates the sum of two columns which are located on different grids:
sum(grid1.col[E],grid2.colmn[E])
Truncate / TruncTruncate is a mathematical function that removes the specified number of digits from numeric values.
Syntax:
Trunc (arg1, integer)
● where arg1 is expressed by one of the following arguments:
Argument Description
numeric A numeric value. For example, Sum(10, 20, 30) returns the value 60. Numeric values can include decimals and negative values. For a description of numeric arguments, see “Numeric Arguments” on page 215.
row, column, or cell reference A pointer to a row, column, or cell within a grid. References can be specified in several ways. The reference syntax is: GridName.GridElement[segment(range)].property
For more information, see “Row, Column, or Cell Reference Arguments” on page 215.
function An embedded function. For a list of mathematical functions, see “Mathematical Functions” on page 214.

List of Functions 271
● where integer specifies the number of digits you want to remove:
❍ A positive integer determines the number of significant digits that remain to the right of the decimal point.
❍ A zero (0) integer returns the integer located to the left of the decimal point.
❍ A negative integer indicates the number of significant digits that are truncated to the left of the decimal point.
Examples:
The following statement uses a positive integer of 2. The first two digits to the right of the decimal point remain, and the following digit is removed:
Trunc(234.567, 2) = 234.56
The following statement uses a zero (0) integer. All digits to the right of the decimal point are removed:
Trunc(234.567, 0) = 234
The following statement uses a negative integer of -2. All digits to the right of the decimal point are removed and the last 2 digits of the integer are truncated.
Trunc(234.567, -2) = 200
Note: Formatting previously applied to a cell, column, or row is maintained when you use the Trunc function. The following example shows the results of a Trunc function where the cell value was previously formatted to display three decimal places: Trunc(234.567, 0) = 234.000
Variance / VarVariance is a financial function that evaluates the difference between the specified values based on account type for the current account. For example, for an Income, Flow, Asset, or Balance account, a positive result represents an increase, so the result appears as a positive number. For Expense or Liability accounts, a positive result represents a decrease, so the result appears as a negative number. This function is available for standard Analytic Services, Planning Details, and Financial Management database connections.
Argument Description
numeric A numeric value. For example, 234.567. For a description of numeric arguments, see “Numeric Arguments” on page 215.
row, column, or cell reference A pointer to a row, column, or cell within a grid. References can be specified in several ways. The reference syntax is: GridName.GridElement[segment(range)].property
For more information, see “Row, Column, or Cell Reference Arguments” on page 215.
function An embedded function. For a list of mathematical functions, see “Mathematical Functions” on page 214.
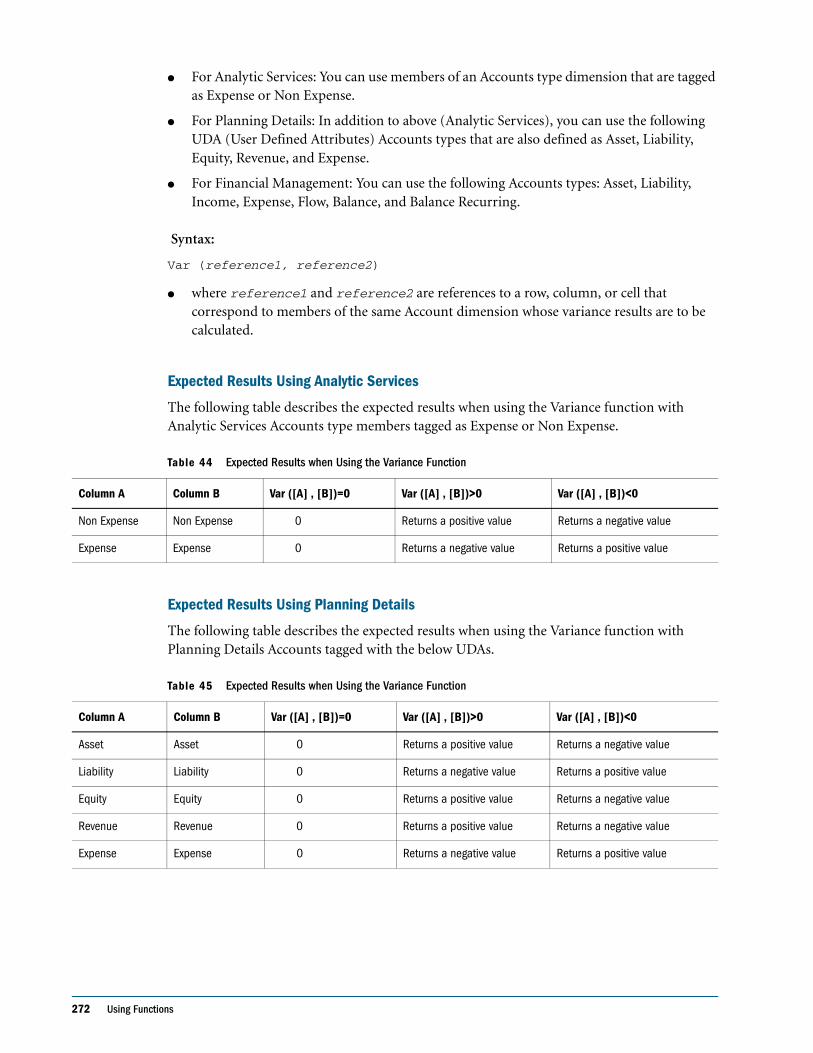
272 Using Functions
● For Analytic Services: You can use members of an Accounts type dimension that are tagged as Expense or Non Expense.
● For Planning Details: In addition to above (Analytic Services), you can use the following UDA (User Defined Attributes) Accounts types that are also defined as Asset, Liability, Equity, Revenue, and Expense.
● For Financial Management: You can use the following Accounts types: Asset, Liability, Income, Expense, Flow, Balance, and Balance Recurring.
Syntax:
Var (reference1, reference2)
● where reference1 and reference2 are references to a row, column, or cell that correspond to members of the same Account dimension whose variance results are to be calculated.
Expected Results Using Analytic Services
The following table describes the expected results when using the Variance function with Analytic Services Accounts type members tagged as Expense or Non Expense.
Expected Results Using Planning Details
The following table describes the expected results when using the Variance function with Planning Details Accounts tagged with the below UDAs.
Table 44 Expected Results when Using the Variance Function
Column A Column B Var ([A] , [B])=0 Var ([A] , [B])>0 Var ([A] , [B])<0
Non Expense Non Expense 0 Returns a positive value Returns a negative value
Expense Expense 0 Returns a negative value Returns a positive value
Table 45 Expected Results when Using the Variance Function
Column A Column B Var ([A] , [B])=0 Var ([A] , [B])>0 Var ([A] , [B])<0
Asset Asset 0 Returns a positive value Returns a negative value
Liability Liability 0 Returns a negative value Returns a positive value
Equity Equity 0 Returns a positive value Returns a negative value
Revenue Revenue 0 Returns a positive value Returns a negative value
Expense Expense 0 Returns a negative value Returns a positive value
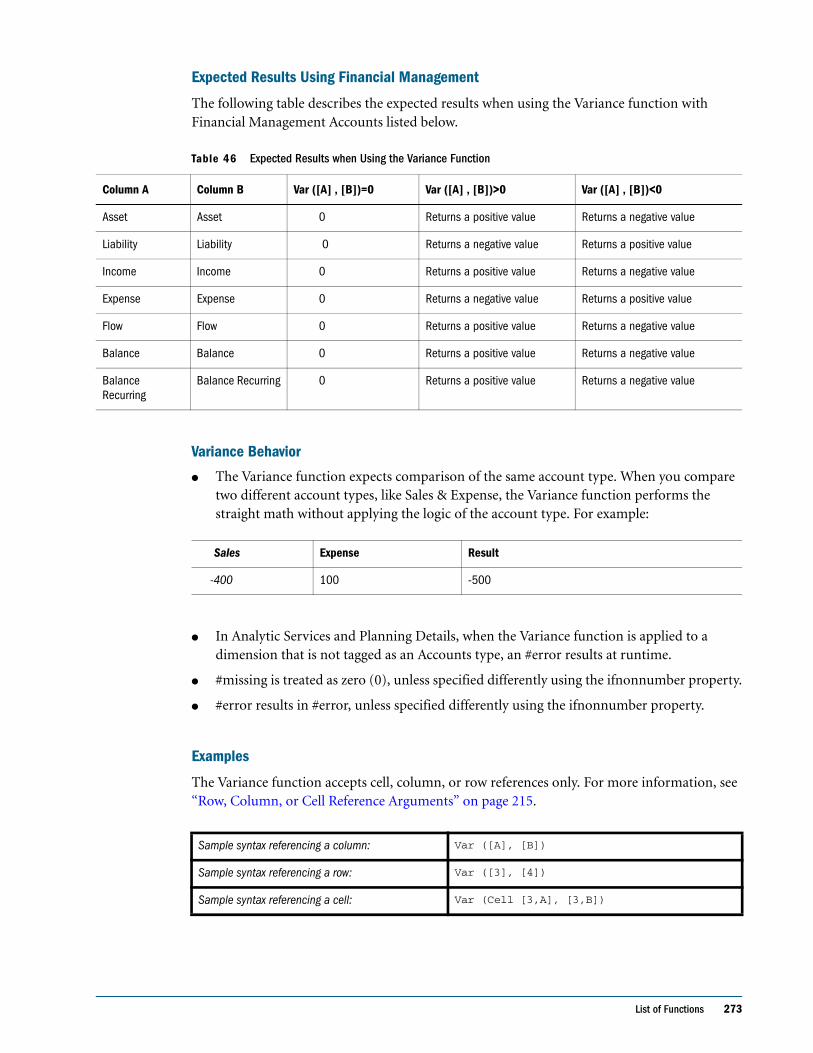
List of Functions 273
Expected Results Using Financial Management
The following table describes the expected results when using the Variance function with Financial Management Accounts listed below.
Variance Behavior
● The Variance function expects comparison of the same account type. When you compare two different account types, like Sales & Expense, the Variance function performs the straight math without applying the logic of the account type. For example:
● In Analytic Services and Planning Details, when the Variance function is applied to a dimension that is not tagged as an Accounts type, an #error results at runtime.
● #missing is treated as zero (0), unless specified differently using the ifnonnumber property.
● #error results in #error, unless specified differently using the ifnonnumber property.
Examples
The Variance function accepts cell, column, or row references only. For more information, see “Row, Column, or Cell Reference Arguments” on page 215.
Table 46 Expected Results when Using the Variance Function
Column A Column B Var ([A] , [B])=0 Var ([A] , [B])>0 Var ([A] , [B])<0
Asset Asset 0 Returns a positive value Returns a negative value
Liability Liability 0 Returns a negative value Returns a positive value
Income Income 0 Returns a positive value Returns a negative value
Expense Expense 0 Returns a negative value Returns a positive value
Flow Flow 0 Returns a positive value Returns a negative value
Balance Balance 0 Returns a positive value Returns a negative value
Balance Recurring
Balance Recurring 0 Returns a positive value Returns a negative value
Sales Expense Result
-400 100 -500
Sample syntax referencing a column: Var ([A], [B])
Sample syntax referencing a row: Var ([3], [4])
Sample syntax referencing a cell: Var (Cell [3,A], [3,B])
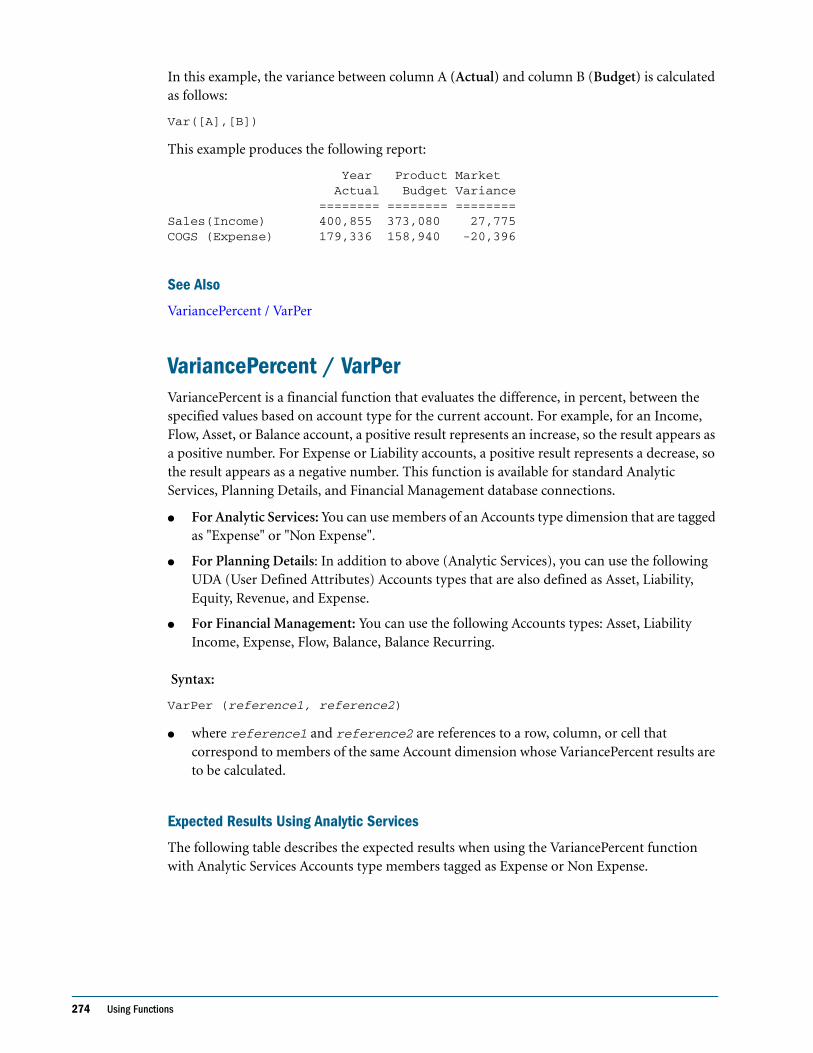
274 Using Functions
In this example, the variance between column A (Actual) and column B (Budget) is calculated as follows:
Var([A],[B])
This example produces the following report:
Year Product Market Actual Budget Variance ======== ======== ======== Sales(Income) 400,855 373,080 27,775 COGS (Expense) 179,336 158,940 -20,396
See Also
VariancePercent / VarPer
VariancePercent / VarPerVariancePercent is a financial function that evaluates the difference, in percent, between the specified values based on account type for the current account. For example, for an Income, Flow, Asset, or Balance account, a positive result represents an increase, so the result appears as a positive number. For Expense or Liability accounts, a positive result represents a decrease, so the result appears as a negative number. This function is available for standard Analytic Services, Planning Details, and Financial Management database connections.
● For Analytic Services: You can use members of an Accounts type dimension that are tagged as "Expense" or "Non Expense".
● For Planning Details: In addition to above (Analytic Services), you can use the following UDA (User Defined Attributes) Accounts types that are also defined as Asset, Liability, Equity, Revenue, and Expense.
● For Financial Management: You can use the following Accounts types: Asset, Liability Income, Expense, Flow, Balance, Balance Recurring.
Syntax:
VarPer (reference1, reference2)
● where reference1 and reference2 are references to a row, column, or cell that correspond to members of the same Account dimension whose VariancePercent results are to be calculated.
Expected Results Using Analytic Services
The following table describes the expected results when using the VariancePercent function with Analytic Services Accounts type members tagged as Expense or Non Expense.
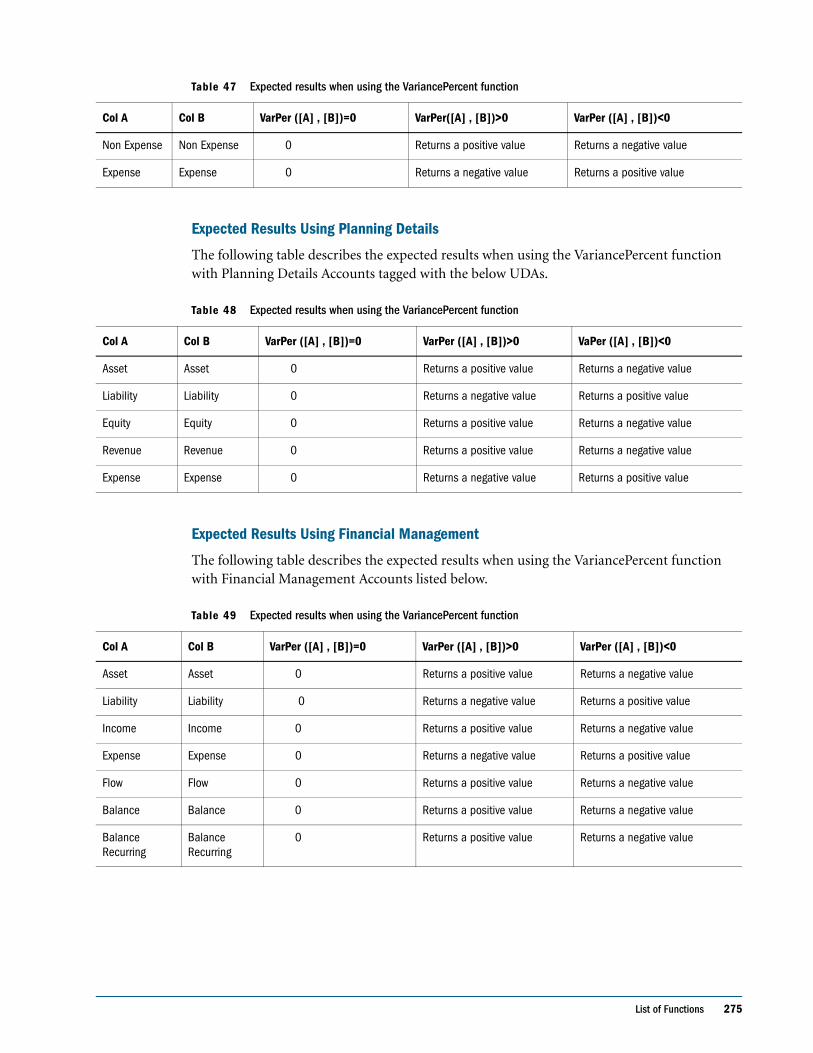
List of Functions 275
Expected Results Using Planning Details
The following table describes the expected results when using the VariancePercent function with Planning Details Accounts tagged with the below UDAs.
Expected Results Using Financial Management
The following table describes the expected results when using the VariancePercent function with Financial Management Accounts listed below.
Table 47 Expected results when using the VariancePercent function
Col A Col B VarPer ([A] , [B])=0 VarPer([A] , [B])>0 VarPer ([A] , [B])<0
Non Expense Non Expense 0 Returns a positive value Returns a negative value
Expense Expense 0 Returns a negative value Returns a positive value
Table 48 Expected results when using the VariancePercent function
Col A Col B VarPer ([A] , [B])=0 VarPer ([A] , [B])>0 VaPer ([A] , [B])<0
Asset Asset 0 Returns a positive value Returns a negative value
Liability Liability 0 Returns a negative value Returns a positive value
Equity Equity 0 Returns a positive value Returns a negative value
Revenue Revenue 0 Returns a positive value Returns a negative value
Expense Expense 0 Returns a negative value Returns a positive value
Table 49 Expected results when using the VariancePercent function
Col A Col B VarPer ([A] , [B])=0 VarPer ([A] , [B])>0 VarPer ([A] , [B])<0
Asset Asset 0 Returns a positive value Returns a negative value
Liability Liability 0 Returns a negative value Returns a positive value
Income Income 0 Returns a positive value Returns a negative value
Expense Expense 0 Returns a negative value Returns a positive value
Flow Flow 0 Returns a positive value Returns a negative value
Balance Balance 0 Returns a positive value Returns a negative value
Balance Recurring
Balance Recurring
0 Returns a positive value Returns a negative value
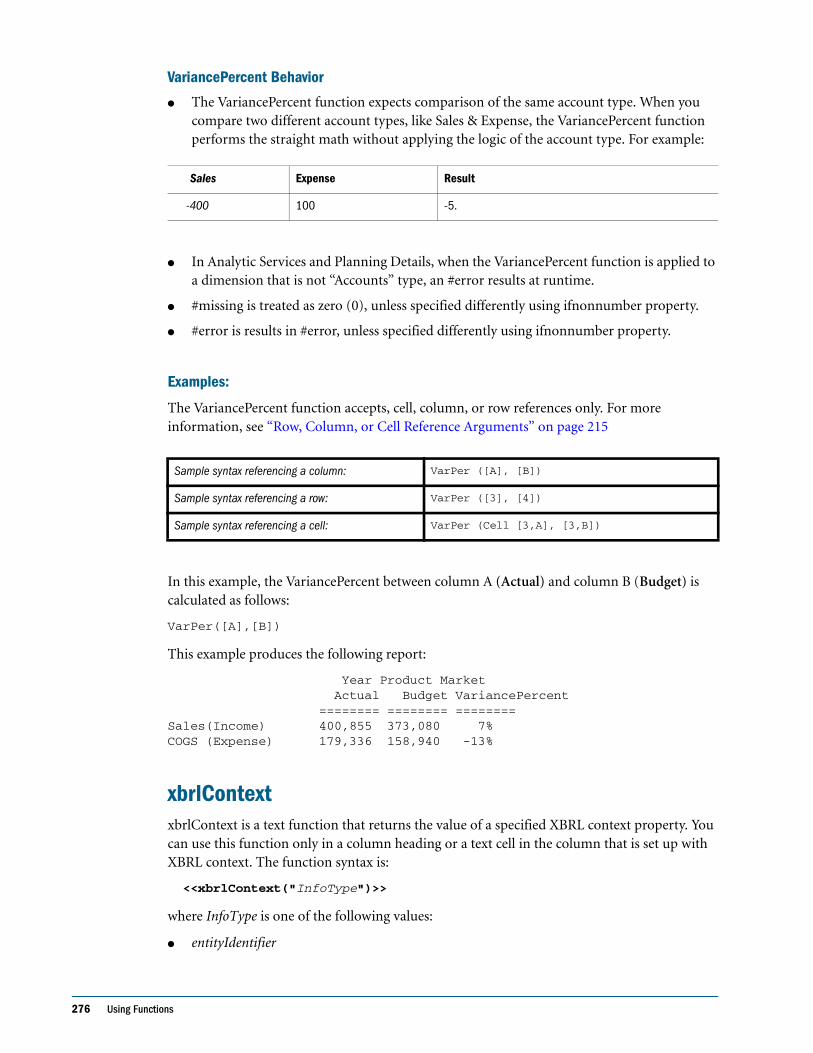
276 Using Functions
VariancePercent Behavior
● The VariancePercent function expects comparison of the same account type. When you compare two different account types, like Sales & Expense, the VariancePercent function performs the straight math without applying the logic of the account type. For example:
● In Analytic Services and Planning Details, when the VariancePercent function is applied to a dimension that is not “Accounts” type, an #error results at runtime.
● #missing is treated as zero (0), unless specified differently using ifnonnumber property.
● #error is results in #error, unless specified differently using ifnonnumber property.
Examples:
The VariancePercent function accepts, cell, column, or row references only. For more information, see “Row, Column, or Cell Reference Arguments” on page 215
In this example, the VariancePercent between column A (Actual) and column B (Budget) is calculated as follows:
VarPer([A],[B])
This example produces the following report:
Year Product Market Actual Budget VariancePercent ======== ======== ======== Sales(Income) 400,855 373,080 7%COGS (Expense) 179,336 158,940 -13%
xbrlContextxbrlContext is a text function that returns the value of a specified XBRL context property. You can use this function only in a column heading or a text cell in the column that is set up with XBRL context. The function syntax is:
<<xbrlContext("InfoType")>>
where InfoType is one of the following values:
● entityIdentifier
Sales Expense Result
-400 100 -5.
Sample syntax referencing a column: VarPer ([A], [B])
Sample syntax referencing a row: VarPer ([3], [4])
Sample syntax referencing a cell: VarPer (Cell [3,A], [3,B])
Mathematical Operators in Expressions 277
● entityScheme
● entitySegment
● unit
● unit2
● unitOperation
● period
● cwa
● precision
● scenario
Example:
The following example inserts the unit description into the column heading for an XBRL context:
<<xbrlContext("unit")>>
xbrlLineItem xbrlLIneItem is a text function that returns the value of a specified XBRL line item property. You can use this function only in a row heading or a text cell in the row that is defined with an XBRL line item. The function syntax is:
<<xbrlLineItem("InfoType")>>
where InfoType is one of the following
● name
● label
● schemaNamespace
● schemaLabel
● schemaShortName
● schemaLocalLocation
Example:
The following example inserts the schema name into the row heading for an XBRL line item:
<<xbrlContext("schemaNamespace")>>
Mathematical Operators in Expressions Operators are symbols that perform arithmetical tasks or comparisons, or refer to ranges of columns, rows, or cells. You use operators in formulas that perform calculations on data rows or columns.
The following table explains the types of operators available in standard formulas:
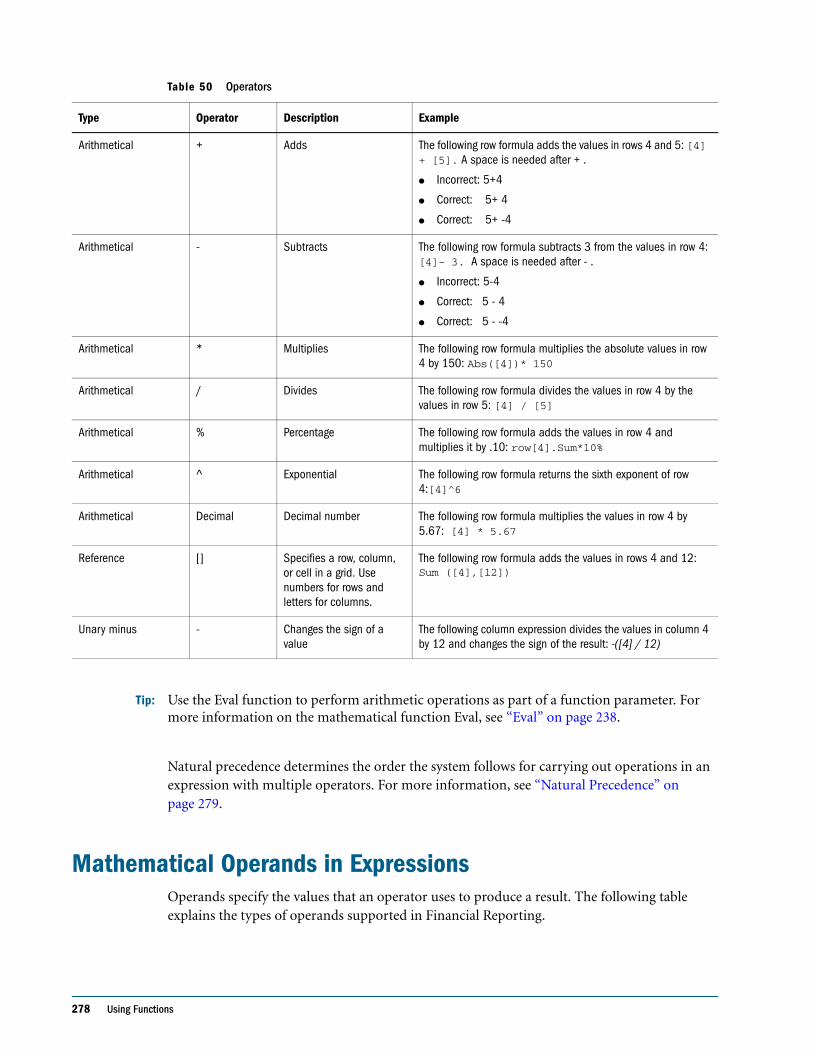
278 Using Functions
Tip: Use the Eval function to perform arithmetic operations as part of a function parameter. For more information on the mathematical function Eval, see “Eval” on page 238.
Natural precedence determines the order the system follows for carrying out operations in an expression with multiple operators. For more information, see “Natural Precedence” on page 279.
Mathematical Operands in Expressions Operands specify the values that an operator uses to produce a result. The following table explains the types of operands supported in Financial Reporting.
Table 50 Operators
Type Operator Description Example
Arithmetical + Adds The following row formula adds the values in rows 4 and 5: [4] + [5]. A space is needed after + .
● Incorrect: 5+4
● Correct: 5+ 4
● Correct: 5+ -4
Arithmetical - Subtracts The following row formula subtracts 3 from the values in row 4: [4]- 3. A space is needed after - .
● Incorrect: 5-4
● Correct: 5 - 4
● Correct: 5 - -4
Arithmetical * Multiplies The following row formula multiplies the absolute values in row 4 by 150: Abs([4])* 150
Arithmetical / Divides The following row formula divides the values in row 4 by the values in row 5: [4] / [5]
Arithmetical % Percentage The following row formula adds the values in row 4 and multiplies it by .10: row[4].Sum*10%
Arithmetical ^ Exponential The following row formula returns the sixth exponent of row 4:[4]^6
Arithmetical Decimal Decimal number The following row formula multiplies the values in row 4 by 5.67: [4] * 5.67
Reference [] Specifies a row, column, or cell in a grid. Use numbers for rows and letters for columns.
The following row formula adds the values in rows 4 and 12: Sum ([4],[12])
Unary minus - Changes the sign of a value
The following column expression divides the values in column 4 by 12 and changes the sign of the result: -([4] / 12)
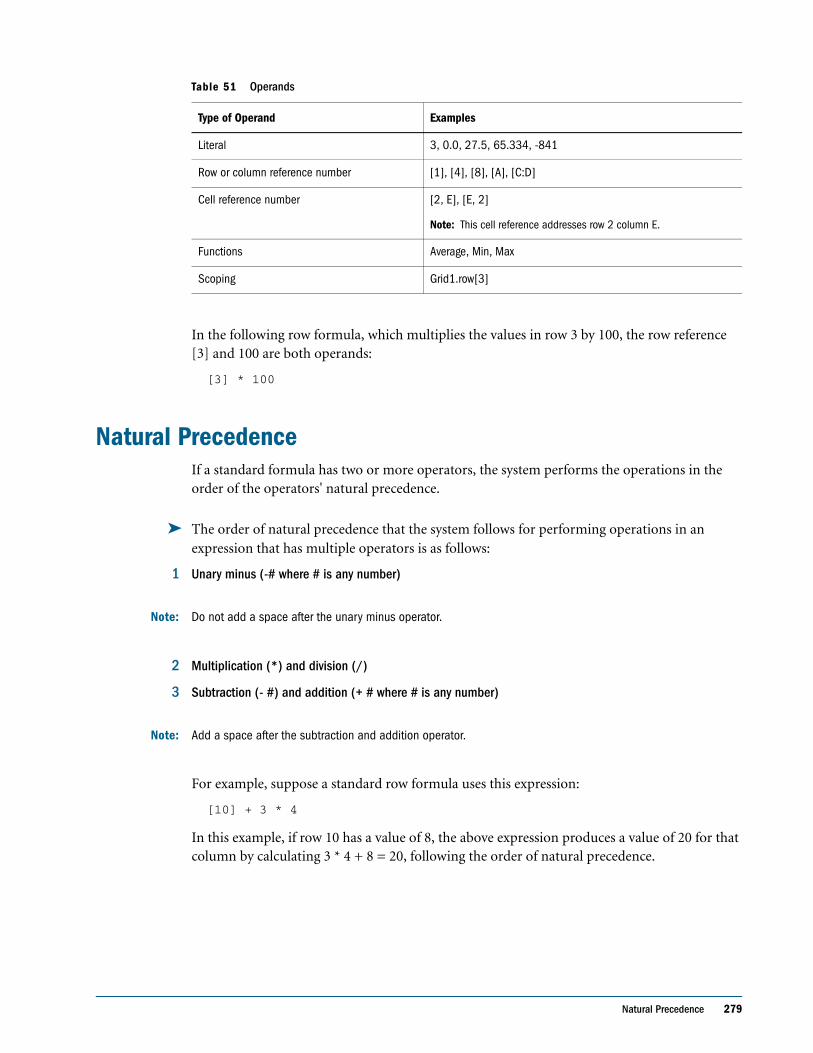
Natural Precedence 279
In the following row formula, which multiplies the values in row 3 by 100, the row reference [3] and 100 are both operands:
[3] * 100
Natural Precedence If a standard formula has two or more operators, the system performs the operations in the order of the operators' natural precedence.
➤ The order of natural precedence that the system follows for performing operations in an expression that has multiple operators is as follows:
1 Unary minus (-# where # is any number)
Note: Do not add a space after the unary minus operator.
2 Multiplication (*) and division (/)
3 Subtraction (- #) and addition (+ # where # is any number)
Note: Add a space after the subtraction and addition operator.
For example, suppose a standard row formula uses this expression:
[10] + 3 * 4
In this example, if row 10 has a value of 8, the above expression produces a value of 20 for that column by calculating 3 * 4 + 8 = 20, following the order of natural precedence.
Table 51 Operands
Type of Operand Examples
Literal 3, 0.0, 27.5, 65.334, -841
Row or column reference number [1], [4], [8], [A], [C:D]
Cell reference number [2, E], [E, 2]
Note: This cell reference addresses row 2 column E.
Functions Average, Min, Max
Scoping Grid1.row[3]

280 Using Functions
Managing the Explore Repository 281
C h a p t e r
11Managing the Explore
Repository
Financial Reporting Studio has some of the same functionality as Workspace. The repository stores Financial Reporting objects (reports, snapshots, grids, charts, image objects, text object, row and row and column templates). You can also print and print preview reports and sort items by clicking a column field header.
Items saved to the repository can be used multiple times. For example, you can use a report as a basis for designing another report, or you can use a report object, such as an image object, in several reports.
To access the all available functionality in Workspace, see the Hyperion System 9 BI+ Workspace User’s Guide.
This chapter contains the following topics:
In This Chapter Creating Folders . . . . . . . . . . . . . . . . . . . . . . . . . . . . . . . . . . . . . . . . . . . . . . . . . . . . . . . . . . . . . . . . . . . . . . . . . 281
Duplicating Objects in the Repository . . . . . . . . . . . . . . . . . . . . . . . . . . . . . . . . . . . . . . . . . . . . . . . . . . . . . . . . . . 282
Filtering Report Objects . . . . . . . . . . . . . . . . . . . . . . . . . . . . . . . . . . . . . . . . . . . . . . . . . . . . . . . . . . . . . . . . . . . . 282
Cutting, Copying, and Pasting in the Repository . . . . . . . . . . . . . . . . . . . . . . . . . . . . . . . . . . . . . . . . . . . . . . . . . . 283
Managing Database Connections . . . . . . . . . . . . . . . . . . . . . . . . . . . . . . . . . . . . . . . . . . . . . . . . . . . . . . . . . . . . . 283
Exporting Repository Objects and Report Objects . . . . . . . . . . . . . . . . . . . . . . . . . . . . . . . . . . . . . . . . . . . . . . . . . 283
Importing Report Objects into the Repository . . . . . . . . . . . . . . . . . . . . . . . . . . . . . . . . . . . . . . . . . . . . . . . . . . . . 283
Sending Links to Reports Through E-Mail . . . . . . . . . . . . . . . . . . . . . . . . . . . . . . . . . . . . . . . . . . . . . . . . . . . . . . . 283
Deleting Items from the Repository. . . . . . . . . . . . . . . . . . . . . . . . . . . . . . . . . . . . . . . . . . . . . . . . . . . . . . . . . . . . 283
Changing the Database Connection for Reports and Report Objects in the Repository . . . . . . . . . . . . . . . . . . . . . . 284
Changing a Report Database Connection . . . . . . . . . . . . . . . . . . . . . . . . . . . . . . . . . . . . . . . . . . . . . . . . . . . . . . . 284
Managing Security for Objects in the Repository . . . . . . . . . . . . . . . . . . . . . . . . . . . . . . . . . . . . . . . . . . . . . . . . . . 284
Creating FoldersYou create and use folders to help organize items in the repository. You can add folders at multiple levels while in the repository or while saving reports and report objects. When a user adds an object in the repository, by default only that user and an administrator can access the object.
282 Managing the Explore Repository
To allow other users to see an object, the originator or an administrator must assign access to other users or groups in Workspace. You must have Report Designer or Global Administrator rights to create a folder.
➤ To create folders in the repository:
1 Launch Financial Reporting.
The repository is displayed.
2 Click the location within the repository where you want the folder to reside.
3 Select File > New > Folder. The default folder name is titled New Folder.
4 Enter a folder name in the Enter New Folder Name text box. You can use uppercase and lowercase letters, numbers, and spaces.
5 Press OK to activate the folder.
Duplicating Objects in the RepositoryUse Workspace to duplicate objects in the repository. For detailed information, see the Hyperion System 9 BI+ Workspace User’s Guide.
Filtering Report ObjectsYou can filter repository objects including reports, snapshots, and saved report objects to help you easily locate an object. You filter report objects by the type of object you seek. The system searches all folders in the repository for matching object types and displays them, by folder, in a tree hierarchy. A variety of filter combinations is provided for filtering.
➤ To sort by object types:
1 Select View > Display Items of Type.
2 Select an object type (All Items, Report, Snapshot, Book, Snapshot Book, Batch, or Saved Report Object) to display in the repository.
3 Optional: Repeat steps 1 and 2 to select additional object types.
➤ To redisplay all object types in the repository, select View > Display Items of Type > All Items.
You can also sort objects by clicking the column headings. For example, you can display the oldest or newest reports first by clicking the Modified heading, or display report objects alphabetically by clicking the Name heading.
Deleting Items from the Repository 283
Cutting, Copying, and Pasting in the RepositoryIn Workspace, you can use the cut-and-paste feature to move report objects between different folders in the repository. Your ability to cut and paste depends on your access privileges. For detailed information, see the Hyperion System 9 BI+ Workspace User’s Guide.
Managing Database ConnectionsThe Database Connection Manager is in Workspace. It provides a means to manage reports, books, snapshots, snapshot books, saved reports objects (row/column templates, grids), batches, and scheduled batches. Reports and report objects can be moved from a development environment to a production environment, or between production servers.
Use Workspace to manage the database connections. For detailed information on adding, editing, and deleting database connections, see the Hyperion System 9 BI+ Workspace User’s Guide.
Exporting Repository Objects and Report Objects In Workspace Explore, you can export saved objects, report objects and folders to a specific directory on your computer. During export, you can specify the format of the objects you are exporting. For information on exporting objects and report objects, see the Hyperion System 9 BI+ Workspace User’s Guide.
Importing Report Objects into the RepositoryIn Workspace Explore, you can import objects, reports, folders and zipped files previously exported to a file system. For detailed information on importing objects, see the Hyperion System 9 BI+ Workspace User’s Guide.
Sending Links to Reports Through E-MailUsing Workspace Explore, you can use the e-mail Link feature to send a URL link of objects or folders through e-mail. The link can be opened in Workspace by a Financial Reporting user. While sending an e-mail, you can also add and store a list of frequently used e-mail addresses. For detailed information on sending links to reports through e-mail, see the Hyperion System 9 BI+ Workspace User’s Guide.
Deleting Items from the RepositoryYou delete items from the repository when no longer needed. You can permanently delete any items to which you have access privileges.
284 Managing the Explore Repository
➤ To delete items from the repository:
1 From the repository list, select the items to delete.
Tip: You can filter the repository by selecting View > Display Items of Type. Select any of the following types: Report, Snapshot, or Saved Report Object.
Tip: Press Shift to select multiple, consecutive items in the repository. Press Ctrl to select multiple, nonconsecutive items in the repository.
2 Select Edit > Delete.
3 Click Yes to confirm the deletion.
Note: Before deleting a folder, you must delete all objects contained inside. You cannot delete a folder containing hidden objects due to insufficient security privileges.
Changing the Database Connection for Reports and Report Objects in the Repository
Using Workspace, you can change the database connection for reports and books in the repository. You may want to change the database connection when moving from a development environment server to a production environment server. For information on changing database connections, see the Hyperion System 9 BI+ Workspace User’s Guide.
Changing a Report Database ConnectionWhen changing a report from a Analytic Services database connection to a Planning Details database connection or vice versa, there are several restrictions because the data source reference is the only change. There is no conversion.
● For a a list of considerations to follow when changing the database connection from Analytic Services to Planning Details for a report, see the Hyperion System 9 BI+ Workspace User’s Guide.
● For a list of considerations to follow when changing the database connection from Planning Details to Analytic Services, see the Hyperion System 9 BI+ Workspace User’s Guide.
Managing Security for Objects in the RepositoryUsing Workspace, you can apply security to objects (reports, snapshot reports, books, snapshot books, and batches), folders, and report objects (chart objects, grid objects, text objects, grids, image objects, and graphics) in the repository. Objects, folders, and report objects are secured by restricting or allowing access privileges for certain users and groups. As a result, only certain designers or viewers can view objects in the repository from Financial

Managing Security for Objects in the Repository 285
Reporting. The roles and permissions that an administrator assigns to a user or group determine if access privileges are restricted in the repository. For more information on assigning roles and access privileges, see the Hyperion System 9 BI+ Workspace User’s Guide.

286 Managing the Explore Repository
Using Batch Processing 287
C h a p t e r
12Using Batch Processing
Using Workspace, you can create, edit, and save batches if you have Administrator or Designer rights. Batches can also be scheduled, with full Batch Scheduler capability. You use batches to group and process sets of reports or books. You can send the output generated by running a batch to a printer or to the repository, and you can export both as HTML and PDF files. You can also e-mail users the exported output.
You can define and save batches in the Batch Editor and copy and delete batches in the repository. Deleting a batch from the repository requires access rights to the batch. By default, only the scheduling user is assigned access rights to snapshots and snapshot books that are saved to the repository. Having access rights to a batch, you can run every report in the batch when scheduled. The scheduling user can assign access to other users and groups at the time of scheduling.
Batches have a batch POV, which you can modify while scheduling. You can also specify prompt information for the batch. The specified POV and prompt information provides values for the POV and prompts specified for each book and report contained in the batch. You can schedule batches for processing immediately or at a later time.
For complete information on batch processing, see the Hyperion System 9 BI+ Workspace User’s Guide.

288 Using Batch Processing
XBRL in Hyperion Reports 289
C h a p t e r
13XBRL in Hyperion Reports
XBRL (eXtensible Business Reporting Language) functionality in Hyperion Reports enables you to create XBRL instance documents. The designer can take a report, attach XBRL metadata, then export the report as an instance document. XBRL Instance documents can be created using Financial Management, Planning, SAB BW, or Essbase® Analytic Services™ data sources.
XBRL is an XML-based (eXtensible Markup Language) framework that provides the business community with a standards-based method to prepare, publish in a variety of formats, reliably extract, and automatically exchange financial statements.
For additional information relating to XBRL, see the XBRL International Web site (http://www.xbrl.org).
Note: The functionality in this release supports the XBRL 2.1 specifications. Therefore, when a report is opened using a XBRL 2.0 schema, the unsupported metada must be removed. If you choose this option, you must map line items that point to the 2.1 schema, create context and units as required in the new release. If you do not wish to remove the metada, you can close the report.
In This Chapter XBRL Terms . . . . . . . . . . . . . . . . . . . . . . . . . . . . . . . . . . . . . . . . . . . . . . . . . . . . . . . . . . . . . . . . . . . . . . . . . . . . . 290
Setting Up Hyperion Reports for XBRL. . . . . . . . . . . . . . . . . . . . . . . . . . . . . . . . . . . . . . . . . . . . . . . . . . . . . . . . . . 290
Managing the XBRL Schema . . . . . . . . . . . . . . . . . . . . . . . . . . . . . . . . . . . . . . . . . . . . . . . . . . . . . . . . . . . . . . . . 291
Managing XBRL Context . . . . . . . . . . . . . . . . . . . . . . . . . . . . . . . . . . . . . . . . . . . . . . . . . . . . . . . . . . . . . . . . . . . . 294
Managing XBRL Units. . . . . . . . . . . . . . . . . . . . . . . . . . . . . . . . . . . . . . . . . . . . . . . . . . . . . . . . . . . . . . . . . . . . . . 296
Assigning XBRL Line Items to Rows. . . . . . . . . . . . . . . . . . . . . . . . . . . . . . . . . . . . . . . . . . . . . . . . . . . . . . . . . . . . 298
Exporting the Instance Document . . . . . . . . . . . . . . . . . . . . . . . . . . . . . . . . . . . . . . . . . . . . . . . . . . . . . . . . . . . . . 303
290 XBRL in Hyperion Reports
XBRL TermsThe following list of terms may be useful to an administrator who wishes to know more about XBRL.
● XBRL specification—Defines what XBRL is and how to build taxonomies and instance documents. The specification uses technical terms and is meant for a technical audience.
● XBRL taxonomy—A set of XML schemas and XML Linking compliant linkbases that, taken together, define the syntax and semantics of XML elements corresponding to concepts about which facts can be expressed in XBRL instance documents. For example, a taxonomy may define the concept Net Profit as having certain relationships to other concepts (such as being the difference between Revenue and Expenses) and that a fact about it, such as “it has the value of 2,450,321 US Dollars correct to 7 significant figures, for the period from 1st January 2003 to 31st December 2003, for the US division of company XYZ”, is expressed in an XBRL instance using the XML element “<netProfit>.
● XBRL element—An XML element that is used to express a concept in an XBRL instance document. The syntax and semantics of XBRL elements are defined by XBRL taxonomies.
● Instance document—An XML document, containing a set of XBRL elements, that expresses a set of facts that may constitute one or more business reports. For example, the financial statements of Hyperion Solutions, expressed in XBRL, would be an instance document.
● XML—Markup language for documents containing structural information. XML provides for richly-structured documents that can be used on the Web.
Setting Up Hyperion Reports for XBRLThe following topics guide you through the process of setting up to use XBRL with Hyperion Reports.
Note: If you are using XBRL for the first time, Hyperion recommends that you follow the procedures in the chronological order outlined in this chapter.
Enabling XBRLTo use the XBRL functionality in Hyperion Reports, XBRL functionality must be enabled through Preferences.
➤ To enable XBRL:
1 Log on to Hyperion Reports.
2 Select File > Preferences.
3 Click Enable XBRL Editing, then click OK. An information dialog box instructs you to restart the Hyperion Reports.
Using XBRL Management 291
4 Save any reports that may be active. Restart your Hyperion Reports. When you log on, XBRL controls are available.
Downloading XBRL taxonomies to the XBRL directoryYou can choose from numerous taxonomies to download. The official XBRL site
(http://www.xbrl.org) can provide assistance with your selections.
Note: An XBRL taxonomy can consist of one or more files. All related files must be downloaded.
➤ To download the XBRL taxonomies:
1 Right-click the taxonomy, then click Save Target As or Open.
2 Copy the files to the xbrlfiles directory on the Hyperion Reports server; for example, C:...\BIPlus\common\xbrlfiles.
Note: You must have write privileges to the HR Server computer.
Tip: You can create a separate user-defined folder in the xbrlfiles directory for each taxonomy you download.
3 Unzip the ZIP file within the xbrlfiles directory. Be sure to retain any relative directory structure that is present in the zip file to retain any relative references that might be present in the files constituting the taxonomy.
4 You are now ready to update the XBRL schema registration. Continue to the next topic, “Managing the XBRL Schema” on page 291, for instructions.
Using XBRL ManagementUse XBRL Management in the Designer to update manage the XBRL schema, and define XBRL contexts and units for a report.
Managing the XBRL SchemaAn XBRL taxonomy contains one or more schemas that define the line items or elements that can be contained in an instance document. After you add or remove XBRL taxonomies in the xbrlfiles directory, you must update the registration of the schemas. (For information on downloading the XBRL taxonomies, see “Downloading XBRL taxonomies to the XBRL directory” on page 291.)
Some noteworthy information that may affect the outcome of your instance report:
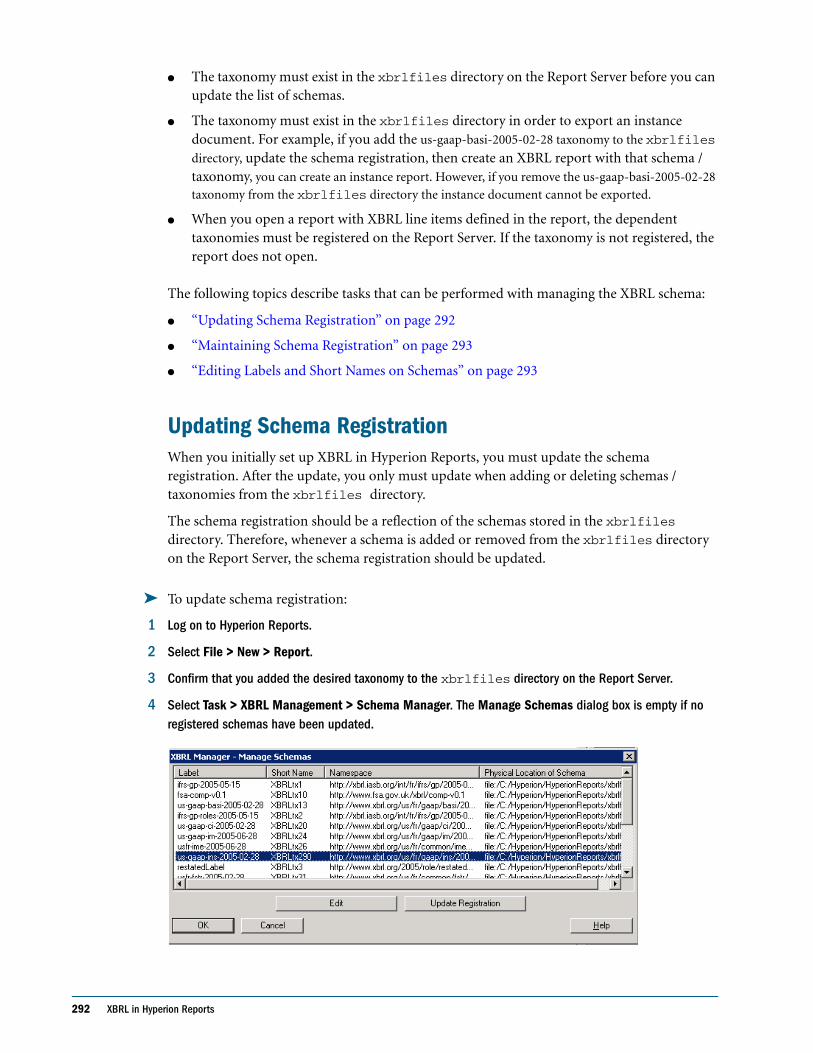
292 XBRL in Hyperion Reports
● The taxonomy must exist in the xbrlfiles directory on the Report Server before you can update the list of schemas.
● The taxonomy must exist in the xbrlfiles directory in order to export an instance document. For example, if you add the us-gaap-basi-2005-02-28 taxonomy to the xbrlfiles
directory, update the schema registration, then create an XBRL report with that schema / taxonomy, you can create an instance report. However, if you remove the us-gaap-basi-2005-02-28
taxonomy from the xbrlfiles directory the instance document cannot be exported.
● When you open a report with XBRL line items defined in the report, the dependent taxonomies must be registered on the Report Server. If the taxonomy is not registered, the report does not open.
The following topics describe tasks that can be performed with managing the XBRL schema:
● “Updating Schema Registration” on page 292
● “Maintaining Schema Registration” on page 293
● “Editing Labels and Short Names on Schemas” on page 293
Updating Schema RegistrationWhen you initially set up XBRL in Hyperion Reports, you must update the schema registration. After the update, you only must update when adding or deleting schemas / taxonomies from the xbrlfiles directory.
The schema registration should be a reflection of the schemas stored in the xbrlfiles directory. Therefore, whenever a schema is added or removed from the xbrlfiles directory on the Report Server, the schema registration should be updated.
➤ To update schema registration:
1 Log on to Hyperion Reports.
2 Select File > New > Report.
3 Confirm that you added the desired taxonomy to the xbrlfiles directory on the Report Server.
4 Select Task > XBRL Management > Schema Manager. The Manage Schemas dialog box is empty if no registered schemas have been updated.
Using XBRL Management 293
5 Click Update Registration. If new taxonomies are added to the xbrlfiles directory, a list of registrations are displayed in the top list box.
6 Click OK to update the list of schema registrations.
Note: Some taxonomies import multiple schema. All schema registrations associated with a taxonomy are updated at this time.
Note: All columns in the XBRL Schema Manager dialog box can be sorted by clicking on the header column.
Maintaining Schema RegistrationWhenever you add or delete a taxonomy in the xbrlfiles directory on the Reports Server, you must update your schema registration so that your instance document does not fail upon export.
➤ To maintain schema registration:
1 After you add or delete a taxonomy in the xbrlfiles directory, log on to Hyperion Reports.
2 Select File > New > Report.
3 Select Task > XBRL Management > Schema Manager. XBRL Manager - Manage Schemas is displayed.
4 Click Update Registration.
● If you added a taxonomy to the xbrlfiles directory, the registration schemas are listed in Registrations to be Added.
● If you deleted a taxonomy from the xbrlfiles directory, the registration schemas are listed in Registrations to be Deleted.
5 Click OK to update the registration of schemas.
Editing Labels and Short Names on SchemasYou can change the label and short name of the updated schema registrations to more meaningful descriptions. A modified label provides easier name recognition when you select a schema to assign XBRL line items to rows.
➤ To edit a schema label and short name:
1 Log on to Hyperion Reports.
2 Select File > New > Report.
3 From the Hyperion Report designer, select Task > XBRL Management > Schema Manager. XBRL Manager - Manage Schemas is displayed.
4 Select a schema, then click Edit.
5 In Edit Schema, enter a brief description in Label and Short Name.
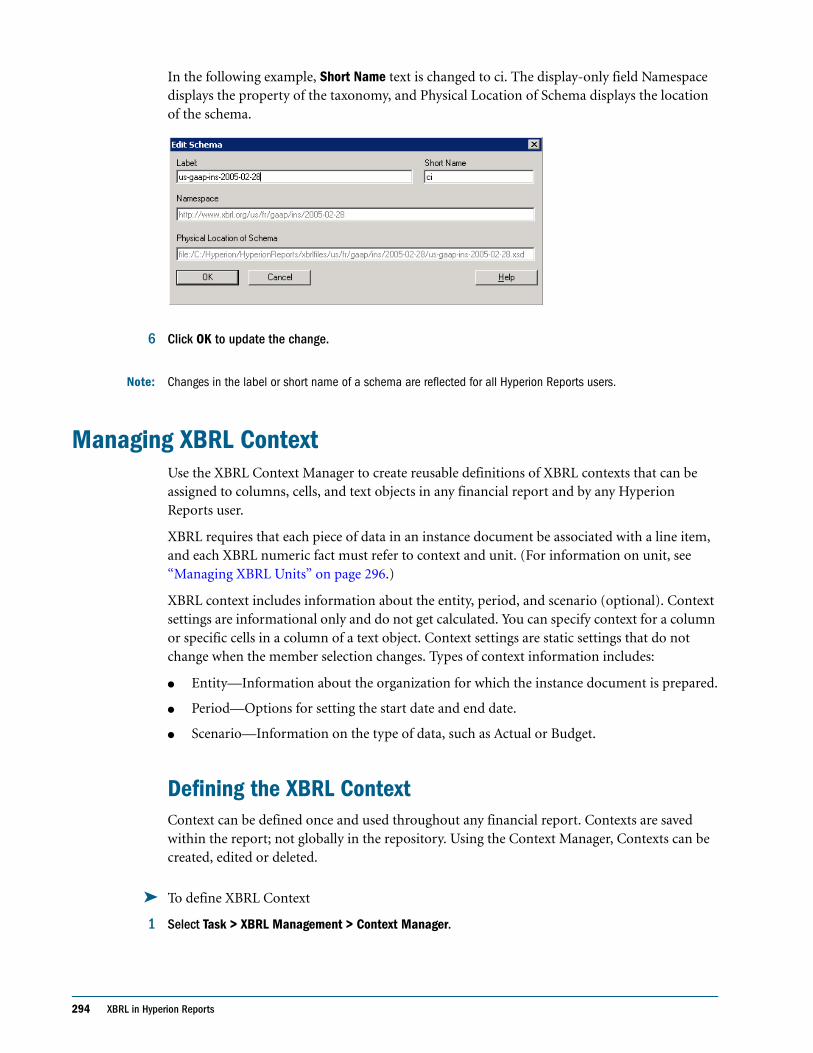
294 XBRL in Hyperion Reports
In the following example, Short Name text is changed to ci. The display-only field Namespace displays the property of the taxonomy, and Physical Location of Schema displays the location of the schema.
6 Click OK to update the change.
Note: Changes in the label or short name of a schema are reflected for all Hyperion Reports users.
Managing XBRL ContextUse the XBRL Context Manager to create reusable definitions of XBRL contexts that can be assigned to columns, cells, and text objects in any financial report and by any Hyperion Reports user.
XBRL requires that each piece of data in an instance document be associated with a line item, and each XBRL numeric fact must refer to context and unit. (For information on unit, see “Managing XBRL Units” on page 296.)
XBRL context includes information about the entity, period, and scenario (optional). Context settings are informational only and do not get calculated. You can specify context for a column or specific cells in a column of a text object. Context settings are static settings that do not change when the member selection changes. Types of context information includes:
● Entity—Information about the organization for which the instance document is prepared.
● Period—Options for setting the start date and end date.
● Scenario—Information on the type of data, such as Actual or Budget.
Defining the XBRL ContextContext can be defined once and used throughout any financial report. Contexts are saved within the report; not globally in the repository. Using the Context Manager, Contexts can be created, edited or deleted.
➤ To define XBRL Context
1 Select Task > XBRL Management > Context Manager.
Managing XBRL Context 295
2 In XBRL Manager - Manage Context, click New.
XBRL Manager - Context Setup is displayed, containing the Entity, Period, and Scenario tabs.
3 in Name, enter a descriptive label for the context.
4 On the Entity tab, perform the following actions:
a. In Identifier, enter an identifier that conforms to the Scheme/Reference field.
b. In Scheme/Reference, enter a URI according to XML schema. For example, a US firm registered with SEC would be www.sec.gov.
c. Optional: If the instance document refers to a specific segment of the entity, (such as the ABC is a subsidiary of the entity XYZ), then select the Include Segment Information from Schema check box, and enter the label for the segment.
Note: You can also use XML to describe the entity segment. All XML must conform to XBRL specifications. For more information on XBRL specifications, see the XBRL International Web Site (http://www.xbrl.org).
5 Select the Period tab, then select one of the following time periods:
● To specify one point in time, select Instant, then select a date from the calendar.
● To specify a range of dates, select Start Date, End Date, then select an inclusive start date and an inclusive end date from the calendar.
Tip: To change the calendar month, click the right arrow to move the calendar month forward; click the left arrow to move the calender month backward, or click the calender month and select a new month. To change the year, click the calendar year, then click the up or down button to move the calendar year forward or backward, respectively.
● To indicate no date restrictions, select Forever.
Note: This option is rarely used. It is intended for the possibility that one might want to report the values of certain constants like pi or e or the speed of light.
6 Select the Scenario tab, then perform the following actions:
You can describe the type of data for the Scenario element. For example, Actual or Budget. You can type a text description of the scenario or use XML to describe the scenario.
Select Specify Scenario from the Schema, then type the scenario. For example, type actual in text, or type <other:actual/> in XML.
Note: All XML must conform to XBRL specifications.
7 Click OK. The Context record is stored as a line item in XBRL Manager - Manage Context.
8 Click Close.
296 XBRL in Hyperion Reports
Assigning XBRL ContextYou can set XBRL Context on columns, cells in a column, and text objects.
Note: XBRL Context in a text object is used to define an XBRL Fact. An XBRL fact includes a line item and XBRL Context.
➤ To set XBRL Context:
1 Open a report for which you want to create an XBRL instance document.
2 Select a column, cells in a column or text object.
Note: When you create a cell-based context, you must select cells within one column only.
3 Select XBRL Context located on the property sheet.
4 Select an XBRL Context from the drop-down list; to create a new XBRL Context, click .
Note: The XBRL context you assigned to a column may not be true for all cells in that column. If this is the case, you can modify the context of individual cells. For example, if the context for a column is labeled as January, but a number of those cells are for a different month, you can change the setting of those cells. Use the above procedures to modify specific cells in a column.
Removing XBRL ContextYou can remove XBRL context from a columns or cells that you want to exclude from the instance report.
➤ To remove XBRL context:
1 Open a report that contains columns or cells that were previously defined with XBRL context.
2 Select a column or cell that is defined with XBRL context.
3 In the property sheet, deselect XBRL Context. Click Yes to confirm.
Note: When you remove context from a report, any dependent line items become disassociated with that context. The report needs at least one context assigned to grid or text data in order to generate a valid instance document.
Managing XBRL UnitsUse the XBRL Unit Manager to create reusable definitions of simple and compound unit of measures that can be assigned to grids, columns, and cells in any financial report and by any Hyperion Reports user. The compound unit of measure enables you to specify a multiplication or division operator, and then two units; remember that this is only a description.
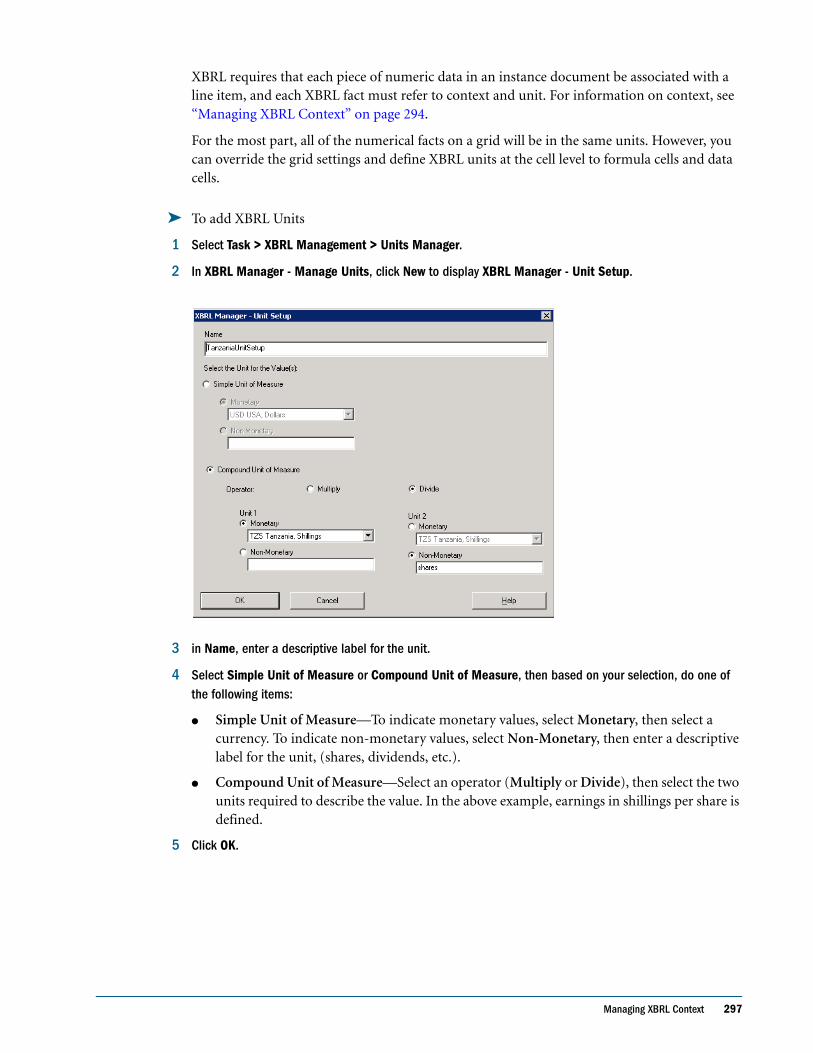
Managing XBRL Context 297
XBRL requires that each piece of numeric data in an instance document be associated with a line item, and each XBRL fact must refer to context and unit. For information on context, see “Managing XBRL Context” on page 294.
For the most part, all of the numerical facts on a grid will be in the same units. However, you can override the grid settings and define XBRL units at the cell level to formula cells and data cells.
➤ To add XBRL Units
1 Select Task > XBRL Management > Units Manager.
2 In XBRL Manager - Manage Units, click New to display XBRL Manager - Unit Setup.
3 in Name, enter a descriptive label for the unit.
4 Select Simple Unit of Measure or Compound Unit of Measure, then based on your selection, do one of the following items:
● Simple Unit of Measure—To indicate monetary values, select Monetary, then select a currency. To indicate non-monetary values, select Non-Monetary, then enter a descriptive label for the unit, (shares, dividends, etc.).
● Compound Unit of Measure—Select an operator (Multiply or Divide), then select the two units required to describe the value. In the above example, earnings in shillings per share is defined.
5 Click OK.
298 XBRL in Hyperion Reports
Assigning XBRL UnitsYou can set XBRL Units on grids, columns, and cells in a column. The XBRL Units you assigned to a grid may not be true for all columns or cells. If this is the case, you can modify the units of individual columns or cells. For example, if the unit for a grid is labeled as Monetary USD, but a number of those columns or cells are Non-Monetary/Shares, you can change the setting in those areas. Select a column or cell you want to change, and use the following procedures to modify their unit assignment.
➤ To set XBRL Units:
1 Open a report for which you want to create an XBRL instance document.
2 Select a grid, columns, or cells.
3 Select XBRL Unit located on the property sheet (to create a new XBRL Unit, click .).
4 Select an XBRL Unit from the drop-down list.
Assigning XBRL Line Items to RowsAfter you complete the setup of Hyperion Reports for XBRL and define the context and units, you can begin assigning XBRL line items to data within a report. You can define one value per line item. If a line item is mapped to a row which contains multiple members, as in children, the values in that row are summed and assigned to that line item.
Note: When instance documents are generated, numeric values mapped to XBRL line items are saved with their "raw" data values. Any formatting or rounding is removed from numeric values. As such, the XBRL "precision" attribute for numeric line items is always set to the value "INF". This means that the number mapped to the line item is the exact value shown in the instance document (no rounding). If values stored in a data source are already rounded (for example, the stored value of 250 may actually be 250,000), it may be necessary to manually adjust the precision attribute in the resulting XML file after an instance document is created. For more information regarding the precision attribute please refer to the XBRL 2.1 specification.
➤ To assign XBRL line items to rows:
1 Open a report that is set up for XBRL.
● For information, on setting up Hyperion Reports for XBRL, see “Setting Up Hyperion Reports for XBRL” on page 290.
● For information on defining the context, see “Managing XBRL Context” on page 294.
● For information on defining units, see “Managing XBRL Units” on page 296.
2 Select a data or formula row. In the following example, data row 3 is selected:
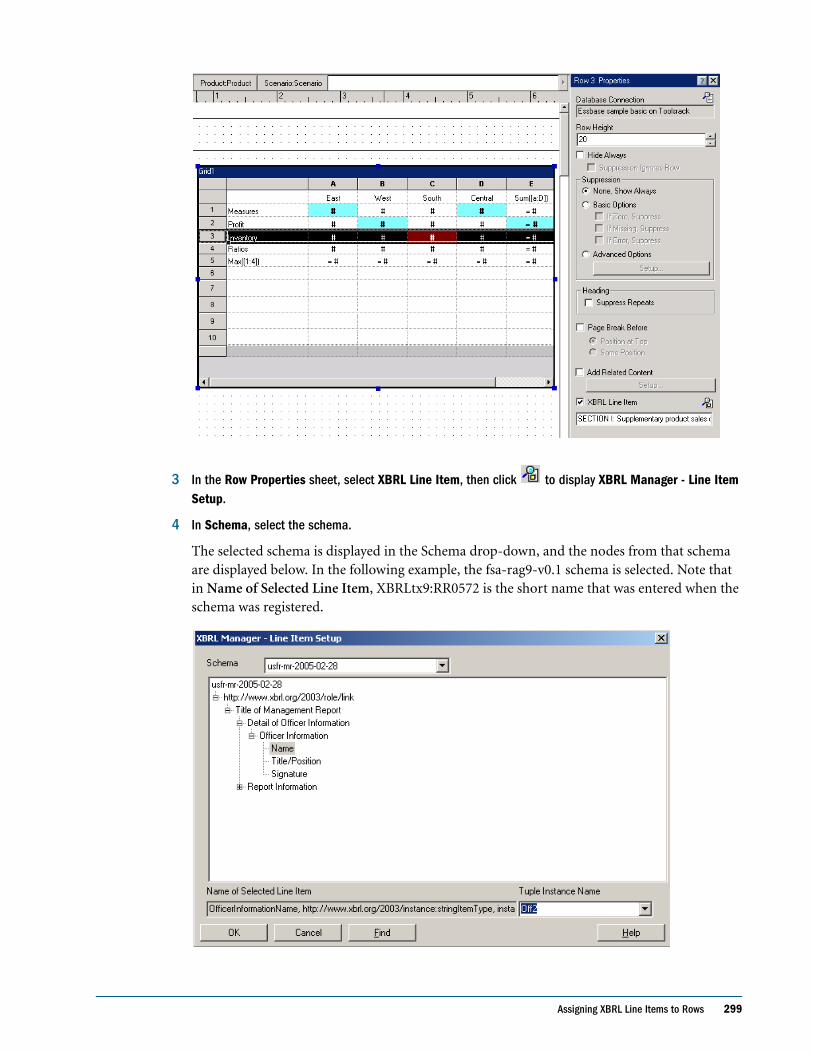
Assigning XBRL Line Items to Rows 299
3 In the Row Properties sheet, select XBRL Line Item, then click to display XBRL Manager - Line Item Setup.
4 In Schema, select the schema.
The selected schema is displayed in the Schema drop-down, and the nodes from that schema are displayed below. In the following example, the fsa-rag9-v0.1 schema is selected. Note that in Name of Selected Line Item, XBRLtx9:RR0572 is the short name that was entered when the schema was registered.
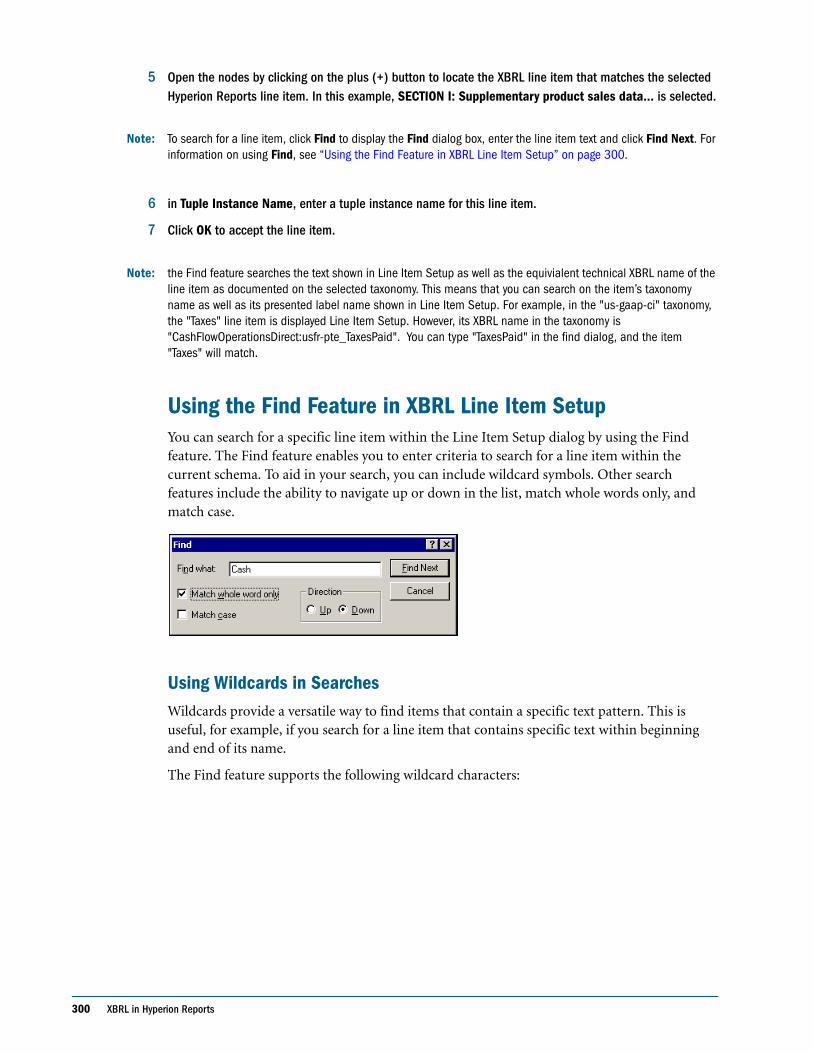
300 XBRL in Hyperion Reports
5 Open the nodes by clicking on the plus (+) button to locate the XBRL line item that matches the selected Hyperion Reports line item. In this example, SECTION I: Supplementary product sales data... is selected.
Note: To search for a line item, click Find to display the Find dialog box, enter the line item text and click Find Next. For information on using Find, see “Using the Find Feature in XBRL Line Item Setup” on page 300.
6 in Tuple Instance Name, enter a tuple instance name for this line item.
7 Click OK to accept the line item.
Note: the Find feature searches the text shown in Line Item Setup as well as the equivialent technical XBRL name of the line item as documented on the selected taxonomy. This means that you can search on the item’s taxonomy name as well as its presented label name shown in Line Item Setup. For example, in the "us-gaap-ci" taxonomy, the "Taxes" line item is displayed Line Item Setup. However, its XBRL name in the taxonomy is "CashFlowOperationsDirect:usfr-pte_TaxesPaid". You can type "TaxesPaid" in the find dialog, and the item "Taxes" will match.
Using the Find Feature in XBRL Line Item SetupYou can search for a specific line item within the Line Item Setup dialog by using the Find feature. The Find feature enables you to enter criteria to search for a line item within the current schema. To aid in your search, you can include wildcard symbols. Other search features include the ability to navigate up or down in the list, match whole words only, and match case.
Using Wildcards in SearchesWildcards provide a versatile way to find items that contain a specific text pattern. This is useful, for example, if you search for a line item that contains specific text within beginning and end of its name.
The Find feature supports the following wildcard characters:
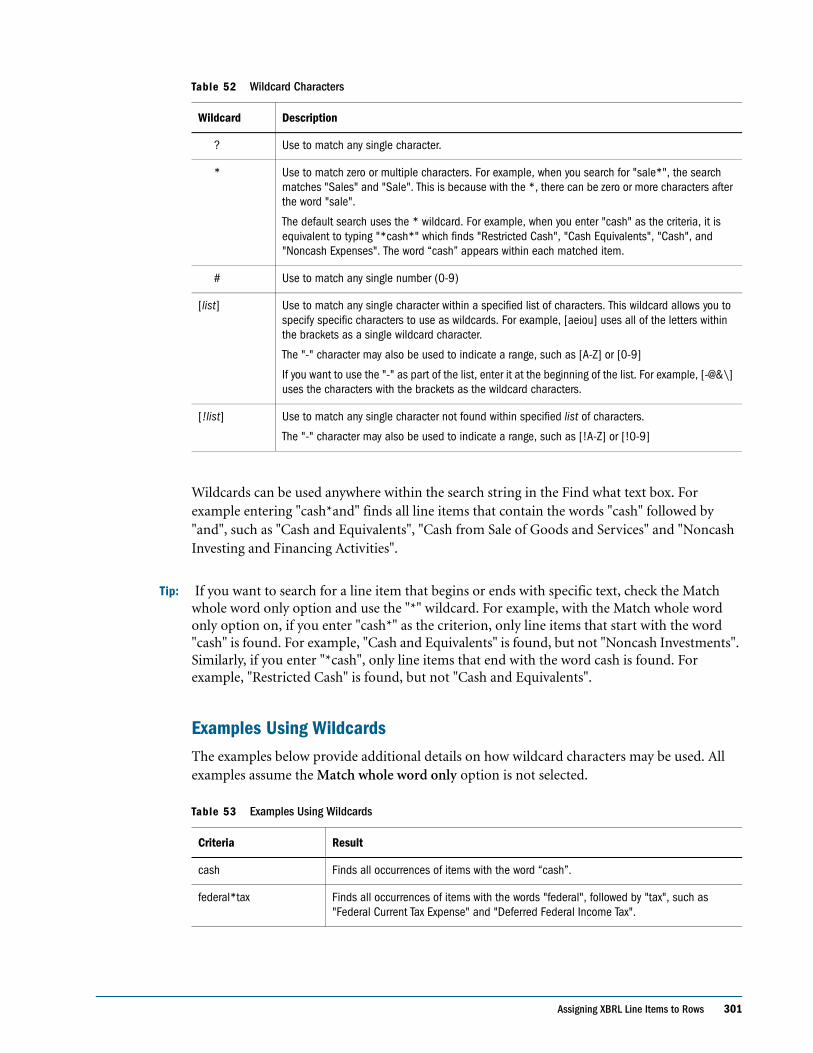
Assigning XBRL Line Items to Rows 301
Wildcards can be used anywhere within the search string in the Find what text box. For example entering "cash*and" finds all line items that contain the words "cash" followed by "and", such as "Cash and Equivalents", "Cash from Sale of Goods and Services" and "Noncash Investing and Financing Activities".
Tip: If you want to search for a line item that begins or ends with specific text, check the Match whole word only option and use the "*" wildcard. For example, with the Match whole word only option on, if you enter "cash*" as the criterion, only line items that start with the word "cash" is found. For example, "Cash and Equivalents" is found, but not "Noncash Investments". Similarly, if you enter "*cash", only line items that end with the word cash is found. For example, "Restricted Cash" is found, but not "Cash and Equivalents".
Examples Using WildcardsThe examples below provide additional details on how wildcard characters may be used. All examples assume the Match whole word only option is not selected.
Table 52 Wildcard Characters
Wildcard Description
? Use to match any single character.
* Use to match zero or multiple characters. For example, when you search for "sale*", the search matches "Sales" and "Sale". This is because with the *, there can be zero or more characters after the word "sale".
The default search uses the * wildcard. For example, when you enter "cash" as the criteria, it is equivalent to typing "*cash*" which finds "Restricted Cash", "Cash Equivalents", "Cash", and "Noncash Expenses". The word “cash” appears within each matched item.
# Use to match any single number (0-9)
[list] Use to match any single character within a specified list of characters. This wildcard allows you to specify specific characters to use as wildcards. For example, [aeiou] uses all of the letters within the brackets as a single wildcard character.
The "-" character may also be used to indicate a range, such as [A-Z] or [0-9]
If you want to use the "-" as part of the list, enter it at the beginning of the list. For example, [-@&\] uses the characters with the brackets as the wildcard characters.
[!list] Use to match any single character not found within specified list of characters.
The "-" character may also be used to indicate a range, such as [!A-Z] or [!0-9]
Table 53 Examples Using Wildcards
Criteria Result
cash Finds all occurrences of items with the word “cash”.
federal*tax Finds all occurrences of items with the words "federal", followed by "tax", such as "Federal Current Tax Expense" and "Deferred Federal Income Tax".
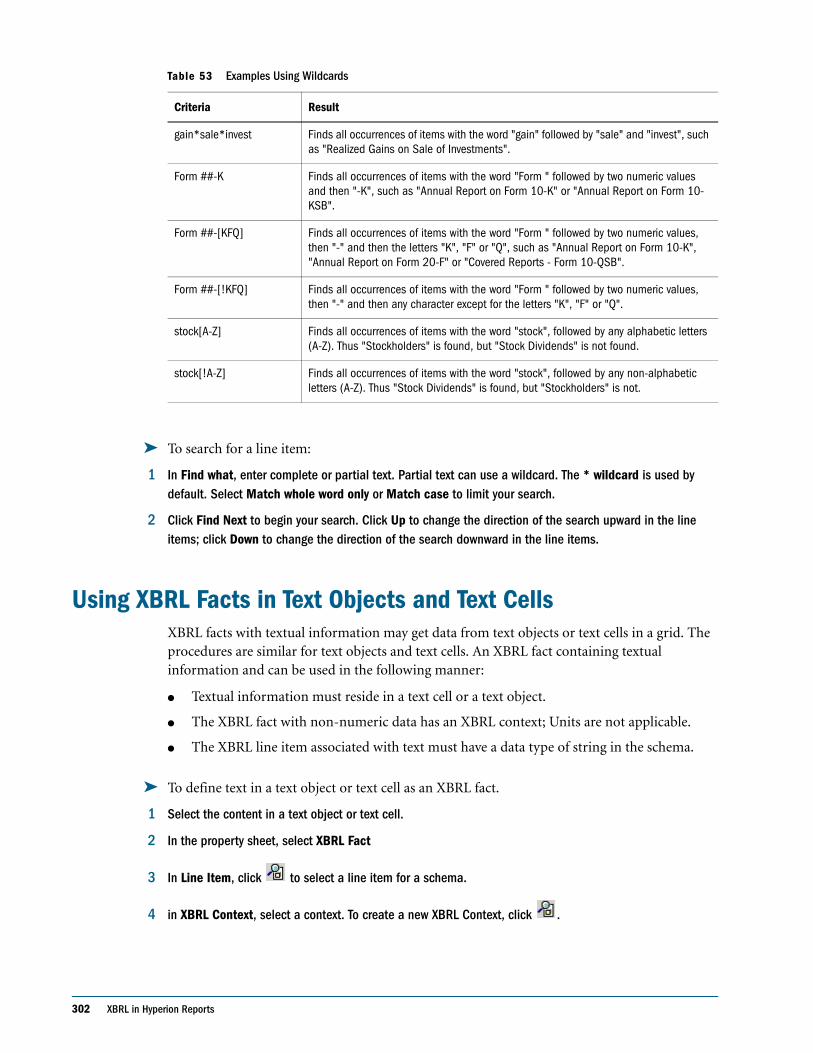
302 XBRL in Hyperion Reports
➤ To search for a line item:
1 In Find what, enter complete or partial text. Partial text can use a wildcard. The * wildcard is used by default. Select Match whole word only or Match case to limit your search.
2 Click Find Next to begin your search. Click Up to change the direction of the search upward in the line items; click Down to change the direction of the search downward in the line items.
Using XBRL Facts in Text Objects and Text CellsXBRL facts with textual information may get data from text objects or text cells in a grid. The procedures are similar for text objects and text cells. An XBRL fact containing textual information and can be used in the following manner:
● Textual information must reside in a text cell or a text object.
● The XBRL fact with non-numeric data has an XBRL context; Units are not applicable.
● The XBRL line item associated with text must have a data type of string in the schema.
➤ To define text in a text object or text cell as an XBRL fact.
1 Select the content in a text object or text cell.
2 In the property sheet, select XBRL Fact
3 In Line Item, click to select a line item for a schema.
4 in XBRL Context, select a context. To create a new XBRL Context, click .
gain*sale*invest Finds all occurrences of items with the word "gain" followed by "sale" and "invest", such as "Realized Gains on Sale of Investments".
Form ##-K Finds all occurrences of items with the word "Form " followed by two numeric values and then "-K", such as "Annual Report on Form 10-K" or "Annual Report on Form 10-KSB".
Form ##-[KFQ] Finds all occurrences of items with the word "Form " followed by two numeric values, then "-" and then the letters "K", "F" or "Q", such as "Annual Report on Form 10-K", "Annual Report on Form 20-F" or "Covered Reports - Form 10-QSB".
Form ##-[!KFQ] Finds all occurrences of items with the word "Form " followed by two numeric values, then "-" and then any character except for the letters "K", "F" or "Q".
stock[A-Z] Finds all occurrences of items with the word "stock", followed by any alphabetic letters (A-Z). Thus "Stockholders" is found, but "Stock Dividends" is not found.
stock[!A-Z] Finds all occurrences of items with the word "stock", followed by any non-alphabetic letters (A-Z). Thus "Stock Dividends" is found, but "Stockholders" is not.
Table 53 Examples Using Wildcards
Criteria Result
Exporting the Instance Document 303
Using XBRL Footnotes in Text Objects and Text CellsXBRL instance documents can contain footnotes. Footnotes are textual information about one numerical or text fact. This fact may be in a grid’s text cell or text object. In order to associate a footnote, the line item must be previously mapped.
➤ To associate text from a text object to an XBRL fact in another text object.
1 Select the text object.
2 In the property sheet, select XBRL Footnote, Associate with a, then select the location of the XBRL Fact associated with this footnote.
Text cells in grids can contain footnotes also.
➤ To associate a footnote to a text object:
1 Select the cell text.
2 In the Cell Properties sheet, select Text Object, then select the text object from the list.
Note: The text shown in the list represents the first 30 characters of all the text objects currently defined in the report.
Exporting the Instance DocumentAn instance document, in XML format, can be created from Hyperion Reports Designer that is defined with XBRL metadata.
➤ To export the instance document:
1 Open a report that is set up for XBRL.
● For information on setting up Hyperion Reports for XBRL, see “Setting Up Hyperion Reports for XBRL” on page 290.
● For information on defining the context, see “Managing XBRL Context” on page 294.
2 Select File > Export.
3 Optional. In the Save-in drop-down list, select another path than the default directory.
4 Optional. In the File name text box, enter an instance report name.
5 In the Save as type drop-down, select XBRL Instance Document (*.xml).
6 Click Save.
7 If the grid has multiple members on the Pages axis, the Select Members for Page Axis dialog box. Select a member for the page axis for each grid on the report.
8 Click OK.
304 XBRL in Hyperion Reports
Select Member for Page Axis Dialog BoxA drop-down box is displayed for each grid on the report that contains XBRL line items. You are required to select a member for the page axis for each grid on the report that contains XBRL line items.
➤ To select a member for the page axis, click on each drop-down list and select a member.
Note: If you selected Custom Heading for the page properties (on the Page Properties sheet), you must define the members with MemberName, MembAlias and/or Member Description to display the members in the Select Members for Page Axis dialog box.
Working with Books and Snapshot Books 305
C h a p t e r
14Working with Books and
Snapshot Books
Using Workspace, you can assemble reports and snapshots into a book, which enables you to generate output for those reports in one session. You can also configure your book to generate several versions of a report that are run for different member selections. By creating a book containing those reports, you can run all reports at once. The reports contained in the book can be printed or viewed individually or as an entire book.
There are two types of books that you can define and save to the Explore repository:
● Books. reports, and snapshots can be added to a book. When you run a book, the data within the reports is dynamically retrieved from the database; the data within the snapshots remains static.
● Snapshot books. A book can be saved as a snapshot book. All reports are converted to snapshots containing static data for that period of time. The data contained in the reports, and a table of contents, is created when you save a book as a snapshot book. Any time a snapshot book is viewed, data-level security does not apply. Data-level security is applied when the snapshot book is created and is based upon the data level security that is set up for the user that saved the snapshot book.
Using Workspace, you can perform the following additional tasks with books and snapshot books from Financial Reporting:
● Use batches to group and process sets of books.
● E-mail links to the books or snapshot books from the repository.
● Change the data source for a book in the repository.
● Make an exact copy of books or snapshot books in the repository.
● Permanently delete books or snapshot books.
● Import books and snapshot books from a file system outside of the repository. When you import the book, it is saved within the Export repository. You can then perform any tasks on the book.
● Export books and snapshot books.
For complete information on the above topics, see the Hyperion System 9 BI+ Workspace User’s Guide.

306 Working with Books and Snapshot Books
Property Sheet Help 313
A P P E N D I X
AProperty Sheet Help
This appendix provides help for the property sheets in Financial Reporting. It includes the following topics:
In This Chapter Report Properties . . . . . . . . . . . . . . . . . . . . . . . . . . . . . . . . . . . . . . . . . . . . . . . . . . . . . . . . . . . . . . . . . . . . . . . . 314
Grid Properties . . . . . . . . . . . . . . . . . . . . . . . . . . . . . . . . . . . . . . . . . . . . . . . . . . . . . . . . . . . . . . . . . . . . . . . . . . 314
Page Properties . . . . . . . . . . . . . . . . . . . . . . . . . . . . . . . . . . . . . . . . . . . . . . . . . . . . . . . . . . . . . . . . . . . . . . . . . . 317
Heading Row/Column Properties . . . . . . . . . . . . . . . . . . . . . . . . . . . . . . . . . . . . . . . . . . . . . . . . . . . . . . . . . . . . . 318
Row / Column Properties . . . . . . . . . . . . . . . . . . . . . . . . . . . . . . . . . . . . . . . . . . . . . . . . . . . . . . . . . . . . . . . . . . . 318
Cell Properties. . . . . . . . . . . . . . . . . . . . . . . . . . . . . . . . . . . . . . . . . . . . . . . . . . . . . . . . . . . . . . . . . . . . . . . . . . . 320
Text Row / Column Properties . . . . . . . . . . . . . . . . . . . . . . . . . . . . . . . . . . . . . . . . . . . . . . . . . . . . . . . . . . . . . . . 320
Text Cell Properties . . . . . . . . . . . . . . . . . . . . . . . . . . . . . . . . . . . . . . . . . . . . . . . . . . . . . . . . . . . . . . . . . . . . . . . 321
Chart Properties . . . . . . . . . . . . . . . . . . . . . . . . . . . . . . . . . . . . . . . . . . . . . . . . . . . . . . . . . . . . . . . . . . . . . . . . . 321
Image Properties . . . . . . . . . . . . . . . . . . . . . . . . . . . . . . . . . . . . . . . . . . . . . . . . . . . . . . . . . . . . . . . . . . . . . . . . . 322
Text Properties . . . . . . . . . . . . . . . . . . . . . . . . . . . . . . . . . . . . . . . . . . . . . . . . . . . . . . . . . . . . . . . . . . . . . . . . . . . 323
Row and Column Template Properties. . . . . . . . . . . . . . . . . . . . . . . . . . . . . . . . . . . . . . . . . . . . . . . . . . . . . . . . . . 324
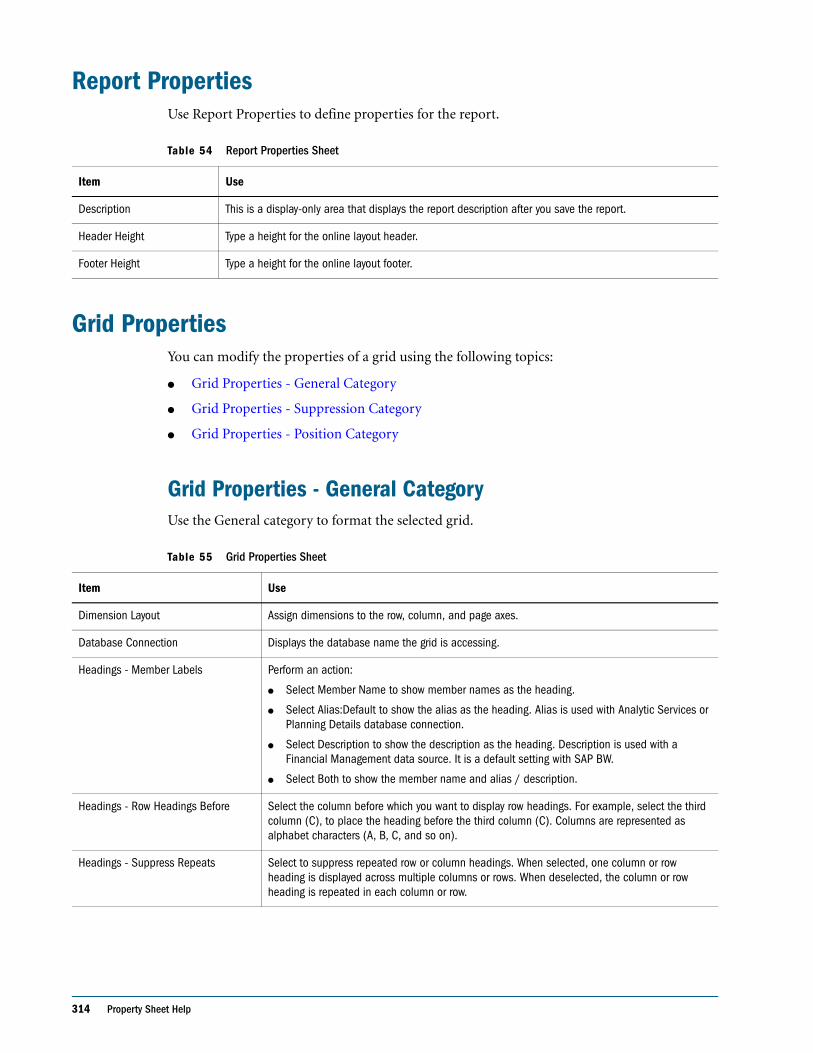
314 Property Sheet Help
Report PropertiesUse Report Properties to define properties for the report.
Grid PropertiesYou can modify the properties of a grid using the following topics:
● Grid Properties - General Category
● Grid Properties - Suppression Category
● Grid Properties - Position Category
Grid Properties - General CategoryUse the General category to format the selected grid.
Table 54 Report Properties Sheet
Item Use
Description This is a display-only area that displays the report description after you save the report.
Header Height Type a height for the online layout header.
Footer Height Type a height for the online layout footer.
Table 55 Grid Properties Sheet
Item Use
Dimension Layout Assign dimensions to the row, column, and page axes.
Database Connection Displays the database name the grid is accessing.
Headings - Member Labels Perform an action:
● Select Member Name to show member names as the heading.
● Select Alias:Default to show the alias as the heading. Alias is used with Analytic Services or Planning Details database connection.
● Select Description to show the description as the heading. Description is used with a Financial Management data source. It is a default setting with SAP BW.
● Select Both to show the member name and alias / description.
Headings - Row Headings Before Select the column before which you want to display row headings. For example, select the third column (C), to place the heading before the third column (C). Columns are represented as alphabet characters (A, B, C, and so on).
Headings - Suppress Repeats Select to suppress repeated row or column headings. When selected, one column or row heading is displayed across multiple columns or rows. When deselected, the column or row heading is repeated in each column or row.
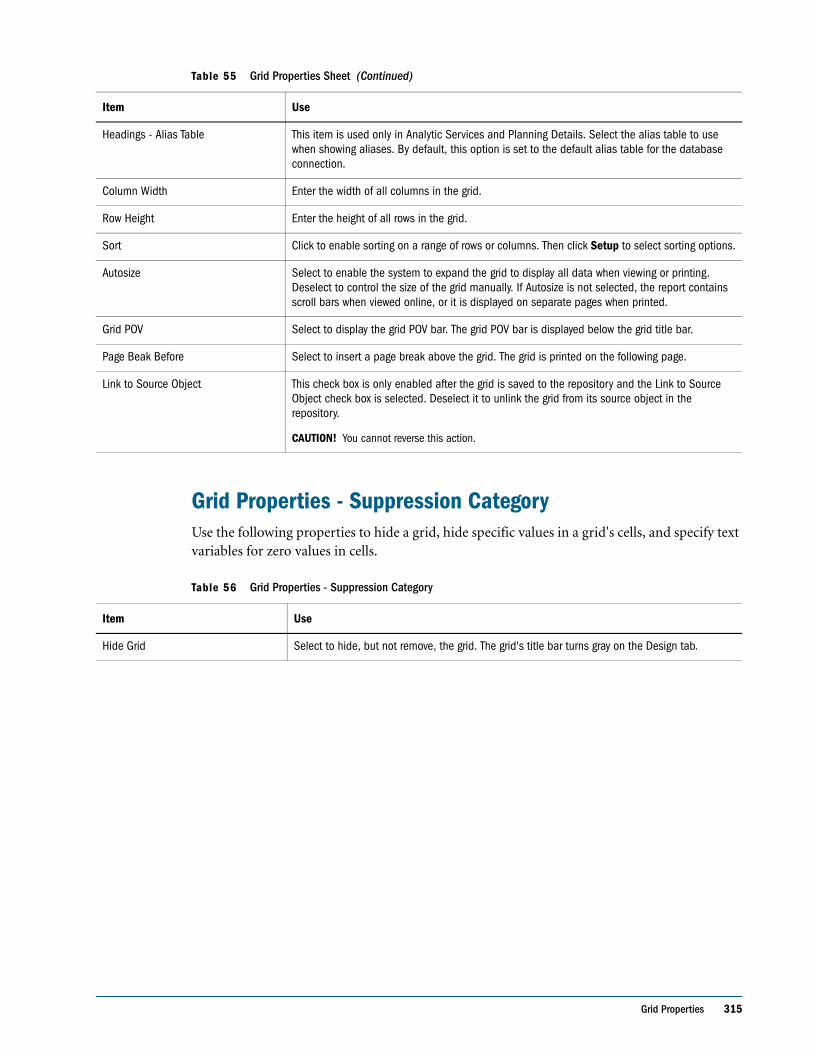
Grid Properties 315
Grid Properties - Suppression CategoryUse the following properties to hide a grid, hide specific values in a grid's cells, and specify text variables for zero values in cells.
Headings - Alias Table This item is used only in Analytic Services and Planning Details. Select the alias table to use when showing aliases. By default, this option is set to the default alias table for the database connection.
Column Width Enter the width of all columns in the grid.
Row Height Enter the height of all rows in the grid.
Sort Click to enable sorting on a range of rows or columns. Then click Setup to select sorting options.
Autosize Select to enable the system to expand the grid to display all data when viewing or printing. Deselect to control the size of the grid manually. If Autosize is not selected, the report contains scroll bars when viewed online, or it is displayed on separate pages when printed.
Grid POV Select to display the grid POV bar. The grid POV bar is displayed below the grid title bar.
Page Beak Before Select to insert a page break above the grid. The grid is printed on the following page.
Link to Source Object This check box is only enabled after the grid is saved to the repository and the Link to Source Object check box is selected. Deselect it to unlink the grid from its source object in the repository.
CAUTION! You cannot reverse this action.
Table 56 Grid Properties - Suppression Category
Item Use
Hide Grid Select to hide, but not remove, the grid. The grid's title bar turns gray on the Design tab.
Table 55 Grid Properties Sheet (Continued)
Item Use
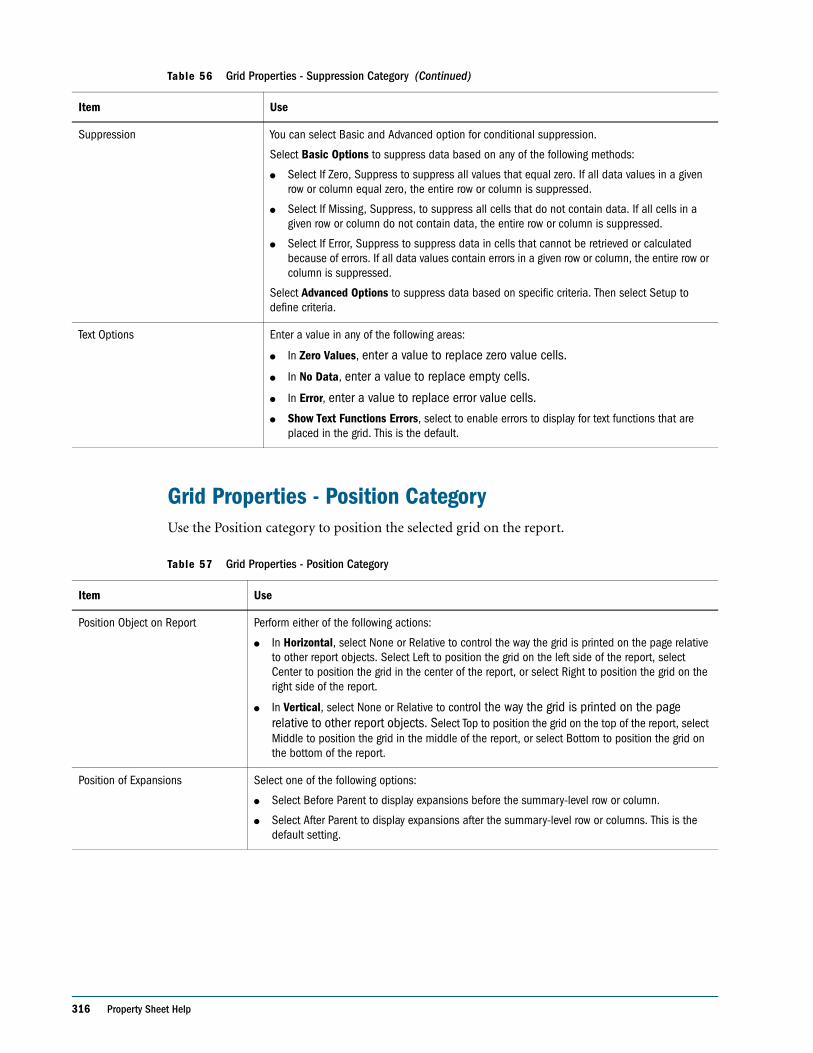
316 Property Sheet Help
Grid Properties - Position CategoryUse the Position category to position the selected grid on the report.
Suppression You can select Basic and Advanced option for conditional suppression.
Select Basic Options to suppress data based on any of the following methods:
● Select If Zero, Suppress to suppress all values that equal zero. If all data values in a given row or column equal zero, the entire row or column is suppressed.
● Select If Missing, Suppress, to suppress all cells that do not contain data. If all cells in a given row or column do not contain data, the entire row or column is suppressed.
● Select If Error, Suppress to suppress data in cells that cannot be retrieved or calculated because of errors. If all data values contain errors in a given row or column, the entire row or column is suppressed.
Select Advanced Options to suppress data based on specific criteria. Then select Setup to define criteria.
Text Options Enter a value in any of the following areas:
● In Zero Values, enter a value to replace zero value cells.
● In No Data, enter a value to replace empty cells.
● In Error, enter a value to replace error value cells.
● Show Text Functions Errors, select to enable errors to display for text functions that are placed in the grid. This is the default.
Table 57 Grid Properties - Position Category
Item Use
Position Object on Report Perform either of the following actions:
● In Horizontal, select None or Relative to control the way the grid is printed on the page relative to other report objects. Select Left to position the grid on the left side of the report, select Center to position the grid in the center of the report, or select Right to position the grid on the right side of the report.
● In Vertical, select None or Relative to control the way the grid is printed on the page relative to other report objects. Select Top to position the grid on the top of the report, select Middle to position the grid in the middle of the report, or select Bottom to position the grid on the bottom of the report.
Position of Expansions Select one of the following options:
● Select Before Parent to display expansions before the summary-level row or column.
● Select After Parent to display expansions after the summary-level row or columns. This is the default setting.
Table 56 Grid Properties - Suppression Category (Continued)
Item Use
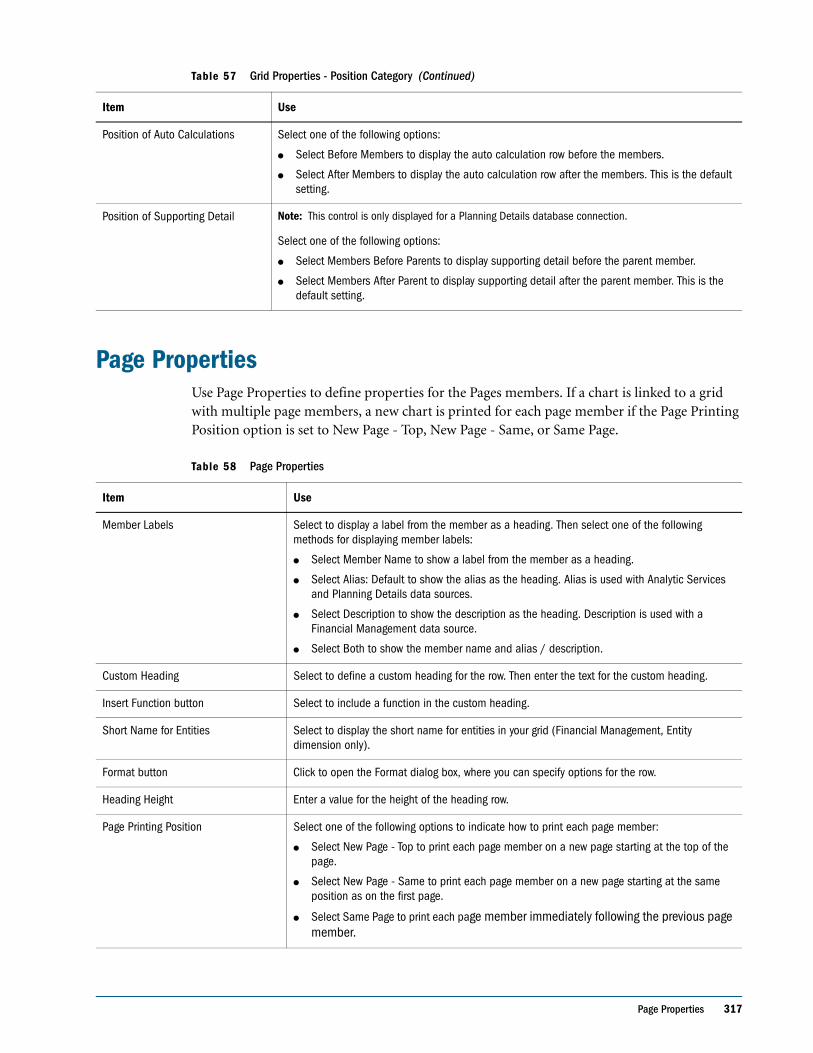
Page Properties 317
Page PropertiesUse Page Properties to define properties for the Pages members. If a chart is linked to a grid with multiple page members, a new chart is printed for each page member if the Page Printing Position option is set to New Page - Top, New Page - Same, or Same Page.
Position of Auto Calculations Select one of the following options:
● Select Before Members to display the auto calculation row before the members.
● Select After Members to display the auto calculation row after the members. This is the default setting.
Position of Supporting Detail Note: This control is only displayed for a Planning Details database connection.
Select one of the following options:
● Select Members Before Parents to display supporting detail before the parent member.
● Select Members After Parent to display supporting detail after the parent member. This is the default setting.
Table 58 Page Properties
Item Use
Member Labels Select to display a label from the member as a heading. Then select one of the following methods for displaying member labels:
● Select Member Name to show a label from the member as a heading.
● Select Alias: Default to show the alias as the heading. Alias is used with Analytic Services and Planning Details data sources.
● Select Description to show the description as the heading. Description is used with a Financial Management data source.
● Select Both to show the member name and alias / description.
Custom Heading Select to define a custom heading for the row. Then enter the text for the custom heading.
Insert Function button Select to include a function in the custom heading.
Short Name for Entities Select to display the short name for entities in your grid (Financial Management, Entity dimension only).
Format button Click to open the Format dialog box, where you can specify options for the row.
Heading Height Enter a value for the height of the heading row.
Page Printing Position Select one of the following options to indicate how to print each page member:
● Select New Page - Top to print each page member on a new page starting at the top of the page.
● Select New Page - Same to print each page member on a new page starting at the same position as on the first page.
● Select Same Page to print each page member immediately following the previous page member.
Table 57 Grid Properties - Position Category (Continued)
Item Use
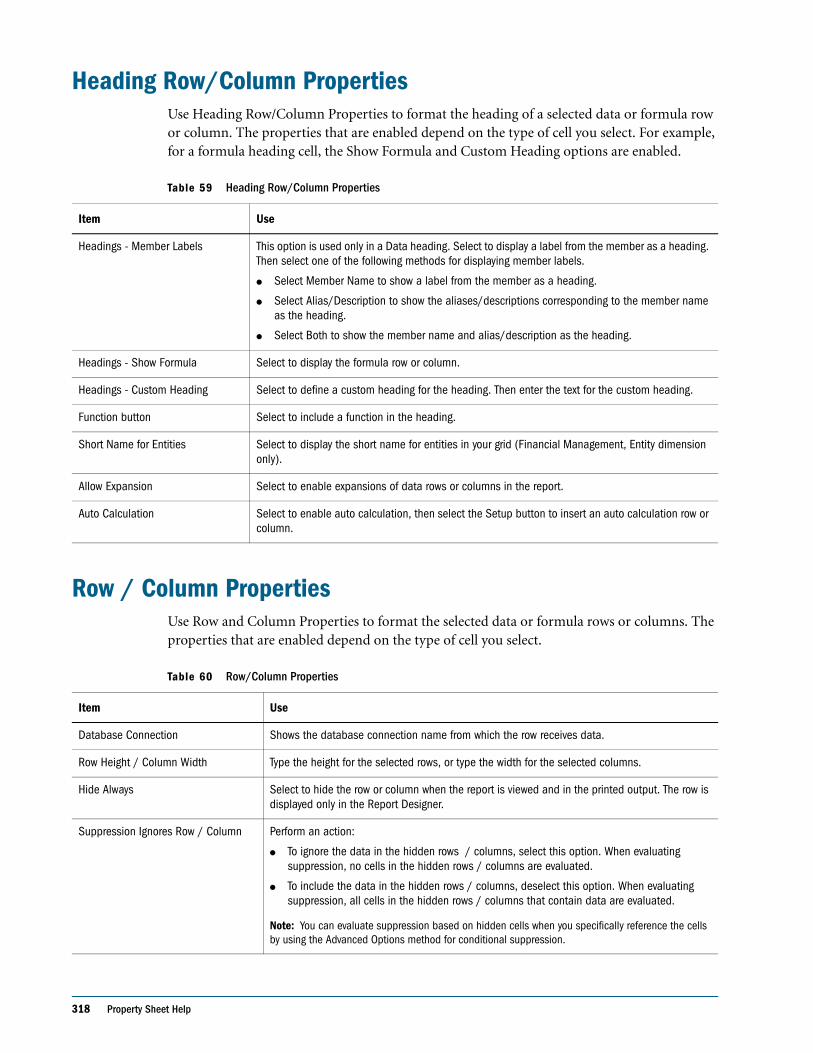
318 Property Sheet Help
Heading Row/Column PropertiesUse Heading Row/Column Properties to format the heading of a selected data or formula row or column. The properties that are enabled depend on the type of cell you select. For example, for a formula heading cell, the Show Formula and Custom Heading options are enabled.
Row / Column PropertiesUse Row and Column Properties to format the selected data or formula rows or columns. The properties that are enabled depend on the type of cell you select.
Table 59 Heading Row/Column Properties
Item Use
Headings - Member Labels This option is used only in a Data heading. Select to display a label from the member as a heading. Then select one of the following methods for displaying member labels.
● Select Member Name to show a label from the member as a heading.
● Select Alias/Description to show the aliases/descriptions corresponding to the member name as the heading.
● Select Both to show the member name and alias/description as the heading.
Headings - Show Formula Select to display the formula row or column.
Headings - Custom Heading Select to define a custom heading for the heading. Then enter the text for the custom heading.
Function button Select to include a function in the heading.
Short Name for Entities Select to display the short name for entities in your grid (Financial Management, Entity dimension only).
Allow Expansion Select to enable expansions of data rows or columns in the report.
Auto Calculation Select to enable auto calculation, then select the Setup button to insert an auto calculation row or column.
Table 60 Row/Column Properties
Item Use
Database Connection Shows the database connection name from which the row receives data.
Row Height / Column Width Type the height for the selected rows, or type the width for the selected columns.
Hide Always Select to hide the row or column when the report is viewed and in the printed output. The row is displayed only in the Report Designer.
Suppression Ignores Row / Column Perform an action:
● To ignore the data in the hidden rows / columns, select this option. When evaluating suppression, no cells in the hidden rows / columns are evaluated.
● To include the data in the hidden rows / columns, deselect this option. When evaluating suppression, all cells in the hidden rows / columns that contain data are evaluated.
Note: You can evaluate suppression based on hidden cells when you specifically reference the cells by using the Advanced Options method for conditional suppression.
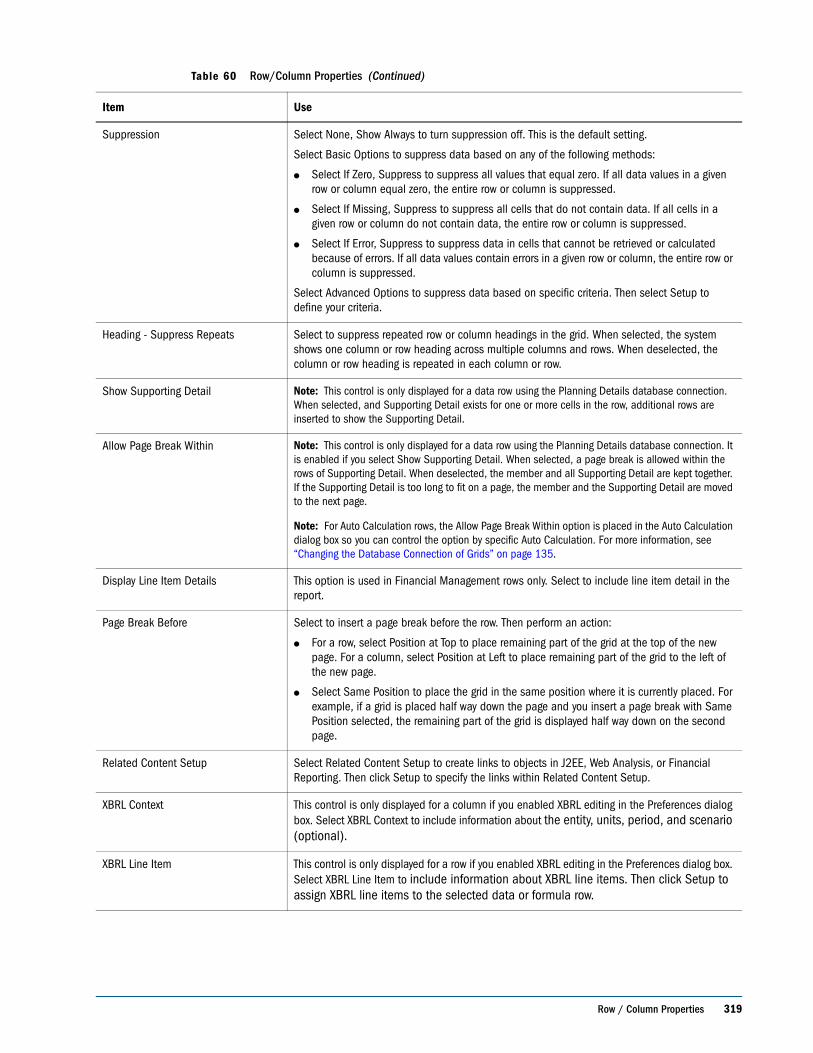
Row / Column Properties 319
Suppression Select None, Show Always to turn suppression off. This is the default setting.
Select Basic Options to suppress data based on any of the following methods:
● Select If Zero, Suppress to suppress all values that equal zero. If all data values in a given row or column equal zero, the entire row or column is suppressed.
● Select If Missing, Suppress to suppress all cells that do not contain data. If all cells in a given row or column do not contain data, the entire row or column is suppressed.
● Select If Error, Suppress to suppress data in cells that cannot be retrieved or calculated because of errors. If all data values contain errors in a given row or column, the entire row or column is suppressed.
Select Advanced Options to suppress data based on specific criteria. Then select Setup to define your criteria.
Heading - Suppress Repeats Select to suppress repeated row or column headings in the grid. When selected, the system shows one column or row heading across multiple columns and rows. When deselected, the column or row heading is repeated in each column or row.
Show Supporting Detail Note: This control is only displayed for a data row using the Planning Details database connection. When selected, and Supporting Detail exists for one or more cells in the row, additional rows are inserted to show the Supporting Detail.
Allow Page Break Within Note: This control is only displayed for a data row using the Planning Details database connection. It is enabled if you select Show Supporting Detail. When selected, a page break is allowed within the rows of Supporting Detail. When deselected, the member and all Supporting Detail are kept together. If the Supporting Detail is too long to fit on a page, the member and the Supporting Detail are moved to the next page.
Note: For Auto Calculation rows, the Allow Page Break Within option is placed in the Auto Calculation dialog box so you can control the option by specific Auto Calculation. For more information, see “Changing the Database Connection of Grids” on page 135.
Display Line Item Details This option is used in Financial Management rows only. Select to include line item detail in the report.
Page Break Before Select to insert a page break before the row. Then perform an action:
● For a row, select Position at Top to place remaining part of the grid at the top of the new page. For a column, select Position at Left to place remaining part of the grid to the left of the new page.
● Select Same Position to place the grid in the same position where it is currently placed. For example, if a grid is placed half way down the page and you insert a page break with Same Position selected, the remaining part of the grid is displayed half way down on the second page.
Related Content Setup Select Related Content Setup to create links to objects in J2EE, Web Analysis, or Financial Reporting. Then click Setup to specify the links within Related Content Setup.
XBRL Context This control is only displayed for a column if you enabled XBRL editing in the Preferences dialog box. Select XBRL Context to include information about the entity, units, period, and scenario (optional).
XBRL Line Item This control is only displayed for a row if you enabled XBRL editing in the Preferences dialog box. Select XBRL Line Item to include information about XBRL line items. Then click Setup to assign XBRL line items to the selected data or formula row.
Table 60 Row/Column Properties (Continued)
Item Use
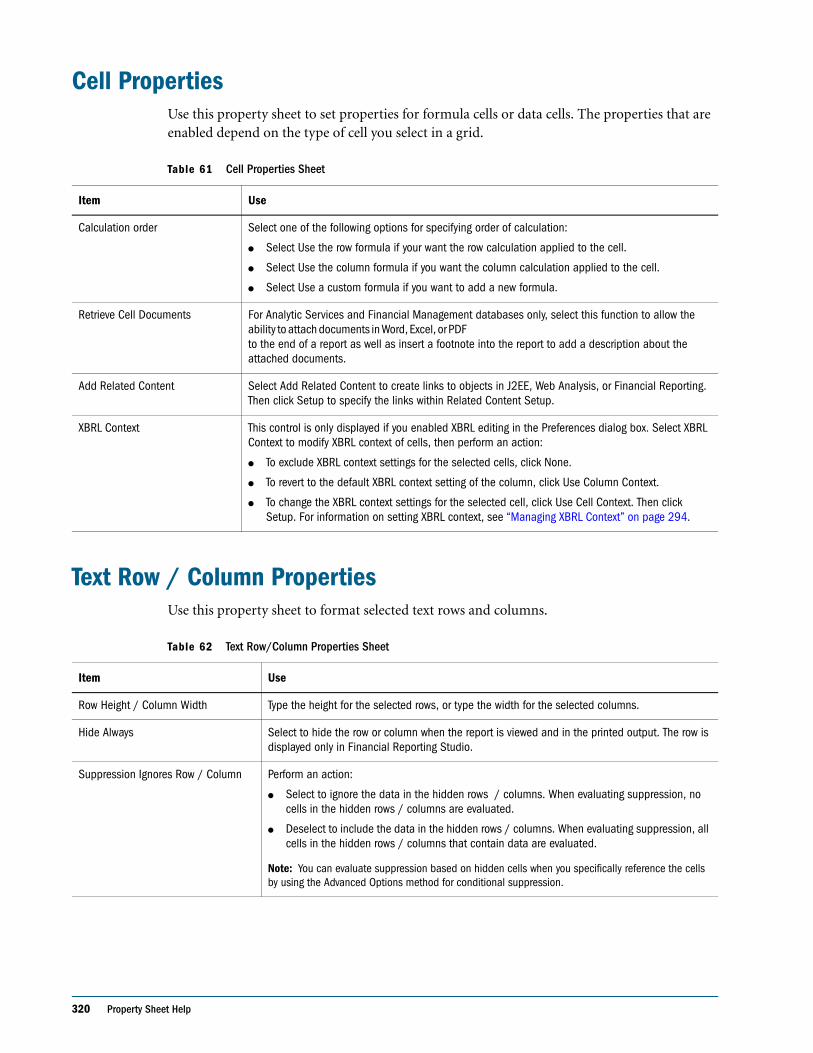
320 Property Sheet Help
Cell PropertiesUse this property sheet to set properties for formula cells or data cells. The properties that are enabled depend on the type of cell you select in a grid.
Text Row / Column PropertiesUse this property sheet to format selected text rows and columns.
Table 61 Cell Properties Sheet
Item Use
Calculation order Select one of the following options for specifying order of calculation:
● Select Use the row formula if your want the row calculation applied to the cell.
● Select Use the column formula if you want the column calculation applied to the cell.
● Select Use a custom formula if you want to add a new formula.
Retrieve Cell Documents For Analytic Services and Financial Management databases only, select this function to allow the ability to attach documents in Word, Excel, or PDF to the end of a report as well as insert a footnote into the report to add a description about the attached documents.
Add Related Content Select Add Related Content to create links to objects in J2EE, Web Analysis, or Financial Reporting. Then click Setup to specify the links within Related Content Setup.
XBRL Context This control is only displayed if you enabled XBRL editing in the Preferences dialog box. Select XBRL Context to modify XBRL context of cells, then perform an action:
● To exclude XBRL context settings for the selected cells, click None.
● To revert to the default XBRL context setting of the column, click Use Column Context.
● To change the XBRL context settings for the selected cell, click Use Cell Context. Then click Setup. For information on setting XBRL context, see “Managing XBRL Context” on page 294.
Table 62 Text Row/Column Properties Sheet
Item Use
Row Height / Column Width Type the height for the selected rows, or type the width for the selected columns.
Hide Always Select to hide the row or column when the report is viewed and in the printed output. The row is displayed only in Financial Reporting Studio.
Suppression Ignores Row / Column Perform an action:
● Select to ignore the data in the hidden rows / columns. When evaluating suppression, no cells in the hidden rows / columns are evaluated.
● Deselect to include the data in the hidden rows / columns. When evaluating suppression, all cells in the hidden rows / columns that contain data are evaluated.
Note: You can evaluate suppression based on hidden cells when you specifically reference the cells by using the Advanced Options method for conditional suppression.
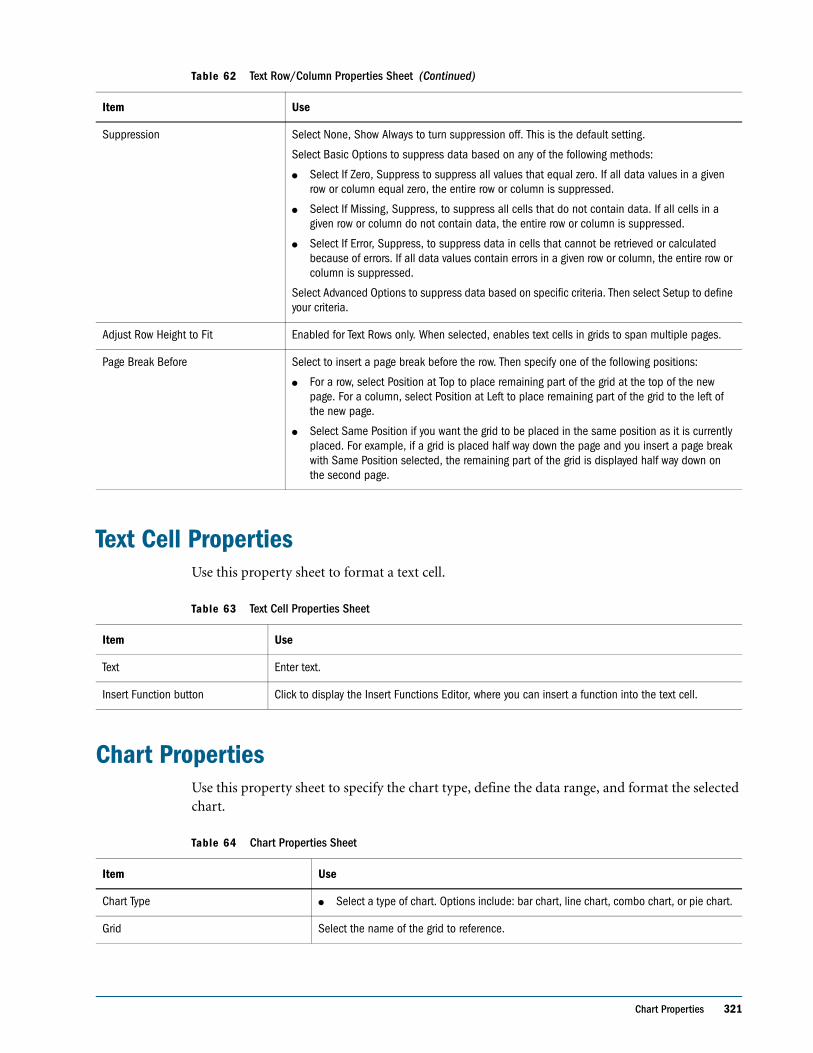
Chart Properties 321
Text Cell PropertiesUse this property sheet to format a text cell.
Chart PropertiesUse this property sheet to specify the chart type, define the data range, and format the selected chart.
Suppression Select None, Show Always to turn suppression off. This is the default setting.
Select Basic Options to suppress data based on any of the following methods:
● Select If Zero, Suppress to suppress all values that equal zero. If all data values in a given row or column equal zero, the entire row or column is suppressed.
● Select If Missing, Suppress, to suppress all cells that do not contain data. If all cells in a given row or column do not contain data, the entire row or column is suppressed.
● Select If Error, Suppress, to suppress data in cells that cannot be retrieved or calculated because of errors. If all data values contain errors in a given row or column, the entire row or column is suppressed.
Select Advanced Options to suppress data based on specific criteria. Then select Setup to define your criteria.
Adjust Row Height to Fit Enabled for Text Rows only. When selected, enables text cells in grids to span multiple pages.
Page Break Before Select to insert a page break before the row. Then specify one of the following positions:
● For a row, select Position at Top to place remaining part of the grid at the top of the new page. For a column, select Position at Left to place remaining part of the grid to the left of the new page.
● Select Same Position if you want the grid to be placed in the same position as it is currently placed. For example, if a grid is placed half way down the page and you insert a page break with Same Position selected, the remaining part of the grid is displayed half way down on the second page.
Table 63 Text Cell Properties Sheet
Item Use
Text Enter text.
Insert Function button Click to display the Insert Functions Editor, where you can insert a function into the text cell.
Table 64 Chart Properties Sheet
Item Use
Chart Type ● Select a type of chart. Options include: bar chart, line chart, combo chart, or pie chart.
Grid Select the name of the grid to reference.
Table 62 Text Row/Column Properties Sheet (Continued)
Item Use
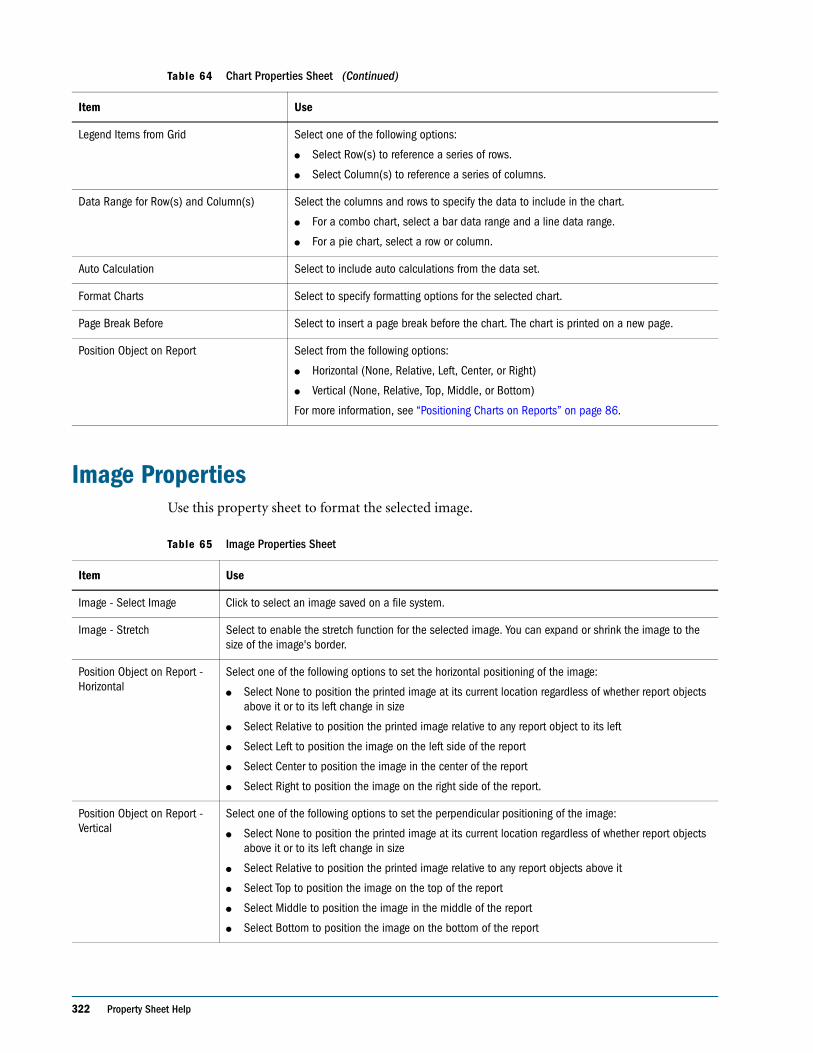
322 Property Sheet Help
Image PropertiesUse this property sheet to format the selected image.
Legend Items from Grid Select one of the following options:
● Select Row(s) to reference a series of rows.
● Select Column(s) to reference a series of columns.
Data Range for Row(s) and Column(s) Select the columns and rows to specify the data to include in the chart.
● For a combo chart, select a bar data range and a line data range.
● For a pie chart, select a row or column.
Auto Calculation Select to include auto calculations from the data set.
Format Charts Select to specify formatting options for the selected chart.
Page Break Before Select to insert a page break before the chart. The chart is printed on a new page.
Position Object on Report Select from the following options:
● Horizontal (None, Relative, Left, Center, or Right)
● Vertical (None, Relative, Top, Middle, or Bottom)
For more information, see “Positioning Charts on Reports” on page 86.
Table 65 Image Properties Sheet
Item Use
Image - Select Image Click to select an image saved on a file system.
Image - Stretch Select to enable the stretch function for the selected image. You can expand or shrink the image to the size of the image's border.
Position Object on Report - Horizontal
Select one of the following options to set the horizontal positioning of the image:
● Select None to position the printed image at its current location regardless of whether report objects above it or to its left change in size
● Select Relative to position the printed image relative to any report object to its left
● Select Left to position the image on the left side of the report
● Select Center to position the image in the center of the report
● Select Right to position the image on the right side of the report.
Position Object on Report - Vertical
Select one of the following options to set the perpendicular positioning of the image:
● Select None to position the printed image at its current location regardless of whether report objects above it or to its left change in size
● Select Relative to position the printed image relative to any report objects above it
● Select Top to position the image on the top of the report
● Select Middle to position the image in the middle of the report
● Select Bottom to position the image on the bottom of the report
Table 64 Chart Properties Sheet (Continued)
Item Use
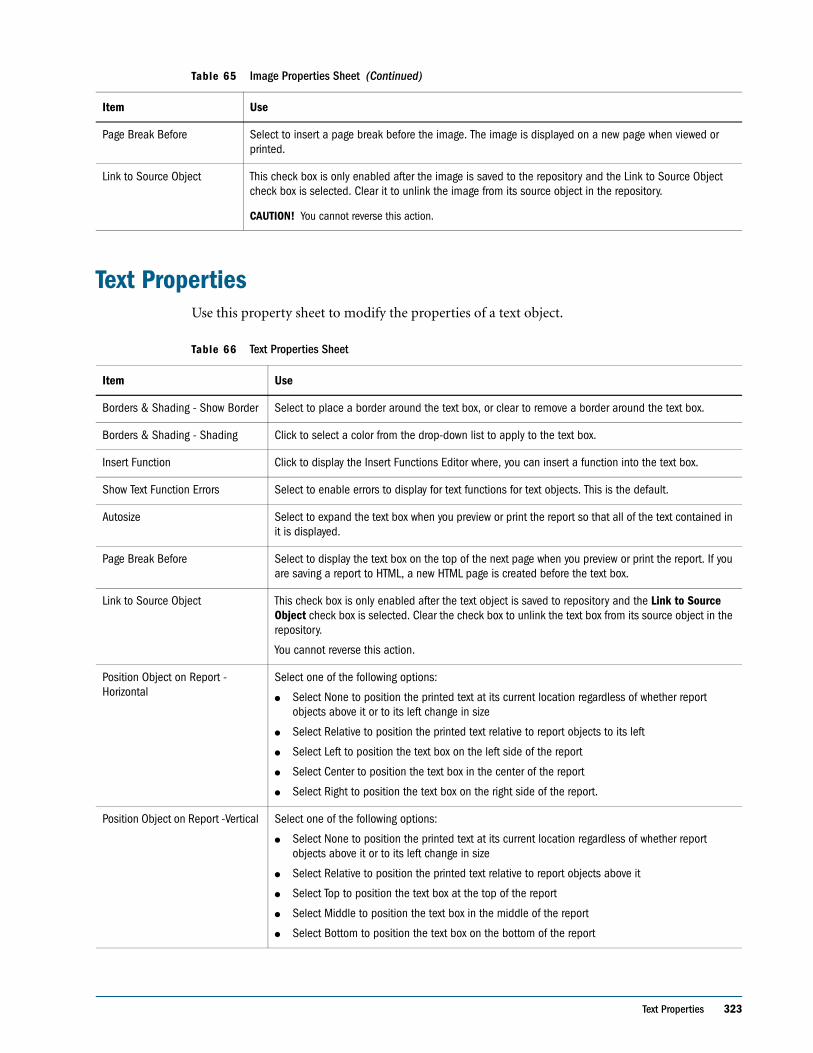
Text Properties 323
Text PropertiesUse this property sheet to modify the properties of a text object.
Page Break Before Select to insert a page break before the image. The image is displayed on a new page when viewed or printed.
Link to Source Object This check box is only enabled after the image is saved to the repository and the Link to Source Object check box is selected. Clear it to unlink the image from its source object in the repository.
CAUTION! You cannot reverse this action.
Table 66 Text Properties Sheet
Item Use
Borders & Shading - Show Border Select to place a border around the text box, or clear to remove a border around the text box.
Borders & Shading - Shading Click to select a color from the drop-down list to apply to the text box.
Insert Function Click to display the Insert Functions Editor where, you can insert a function into the text box.
Show Text Function Errors Select to enable errors to display for text functions for text objects. This is the default.
Autosize Select to expand the text box when you preview or print the report so that all of the text contained in it is displayed.
Page Break Before Select to display the text box on the top of the next page when you preview or print the report. If you are saving a report to HTML, a new HTML page is created before the text box.
Link to Source Object This check box is only enabled after the text object is saved to repository and the Link to Source Object check box is selected. Clear the check box to unlink the text box from its source object in the repository.
You cannot reverse this action.
Position Object on Report -Horizontal
Select one of the following options:
● Select None to position the printed text at its current location regardless of whether report objects above it or to its left change in size
● Select Relative to position the printed text relative to report objects to its left
● Select Left to position the text box on the left side of the report
● Select Center to position the text box in the center of the report
● Select Right to position the text box on the right side of the report.
Position Object on Report -Vertical Select one of the following options:
● Select None to position the printed text at its current location regardless of whether report objects above it or to its left change in size
● Select Relative to position the printed text relative to report objects above it
● Select Top to position the text box at the top of the report
● Select Middle to position the text box in the middle of the report
● Select Bottom to position the text box on the bottom of the report
Table 65 Image Properties Sheet (Continued)
Item Use
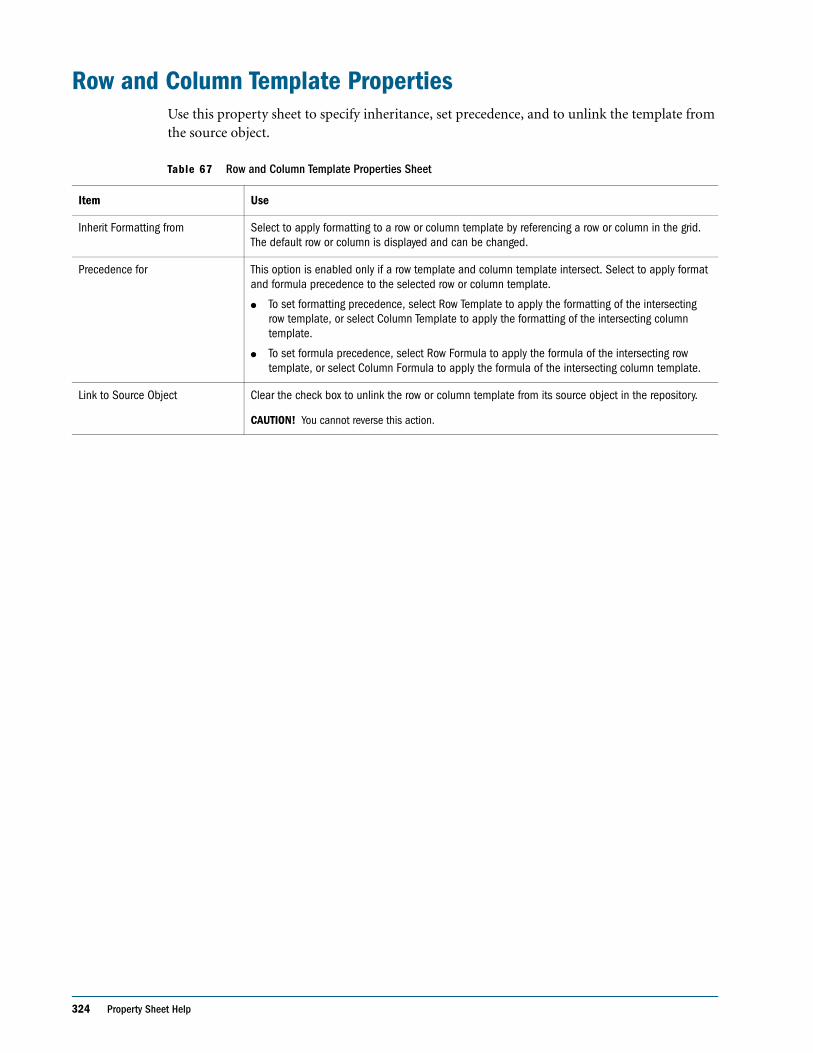
324 Property Sheet Help
Row and Column Template PropertiesUse this property sheet to specify inheritance, set precedence, and to unlink the template from the source object.
Table 67 Row and Column Template Properties Sheet
Item Use
Inherit Formatting from Select to apply formatting to a row or column template by referencing a row or column in the grid. The default row or column is displayed and can be changed.
Precedence for This option is enabled only if a row template and column template intersect. Select to apply format and formula precedence to the selected row or column template.
● To set formatting precedence, select Row Template to apply the formatting of the intersecting row template, or select Column Template to apply the formatting of the intersecting column template.
● To set formula precedence, select Row Formula to apply the formula of the intersecting row template, or select Column Formula to apply the formula of the intersecting column template.
Link to Source Object Clear the check box to unlink the row or column template from its source object in the repository.
CAUTION! You cannot reverse this action.
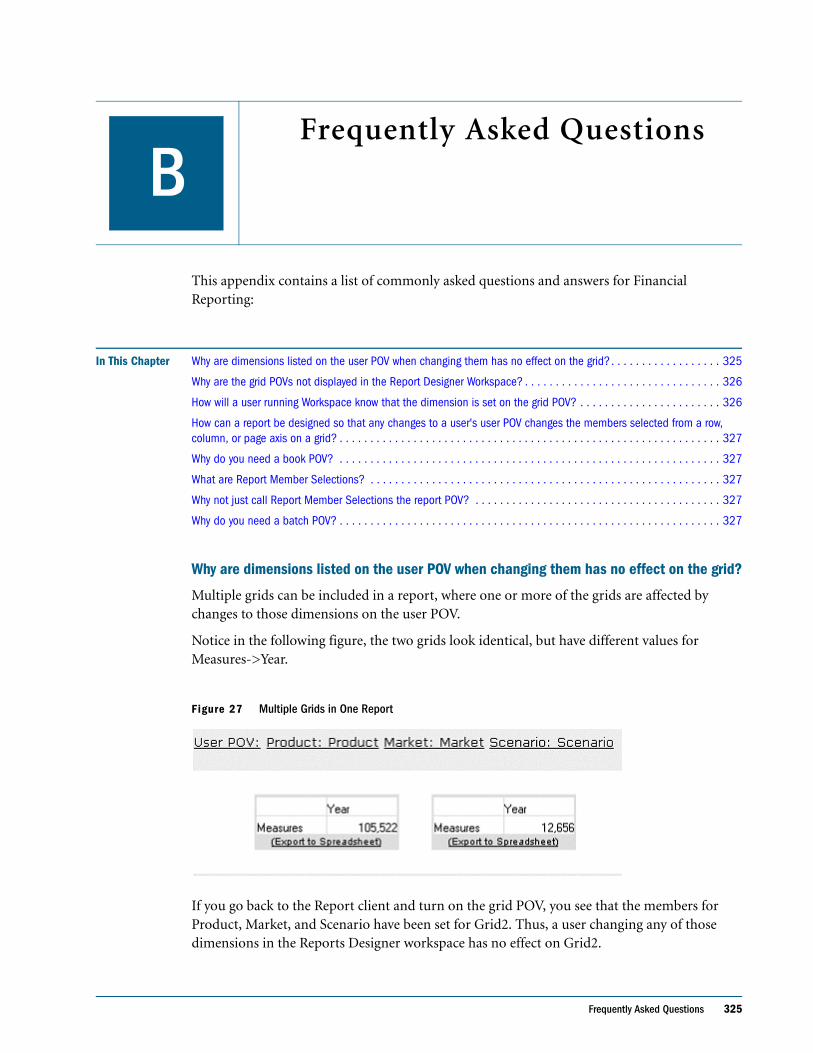
Frequently Asked Questions 325
A P P E N D I X
BFrequently Asked Questions
This appendix contains a list of commonly asked questions and answers for Financial Reporting:
In This Chapter Why are dimensions listed on the user POV when changing them has no effect on the grid?. . . . . . . . . . . . . . . . . . 325
Why are the grid POVs not displayed in the Report Designer Workspace? . . . . . . . . . . . . . . . . . . . . . . . . . . . . . . . . 326
How will a user running Workspace know that the dimension is set on the grid POV? . . . . . . . . . . . . . . . . . . . . . . . 326
How can a report be designed so that any changes to a user's user POV changes the members selected from a row, column, or page axis on a grid? . . . . . . . . . . . . . . . . . . . . . . . . . . . . . . . . . . . . . . . . . . . . . . . . . . . . . . . . . . . . . . 327
Why do you need a book POV? . . . . . . . . . . . . . . . . . . . . . . . . . . . . . . . . . . . . . . . . . . . . . . . . . . . . . . . . . . . . . . 327
What are Report Member Selections? . . . . . . . . . . . . . . . . . . . . . . . . . . . . . . . . . . . . . . . . . . . . . . . . . . . . . . . . . 327
Why not just call Report Member Selections the report POV? . . . . . . . . . . . . . . . . . . . . . . . . . . . . . . . . . . . . . . . . 327
Why do you need a batch POV? . . . . . . . . . . . . . . . . . . . . . . . . . . . . . . . . . . . . . . . . . . . . . . . . . . . . . . . . . . . . . . 327
Why are dimensions listed on the user POV when changing them has no effect on the grid?
Multiple grids can be included in a report, where one or more of the grids are affected by changes to those dimensions on the user POV.
Notice in the following figure, the two grids look identical, but have different values for Measures->Year.
Figure 27 Multiple Grids in One Report
If you go back to the Report client and turn on the grid POV, you see that the members for Product, Market, and Scenario have been set for Grid2. Thus, a user changing any of those dimensions in the Reports Designer workspace has no effect on Grid2.
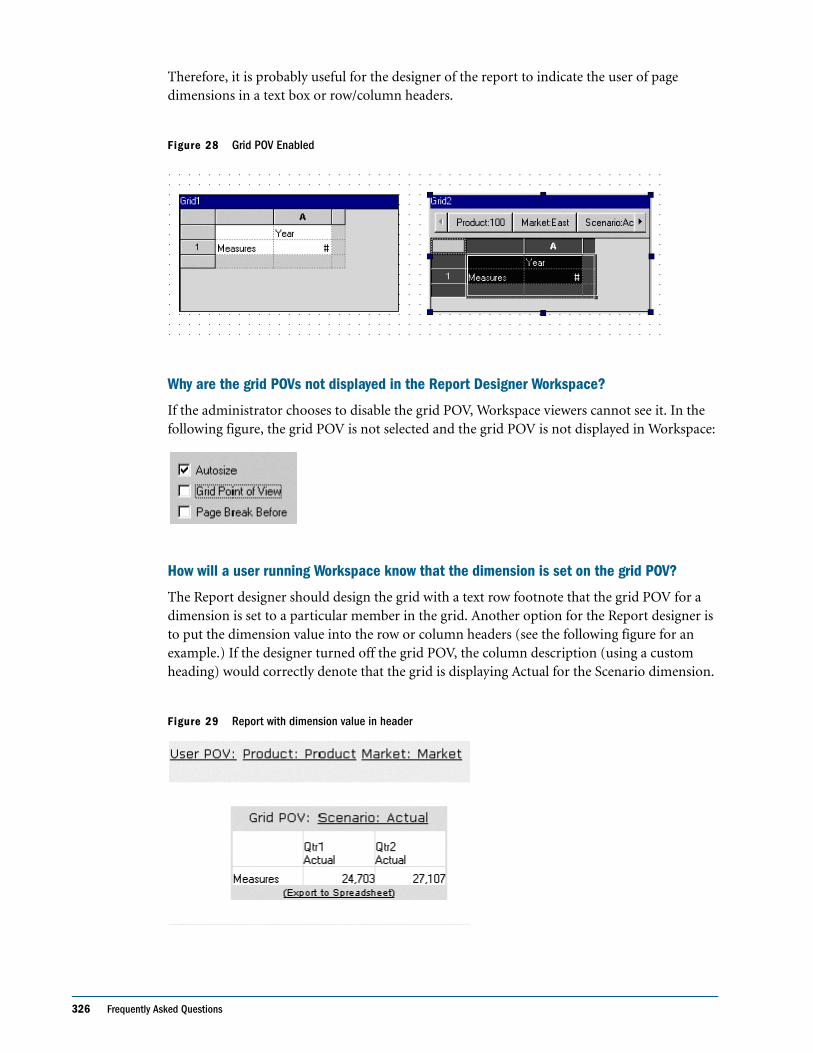
326 Frequently Asked Questions
Therefore, it is probably useful for the designer of the report to indicate the user of page dimensions in a text box or row/column headers.
Figure 28 Grid POV Enabled
Why are the grid POVs not displayed in the Report Designer Workspace?
If the administrator chooses to disable the grid POV, Workspace viewers cannot see it. In the following figure, the grid POV is not selected and the grid POV is not displayed in Workspace:
How will a user running Workspace know that the dimension is set on the grid POV?
The Report designer should design the grid with a text row footnote that the grid POV for a dimension is set to a particular member in the grid. Another option for the Report designer is to put the dimension value into the row or column headers (see the following figure for an example.) If the designer turned off the grid POV, the column description (using a custom heading) would correctly denote that the grid is displaying Actual for the Scenario dimension.
Figure 29 Report with dimension value in header
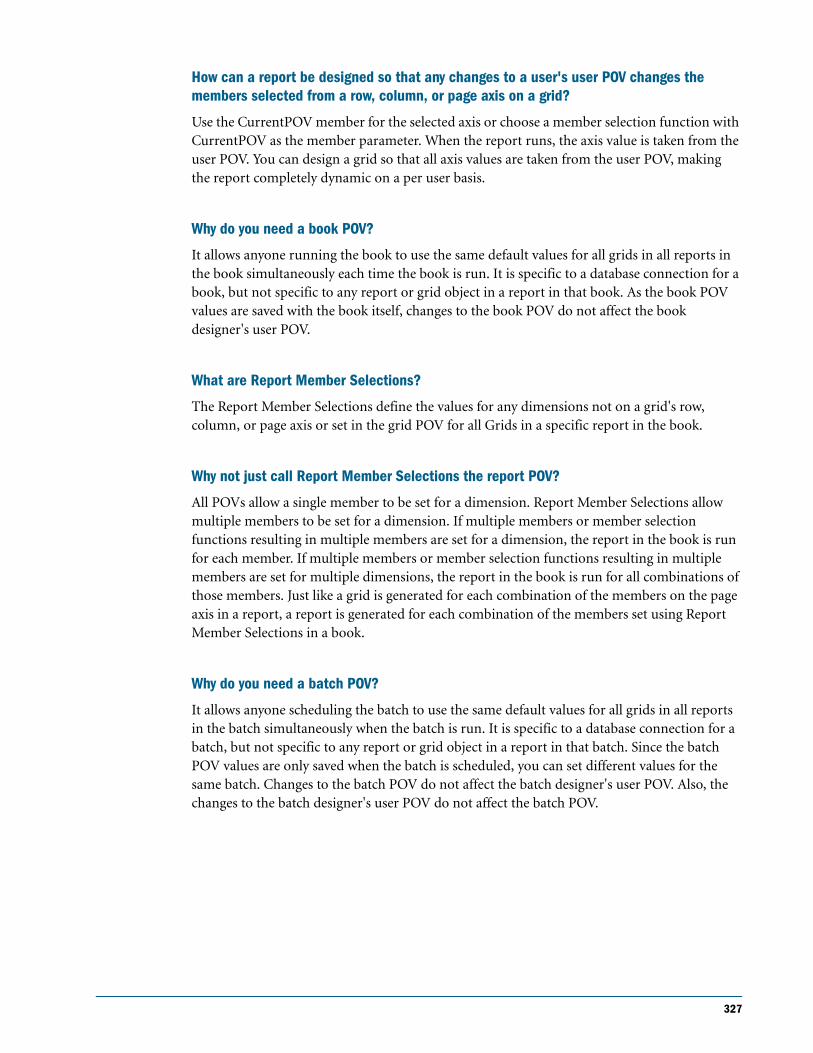
327
How can a report be designed so that any changes to a user's user POV changes the members selected from a row, column, or page axis on a grid?
Use the CurrentPOV member for the selected axis or choose a member selection function with CurrentPOV as the member parameter. When the report runs, the axis value is taken from the user POV. You can design a grid so that all axis values are taken from the user POV, making the report completely dynamic on a per user basis.
Why do you need a book POV?
It allows anyone running the book to use the same default values for all grids in all reports in the book simultaneously each time the book is run. It is specific to a database connection for a book, but not specific to any report or grid object in a report in that book. As the book POV values are saved with the book itself, changes to the book POV do not affect the book designer's user POV.
What are Report Member Selections?
The Report Member Selections define the values for any dimensions not on a grid's row, column, or page axis or set in the grid POV for all Grids in a specific report in the book.
Why not just call Report Member Selections the report POV?
All POVs allow a single member to be set for a dimension. Report Member Selections allow multiple members to be set for a dimension. If multiple members or member selection functions resulting in multiple members are set for a dimension, the report in the book is run for each member. If multiple members or member selection functions resulting in multiple members are set for multiple dimensions, the report in the book is run for all combinations of those members. Just like a grid is generated for each combination of the members on the page axis in a report, a report is generated for each combination of the members set using Report Member Selections in a book.
Why do you need a batch POV?
It allows anyone scheduling the batch to use the same default values for all grids in all reports in the batch simultaneously when the batch is run. It is specific to a database connection for a batch, but not specific to any report or grid object in a report in that batch. Since the batch POV values are only saved when the batch is scheduled, you can set different values for the same batch. Changes to the batch POV do not affect the batch designer's user POV. Also, the changes to the batch designer's user POV do not affect the batch POV.

328 Frequently Asked Questions
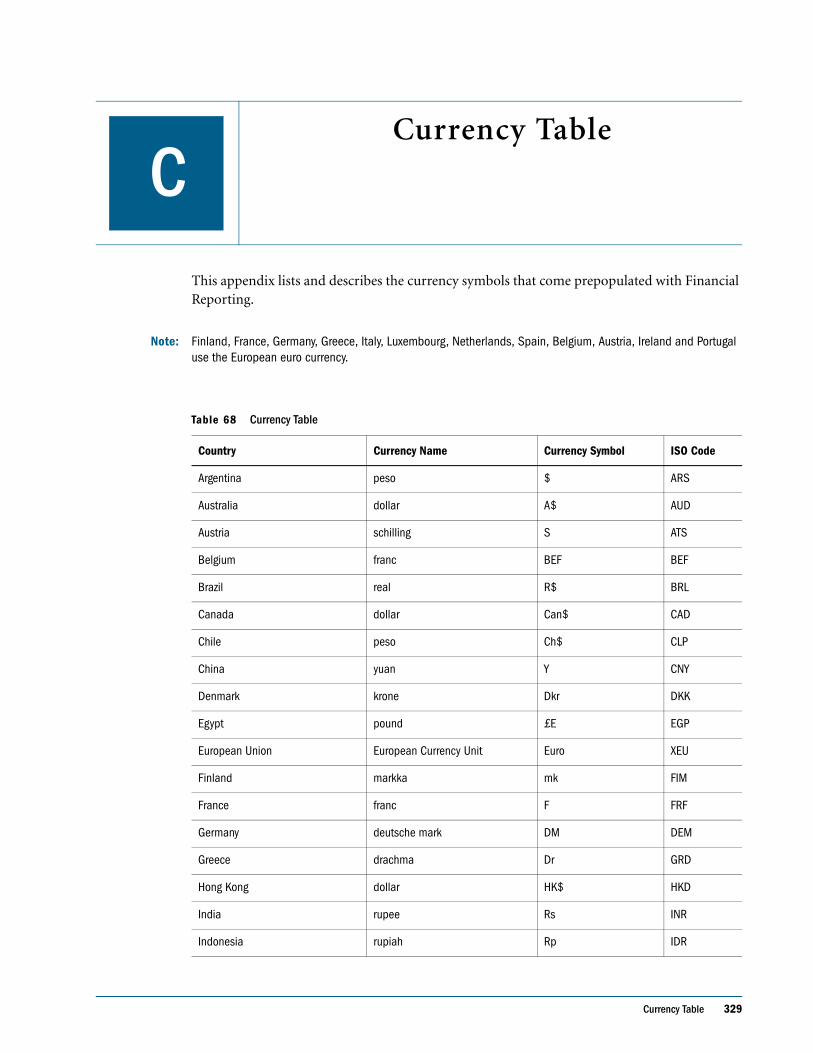
Currency Table 329
A P P E N D I X
CCurrency Table
This appendix lists and describes the currency symbols that come prepopulated with Financial Reporting.
Note: Finland, France, Germany, Greece, Italy, Luxembourg, Netherlands, Spain, Belgium, Austria, Ireland and Portugal use the European euro currency.
Table 68 Currency Table
Country Currency Name Currency Symbol ISO Code
Argentina peso $ ARS
Australia dollar A$ AUD
Austria schilling S ATS
Belgium franc BEF BEF
Brazil real R$ BRL
Canada dollar Can$ CAD
Chile peso Ch$ CLP
China yuan Y CNY
Denmark krone Dkr DKK
Egypt pound £E EGP
European Union European Currency Unit Euro XEU
Finland markka mk FIM
France franc F FRF
Germany deutsche mark DM DEM
Greece drachma Dr GRD
Hong Kong dollar HK$ HKD
India rupee Rs INR
Indonesia rupiah Rp IDR
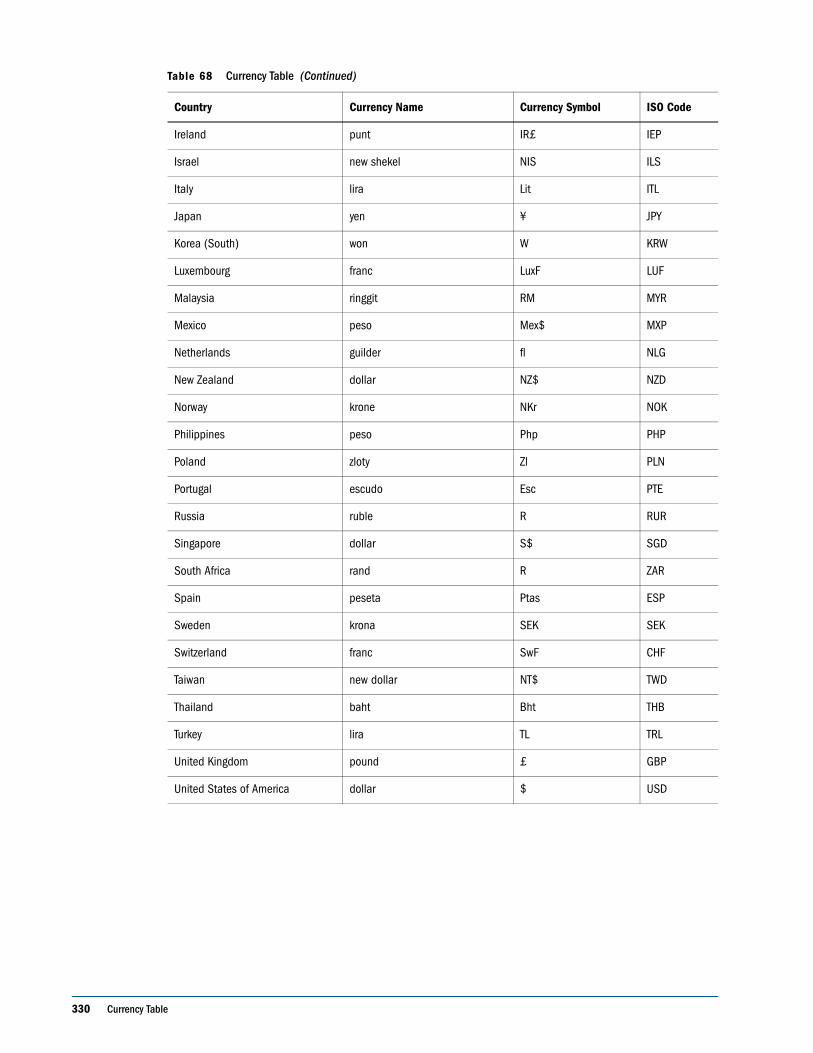
330 Currency Table
Ireland punt IR£ IEP
Israel new shekel NIS ILS
Italy lira Lit ITL
Japan yen ¥ JPY
Korea (South) won W KRW
Luxembourg franc LuxF LUF
Malaysia ringgit RM MYR
Mexico peso Mex$ MXP
Netherlands guilder fl NLG
New Zealand dollar NZ$ NZD
Norway krone NKr NOK
Philippines peso Php PHP
Poland zloty Zl PLN
Portugal escudo Esc PTE
Russia ruble R RUR
Singapore dollar S$ SGD
South Africa rand R ZAR
Spain peseta Ptas ESP
Sweden krona SEK SEK
Switzerland franc SwF CHF
Taiwan new dollar NT$ TWD
Thailand baht Bht THB
Turkey lira TL TRL
United Kingdom pound £ GBP
United States of America dollar $ USD
Table 68 Currency Table (Continued)
Country Currency Name Currency Symbol ISO Code
Glossary 331
A B C D E F G H I J K L M N O P Q R S T U V W X Y Z
Glossary
access control A security mechanism that manages a
user’s privileges or permissions for viewing, modifying,
and importing files or system resources.
access privileges The level of access-for example, view,
modify, run, full control-that the importer of an item
grants to others.
accountability map A visual, hierarchical representation
of the responsibility, reporting, and dependency structure
of your organization. An Accountability map depicts how
each accountability team in your organization interacts to
achieve strategic goals. An accountability team is also
known as a critical business area (team, department, office,
and so on.
action A task or group of tasks executed to achieve one or
more strategic objectives. In a Hyperion System 9
Performance ScorecardTM application, each action box
represents an activity or task that helps to accomplish a
strategic objective. Each action is usually assigned
measures.
actions Job output definitions for an Interactive
Reporting job is defined in terms of a series of actions.
active group A group that is entitled to access the system.
active service A service whose Run Type is set to Start
rather than Hold.
active user A user who is entitled to access the system.
active user/user group The user or user group identified
as the current user by user preferences. Determines default
user preferences, dynamic options, access, and file
permissions. You can set the active user to your user ID or
any user group to which you belong.
adaptive states Interactive Reporting level of permission.
There are six levels of permission: view only, view and
process, analyze, analyze and process, query and process,
and datamodel and analyze.
aggregate cell A cell comprising several cells. For example,
a data cell that uses Children(Year) expands to four cells
containing Quarter 1, Quarter 2, Quarter 3, and Quarter 4
data.
aggregate limit A limit placed on an aggregated request
line item or aggregated metatopic item.
alias An alternative name.
Analysis Server Web Analysis Server. An application
server program that distributes report information and
enables Web client communication with data sources.
Analyze The main Web Analysis interface for analysis,
presentation and reporting.
appender A Log4j term for destination.
application A program running within a system.
application server A middle-tier server that is used to
deploy and run Web-based application processes.
asymmetric analysis A report characterized by groups of
members that differ by at least one member across groups.
The number and names of members can differ.
attribute Characteristics of dimension members that are
not stored in the data source but calculated on demand.
You can select, group, or calculate members that have a
specified attribute. For example, an Employee Number
dimension member may have attributes of Name, Age, or
Address.
attribute dimension A type of dimension that enables
analysis based on the attributes or qualities of dimension
members.
332 Glossary
A B C D E F G H I J K L M N O P Q R S T U V W X Y Z
authentication service A core service that manages one
authentication system.
authentication service repository (ASR) A database that
contains a complete model of users/groups in an external
system.
authentication system A security measure designed to
validate and manage users and groups.
axis A two-dimensional report aspect used to arrange and
relate multidimensional data, such as filters, pages, rows,
and columns.
bar chart A chart that can consist of one to 50 data sets,
with any number of values assigned to each data set. Data
sets are displayed as groups of corresponding bars, stacked
bars, or individual bars in separate rows.
batch POV A collection of all the dimensions on the user
POV of every report and book in the batch. While
scheduling the batch, you can set the members selected on
the batch POV.
book A container that holds a group of similar Financial
Reporting documents. Books may specify dimension
sections or dimension changes.
book POV The dimension members for which a book is
run. A book is a collection of Financial Reporting
documents that may have dimensions on the User POV.
Any dimension on a report’s user POV is added to the
book POV and defined there. The member for a
dimension on the book POV can be one of the following
items: (a) User POV. This means the member is set by the
end user just before the book is run. (b) A specific
member. If a specific member is chosen, then the selection
is stored in the book definition and can only be altered in
the Book Editor. (c) A set of member selections. A
dimension left on the user POV of a report may be iterated
over within the book. For example, a report may be run for
four entities within one book.
bookmark A link to a reporting document or a Web site,
displayed on a personal page of a user. The two types of
bookmarks are My Bookmarks and image bookmarks.
bounding rectangle The perimeter that encapsulates the
Interactive Reporting document content when embedding
Interactive Reporting document sections in a personal
page. It is required by the Interactive Reporting to generate
HTML and is specified in pixels for height and width or
row per page.
calculation The process of aggregating data, or of running
a calculation script on a database.
calculation script A set of instructions telling Hyperion
Essbase how to aggregate and extrapolate the values of a
database.
Catalog pane A pane displaying a list of elements available
to the active section. For example, if Query is the active
section, the Catalog pane displays a list of database tables.
If Pivot is the active section, the Catalog pane displays a list
of results columns. If Hyperion System 9 BI+ Dashboard
Development ServicesTM, is the active section, the Catalog
pane displays a list of embeddable sections, graphic tools,
and control tools.
categories Groupings by which data is organized (for
example, month).
cause and effect map A map that depicts how the
elements that form your corporate strategy are interrelated
and how they work together to meet your organization’s
strategic goals. A Cause and Effect map tab is
automatically created for each of your Strategy maps.
cell A unit of data representing the intersection of
dimensions in a multidimensional database; the
intersection of a row and a column in a worksheet.
chart A graphical representation of spreadsheet data. The
visual nature of charts expedites analysis, color-coding,
and visual cues that aid comparisons. There are many
different chart types.
chart cell value Appears in the lower right corner of a
chart on pages in the Monitor and Investigate Sections.
The Editor defines the chart cell value that you see in
Enterprise Metrics. The chart cell value might display a
metric on the chart, such as Booking $, or a calculation
based on the metrics displayed on the chart, such as ratio
of Booking $ to Forecast $.
chart column Enterprise Metrics Detail charts are
displayed in columns below each Summary chart.
Chart section With a varied selection of chart types, and a
complete arsenal of OLAP tools like group and drill-down,
the Chart section is built to support simultaneous graphic
reporting and ad hoc analysis.
Chart Spotlighter A feature that enables you to color-
code charts based on some condition in Hyperion System
9 BI+ Interactive Reporting StudioTM.

Glossary 333
A B C D E F G H I J K L M N O P Q R S T U V W X Y Z
chart template A template that defines the metrics to
display in Workspace charts.
child A member that has a parent above it in the database
outline.
choice list A list of members that a report designer can
specify for each dimension when defining the report’s
point of view. A user who wants to change the point of
view for a dimension that uses a choice list can select only
the members specified in that defined member list or those
members that meet the criteria defined in the function for
the dynamic list.
client A client interface, such as Hyperion System 9. BI+
Web Analysis StudioTM or a workstation on a local area
network.
clustered bar charts Charts in which categories are viewed
side-by-side within a given category; useful for side-by-
side category analysis. Clustering is only done with vertical
bar charts.
column A vertical display of information in a grid or
table. A column can contain data from a single field,
derived data from a calculation, or textual information.
column heading A part of a report that lists members
across a page. When columns are defined that report on
data from more than one dimension, nested column
headings are produced. A member that is listed in a
column heading is an attribute of all data values in its
column.
computed item A virtual column (as opposed to a column
that is physically stored in the database or cube) that can
be calculated by the database during a query, or by
Interactive Reporting Studio in the Results section.
Computer items are calculations of new data based on
functions, data items, and operators provided in the dialog
box and can be included in reports or reused to calculate
other data.
connection file A file used to connect to a data source.
console The console is displayed on the left side of the
Enterprise Metrics workspace. The console is context
sensitive, depending on the page displayed.
content Information stored in the repository for any type
of file.
content area The Contents pane appears on the right side
of the Workspace and provides specific information for
the page that you are using.
cookie A small piece of information placed on your
computer by a Web site.
correlated subqueries Subqueries that are evaluated once
for every row in the parent query. A correlated subquery is
created by joining a topic item in the subquery with one of
the topic items in the parent query.
critical business area (CBA) An individual or a group
organized into a division, region, plant, cost center, profit
center, project team, or process; also called accountability
team or business area.
critical success factor (CSF) A capability that must be
established and sustained to achieve a strategic objective. A
CSF is owned by a strategic objective or a critical process
and is a parent to one or more actions.
cube The query result set from a multidimensional
(OLAP) data source; a logically organized subset of OLAP
database dimensions and members.
custom calendar Any calendar created by an
administrator.
custom report A complex report from the Design Report
module, composed of any combination of components.
cycle A Interactive Reporting job parameter that is used
when scheduled Interactive Reporting jobs need to process
and produce different job output with one job run.
Dashboard A collection of metrics and indicators that
provide an interactive summary of your business.
Dashboards enable you to build and deploy analytic
applications.
Dashboard Home A button that returns you to the
Dashboard section designated as the Dashboard Home
section. If you have only one Dashboard section,
Dashboard Home returns to that section. If you have
several Dashboard sections, the default Dashboard Home
is the top Dashboard section in the Catalog pane. In
Design mode, you can specify another Dashboard section
to be the Dashboard Home section.
data The values (monetary or non-monetary) associated
with the query intersection.
334 Glossary
A B C D E F G H I J K L M N O P Q R S T U V W X Y Z
data function A function that computes aggregate values
including averages, maximums, counts, and other
statistics, that summarize groupings of data. You can use
data functions to aggregate and to compute data from the
server before it reaches the Results section, or compute
different statistics for aggregated totals and items in the
other analysis sections.
data layout The data layout interface is used to edit a
query, arrange dimensions, make alternative dimension
member selections, or specify query options for the
current section or data object.
data model Any method of visualizing the informational
needs of a system.
data object A report component that displays the query
result set. The display type of a single conventional data
object can be set to spreadsheet, chart, or pinboard, and it
displays OLAP query result sets. A SQL spreadsheet data
object displays the result set of a SQL query, and the free-
form grid data object displays the result set of any data
source included in it.
data source 1. A data storage application. Varieties
include multidimensional databases, relational databases,
and files. 2. A named client-side object connecting report
components to databases. Data source properties include
database connections and queries.
database A repository within Hyperion System 9 BI+
Essbase AnalyticsTM that contains a multidimensional data
storage array. Each database consists of a storage structure
definition (outline), data, security definitions, and
optional scripts.
database connection A file that stores definitions and
properties used to connect to data sources. Database
connections enable database references to be portable and
widely used.
database function A predefined formula in a database.
default folder A user’s home folder.
descendant Any member below a parent in the database
outline. For example, in a dimension that includes years,
quarters, and months, the members Qtr2 and April are
descendants of the member Year.
Design Report An interface in Web Analysis Studio for
designing custom reports, from a library of components.
Desktop An interface that presents the icons to open
items.
detail chart A chart that provides the detailed information
that you see in a Summary chart. Detail charts appear in
the Investigate Section in columns below the Summary
charts. For example, if the Summary chart shows a Pie
chart, then the Detail charts below represent each piece of
the pie.
dimension A data category used to organize business data
for retrieval and preservation of values. Each dimension
usually contains a hierarchy of related members grouped
within it. For example, a Year dimension often includes
members for each time period, such as quarters and
months.
dimension tab In the Pivot section, the tab that enables
you to pivot data between rows and columns.
dimension table 1. A table that includes numerous
attributes about a specific business process. 2. In
Enterprise Metrics, a table in a star schema with a single
part primary key.
display type One of three Web Analysis formats saved to
the repository: spreadsheet, chart, and pinboard.
dog-ear The flipped page corner in the upper right corner
of the chart header area. You can click the dog-ear to
display a shortcut menu. The dog-ear is displayed only on
charts in the Investigate Section.
drill Allows you to investigate results reflected by a chart
in the Investigate Section. You can click a chart that
hyperlinks to a lower (more detailed) level in the
Investigate Section. This concept is called “drilling.”
drill anywhere A feature that enables you to drill into and
add items to pivot reports residing in the Results section
without returning to the Query section or trying to locate
the item in the Catalog pane. Drill Anywhere items are
broken out as new pivot label items.
drill target The data to which you are drilling. Specifying
a drill target automatically creates a hyperlink enabling
you to click the chart to obtain additional detail.
Glossary 335
A B C D E F G H I J K L M N O P Q R S T U V W X Y Z
drill to detail A feature that enables you to retrieve items
from a data model that are not in the Results section
without rerunning the original query. This feature
provides the ability to query the database interactively and
filter the data that is returned. Drill-to-detail sets a limit on
the query based on your selection and adds the returned
value as a new pivot label item automatically.
drill-down Navigation through the query result set using
the organization of the dimensional hierarchy. Drilling
down moves the user perspective from general aggregated
data to more detailed data. While default drill down
typically refers to parent-child navigation, drilling can be
customized to use other dimension member relationships.
For example, drilling down can reveal the hierarchical
relationships between year and quarters or between
quarter and months.
drill-through The navigation from a data value in one
cube to corresponding data in another cube. For example,
you can access context-sensitive transactional data. Drill
through occurs usually from the lowest point of atomicity
in a database (detail) to a next level of detail in an external
data source.
dynamic report A report containing current data. A
report becomes a dynamic report when you run it.
Edit Data An interface for changing data values and
sending edits back to Essbase Analytics.
employee Users responsible for, or associated with,
specific business objects. Employees do not necessarily
work for an organization, such as an analyst or consultant.
An employee must be associated with a user account for
authorization purposes.
ending period The ending chart period allows you to
adjust the date range shown in the chart. For example, an
ending period of “month” produces a chart that shows
information through the end of the current month.
exceptions Values that satisfy predefined conditions. You
can define formatting indicators or notify subscribing
users when an exception has been generated.
external authentication Logging on to Hyperion
applications by means of user information stored outside
the application, typically in a corporate authentication
provider such as LDAP or Microsoft Windows NTLM.
externally triggered events Non-time-based events that
are used to schedule job runs.
Extract, Transform, and Load Data source-specific
programs that are used to extract and migrate data to an
application.
extrapolation A means of showing projected figures.
Extrapolation from the current date to the end of the
current period is displayed on Enterprise Metrics charts
with a white area of the bar. If a line chart shows
extrapolation, the line that is extrapolated is dotted.
fact table The central table in a star join schema,
characterized by a foreign key and elements drawn from a
dimension table. This table typically contains numeric
data that can be related to all other tables in the schema.
filter A filter is used to limit data. While every dimension
in the cube must participate in every intersection, you can
make filter selections that focus the intersections on a
smaller portion of the cube. For example, in Interactive
Reporting Studio use a filter to exclude certain tables or
data values. In Hyperion System 9 BI+ Enterprise Metrics
StudioTM, implement a filter by adding a where clause on a
join statement.
folder A file that contains other files for the purpose of
ordering and structuring a hierarchy.
footer The text or images that are displayed at the bottom
of each page in a report. A footer can contain a page
number, date, company logo, document title or file name,
author name, and so on. Footers can contain dynamic
functions as well as static text.
format The visual characteristics of a document or a
report object.
free-form grid A data object that present OLAP,
relational, and manually entered data together and enables
you to leverage all these data sources in integrated dynamic
calculations.
generic jobs Jobs that are neither Production Reporting
nor Interactive Reporting jobs.
grid POV A means for specifying members for a
dimension on a grid without placing the dimension on the
row, column, or page intersection. A report designer can
set the POV values at the grid level, preventing the user
POV from affecting that particular grid. If a dimension has
only one value for the entire grid, the dimension should be
put into the grid POV instead of the row, column, or page.
336 Glossary
A B C D E F G H I J K L M N O P Q R S T U V W X Y Z
group A construct that enables the assignment of users
with similar system access requirements.
grouping columns A feature in the Results and Table
sections that creates a new column in a dataset by
grouping data from an already existing column. Grouping
columns consolidate nonnumeric data values into more
general group values and map the group values to a new
column in the dataset.
header The text or images that are displayed at the top of
each page in a report. A header can contain a page
number, date, company logo, document title or file name,
author name, and so on. Headers can contain dynamic
functions as well as static text.
highlighting Depending on your configuration, you may
see highlighting applied to a chart cell value or ZoomChart
detail values. A value can be highlighted in red (indicating
the value is bad), yellow (indicating that the value is a
warning), or green (indicating the value is good).
host A server on which applications and services are
installed.
host properties Properties pertaining to a host, or if the
host has multiple Install_Homes, to an Install_Home. The
host properties are configured from the LSC.
hyperlink A link to a file, Web page, or an HTML page on
an intranet.
Hypertext Markup Language A programming language
of tags that specify how Web browsers display data.
image bookmarks Graphic links to Web personal pages or
repository items.
implied share A member with only one child, or a
member with multiple children of which only one child is
consolidated. For this reason the parent and child share
the same value.
inactive group A group that cannot access the system
because an administrator has inactivated it.
inactive service A service that has been placed on hold or
excluded from the list of services to be started.
inactive user A user who cannot access the system because
an administrator has inactivated the user account.
Install_Home A variable name for the path and directory
where Hyperion applications are installed. Refers to a
single instance of a Hyperion application when multiple
applications have been installed on the same machine.
Interactive Reporting document sections Divisions of a
Interactive Reporting document that are used to display
and analyze information in different formats (such as
Chart section and Pivot section).
Interactive Reporting files or jobs Files created by
Interactive Reporting and published into the repository as
files or as jobs. Files and jobs have different capabilities.
intersection A unit of data representing the intersection
of dimensions in a multidimensional database; also, a
worksheet cell.
Java Database Connectivity A client-server
communication protocol used by Java based clients and
relational databases. The JDBC interface provides a call-
level API for SQL-based database access.
job output Files or reports produced from running a job.
job parameters The compile time and runtime values
necessary to run a job.
job parameters Reusable, named job parameters that are
accessible only to the user who created them.
jobs A collection of documents that have special
properties and can be executed to generate output. A job
can contain Interactive Reporting documents, Production
Reporting documents or generic documents.
join A link between two relational database tables based
on common content in a column or record or a relational
database concept indicating a link between two topics. A
join typically occurs between identical or similar items
within different topics. Joins enable row records in
different tables to be linked on the basis of shared
information in a column field. For example, a row record
in the Customer table is joined to a related record in the
Orders table when the Customer ID value for the record is
the same in each table. This enables the order record to be
linked with the record of the customer who placed the
order. If you request items from unjoined topics, the
database server has no way to correlate the information
between the two tables and leads to awkward datasets and
run-on queries.
Glossary 337
A B C D E F G H I J K L M N O P Q R S T U V W X Y Z
join path A predetermined join configuration for a data
model. Administrators create join paths for users to select
the type of data model needed in a user-friendly prompt
upon processing a query. Join paths ensure that the correct
tables in a complex data model are used in a query.
JSP Java Server Pages
layer Stack a single object in relative position (sends back
and front, or brings forward or backward) to other objects.
legend box An informative box containing color-keyed
labels to identify the data categories of a given dimension.
level A hierarchical layer within the database outline or
tree structure.
line chart A chart that displays one to 50 data sets, with
automatic, uniform spacing along the X-axis. Each data set
is rendered by a line. A line chart can optionally shows
each line set stacked on the preceding ones, using either
the absolute value or a normalized value from 0 to 100
percent.
link Link files are fixed references to a specific object in
the repository. Links can reference folders, files, shortcuts,
and other links using unique identifiers. Links present
their targets in the current folder, regardless of where the
targets are located or how the targets are renamed.
linked data model Documents that are linked to a master
copy in a repository. When changes are made to the
master, users are automatically updated with the changes
when they connect their duplicate copy to the database.
linked reporting object A cell-based link to an external
file in the Analytic Services database. Linked reporting
objects can be cell notes, URLs, or files that contain text,
audio, video, or pictures. Note that support of Analytic
Services LROs in Financial Reporting applies only to cell
notes at this time (by way of Cell Text functions).
local report object A report object that is not linked to a
Financial Reporting report object in Explorer.
local results Results of other queries within the same data
model. These results can be dragged into the data model to
be used in local joins. Local results are displayed in the
catalog when requested.
locked data model Data models that cannot be modified
by a user.
logger Log4j term for where the logging message
originates; The class or component of the system in which
a log message originated.
LSC services The services that are configured with the
Local Service Configurator. They include Global Services
Manager (GSM), Local Services Manager (LSM), Session
Manager, Authentication Service, Authorization Service,
Publisher Service, and in some contexts, Data Access
Service (DAS) and Interactive Reporting Service.
Map Navigator A feature that displays your current
position on a Strategy, Accountability or Cause and Effect
map. Your current position is indicated by a red outline on
the Map Navigator.
master data model A data model that exists
independently and has multiple queries that reference it as
a source. When you use a master data model, the text
“Locked Data Model” is displayed in the Content pane of
the Query section. This means that the data model is
linked to the master data model displayed in the Data
Model section, which may be hidden by an administrator.
MDX (multidimensional expression) The language used
to give instructions to OLE DB for OLAP- compliant
databases (MS Plato), as SQL is the language used for
relational databases. When you build the OLAPQuery
section’s Outliner, Intelligence Clients translate your
requests into MDX instructions. When you process the
query, MDX is sent to the database server. The server
returns a collection of records to your desktop that answer
your query.
measures Numeric values in an OLAP database cube that
are available for analysis. Measures may be margin, cost of
goods sold, unit sales, budget amount, and so on.
member A discrete component within a dimension. A
member identifies and differentiates the organization of
similar units. For example, a time dimension might
include such members as Jan, Feb, and Qtr1.
member list A named group that references members,
functions, or other member lists within a dimension. A
member list can be system- or user-defined.
metadata A set of data that defines and describes the
properties and attributes of the data stored in a database or
used by an application. Examples of metadata are
dimension names, member names, properties, time
periods, and security.
338 Glossary
A B C D E F G H I J K L M N O P Q R S T U V W X Y Z
metric A numeric measurement computed from your
business data. Metrics help you assess the performance of
your business and analyze trends in your company. For
immediate and intuitive understanding, Enterprise
Metrics metrics display visually in charts.
MIME Type (Multipurpose Internet Mail Extension) An
attribute that describes the format of data in an item, so
that the system knows which application to launch to open
the object. A file’s mime type is determined either by the
file extension or the HTTP header. Plug-ins tell browsers
what mime types they support and what file extensions
correspond to each mime type.
minireport A minireport is a component of a report, and
includes layout, content, hyperlinks, and the actual query
or queries to load the report. Each report can include one
or more minireports.
missing data A marker indicating that data in the labeled
location either does not exist, contains no meaningful
value, or was never entered.
model In Shared Services, a file or string of content
containing an application-specific representation of data.
Models are the basic data managed by Shared Services.
Models are of two types: dimensional hierarchies, and
nondimensional application objects. Dimensional
hierarchies include information such as entities and
accounts. Nondimensional application objects include
security files, member lists, calculation scripts, and web
forms.
multidimensional database A method of organizing,
storing, and referencing data through three or more
dimensions. An individual value is the intersection of a
point for a set of dimensions.
multithreading A client-server process that enables
multiple users to work on the same applications without
interfering with each other.
native authentication The process of authenticating a
user ID and password from within the server or
application.
note Additional information associated with a box,
measure, scorecard or map element.
null value A value that is absent of data. Null values are
not equal to zero.
OLAPQuery section A document section that analyzes
and interacts with data stored in an OLAP cube. When you
use Intelligence Clients to connect to an OLAP cube, the
document immediately opens an OLAPQuery section. The
OLAPQuery section displays the structure of the cube as a
hierarchical tree in the Catalog pane.
online analytical processing (OLAP) A
multidimensional, multiuser, client-server computing
environment for users who analyze consolidated
enterprise data in real time. OLAP systems feature drill-
down, data pivoting, complex calculations, trend analysis,
and modeling.
Open Catalog Extension Files (OCE) files Files that
encapsulate database connection information. OCE files
specify the database API (ODBC, SQL*Net, etc.), database
software, the network address of the database server, and
your database username. Administrators create and
publish OCE files.
origin The intersection of two axes.
page A display of information in a grid or table often
represented by the Z-axis. A page can contain data from a
single field, derived data from a calculation, or text.
page member A member that is displayed on the page
axis.
palette A JASC compliant file with an extension of PAL.
Each palette contains 16 colors that complement each
other and can be used to set the color elements of a
dashboard.
performance indicator An image file used to represent
measure and scorecard performance based on a range you
specify; also called a status symbol. You can use the default
performance indicators or create an unlimited number of
your own.
period A time interval that is displayed along the x-axis of
a chart. Periods might be days, weeks, months, quarters or
years.
personal pages Your personal window to information in
the repository. You select what information to display, as
well as its layout and colors.
personal recurring time events Reusable time events that
are accessible only to the user who created them.
personal variable A named selection statement of
complex member selections.
Glossary 339
A B C D E F G H I J K L M N O P Q R S T U V W X Y Z
perspective A category used to group measures on a
scorecard or strategic objectives within an application. A
perspective can represent a key stakeholder (such as a
customer, employee, or shareholder/financial) or a key
competency area (such as time, cost, or quality).
pie chart A chart that shows one data set segmented in a
pie formation.
pinboard One of the three data object display types.
Pinboards are graphics, composed of backgrounds and
interactive icons called pins. Pinboards require traffic
lighting definitions.
pins Interactive icons placed on graphic reports called
pinboards. Pins are dynamic. They can change images and
traffic lighting color based on the underlying data values
and analysis tools criteria.
plot area The area bounded by the X, Y, and Z axes; For
pie charts, the rectangular area immediately surrounding
the pie.
predefined drill paths Paths that enable you to drill
directly to the next level of detail, as defined in the data
model.
presentation A playlist of Web Analysis documents.
Playlists enable reports to be grouped, organized, ordered,
distributed, and reviewed. Presentations are not reports
copied into a set. A presentation is a list of pointers
referencing reports in the repository.
primary measure A high-priority measure that is more
important to your company and business needs than many
other measures. Primary measures are displayed in the
Contents frame and have Performance reports.
private application An application for the exclusive use of
an product to store and manage Shared Services models. A
private application is created for a product during the
registration process.
Production Reporting A specialized programming
language for data access, data manipulation, and creating
Production Reporting documents.
property Characteristics of an object, such as size, color,
type.
proxy server A server that acts as an intermediary between
a workstation user and the Internet to ensure security.
public job parameters Reusable, named job parameters
created by an administrator and accessible to users who
have the requisite access privileges.
public recurring time events Reusable time events created
by an administrator and accessible through the access
control system.
range A set of values that includes an upper and lower
limit, and the values that fall between the limits. A range
can consist of numbers, amounts, or dates.
reconfigure URL URL used to reload servlet
configuration settings dynamically when a user is already
logged in to the Workspace.
recurring time event An event that specifies a starting
point and the frequency for running a job.
relational database A database that stores its information
in tables related or joined to each other by common pieces
of information called keys. Tables are subdivided into
column fields that contain related information. Column
fields have parents and children. For example, the
Customer table may have columns including Name,
Address, and ID number. Each table contains row records
that describe information about a singular entity, object,
or event, such as a person, product, or transaction. Row
records are segmented by column fields. Rows contain the
data that you retrieve from the database. Database tables
are linked by Joins. (See also join.)
report footer See footer.
report header See header.
report object A basic element in report designs. Report
objects have specific properties that define their behavior
or appearance. Report objects include text boxes, grids,
images, and charts.
Reports section A dynamic, analytical report writer, that
provides users with complex report layouts and easy-to-
use report-building tools. Pivot tables and charts can be
embedded in a report. The report structure is divided into
group headers and body areas, with each body area
containing a table of data. Tables are created with
dimension columns and fact columns. These tables are
elastic structures. Multiple tables can be ported into each
band, each originating from the same or different result
sets.

340 Glossary
A B C D E F G H I J K L M N O P Q R S T U V W X Y Z
request line A line that holds the list of items requested
from the database server and that will appear in the user’s
results.
request line items Columns listed in the request line.
resources Objects or services that the system manages.
Examples of a resource include a role, user, group, file, job,
publisher service, and so on.
result A value that an application collects for measures. If
you have the required permissions, you can use the Result
Collection report to enter or modify measure results.
result frequency The algorithm used to create a set of
dates for either the collection of data (collection
frequency) or the display of data (result frequency). The
result frequency’s algorithm is defined by: Major type (for
example, weekly, monthly, and so on.) Minor type (for
example, first, last, last Friday, 5th day of period, and so
on.) Interval (for example, every one, every two, every 5,
and so on.)
Results section A section in an Interactive Reporting
document that contains the dataset derived from a query.
Data is massaged in the Results section for use in the
report sections.
role A construct that defines the access privileges granted
in order to perform a business function; for example, the
job publisher role grants the privilege to run or import a
job.
row heading A report heading that lists members down a
report page. The members are listed under their respective
row names.
RSC services The services that are configured with the
Remote Service Configurator. They include Repository
Service, Service Broker, Name Service, Event Service, and
Job Service.
scale The range of values on the Y axis of a chart.
scale code Specification of how an individual metric or
minireport field is scaled. It may be displayed in
thousands, or multiplied by 100 in conjunction with a
percent format.
schedule Specify the job that you want to run as well as
the time and job parameter list for running the job.
score The level at which specified targets are being
achieved. It is usually expressed as a percentage of the
target for a given time period.
scorecard Business Object used to represent the progress
of an employee, strategy element, or accountability
element toward specific goals. Scorecards ascertain this
progress based on the data collected for each measure and
child scorecard you add to the scorecard.
scorecard report A report that presents the results and
detailed information about scorecards attached to
employees, strategy elements, and accountability elements.
secondary measure A low-priority measure that is less
important to you than primary measures. Secondary
measures do not have Performance reports but can be
used on scorecards and to create dimension measure
templates.
Section pane Lists all the sections that are available in the
current Intelligence Client document.
security agent A Web access management solutions
provider employed by companies to protect Web
resources; also known as Web security agent. The
Netegrity SiteMinder product is an example of a security
agent.
security platform A framework enabling Hyperion
applications to use external authentication and single sign-
on using the security platform driver.
security rights Rights defined by a user’s data access
permissions and activity-level privileges as explicitly
defined for a user and as inherited from other user groups.
services Resources that provide the ability to retrieve,
modify, add, or delete business items. Some services are
Authorization, Authentication, Global Service Manager
(GSM).
servlet A piece of compiled code executable by a Web
server.
Servlet Configurator A software utility for configuring all
of the locally installed servlets.
shortcut A pointer to an actual program or file that is
located elsewhere. You can open the program or file
through the shortcut, if you have permission.
Glossary 341
A B C D E F G H I J K L M N O P Q R S T U V W X Y Z
shortcut menu A menu that is displayed when you right-
clicks a selection, an object, or a toolbar. A shortcut menu
lists commands pertaining only to that screen region or
selection.
sibling A child member at the same generation as another
child member and having the same immediate parent. For
example, the members Florida and New York are both
children of East and siblings of each other.
Single Sign-On A feature that enables you to access
multiple Hyperion products after logging on just once
using external credentials.
SmartCut A link to an item in the repository in the form
of a special URL.
snapshot Read-only data from a specific point in time. See
snapshot report.
snapshot report A report that has been generated and that
stores static data. Any subsequent change of the data in the
data source does not affect the report content. A snapshot
report is portable and can be stored on the network,
locally, or e-mailed. See snapshot.
sort Reorder or rank result sets in ascending or
descending order.
sort order An indicator specifying the method by which
you want your data to be presented. Data is typically
shown in one of two sort orders. Ascending sort order
presents data from lowest to highest, earliest to latest, first
to last, A to Z, and so on. Descending sort order presents
data from highest to lowest, latest to earliest, last to first, Z
to A, and so on.
SPF files Printer-independent files created by an
Production Reporting server that contains a
representation of the actual formatted report output,
including fonts, spacing, headers, footers, and so on.
spreadsheet One of the three data object display types.
Spreadsheets are tabular reports of rows, columns, and
pages.
SQL spreadsheet A data object that displays the result set
of a SQL query.
stacked charts A chart where the categories are viewed on
top of one another for visual comparison. This type of
chart is useful for subcategorizing within the current
category. Stacking can be used from the Y and Z axis in all
chart types except pie and line. When stacking charts the Z
axis is used as the Fact/Values axis.
Start in Play The quickest method for creating a Web
Analysis document. The Start in Play process requires you
to specify a database connection, then assumes the use of a
spreadsheet data object. Start in Play uses the highest
aggregate members of the time and measures dimensions
to automatically populate the rows and columns axes of
the spreadsheet.
strategic objective (SO) A long-term goal defined for an
organization that is stated in concrete terms whose
progress is determined by measuring results. Each strategic
objective is associated with one perspective in your
application, has one parent, the entity, and is a parent to
critical success factors or other strategic objectives. It also
has measures associated with it.
Strategy map A detailed representations of how your
organization translates its high-level mission and vision
statements into lower-level, constituent strategic goals and
objectives.
structure view A view that displays a topic as a list of
component items allowing users to see and quickly select
individual data items. Structure view is the default view
setting.
Structured Query Language The language used to give
instructions to relational databases. When you build the
Query section’s Request, Limit, and Sort lines, Interactive
Reporting translate your requests into SQL instructions.
subscribe Register an interest in an item or folder, in
order to receive automatic notification whenever the item
or folder is updated.
subset A group of members selected by specific criteria.
substitution variable A variable that acts as a global
placeholder for information that changes regularly. You
set the variable and a corresponding string value; the value
can be changed at any time.
342 Glossary
A B C D E F G H I J K L M N O P Q R S T U V W X Y Z
Summary chart A chart that is displayed at the top of each
chart column in the Investigate Section and plots metrics
at the summary level, meaning that it rolls up all of the
Detail charts shown below in the same column. All colors
shown in a stacked bar, pie, or lines Summary chart also
appear above each Drill button of the Detail charts and
extend across the row, acting as the key.
super service A special service used by the
startCommonServices script to start the RSC services.
table The basic unit of data storage in a database.
Database tables hold all of the user-accessible data. Table
data is stored in rows and columns.
Table catalog A display of the tables, views, and synonyms
to which users have access. Users drag tables from the
Table catalog to the Content pane to create data models in
the Query section.
Table section The section used to create tabular-style
reports. It is identical in functionality to the Results
section, including grain level (table reports are not
aggregated). Other reports can stem from a Table section.
target The expected result for a measure for a specified
period of time, such as a day, quarter, month and so on.
You can define multiple targets for a single measure.
time events Triggers for execution of jobs.
time scale A scale that enables you to see the metrics by a
specific period in time, such as monthly or quarterly.
token An encrypted identification of one valid user or
group existing on an external authentication system.
toolbar A series of shortcut buttons providing quick
access to the most frequently used commands.
top and side labels In the Pivot section, the column and
row headings on the top and sides of the pivot. These
define categories by which the numeric values are
organized.
top-level member A dimension member at the top of the
tree in a dimension outline hierarchy, or the first member
of the dimension in sort order if there is no hierarchical
relationship among dimension members. The top-level
member name is generally the same name as the
dimension name if a hierarchical relationship exists.
trace level A means of defining the level of detail captured
in the log file.
traffic lighting Color-coding of report cells, or pins based
on a comparison of two dimension members, or on fixed
limits. Traffic lighting definitions are created using the
Web Analysis Traffic Light Analysis Tool.
transparent login A mechanism that enables users who
have been previously authenticated by external security
criteria to log in to a Hyperion application, bypassing the
login screen.
trend How the performance of a measure or scorecard has
changed since the last reporting period or a date that you
specify.
trusted password A password that enables users who have
been previously authenticated in another system to have
access to other applications without reentering their
passwords.
trusted user A user authenticated by some mechanism in
the environment.
Uniform Resource Locator The address of a resource on
the Internet or an intranet.
variable A value that can be modified when you run a
report. String variables are useful for concatenating two or
more database columns. Numeric variables can calculate
values based on other values in the database. Encode
variables are string variables that contain nondisplay and
other special characters.
variable limits Limits that prompt users to enter or select
limit values before the queries are processed on the
database.
Web server Software or hardware hosting intranet or
Internet Web pages or Web applications. This term often
refers to the Interactive Reporting servlets’ host, because in
many installations, the servlets and the web server software
reside on a common host. This configuration is not
required, however; the servlets and the web server software
may reside on different hosts.
weight A value assigned to an item on a scorecard that
indicates the relative importance of that item in the
calculation of the overall scorecard score. The weighting of
all items on a scorecard accumulates to 100%. For
example, to recognize the importance of developing new
features for a product, the measure for New Features
Coded on a developer’s scorecard would be assigned a
higher weighting than a measure for Number of Minor
Defect Fixes.

Glossary 343
A B C D E F G H I J K L M N O P Q R S T U V W X Y Z
ws.conf A configuration file for Windows platforms.
wsconf_platform A configuration file for UNIX
platforms.
Y axis scale The range of values on the Y axis of the charts
displayed in the Investigate Section. You can use a unique
Y axis scale for each chart, the same Y axis scale for all
Detail charts, or the same Y axis scale for all charts in the
column. Often, using a common Y axis improves your
ability to compare charts at a glance.
Zero Administration A software tool that identifies the
version number of the most up-to-date plug-in on the
server.
zoom A feature that sets the magnification of a report.
The report can be magnified to fit the whole page, page
width or a percentage of magnification based on 100%.
ZoomChart A feature that makes it easy to view detailed
information by enlarging a chart displayed on a page in the
Monitor or Investigate Section. Zooming in on a chart
enables you to see detailed numeric information on the
metric that is displayed in the chart. You can click the +
(plus sign) in the lower right corner of the chart or right-
click anywhere on the chart to enlarge it.

344 Glossary
Index A 345
A B C D E F G H I J K L M N O P Q R S T U V W X Y Z
Index
AAbs function, 226
absolute operand, 279
adding report objects
charts, 103
grids, 98
images, 102
text boxes, 96
aggregate property argument, 217
allow expansions
Hyperion Financial Management and Hyperion Analytic Services, 162
Analytic Services, sparse command, 39
application name, retrieving, 233
applying formatting
calculated columns, 140
calculated data rows, 140
argument, expressing the range, 145
arguments
cell reference, 215
column reference, 215
embedded functions, 219
numeric, 215
property, 217
row reference, 215
Available area, 45
Available Options menu, 46
Average function, 227
AverageA function, 228
axes
angling labels, 79
metadata labels, 79
axes titles, defining for charts, 88
Bbar charts
options, 82
overview, 72
batch jobs
defining, 287
batch jobs, defining, 287
batch processing, overview, 287
batches of reports, printing, 174
best practices
formatting grids, 180
books
changing data source for, 284
importing, 305
previewing in the Web, 173
borders
adding to text boxes, 179
formatting, 179
bring to front, objects, 106
CCalcStatus function, 228
calculated data rows and columns
applying formatting, 140
calculations, cell level, 153
cell formatting, Format Painter, 189
cell reference arguments, 215
cells
accessing in a linked report, 166
calculating, 153
defining formulas in, 153
described, 23
merging, 202
CellText function, 229
346 Index D
A B C D E F G H I J K L M N O P Q R S T U V W X Y Z
changing, data source, 135
chart options
bar charts, 82
line charts, 83
chart types
bar chart, 72
line chart, 73
pie chart, 74
charts
adding to reports, 103
customizing axes titles in, 89
customizing overview, 71
defining a chart’s position, 86
defining data, 76
defining legends, 89
defining titles, 88
described, 22
overlapping, 106
positioning on a report, 86
circular referencing
multiple calculation iterations, 148
closing
Designer, 31
Studio Explore, 31
column headings
defining in grids, 116
displaying on each page, 210
column reference arguments, 215
column reference operand, 279
column width, 201
columns
described, 23
expanded, 143
expanding, 162
hiding, 190
inserting into grids, 114
sorting, 191
sorting in grids, 191
specifying width of, 201
subtotaling in grids, 136
combo charts, described, 73
conditional formatting
adding formats, 200
applying on grids, 196
changing order of formats, 200
comparison options, 198
deleting formats, 201
properties, 196
reference values, 198
conditional suppression, 202
deleting, 209
consulting services, xvii
Count function, 232
CountA function, 233
creating reports, overview, 93
currency symbol table, 329
Current keyword, 221
customizing
axes titles in charts, 89
row and column headings, 116
cut, copy, and paste
grids, 115
repository items, 283
Ddata
accessing from a linked report, 166
assigning sources for a grid, 136
changing source for a grid, 135
suppressing, 202
using the GetCell function, 239
data prompts
defining for a batch of reports, 287
responding to, 172
data query optimization options, setting, 126
data rows and columns, subtotaling, 136
data source
changing, 284
changing for a grid, 135
retrieving the name, 233
specifying multiple for a grid, 136
data source, changing, 135
database connection
changing, 284
managing, 283
database name, retrieving, 233
database retrieval operand, 279
DataSource function, 233
date
format characters, 235
Index E 347
A B C D E F G H I J K L M N O P Q R S T U V W X Y Z
retrieving current, 266 to 267
Date function, 235
defining
batch jobs, 287
chart data, 76
chart legends, 89
chart titles, 88
deleting
conditional suppression, 209
report objects from the report, 108
reports from books, 305
reports from the workspace library, 283
selected members, 62
Designer
creating new reports, 28
described, 24
toolbar, 32
designing reports,headers and footers, 108
detail
accessing in a linked report, 166
viewing in a grid, 162
Difference function, 237
dimension hierarchy
viewing, 45
dimensions
retrieving, 241
validating that data sources have the same, 284
displaying
line item detail, 129
supporting detail, 129
documentation
where to find, xiv
documents
feedback, xvii
documents, accessing
Hyperion Download Center, xv
downloading, XBRL taxonomies, 291
Dynamic Time Series (DTS) function, 59
DynamicMemberList, 58
EEdit, 34
Edit menu, 34
editing
hierarchical functions, 61
member lists, 65
report formats, 178
education services, xvii
e-mails, sending links to reports via, 283
embedded functions arguments, 219
Eval function, 238
Exit command, 34
Exiting, 31
exiting Hyperion Financial Reporting Studio, 31
expanding rows or columns, using, 143
expansions
Analytic Services, 129
see related content, 167
exporting, instance document, 303
expressions
operands in, 278
using, 277, 279
FFile menu, 34
filters, defining, 63
Financial Reporting
components, 20
overview, 19
finding members, 65
folders, creating, 281
fonts, specifying, 178
footers
described, 23
designing, 108
Format Chart
appearance, 79
axes, 79
bar options, 79
element style, 79
legend, 79
line and bar (combo) options, 80
line options, 79
pie options, 80
Format menu, 36
Format Painter, copy cell formatting, 189
formatting
cells using inheritance, 188
columns, 201
date and time function, 235
348 Index G
A B C D E F G H I J K L M N O P Q R S T U V W X Y Z
grid, 201
images, 209
pages, 210
shading and borders, 179
suppressing data, 202
text, 178
formatting grids
aligning text in grids, 182
best practices, 180
formatting numbers in grids, 180
modifying font options, 184
replacing text, 187
Formatting Grids, adding borders or shading, 185
formula bar
accessing, 150
creating formulas, 150
deleting a formula, 152
editing a formula, 151
function help, 151
member selection, 148
modifying member selection, 152
using, 148
formula rows and columns
defining headings, 143
formulas
adding to rows and columns, 141
function operand, 279
functions
Abs, 226
Average, 227
AverageA, 228
CalcStatus, 228
CellText, 229
Count, 232
CountA, 233
DataSource, 233
Date, 235
Eval, 238
GetCell, 239
GetHeading, 240
GridDimension, 241
HFMCurrency, 242
IfThen, 245
Max, 248
MemberAlias, 249
MemberDescription, 250
MemberName, 251 to 252
MemberProperty, 252
MemberQualifiedName, 254
Min, 255
Mod, 255
Page, 256
PageCount, 257
PercentOfTotal, 257
Pi, 258
PlanningAnnotations, 258
POVAlias, 261
POVDescription, 261
POVMember, 262
ProcessManagementStatus, 262
Product, 263
Random, 264
ReportAuthor, 265
ReportCreated, 266
ReportDesc, 266
ReportFolder, 266
ReportModified, 267
ReportModifiedBy, 267
ReportName, 268
ReportRunBy, 268
Round, 268
Sqrt, 269
Sum, 269
Truncate, 270
Variance, 271
VariancePercent, 274
functions, editing, 61
GGetCell function, 239
GetHeading function, 240
graphics, adding to reports, 102
grid
zoom, 40, 180
grid data source, retrieving, 233
grid rows and columns
defining formulas on, 141
expanding, 143
subtotaling, 136
Index H 349
A B C D E F G H I J K L M N O P Q R S T U V W X Y Z
GridDimension function, 241
grids
adding to reports, 98
calculating at the cell level, 153
column width, 201
cut, copy, and paste, 115
data sources for, 135 to 136
defining, 98
described, 22
hiding, 190
inserting page breaks, 133
inserting rows and columns in, 114
overlapping, 106
row height, 201
viewing detailed data in, 162
Hheaders
described, 22
designing, 108
headings
customizing, 116
defining in grids, 134
displaying on each page, 210
height of columns, specifying, 201
Help menu, 37
HFMCurrency function, 242
hiding grids, 190
hierarchy, viewing, 45
Hyperion Consulting Services, xvii
Hyperion Download Center, accessing documents, xv
Hyperion Education Services, xvii
Hyperion Financial Reporting, user tasks, 27
Hyperion product information, xvii
Hyperion support, xvii
Hyperion Technical Support, xvii
IIfThen function, 245
images
adding to reports, 102
described, 23
formatting, 209
overlapping, 106
importing
reports, 283
snapshot reports, 283
indenting text, 178
inheritance, cell formatting, 188
Insert menu, 35
inserting
grids, 23
page breaks, 109
text boxes, 23
instance document, exporting, 303
Kkeyword, current, 221
Llabels, editing, 293
legends, defining, 89
line charts
described, 73
options, 83
linked report objects, 94
linked report, accessing data from, 166
links to workspace library items, 283
local report objects, 94
logging on to Workspace, 28
Mmargins, setting for reports, 210
mathematical
expressions, natural precedence in, 279
operands, 278
operators, 277
Max function, 248
member lists
defining, 64
editing, 65
previewing, 67
member prompts, 172
member selection
formula bar, 148
member selection menus
Selected Options, 47
MemberAliasfunction, 249
350 Index N
A B C D E F G H I J K L M N O P Q R S T U V W X Y Z
MemberDescription function, 250
MemberName function, 251
MemberProperty function, 252
MemberQualifiedName function, 254
members
assigning, 48, 61
copying, 61
deleting, 62
finding, 65
previewing, 67
prompting for in batch processing, 287
selecting, 43
sorting, 67
menus
Available Options, 46
Edit, 34
File, 34
Format, 36
Help, 37
Insert, 35
Selected Options, 47
View, 35
Window, 37
merging cell, 202
metadata label
axes, 79
metadata labels
font, 79
Min function, 255
Mod function, 255
Nname
retrieving for a report, 268
returning the user name for a report, 268
natural precedence, in mathematical expressions, 279
numeric arguments, 215
Oobjects
security, 284
opening reports, 30
operands, in mathematical expressions, 278
operators, in mathematical expressions, 277
options, setting for report objects, 24
order of operations, 279
overlapping objects
bring to front, 106
reports, 105
send to back, 106
Ppage axis, described, 23
page breaks
inserting before report objects, 109
inserting in a grid, 133
page dimension heading, defining, 134
Page function, 256
page number, retrieving, 256
Page Setup options, 34
page, changing, 210
PageCount function, 257
pages, setting up, 210
PercentOfTotal function, 257
PeriodOffset, 58
PI function, 258
pictures, adding to reports, 102
pie charts, described, 74
pie charts, formatting, 84
PlanningAnnotations function, 258
point of view (POV)
selecting members, 159
setting up, 158
showing/hiding POV bar, 131
user, 157
positioning report objects, 105
POVAlias, 261
POVAlias function, 261
POVDescription function, 261
POVMember function, 262
precedence
in expressions, 279
row or column calculation, 153
previewing, selected members, 67
Print Preview, menu command, 32
printing
page number, 256
reports, 174
snapshot reports, 174
tips on, 174
Index R 351
A B C D E F G H I J K L M N O P Q R S T U V W X Y Z
ProcessManagementStatus function, 262
Product function, 263
prompts
defining in a batch of reports, 287
responding to when previewing, 172
property arguments, 217
aggregate, 217
reference, 218
property sheets, described, 24
RRandom function, 264
range, multiple segment reference, 147
Rank function, 264
reference property argument, 218
related content
changing the related content server, 166
creating links, 167
modifying properties, 168
removing access, 168
setting up, 166
removing
report objects from the report, 108
selected members, 62
report components, 22
report information
specifying in a report, 154
viewing, 109
report menu commands, 34
report objects
adding, 94
described, 23
grids, 98
in the workspace library, 282
inserting page breaks before, 109
linked and local, 94
overlapping, 105
positioning, 105 to 106
removing, 108
resizing, 106
saving, 107
source, 94
report prompts, setting up for members, 51
ReportAuthor function, 265
ReportCreated function, 266
ReportDesc function, 266
ReportFolder function, 266
ReportModified function, 267
ReportModifiedBy function, 267
ReportName function, 268
ReportRunBy function, 268
reports
assigning to a batch, 287
building, 93
changing data source for, 284
changing page setup, 210
creating, 28
designing new, 28
formatting, 177
importing into Hyperion Financial Reporting, 283
opening, 30
previewing in the Web, 173
sample design, 21
sending links via e-mail, 283
setting options, 30
viewing information on, 109
viewing snapshot reports, 30
reports and books, print previewing, 173
reports see also linked reports
repository, cut, copy, and paste, 283
resizing report objects, 106
retrieving
members and functions, 44
Round function, 268
row and column template
creating, 122
inserting, 125
linking, 125
modifying, 126
unlinking, 125
row and column templates, 119
row headings
defining in grids, 116
displaying on each page, 210
row height, 201
row reference arguments, 215
row reference operand, 279
rows
described, 23
expanded, 143
expanding, 162
352 Index S
A B C D E F G H I J K L M N O P Q R S T U V W X Y Z
hiding, 190
inserting into grids, 114
sorting, 191
sorting in grids, 191
specifying height of, 201
subtotaling in grids, 136
SSame As, setting up, 52
sample report, 21
schema labels, 293
schema registration
maintaining, 293
updating, 292
schemas, short names, 293
segment, expressing, 144
Select Members dialog box
Available area, 45
finding members, 65
removing selected members, 62
Selected area, 47
sorting members, 67
Selected area, adding members to, 47
Selected Options menu, 47
selecting
member lists, 45
members, 45
send to back, objects, 106
server name, retrieving, 233
servers, viewing activity on, 110
setting properties for report properties, 24
shading
text box options, 179
short names, editing, 293
snapshot books
importing, 305
sending links to via e-mail, 283
snapshot reports
copying in the workspace library, 282
importing into Hyperion Financial Reporting, 283
printing, 174
sending links to via e-mail, 283
viewing, 30
sorting
in grids, 191
members, 67
source report object, 94
sparse command, 39
special members, 50
Sqrt (square root) function, 269
SSL, configuring for external authentication, 166
Standard toolbar, 31
starting Hyperion Financial Reporting Studio, 28
Studio workspace, described, 24
subtotaling data rows or columns, 136
Sum function, 269
summaries of reports, viewing, 109
Summary command, 34
summary rows and columns, expanding, 162
supporting detail, showing, 129
suppressing
data, 202
suppression, conditional, 202
syntax, of math functions, 213
system toolbars, described, 31
TTask menu, 36
tasks
for Hyperion Financial Reporting, 27
taxonomies, XBRL, downloading, 291
technical support, xvii
templates
row and column, 119
text
aligning, 178
formatting, 178
indenting and aligning, 178
specifying fonts for, 178
specifying in a report, 154
text boxes
adding borders or shading to, 179
adding to reports, 96
described, 22
inserting, 23
overlapping, 106
text functions
described, 219
using to display report information, 154
time
format characters, 235
Index U 353
A B C D E F G H I J K L M N O P Q R S T U V W X Y Z
retrieving current, 266 to 267
title pages, creating, 109
titles, defining in charts, 88
toolbars
buttons, defined, 31
Designer, 32
report object buttons, 23
Standard, 31
totals on data rows and columns, 136
Truncate function, 270
Uuser tasks, 27
Vvalue operand, 279
Variance function, 271
VariancePercent function, 274
View menu, 35
view preferences, setting, 173
Viewing, snapshot reports, 30
WWeb browser, previewing, 173
width of rows, specifying, 201
Window menu, 37
Workspace
changing, 210
workspace library
changing data source in, 284
copying reports and report objects in, 282
filtering report objects in, 282
security, 284
workspace library, described, 94
XXBRL
enabling in Hyperion Financial Reporting Studio, 290
Hyperion Financial Reporting Studio, 289
line items, assigning to rows, 298
managing the schema, 291
removing context from a column, 296
setting the context on columns, 294
setting up for Hyperion Financial Reporting Studio, 290
Zzoom, grid, 40, 180