hyperspectral image analysis via a functional data model
TRANSCRIPT

Hyperspectral Image
Analysis via a Functional
Data Model
Anne Wilson
Odele Coddington
Peter Pilewski
Doug Lindholm
Laboratory for Atmospheric and Space Physics (LASP)
University of Colorado, Boulder
Presentation to ESTF 2018, June 14, 2018
The LASP Web Team

Hyperspectral cubes
Continuous coverage
of an areaSpectral Distortion in Loss Compression of Hyperspectral Data, Aiazzi, et al,
Journal of Electrical and Computer Engineering, 2012(5):1817-1819, Aug
2003, DOI: 10.1109/IGARSS.2003.1294260
Bodkin Engineering, http://www.bodkindesign.com/products-
page/hyperspectral-imaging/hyperspectral-imaging/
Multi versus
hyperspectral imagery
• Multi: lower resolution band coverage
• Hyper: continuous resolution with much higher
spectral resolution
• much higher information content
• ability to identify unique components
• more suitable for machine learning algorithms
• The shape of the two are the same
• We treat them the same
Hyperspectral imagery drivers
• Improving instrumentation provides increasing
resolution
• Growing commercial development of imagers
• Increased flying options, including UAVs, allow
even greater deployment
• Cloud computing, commodity parallelization, big
data engines

Hyperspectral imagery applications
• Solar variability, effects on climate
• Cloud property retrievals
• Agriculture, agriscience
• Biodiversity, ecology, environmental monitoring
• Food processing, safety
• Medical imaging, biotechnology
• Drug identification, counterfeit and foreign
material detection
• Reconnaissance, surveillance
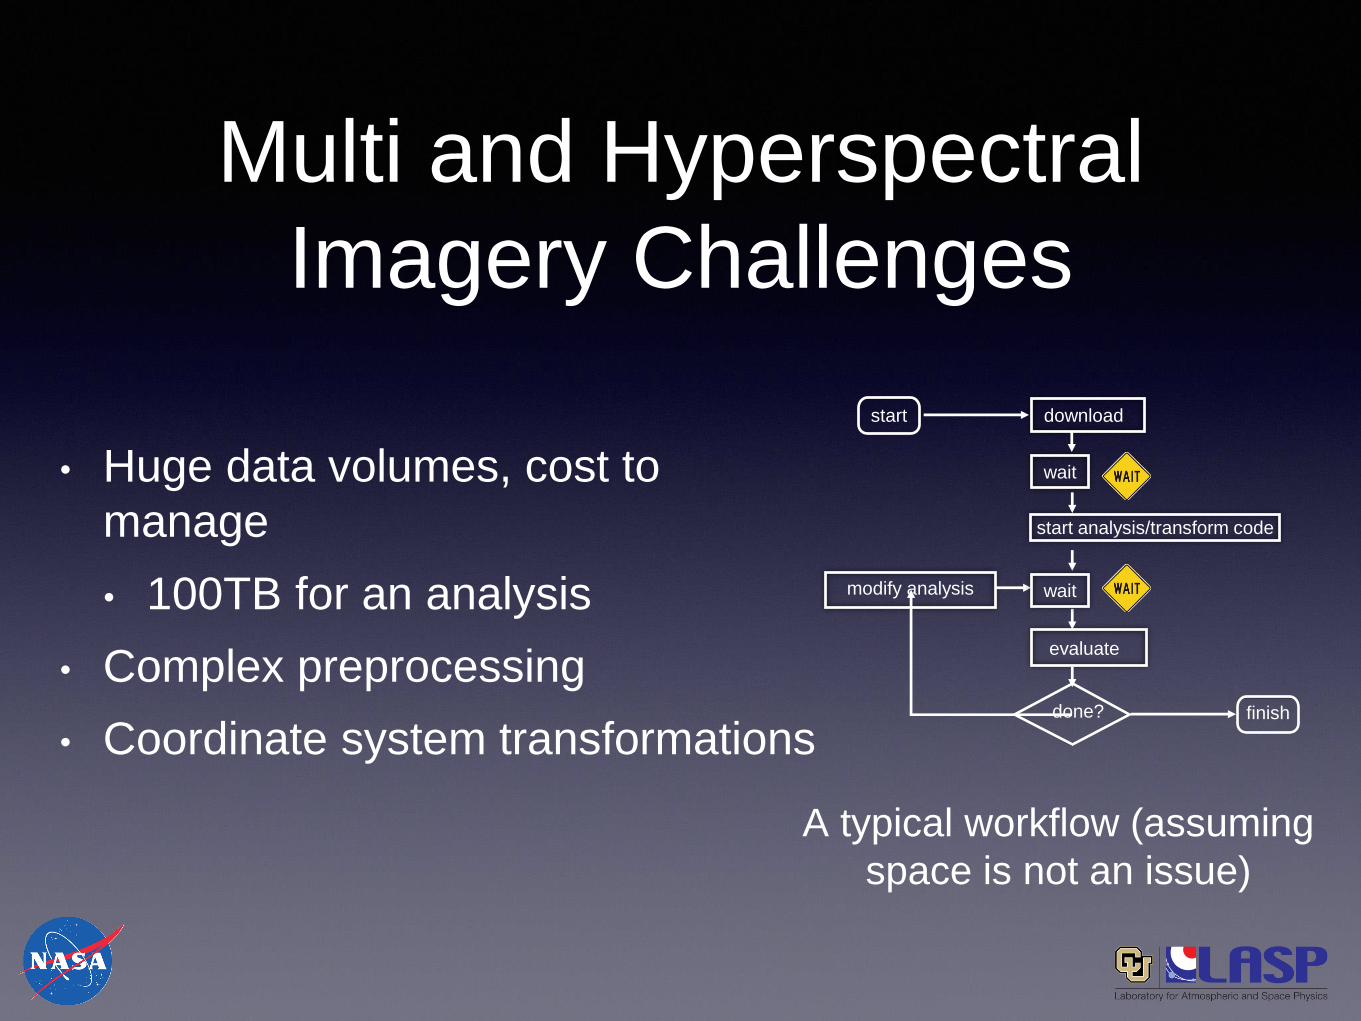
Multi and Hyperspectral
Imagery Challenges
• Huge data volumes, cost to
manage
• 100TB for an analysis
• Complex preprocessing
• Coordinate system transformations
download
done?
start
finish
wait
start analysis/transform code
evaluate
modify analysis wait
A typical workflow (assuming
space is not an issue)

Scientists want to
• Match data from different sources by time, geolocation,
• Select pieces of spectral imagery by time, location,
wavelength,
• Apply analysis algorithms to the data,
• Create new data products that are the ‘fusion’ of
multiple data sources,
• Work with both multi and hyperspectral datasets
• cross calibration, find common areas, etc.
• … in a responsive, performant fashion.
Hylatis: a platform for
hyperspectral image analysis
• Toolset for multispectral and hyperspectral datasets in the
cloud
• Data model and framework to support reusable code,
dataset integration, and interoperability
• Most generally, a domain agnostic platform for science
data representation and analysis, that
• Any domain can write to
• Supports operations such as transforms in a structured,
organized way, rather than writing one off code for each
transformation needed

Hylatis: a software research project
• How to structure software to support modeling and
analysis of spectral data
• Will not produce new data products
• Will not stand up a repository of hyperspectral imagery
• Building a software layer in front of hyperspectral data
• could be used to support a repository
Core project principles• Commitment to principles of mathematics to model and operate
on data
• Use of functional programming style, whose benefits include:
• More thoughtful, rigorous, up front development produces code
that is more correct, more easily parallelizable
• Compiler can check reasoning
• Capture of generalizations without domain specificity, enabling
code reuse
• Composition of functions
• Modeling data mathematically, for flexibility in representation and
thus easier interoperability of disparate datasets
Using math at the
foundational level
• Data model is simply a mathematical function of
independent and dependent variables
• no domain semantics
• temperature = f(time, latitude, longitude)
• same as: x = f(a, b, c)
• interpreter uses pattern matching

cloud detection alg
mask algD3,
corresponding
image for cloud
mask application
existing dataset
D1, land view with
clouds
existing dataset
D2, extracted
cloud
boundaries
created dataset, temporary
D4, new dataset
with cloud mask
from D1 applied to
D3
created dataset
Hypothetical composition problem
D4 = mask((cloud_detection(D1)), D3)
Using clouds detected
from D1, apply cloud
boundaries to image D3,
to create new dataset D4

Hylatis architecture
Based on LaTiS middlewarehttps://github.com/latis-data/latis
LaTiS supports:
• code reuse
• server side
computations
• e.g., on
demand
reformatting
Initial Hylatis task
Subset a hyperspectral cube by geolocation,
select 3 bands,
display them as RGB image.

Data flow diagram
for RGB image gen problem
data
source
S3
buck
et
native coordinates
Cartesian coordinates (regular, integer indices)
lat/lon coordinates, native orientation
lat/lon coordinates, North orientation
load into cloud storage
load into compute nodes
transform to Cartesian
apply map projection
rotate image
subset
subset
PNG

Selected datasets
1. HySICS: LASP hyperspectral instrument to fly on CLARREO
• using calibration data from a balloon flight
• each image is 480 x 640, and cube has 4200 images
2. GOES-R: multispectral, 16 bands
• 1 - 6 measure outgoing radiance at the top of the atmosphere
• 7 - 16 are digital maps of outgoing radiance values at the top of
the atmosphere
3. MODIS: multispectral, 36 bands
• Level 1b, 1km spatial resolution, 5 minute temporal resolution
4. POLDER: includes polarization data, 242 x 548
• an extra dimension in the shape of the data
Specific project term goals
• Load 4 datasets into cloud: HySICS, GOES,
MODIS, POLDER
• Via web page, allow simultaneous users to select
datasets, subset on geolocation, bandwidth, pixel
• Generate RGB images, for browsing purposes
• Fuse datasets into new products using simple
interpolation

Demonstrating…
• Handling different multi and hyperspectral
datasets in the cloud via unified API and
generalizable framework
• Multiple users sharing very large datasets
• Taking computation to the cloud

Project timeline
project end
Jan 2019Jun 2018
hold workshop
Jun 2019 Aug 2019
integrate datasets harden code summarize
Workshop for invited community members, June 2019
• Steer, harden development
• Get community feedback

Thank you!

Extras
General Science Drivers
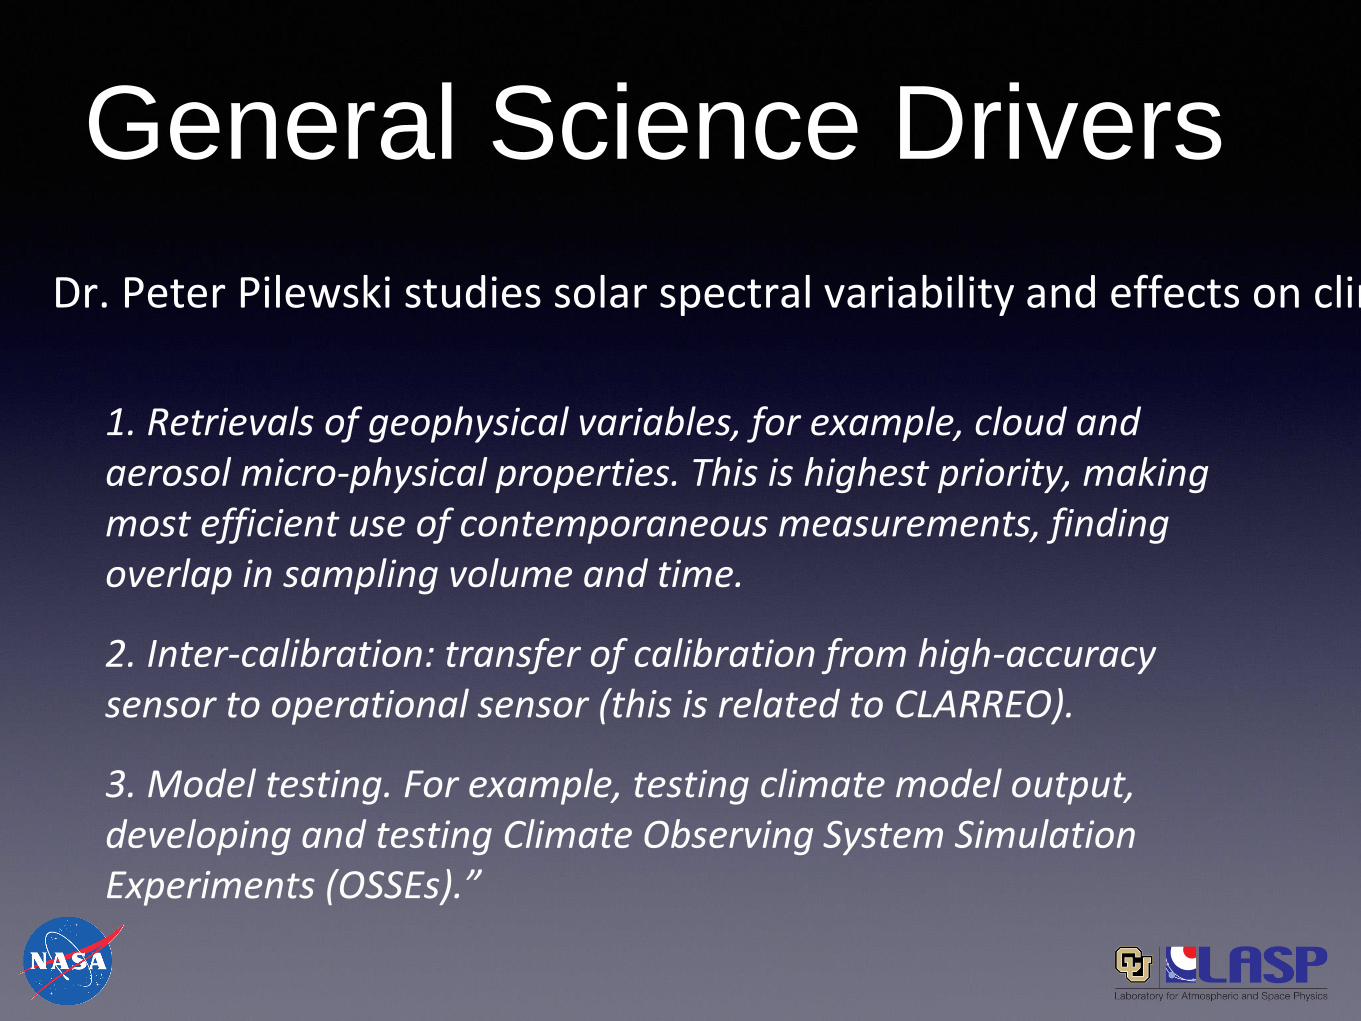
1. Retrievals of geophysical variables, for example, cloud and aerosol micro-physical properties. This is highest priority, making most efficient use of contemporaneous measurements, finding overlap in sampling volume and time.
2. Inter-calibration: transfer of calibration from high-accuracy sensor to operational sensor (this is related to CLARREO).
3. Model testing. For example, testing climate model output, developing and testing Climate Observing System Simulation Experiments (OSSEs).”
Dr. Peter Pilewski studies solar spectral variability and effects on climate
Odele’s science application
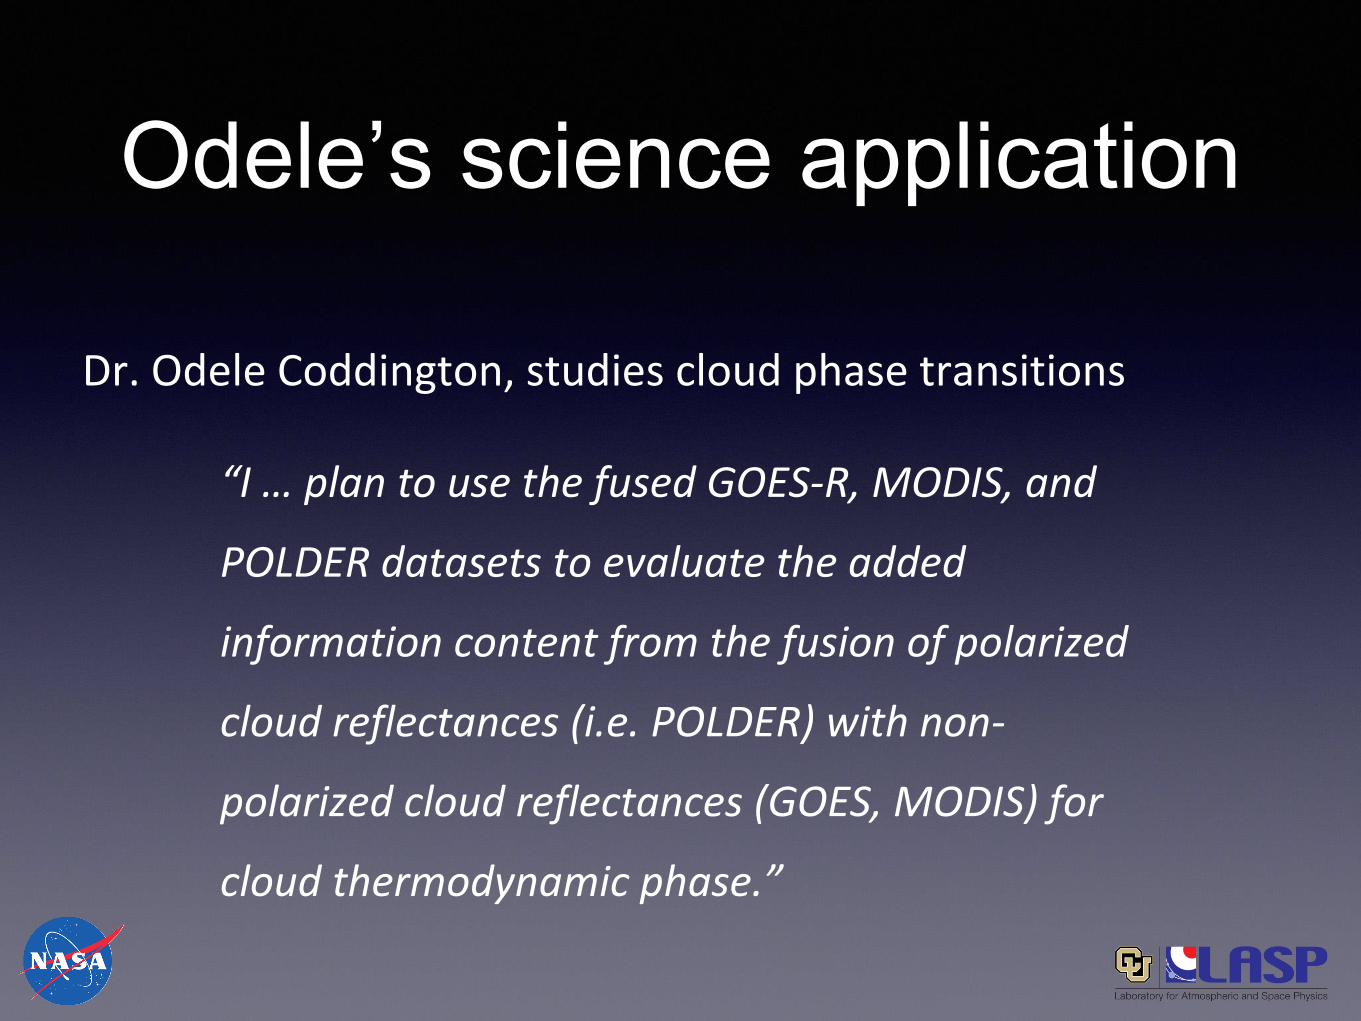
“I … plan to use the fused GOES-R, MODIS, and
POLDER datasets to evaluate the added
information content from the fusion of polarized
cloud reflectances (i.e. POLDER) with non-
polarized cloud reflectances (GOES, MODIS) for
cloud thermodynamic phase.”
Dr. Odele Coddington, studies cloud phase transitions

Hylatis tools applied to
Odele’s problemCurrently using MODIS bands as proxy for PACE
Currently using POLDER data as proxy for PACE polarimeters
Subsetting capabilities needed for these
When PACE is in orbit
Subset PACE to get 2 micron channel, and others
Subset PACE to get polarization data
Fuse the above
RGB image generation of above as part of workflow
(Future: Generate RGB images that outline dataset coverages, so overlap
can be visualized)

Use of functional
programming in industry
• Amgen
• AT&T
• Bank of
America Merrill
Lynch
• Barclays
Capital
Quantitative
Analysis Group
• Bloomberg
• Credit Suisse
• NVIDIA
• Qualcomm
• Walmart
• Bloomberg
• Intel
• Microsoft
• MITRE
• New York
Times
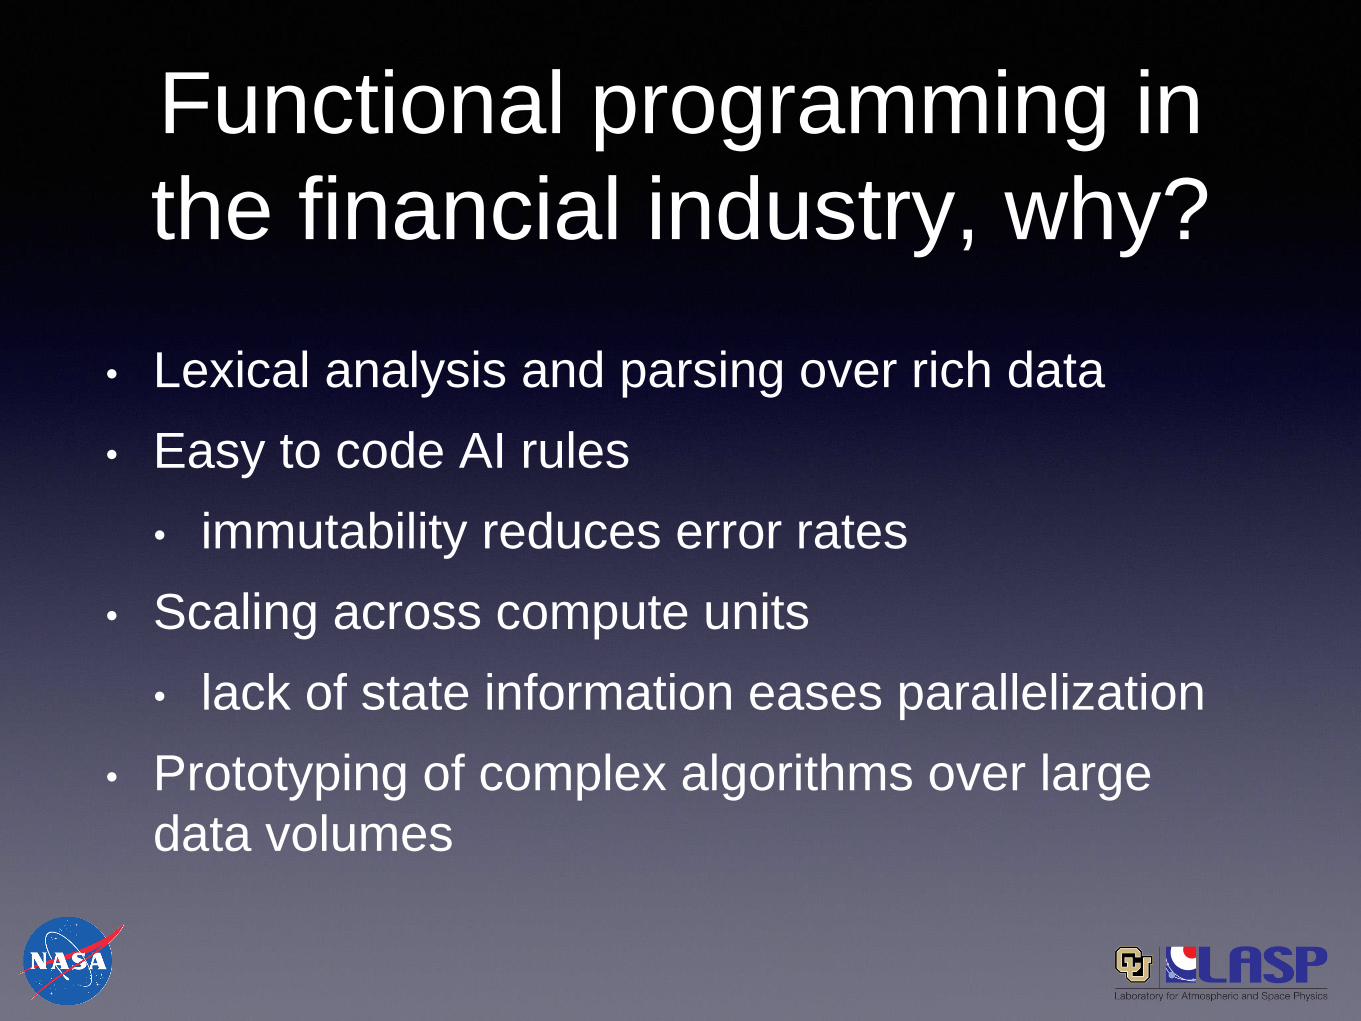
Functional programming in
the financial industry, why?
• Lexical analysis and parsing over rich data
• Easy to code AI rules
• immutability reduces error rates
• Scaling across compute units
• lack of state information eases parallelization
• Prototyping of complex algorithms over large
data volumes