hyperspectral imaging in diabetic foot wound carepilon/publications/jdst2010.pdf · 1101...
TRANSCRIPT
1099
Hyperspectral Imaging in Diabetic Foot Wound Care
Dmitry Yudovsky, M.S.,1 Aksone Nouvong, D.P.M.,2 and Laurent Pilon, Ph.D.3
Journal of Diabetes Science and Technology Volume 4, Issue 5, September 2010 © Diabetes Technology Society
Introduction
Diabetes mellitus affected 194 million people worldwide in 20041 and is expected to increase in prevalence to 439 million people by the year 2030.2 Foot ulceration continues to be a major comorbidity of diabetes and afflicts as many as 15 to 25% of type 1 and 2 diabetes patients during their lifetime.3,4 Roughly 85% of all lower extremity amputations in patients with diabetes mellitus are preceded by a foot ulcer.5 In fact, in 2006, diabetic foot ulcers were responsible for more than 88,000 lower limb amputations on diabetes patients
in the United States.6 In addition to the human cost, the associated financial cost of diabetic foot ulceration and amputations to the U.S. healthcare system was estimated to be $10.9 billion in 2001.7,8 Furthermore, it has been suggested that 40 to 85% of diabetic foot amputations could be avoided with early detection and preventive techniques such as offloading and improving hygiene.9 This article reviews hyperspectral imaging as a tool to monitor noninvasively and predict ulcer formation and healing on the diabetic foot.
SYMPOSIUM
AbstractDiabetic foot ulceration is a major complication of diabetes and afflicts as many as 15 to 25% of type 1 and 2 diabetes patients during their lifetime. If untreated, diabetic foot ulcers may become infected and require total or partial amputation of the affected limb. Early identification of tissue at risk of ulcerating could enable proper preventive care, thereby reducing the incidence of foot ulceration. Furthermore, noninvasive assessment of tissue viability around already formed ulcers could inform the diabetes caregiver about the severity of the wound and help assess the need for amputation. This article reviews how hyperspectral imaging between 450 and 700 nm can be used to assess the risk of diabetic foot ulcer development and to predict the likelihood of healing noninvasively. Two methods are described to analyze the in vivo hyperspectral measurements. The first method is based on the modified Beer-Lambert law and produces a map of oxyhemoglobin and deoxyhemoglobin concentrations in the dermis of the foot. The second is based on a two-layer optical model of skin and can retrieve not only oxyhemoglobin and deoxyhemoglobin concentrations but also epidermal thickness and melanin concentration along with skin scattering properties. It can detect changes in the diabetic foot and help predict and understand ulceration mechanisms.
J Diabetes Sci Technol 2010;4(5):1099-1113
Author Affiliations: 1Henry Samueli School of Engineering and Applied Science, University of California, Los Angeles, CA; 2Department of Surgery, UCLA/Olive View Medical Center, Sylmar, CA; and 3Biomedical Inter-Department Program, Henry Samueli School of Engineering and Applied Science, University of California, Los Angeles, CA
Abbreviations: (CCD) charge-coupled device, (LED) light-emitting diode, (MAD) maximum absolute difference, (NIR) near-infrared, (TcPO2) transcutaneous oxygen tension, (UV) ultraviolet
Keywords: diabetic foot ulcer, hyperspectral imaging, tissue oximetry, wound care
Corresponding Author: Laurent Pilon, Ph.D., Biomedical Inter-Department Program, Henry Samueli School of Engineering and Applied Science, University of California, 420 Westwood Plaza, Eng. IV 37-132, Los Angeles, CA 90095-1597; email address [email protected]
1100
Hyperspectral Imaging in Diabetic Foot Wound Care Yudovsky
www.journalofdst.orgJ Diabetes Sci Technol Vol 4, Issue 5, September 2010
Background
Diabetic Foot UlcersProlonged and poorly controlled diabetes irreparably damages bodily tissues. Nerve damage in the lower limbs results in diabetic neuropathy, whereby the patient’s somatosensory and autonomic function are diminished or completely lost.10 The subsequent loss of protective sensation, impaired gait control, bone deformities (e.g., Charcot foot), callus formation, and/or inhibited sweat response result in excessive shear and pressure that damage the diabetic foot.10,11 Furthermore, 10 to40% of diabetes patients are afflicted with peripheral vascular disease.12 Typically, the vessels that carry blood to the legs, arms, stomach, or kidneys narrow due to inflammation or tissue damage, resulting in impaired blood flow.12 Thus, repeated trauma to the foot in conjunction with inhibited protective or healing response due to denervation and/or poor vascularization increases the risk of foot ulceration in diabetes patients.10,13 Damage caused by diabetes to the feet of diabetic patients can be monitored noninvasively using reflectance spectroscopy in the visible part of the electromagnetic spectrum.
Hyperspectral ImagingSkin OpticsLight incident onto human skin may be reflected by the skin surface due to differences in the refraction index between the surrounding air and the stratum corneum. The light transmitted through the air-stratum corneum interface may be (1) absorbed by chromophores (e.g., melanin and hemoglobin) in the epidermis and dermis, or (2) scattered by cells or collagen fibers present throughout the epidermis and dermis. Therefore, the observed skin reflectance is the sum of the surface reflection, also called Fresnel reflection, and the diffuse reflectance. The latter corresponds to light that entered the tissue and reemerged out of the tissue toward the detector. If skin is illuminated by polarized light, the light reflected by the surface remains polarized.14 However, the reemerging light is depolarized due to multiple scatterings in the tissue.
PrincipleHyperspectral imaging consists of recording a series of two-dimensional images of biological tissue over a narrow spectral band around discrete wavelengths, lj .15 The resulting set of images is called a hypercube and is denoted by H(x, y, l j), where x and y are the two spatial coordinates and l j is the spectral coordinate. In other words, each pixel in a hypercube corresponds to the local reflectance spectrum of the tissue.
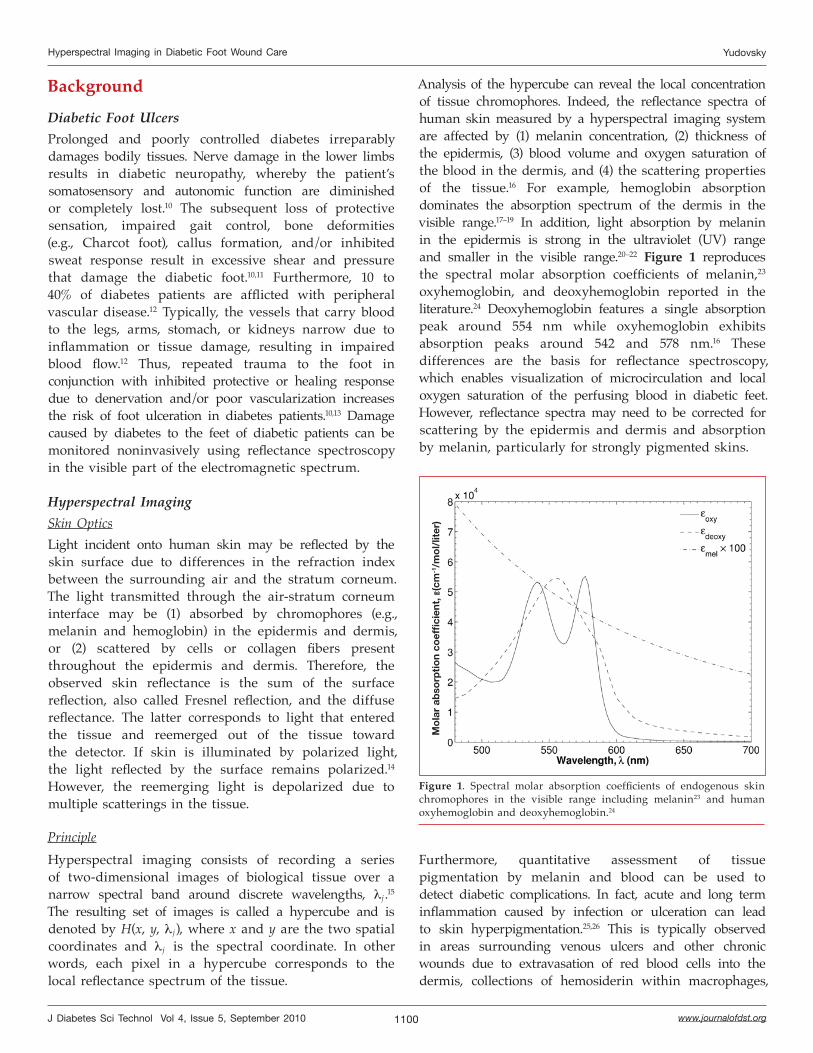
Analysis of the hypercube can reveal the local concentration of tissue chromophores. Indeed, the reflectance spectra of human skin measured by a hyperspectral imaging system are affected by (1) melanin concentration, (2) thickness of the epidermis, (3) blood volume and oxygen saturation of the blood in the dermis, and (4) the scattering properties of the tissue.16 For example, hemoglobin absorption dominates the absorption spectrum of the dermis in the visible range.17–19 In addition, light absorption by melanin in the epidermis is strong in the ultraviolet (UV) range and smaller in the visible range.20–22 Figure 1 reproduces the spectral molar absorption coefficients of melanin,23 oxyhemoglobin, and deoxyhemoglobin reported in the literature.24 Deoxyhemoglobin features a single absorption peak around 554 nm while oxyhemoglobin exhibits absorption peaks around 542 and 578 nm.16 These differences are the basis for reflectance spectroscopy, which enables visualization of microcirculation and local oxygen saturation of the perfusing blood in diabetic feet. However, reflectance spectra may need to be corrected for scattering by the epidermis and dermis and absorption by melanin, particularly for strongly pigmented skins.
Figure 1. Spectral molar absorption coefficients of endogenous skin chromophores in the visible range including melanin23 and human oxyhemoglobin and deoxyhemoglobin.24
Mo
lar
abso
rpti
on
coef
fici
ent,
e(c
m-1
/mo
l/lit
er)
Furthermore, quantitative assessment of tissue pigmentation by melanin and blood can be used to detect diabetic complications. In fact, acute and long term inflammation caused by infection or ulceration can lead to skin hyperpigmentation.25,26 This is typically observed in areas surrounding venous ulcers and other chronic wounds due to extravasation of red blood cells into the dermis, collections of hemosiderin within macrophages,
1101
Hyperspectral Imaging in Diabetic Foot Wound Care Yudovsky
www.journalofdst.orgJ Diabetes Sci Technol Vol 4, Issue 5, September 2010
and melanin deposition.25,27–29 Alternatively, extreme inflammation may eventually destroy melanocytes in the epidermis resulting in hypopigmentation in and around the ulcer site after ulcer healing.26 Hyperspectral imaging in the visible and near-infrared (NIR) parts of the spectrum has been used to determine the spatial distribution of oxygen saturation in the human skin.15 This technique has also been applied clinically to study diabetic neuropathy30 and predict the healing potential of diabetic foot ulcers.31,32
Finally, Vande Berg and Rudolph33 performed a histolo-gical study of tissue surrounding pressure ulcers that are similar to diabetic foot ulcers. They noted that these regions had thinner epidermis when compared with adjacent healthy tissue. Furthermore, dermal collagen fibers were woven into thick bundles that were denser than healthy collagen and contained regions of scar tissue. Inflammatory cells and platelets were mixed among the collagen fibers. In some instances, blood vessels were occluded due to swelling, while in others they were hyperemic due to increased blood flow. Such changes in tissue microstructure have been shown to affect the scattering coefficient of skin.16 Thus, by detecting epidermal thickness and the skin’s scattering coefficient, one could also detect structural changes that occur in the skin prior to ulceration or during healing.
Hyperspectral Image Analysis Two methods can be used to analyze the hypercube data collected experimentally. The first method treats skin as a semi-infinite medium. The second method treats skin as a two-layer medium consisting of a plane-parallel slab supported by a semi-infinite medium representing the epidermis and the dermis, respectively. These methods are discussed in detail in the next sections.
• Method 1. Modified Beer-Lambert Law and Calibration
The so-called apparent absorption of the tissue Aobs(x,y,l j) at the spatial coordinate (x,y) and at wavelength lj can be calculated using the modified Beer-Lambert law34 as
Aobs(x ,y,l j) = – log10[Rd(x ,y,l j)] (1)
where Rd(x,y,lj) is the diffuse reflectance emerging around the normal direction and measured experimentally. The primary chromophores in the human skin responsible for absorption of visible light are oxyhemoglobin, deoxyhemoglobin, and melanin.16,18,35 Thus, the apparent absorption (or extinction) can be modeled as the sum of absorption from chromophores and scattering by the tissue:34
Amod(x ,y,l j) = eoxy(l j)Moxy(x ,y)L + edeoxy(l j)Mdeoxy(x ,y)L+ emel(l j )Mmel(x ,y)L+ G (2)
where Mi(x,y) is the molar concentration of chromo-phore “i” at coordinate (x ,y) (expressed in mol/liter) and ei(l) is a spectral molar absorption coefficient [in cm-1/(mol/liter)] while the subscripts oxy, deoxy, and mel refer to oxyhemoglobin, deoxyhemoglobin, and melanin, respectively. The mean free path L (in centimeters) is the average distance traveled by a photon within the tissue before it reemerges out of the tissue.34 The term G accounts for light scattering by the skin outside of the acceptance angle of the collector optics; it depends on the geometry of the collector optics and can be assumed to be independent of wavelength.16 The spectral molar absorption coefficients eoxy(l j), edeoxy(l j), and emel(l j) were taken from the literature36–38 and are shown in Figure 1. The mean free path L is unknown and so the products Moxy(x,y)L, Mdeoxy(x,y)L, and Mmel(x,y)L can be substituted by effective concentrations OXY(x,y), DEOXY(x ,y), and MEL(x ,y), respectively. Then, the four unknown parameters OXY, DEOXY, MEL, and G can be retrieved at each location (x ,y) by minimizing the residual r given by
r = S {Aobs(l j) – s[OXYeoxy(l j) + DEOXYedeoxy(l j)
+ MELemel(l j)] + G}2 (3)
15
j=1
where the factor s was introduced to scale empirically the effective oxyhemoglobin concentration OXY to be 50 on average for a population of healthy subjects. Minimization of the residual r can be performed numerically with an optimization software such as the popular Levenberg-Marquardt algorithm.39 The effective total hemoglobin concentration, HEME, and the oxygen saturation, SO2, at coordinate (x,y) are then calculated as HEME = OXY + DEOXY and SO2 = OXY/HEME, respectively.
• Method 2: Two-Layer Optical Skin Model
Analysis of the apparent absorption with the modified Beer-Lambert law can provide an estimate of oxygen saturation, melanin concentration, and total hemoglobin. However, it cannot be used to estimate epidermal thickness and the tissue spectral scattering coefficient. Instead, Yudovsky and Pilon40 developed an inverse method that can simultaneously determine (1) oxygen saturation, SO2, (2) blood volume fraction, fblood, (3) melanin concentration, Mmel, and (4) the tissue scattering coefficient, ms,tr (assumed to be identical for dermis and epidermis16) from the same reflectance measurements.

1102
Hyperspectral Imaging in Diabetic Foot Wound Care Yudovsky
www.journalofdst.orgJ Diabetes Sci Technol Vol 4, Issue 5, September 2010
The human skin was modeled as a plane-parallel slab representing the epidermis supported by a semi-infinite layer representing the dermis. Absorption in the epidermis is mainly due to melanin and was modeled as a function of the melanin concentration, Mmel.18,35 The spectral absorption coefficient of the dermis is determined primarily by the absorption of blood and flesh24 and depends on the blood volume fraction and the oxyhemoglobin and deoxyhemoglobin concentrations in the blood. Finally, the spectral transport scattering coefficient of both the epidermis and dermis were assumed to be equal and given by a power law.16 Then, the diffuse reflectance of skin was predicted by a rapid and accurate expression accounting for the distinct optical properties of the epidermis and dermis and given by41
Re = R*[R_(n1, ω tr,epi) – R_(n1, ω tr,derm)] + R_(n1, ω tr,derm) (4)
where ω tr,epi and ω tr,derm are the transport single scattering albedos of the epidermis and dermis, respectively, while n1 is the index of refraction of both layers. The reduced reflectance, R*, is a function of a single semi-empirical parameter a and expressed as41
(5)
The parameter Yepi is the modified optical thickness defined as Yepi=ζ(m a,epi+m s,tr)Lepi, where Lepi is the physical thickness of the epidermis,42 and m a,epi(l) and m s , t r(l) are the absorption and transport scattering coefficients, respectively. The parameters ζ and a were given as polynomial expressions in terms of ω tr,epi and ω tr,derm, respectively.41 The function R_(n1, ω tr) appearing in Equation (4) is the diffuse reflectance of a semi-infinite homogeneous layer, with transport single scattering albedo ω tr and index of refraction n1 given by41
×
(6)
where r01(n1) is the normal-normal reflectivity of the tissue/air interface defined as
(7)
Expressions for and were given in Equations (26) and (27), respectively, of Yudovsky and Pilon.41 The relative error between the semi-empirical
model and Monte Carlo simulations was typically around 3% and never more than 8% for the optical properties of skin in the visible range.41
The goal of the inverse method was to estimate the property vector from the measured diffuse reflectance Rm(lj). This was achieved by finding an estimate vector that minimizes the sum of the squared residuals d expressed as
where is the estimatedspectral reflectance and K is the number of wavelengths considered. OxyVuTM (HyperMed, Inc., Burlington, MA) measured the diffuse reflectance at K =15 wavelengths between 500 and 660 nm. The residual was minimized iteratively at each coordinate (x ,y) using the constrained Levenberg-Marquardt algorithm.39 The minimization was stopped once successive iterations of the algorithm no longer reduced d(x,y) by more than 10-9 per iteration. Furthermore, multiple random initial guesses for were attempted to prevent convergence to a local minimum.
Finally, this inverse method was successfully applied to in vivo normal-hemispherical reflectance measurements on the untanned inner forearm, medium tanned forehead, and strongly tanned outer forearm of subjects with lightly and strongly pigmented skin.43 The results were consistent with race, anatomical location, and tanning status of the subjects and with biopsy measurements reported in the literature.44–50 This article illustrates how this second method can be applied to monitor changes in epidermal thickness on diabetic feet known to have developed ulcers.
Hyperspectral Imaging For Diabetic Foot Wound CareHyperspectral imaging has been used to assess tissue viability and health in diabetes patients at risk of foot ulceration.15,31,32,51,52 For example, Greenman et al.30 used hyperspectral imaging to generate oxygen saturation and total hemoglobin concentration maps of the forearms and feet of diabetic subjects with and without neuropathy, and of nondiabetic subjects. The study included 19 male and 17 female type 1 and 2 diabetes patients without neuropathy, 33 male and 18 female type 1 and 2 diabetes patients with neuropathy, and 11 male and 10 female nondiabetic subjects without neuropathy. None of the subjects were affected by foot ulceration. The average ages of the neuropathic, nonneuropathic, and control groups were 55, 54, and 47 years of age, respectively. The authors showed that the resting oxygen saturation averaged over the area surrounding the ulcer was lower among diabetic subjects with neuropathy than among
1103
Hyperspectral Imaging in Diabetic Foot Wound Care Yudovsky
www.journalofdst.orgJ Diabetes Sci Technol Vol 4, Issue 5, September 2010
both diabetic subjects without neuropathy and non-diabetic subjects. This suggests that diabetic neuropathy, which is a major contributor to ulceration,10,11 could be detected by hyperspectral tissue oximetry.
In a different study, Khaodhiar et al.32 measured in vivo oxyhemoglobin and deoxyhemoglobin concentrations using hyperspectral imaging near ulcer sites on the feet of type 1 diabetes patients. The study included (1) 6 male and 4 female diabetes patients between the ages of 38 and 64 having diabetic foot ulcers, (2) 8 male and 5 female diabetes patients between the ages of 24 and 68 without diabetic foot ulcers, and (3) 6 male and 8 female control subjects without diabetes or foot ulcers between the ages of 23 and 70. Hyperspectral imaging of the feet between 500 and 650 nm was performed at each visit for up to four times over a six-month period. The previously described Method 1 was used to analyze the images. Then, the authors developed an ulcer-healing prediction index based on the oxyhemoglobin and deoxy-hemoglobin concentrations near the ulcer site that could distinguish ulcers that would heal from ulcers that would not heal, with a sensitivity and specificity of 93 and 86%, respectively.
This article discusses how hyperspectral imaging can be used in clinical setting to (1) predict the likelihood of ulcer healing and (2) identify tissue at risk of ulcerating before tissue damage becomes apparent to a caregiver.
Method
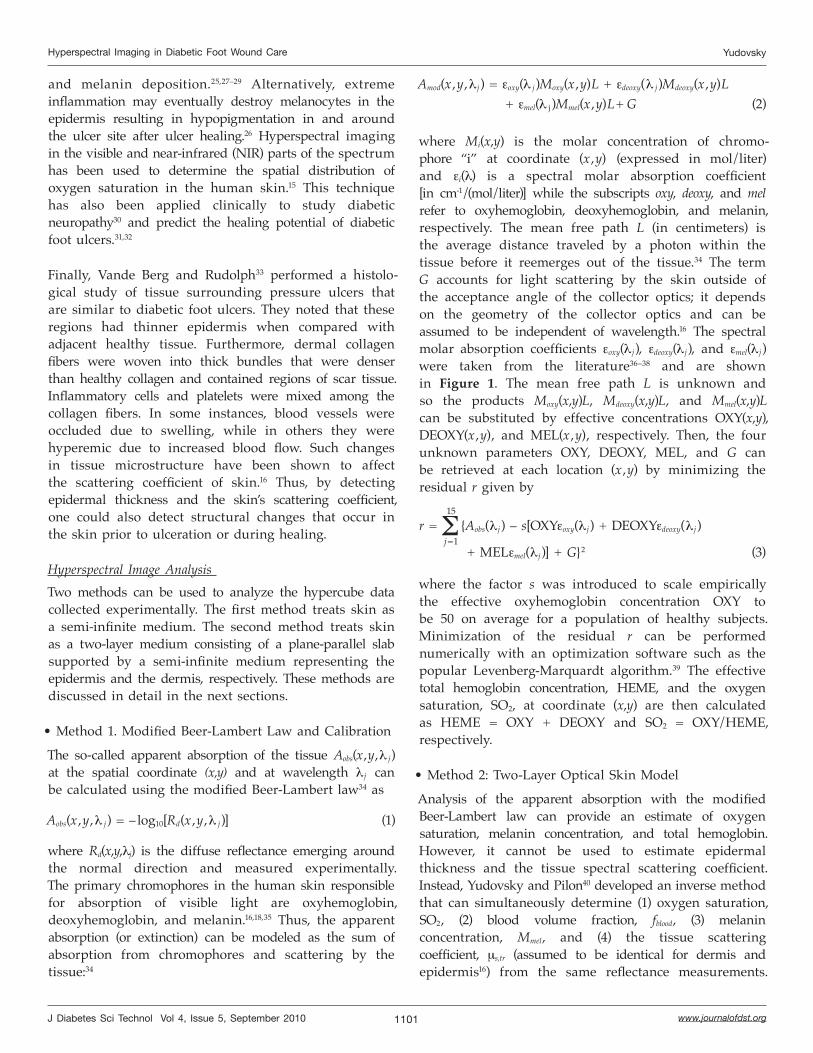
Experimental Setup and ProcedureFigure 2A schematically depicts the various components of a typical hyperspectral imaging system. Figure 2B shows a photograph of the hyperspectral imager OxyVu. The illumination optics consisted of (1) seven broadband visible light-emitting diodes (LEDs) (XR-E WHT-L1, Cree, Inc., Durham, NC) emitting primarily between 500 and 700 nm, and (2) collimating wide lenses (OP-025, Dialight Corp., North Yorkshire, United Kingdom). The LEDs were arranged radially around the collection optics and were crosspolarized relative to the collection optics. The diffuse reflectance was measured by eliminating the Fresnel reflection in the images. This was achieved by placing a linear polarizer film (XP38, Optical Filters Ltd., Meadville, PA), set between two acrylic sheets in front of the LED assembly. The collection optics was composed of (1) a spectral separator (LCTF-10-20, CRI Inc., Woburn, MA), (2) a charge-coupled device (CCD) (Guppy F-1468, Allied Vision Technologies, Stadtroda, Germany), and (3) a 25 mm focal length imaging lens (MFA2514,
SENKO Advanced Components, Inc., Marlboro, MA). The spectral separator was tunable over the range of 400–720 nm with a full width at half maximum of 10 nm and also acted as a linear polarizer. The detection system was designed with an 18-inch focal length and had a spatial resolution of 100 mm.
Subjects were imaged supine on a standard examination table or reclining chair. A fiducial target was placed near the center of the imager’s field of view to correct for movement of the foot during the hypercube acquisition. For each measurement site, the hyperspectral imager OxyVu collected two hypercubes corresponding to either background Btissue(x ,y,l j) or LED-illuminated conditions Itissue(x,y,lj). The spectral separator was tuned to 15 equally spaced wavelengths between 500 and 660 nm while the CCD measured the tissue reflectance. The LEDs were switched off and on to produce both illumination conditions, respectively. Acquisition at each wavelength
Figure 2. (A) Schematic of the different components of the hyperspectral imager. (B) Photograph of the hyperspectral imager OxyVu used in this study.
USB drivers
Calibration module
Algorithm module
Display output
Color printer Display monitor
Keyboard and mouse
A
B
1104
Hyperspectral Imaging in Diabetic Foot Wound Care Yudovsky
www.journalofdst.orgJ Diabetes Sci Technol Vol 4, Issue 5, September 2010
lasted for approximately 1 second. To normalize and correct for spectral variation in illumination intensity and collector sensitivity, the hyperspectral imager was calibrated to a well-characterized, highly and diffusely reflecting standard prior to imaging every subject. The same procedure was used to acquire background and illuminated calibration hypercubes denoted by Bcalib(x ,y,l j) and Icalib(x ,y,l j), respectively. Then, the diffuse reflectance used to determined the absorptance Aobs(x ,y,l j) of the tissues given by Equation (1), was computed as
(8)
The OXY and DEOXY values reported by OxyVu in arbitrary units and estimated using Method 1 from reflectance measurements at 15 wavelengths were validated against those obtained from high resolution spectrometric measurements and retrieving Moxy and Mdeoxy in units of mmol/liter in a manner similar to that described by Gillies et al.52 Oximetry data were gathered simultaneously with both devices from eight anatomical sites pre- and post-pressure cuff-induced ischemia on the dorsal feet of 19 healthy subjects. The values of OXY and DEOXY were found to be linearly proportional to Moxy and Mdeoxy with correlation coefficients of 0.86 and 0.88, respectively. This confirms that the OXY and DEOXY values reported by OxyVu are strong indicators of the actual molar concentrations of oxyhemoglobin and deoxyhemoglobin, albeit in arbitrary units.
Results and Discussion
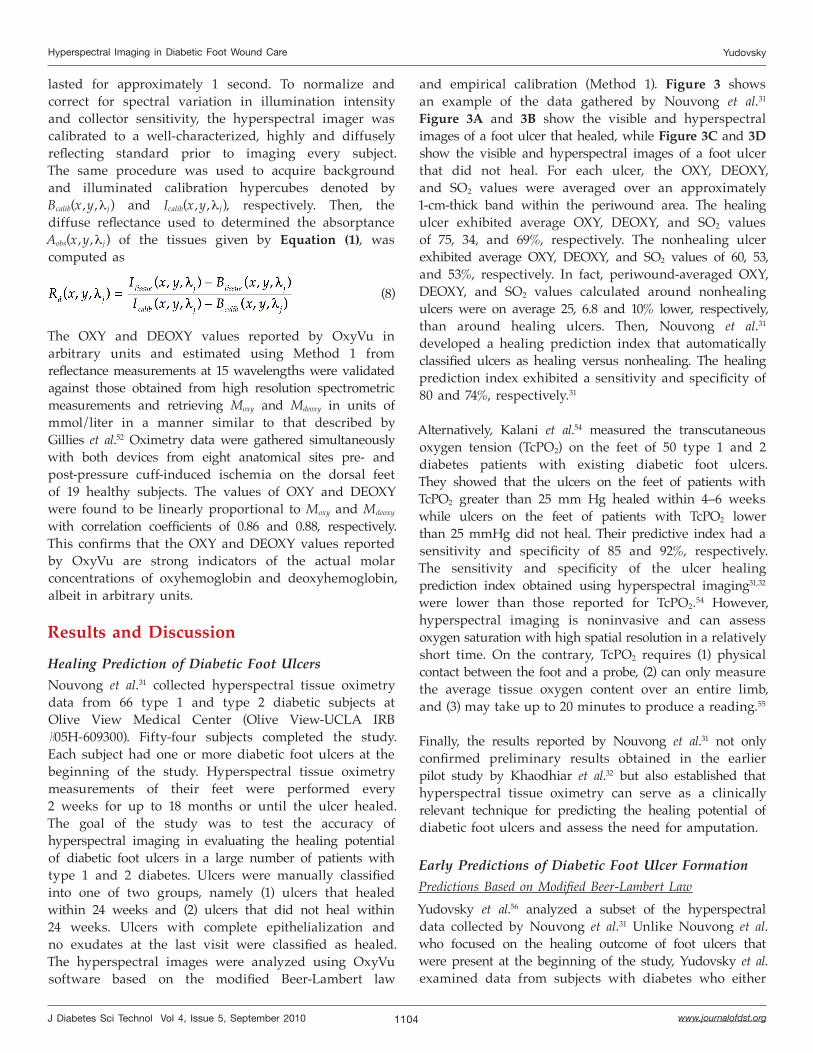
Healing Prediction of Diabetic Foot UlcersNouvong et al.31 collected hyperspectral tissue oximetry data from 66 type 1 and type 2 diabetic subjects at Olive View Medical Center (Olive View-UCLA IRB #05H-609300). Fifty-four subjects completed the study. Each subject had one or more diabetic foot ulcers at the beginning of the study. Hyperspectral tissue oximetry measurements of their feet were performed every 2 weeks for up to 18 months or until the ulcer healed. The goal of the study was to test the accuracy of hyperspectral imaging in evaluating the healing potential of diabetic foot ulcers in a large number of patients with type 1 and 2 diabetes. Ulcers were manually classified into one of two groups, namely (1) ulcers that healed within 24 weeks and (2) ulcers that did not heal within 24 weeks. Ulcers with complete epithelialization and no exudates at the last visit were classified as healed. The hyperspectral images were analyzed using OxyVu software based on the modified Beer-Lambert law
and empirical calibration (Method 1). Figure 3 shows an example of the data gathered by Nouvong et al.31 Figure 3A and 3B show the visible and hyperspectral images of a foot ulcer that healed, while Figure 3C and 3D show the visible and hyperspectral images of a foot ulcer that did not heal. For each ulcer, the OXY, DEOXY, and SO2 values were averaged over an approximately 1-cm-thick band within the periwound area. The healing ulcer exhibited average OXY, DEOXY, and SO2 values of 75, 34, and 69%, respectively. The nonhealing ulcer exhibited average OXY, DEOXY, and SO2 values of 60, 53, and 53%, respectively. In fact, periwound-averaged OXY, DEOXY, and SO2 values calculated around nonhealing ulcers were on average 25, 6.8 and 10% lower, respectively, than around healing ulcers. Then, Nouvong et al.31 developed a healing prediction index that automatically classified ulcers as healing versus nonhealing. The healing prediction index exhibited a sensitivity and specificity of 80 and 74%, respectively.31
Alternatively, Kalani et al.54 measured the transcutaneous oxygen tension (TcPO2) on the feet of 50 type 1 and 2 diabetes patients with existing diabetic foot ulcers.
They showed that the ulcers on the feet of patients with TcPO2 greater than 25 mm Hg healed within 4–6 weekswhile ulcers on the feet of patients with TcPO2 lower than 25 mmHg did not heal. Their predictive index had a sensitivity and specificity of 85 and 92%, respectively. The sensitivity and specificity of the ulcer healing prediction index obtained using hyperspectral imaging31,32 were lower than those reported for TcPO2.54 However, hyperspectral imaging is noninvasive and can assess oxygen saturation with high spatial resolution in a relatively short time. On the contrary, TcPO2 requires (1) physical contact between the foot and a probe, (2) can only measure the average tissue oxygen content over an entire limb, and (3) may take up to 20 minutes to produce a reading.55
Finally, the results reported by Nouvong et al.31 not only confirmed preliminary results obtained in the earlier pilot study by Khaodhiar et al.32 but also established that hyperspectral tissue oximetry can serve as a clinically relevant technique for predicting the healing potential of diabetic foot ulcers and assess the need for amputation.
Early Predictions of Diabetic Foot Ulcer FormationPredictions Based on Modified Beer-Lambert LawYudovsky et al.56 analyzed a subset of the hyperspectral data collected by Nouvong et al.31 Unlike Nouvong et al. who focused on the healing outcome of foot ulcers that were present at the beginning of the study, Yudovsky et al.examined data from subjects with diabetes who either
1105
Hyperspectral Imaging in Diabetic Foot Wound Care Yudovsky
www.journalofdst.orgJ Diabetes Sci Technol Vol 4, Issue 5, September 2010
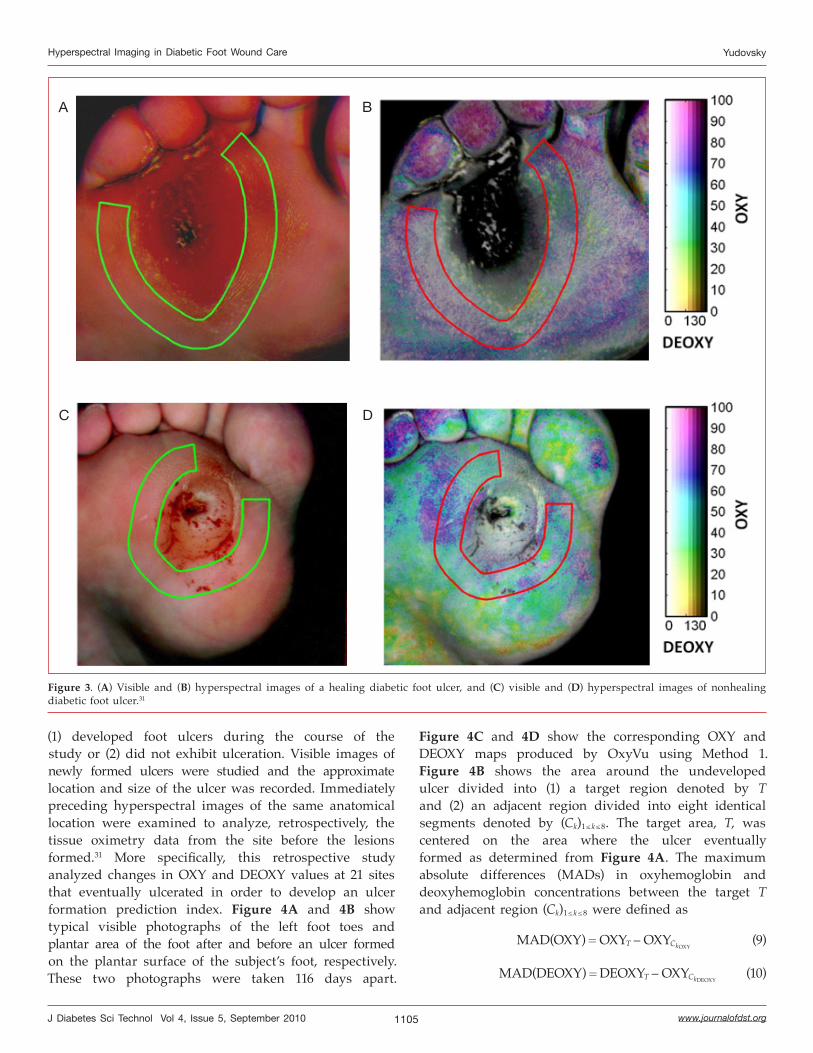
(1) developed foot ulcers during the course of the study or (2) did not exhibit ulceration. Visible images of newly formed ulcers were studied and the approximate location and size of the ulcer was recorded. Immediately preceding hyperspectral images of the same anatomical location were examined to analyze, retrospectively, the tissue oximetry data from the site before the lesions formed.31 More specifically, this retrospective study analyzed changes in OXY and DEOXY values at 21 sites that eventually ulcerated in order to develop an ulcer formation prediction index. Figure 4A and 4B show typical visible photographs of the left foot toes and plantar area of the foot after and before an ulcer formed on the plantar surface of the subject’s foot, respectively. These two photographs were taken 116 days apart.
A B
C D
Figure 3. (A) Visible and (B) hyperspectral images of a healing diabetic foot ulcer, and (C) visible and (D) hyperspectral images of nonhealing diabetic foot ulcer.31
Figure 4C and 4D show the corresponding OXY and DEOXY maps produced by OxyVu using Method 1. Figure 4B shows the area around the undeveloped ulcer divided into (1) a target region denoted by T and (2) an adjacent region divided into eight identical segments denoted by (Ck)1≤ k ≤8. The target area, T, was centered on the area where the ulcer eventually formed as determined from Figure 4A. The maximum absolute differences (MADs) in oxyhemoglobin and deoxyhemoglobin concentrations between the target T and adjacent region (Ck)1≤ k ≤8 were defined as
MAD(OXY) = OXYT – OXYCkOXY (9)
MAD(DEOXY) = DEOXYT – OXYCkDEOXY (10)
1106
Hyperspectral Imaging in Diabetic Foot Wound Care Yudovsky
www.journalofdst.orgJ Diabetes Sci Technol Vol 4, Issue 5, September 2010
where OXYT or DEOXYT and OXYCkOXY or DEOXYCkDEOXY
were the average oxyhemoglobin or deoxyhemoglobin concentrations in the target and adjacent regions with indices kOXY or kDEOXY, respectively. The indices kOXY and kDEOXY were those found to maximize the absolute values of (OXYT – OXYCk)1≤ k ≤8 and (DEOXYT –DEOXYCk)1≤ k ≤8, respectively.
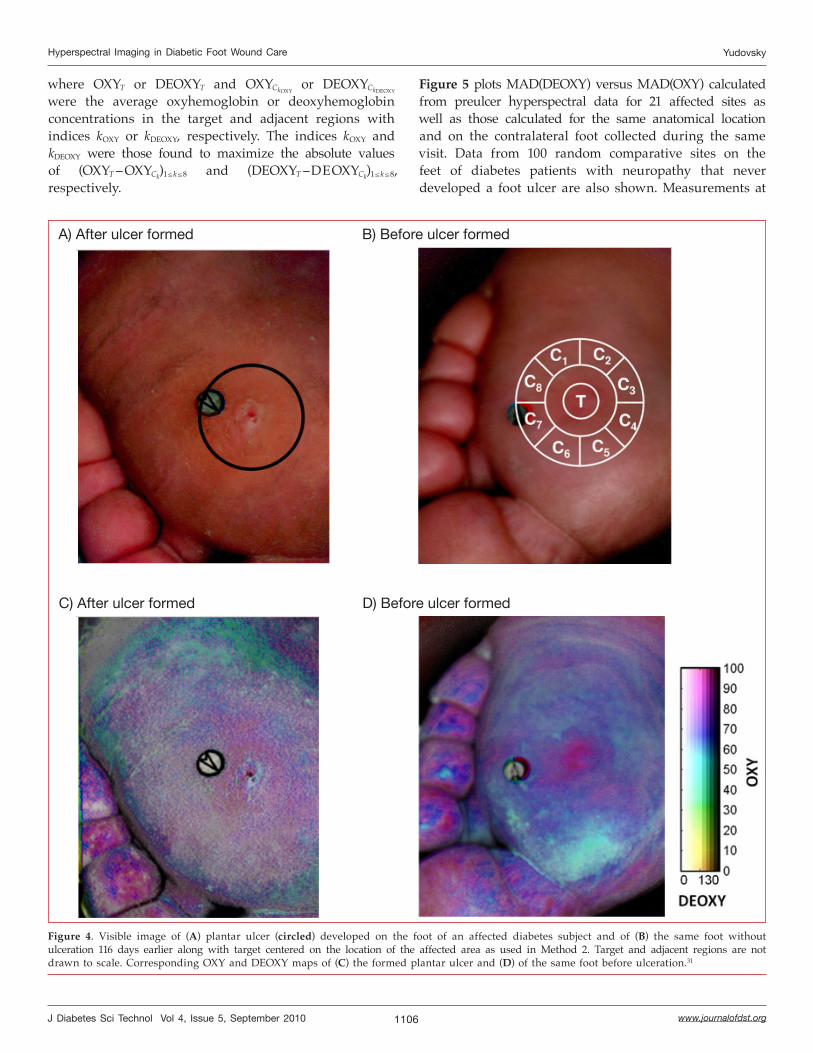
Figure 5 plots MAD(DEOXY) versus MAD(OXY) calculated from preulcer hyperspectral data for 21 affected sites as well as those calculated for the same anatomical location and on the contralateral foot collected during the same visit. Data from 100 random comparative sites on the feet of diabetes patients with neuropathy that never developed a foot ulcer are also shown. Measurements at
Figure 4. Visible image of (A) plantar ulcer (circled) developed on the foot of an affected diabetes subject and of (B) the same foot without ulceration 116 days earlier along with target centered on the location of the affected area as used in Method 2. Target and adjacent regions are not drawn to scale. Corresponding OXY and DEOXY maps of (C) the formed plantar ulcer and (D) of the same foot before ulceration.31
A) After ulcer formed B) Before ulcer formed
C) After ulcer formed D) Before ulcer formed
1107
Hyperspectral Imaging in Diabetic Foot Wound Care Yudovsky
www.journalofdst.orgJ Diabetes Sci Technol Vol 4, Issue 5, September 2010
sites that eventually developed ulcers exhibited the same sign in MAD(OXY) and MAD(DEOXY) corresponding to either hyperperfused (both positive) or hypovascular (both negative) tissue. On the other hand, data gathered at the contralateral sites and the comparative group showed no consistency in sign between MAD(OXY) and MAD(DEOXY) values. In fact, only 3 out of 21 contra-lateral sites and approximately half (47 out of 100) of the comparative sites exhibited the same sign between MAD(OXY) and MAD(DEOXY) values. Figure 5 also shows gray regions where MAD(OXY) and MAD(DEOXY) were greater than the detection thresholds TOXY=18 and TDEOXY= 5.8, respectively. These thresholds were determined such that |MAD(OXY)|>TOXY and |MAD(DEOXY)|>TDEOXY corresponded to affected tissue for a p-value of 0.0001.
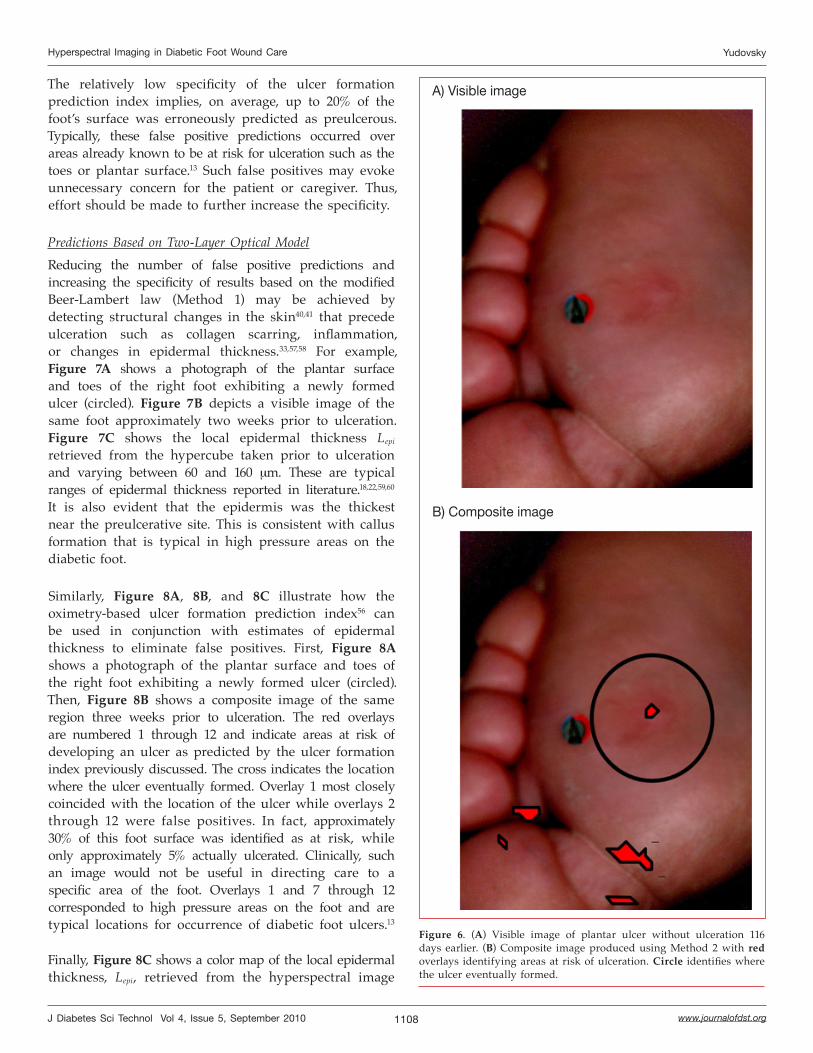
For illustration purposes, Figure 6A shows a visible image of a diabetic foot. It corresponds to what a clinician would see during the visit immediately preceding the ulceration. Figure 6B shows the associated composite image where red overlays indicate regions at risk of ulcer formation in which red pixels featured (1) MAD(OXY) greater than TOXY, (2) MAD(DEOXY) greater than TDEOXY, and (3) MAD(OXY) and MAD(DEOXY) with identical signs, when the target region T was centered at that pixel. One overlay clearly coincides with the shape and size of the ulcer that eventually formed 116 days later (Figure 4A). However, there were several false positives. Similar results were obtained at the other affected sites.56 The overall sensitivity and specificity of the ulcer formation prediction index were 95 and 80%, respectively.
Figure 5. Scatter plot showing values of MAD(OXY) and MAD(DEOXY) determined for 21 affected and 21 contralateral sites from diabetic subjects who developed foot ulcers, and from 100 random sites from diabetic subjects in the comparative groups. Values from affected areas were found to fall inside the gray regions where |MAD(OXY)| > 18 and |MAD(DEOXY)| > 5.8 with a p-value of less than 0.0001.56
p-value < 0.0001
Affected tissue
T oxy
Tdeoxy
-Tdeoxy
-Tox
y
1108
Hyperspectral Imaging in Diabetic Foot Wound Care Yudovsky
www.journalofdst.orgJ Diabetes Sci Technol Vol 4, Issue 5, September 2010
The relatively low specificity of the ulcer formation prediction index implies, on average, up to 20% of the foot’s surface was erroneously predicted as preulcerous. Typically, these false positive predictions occurred over areas already known to be at risk for ulceration such as the toes or plantar surface.13 Such false positives may evoke unnecessary concern for the patient or caregiver. Thus, effort should be made to further increase the specificity.
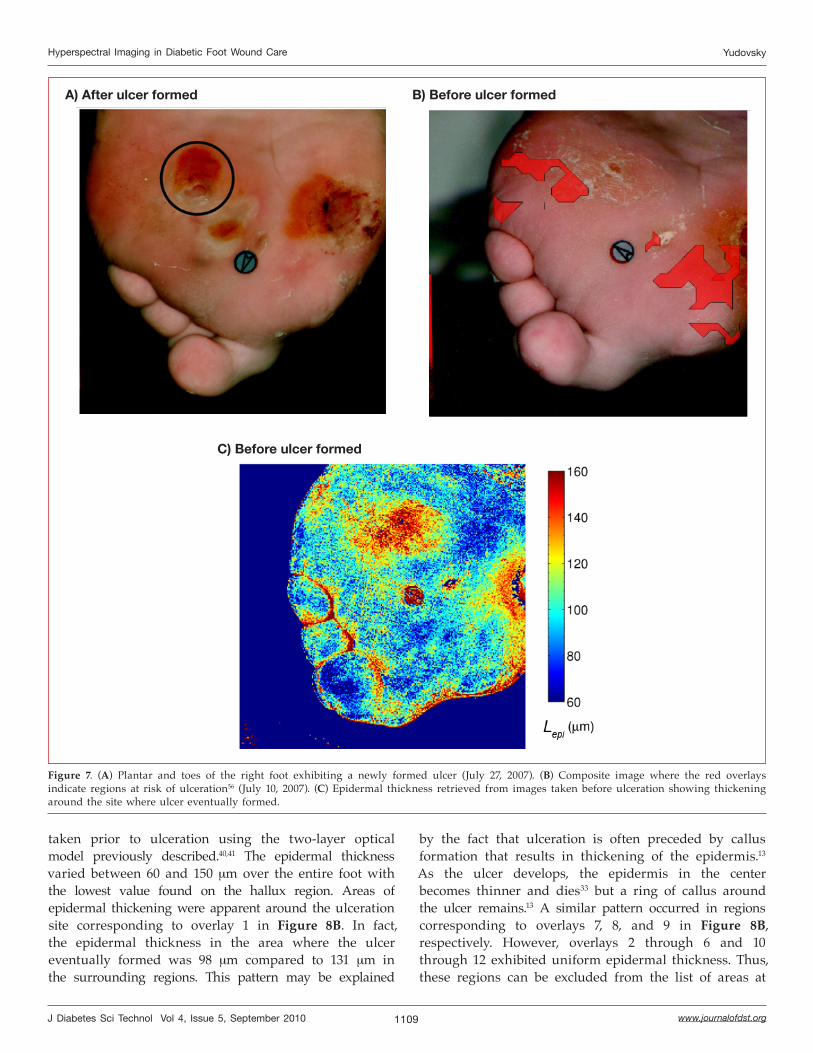
Predictions Based on Two-Layer Optical ModelReducing the number of false positive predictions and increasing the specificity of results based on the modified Beer-Lambert law (Method 1) may be achieved by detecting structural changes in the skin40,41 that precede ulceration such as collagen scarring, inflammation, or changes in epidermal thickness.33,57,58 For example, Figure 7A shows a photograph of the plantar surface and toes of the right foot exhibiting a newly formed ulcer (circled). Figure 7B depicts a visible image of the same foot approximately two weeks prior to ulceration. Figure 7C shows the local epidermal thickness Lepi retrieved from the hypercube taken prior to ulceration and varying between 60 and 160 mm. These are typical ranges of epidermal thickness reported in literature.18,22,59,60 It is also evident that the epidermis was the thickest near the preulcerative site. This is consistent with callus formation that is typical in high pressure areas on the diabetic foot.
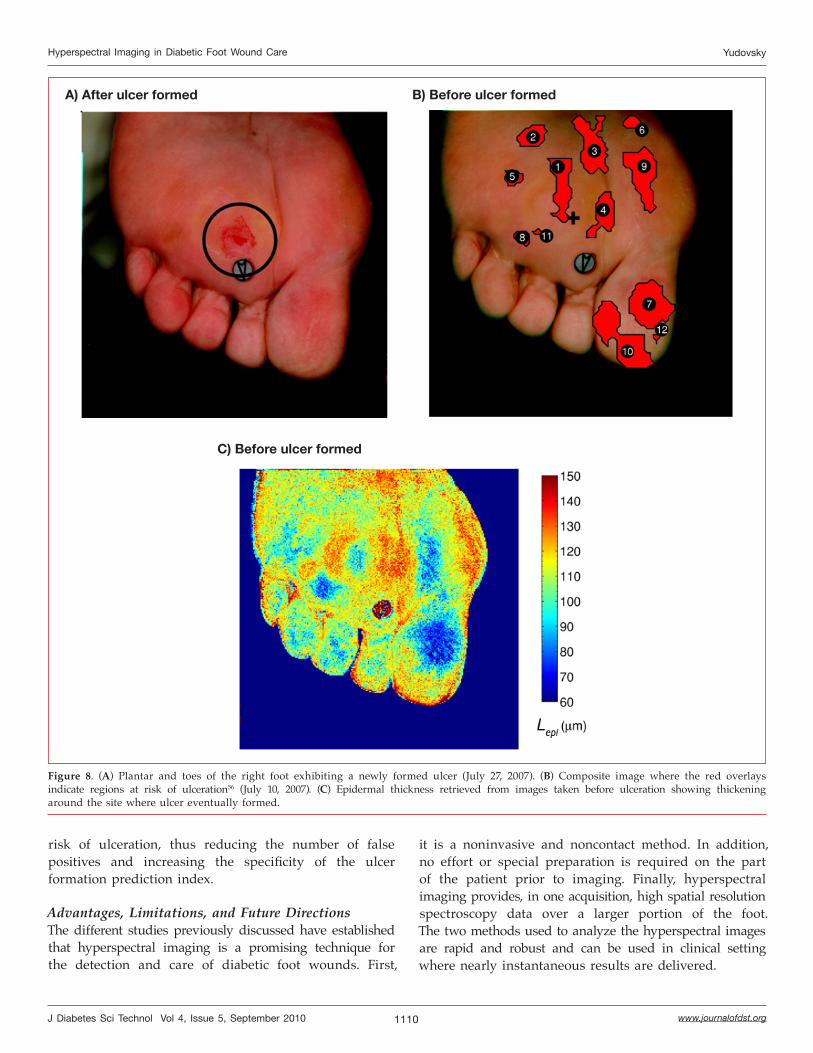
Similarly, Figure 8A, 8B, and 8C illustrate how the oximetry-based ulcer formation prediction index56 can be used in conjunction with estimates of epidermal thickness to eliminate false positives. First, Figure 8A shows a photograph of the plantar surface and toes of the right foot exhibiting a newly formed ulcer (circled). Then, Figure 8B shows a composite image of the same region three weeks prior to ulceration. The red overlays are numbered 1 through 12 and indicate areas at risk of developing an ulcer as predicted by the ulcer formation index previously discussed. The cross indicates the location where the ulcer eventually formed. Overlay 1 most closely coincided with the location of the ulcer while overlays 2 through 12 were false positives. In fact, approximately 30% of this foot surface was identified as at risk, while only approximately 5% actually ulcerated. Clinically, such an image would not be useful in directing care to a specific area of the foot. Overlays 1 and 7 through 12 corresponded to high pressure areas on the foot and are typical locations for occurrence of diabetic foot ulcers.13
Finally, Figure 8C shows a color map of the local epidermal thickness, Lepi, retrieved from the hyperspectral image
Figure 6. (A) Visible image of plantar ulcer without ulceration 116 days earlier. (B) Composite image produced using Method 2 with red overlays identifying areas at risk of ulceration. Circle identifies where the ulcer eventually formed.
A) Visible image
B) Composite image
1109
Hyperspectral Imaging in Diabetic Foot Wound Care Yudovsky
www.journalofdst.orgJ Diabetes Sci Technol Vol 4, Issue 5, September 2010
taken prior to ulceration using the two-layer optical model previously described.40,41 The epidermal thickness varied between 60 and 150 mm over the entire foot with the lowest value found on the hallux region. Areas of epidermal thickening were apparent around the ulceration site corresponding to overlay 1 in Figure 8B. In fact, the epidermal thickness in the area where the ulcer eventually formed was 98 mm compared to 131 mm in the surrounding regions. This pattern may be explained
A) After ulcer formed B) Before ulcer formed
C) Before ulcer formed
Figure 7. (A) Plantar and toes of the right foot exhibiting a newly formed ulcer (July 27, 2007). (B) Composite image where the red overlays indicate regions at risk of ulceration56 (July 10, 2007). (C) Epidermal thickness retrieved from images taken before ulceration showing thickening around the site where ulcer eventually formed.
by the fact that ulceration is often preceded by callus formation that results in thickening of the epidermis.13 As the ulcer develops, the epidermis in the center becomes thinner and dies33 but a ring of callus around the ulcer remains.13 A similar pattern occurred in regions corresponding to overlays 7, 8, and 9 in Figure 8B, respectively. However, overlays 2 through 6 and 10 through 12 exhibited uniform epidermal thickness. Thus, these regions can be excluded from the list of areas at
1110
Hyperspectral Imaging in Diabetic Foot Wound Care Yudovsky
www.journalofdst.orgJ Diabetes Sci Technol Vol 4, Issue 5, September 2010
risk of ulceration, thus reducing the number of false positives and increasing the specificity of the ulcer formation prediction index.
Advantages, Limitations, and Future DirectionsThe different studies previously discussed have established that hyperspectral imaging is a promising technique for the detection and care of diabetic foot wounds. First,
it is a noninvasive and noncontact method. In addition, no effort or special preparation is required on the part of the patient prior to imaging. Finally, hyperspectral imaging provides, in one acquisition, high spatial resolution spectroscopy data over a larger portion of the foot. The two methods used to analyze the hyperspectral images are rapid and robust and can be used in clinical setting where nearly instantaneous results are delivered.
Figure 8. (A) Plantar and toes of the right foot exhibiting a newly formed ulcer (July 27, 2007). (B) Composite image where the red overlays indicate regions at risk of ulceration56 (July 10, 2007). (C) Epidermal thickness retrieved from images taken before ulceration showing thickening around the site where ulcer eventually formed.
A) After ulcer formed B) Before ulcer formed
C) Before ulcer formed
1111
Hyperspectral Imaging in Diabetic Foot Wound Care Yudovsky
www.journalofdst.orgJ Diabetes Sci Technol Vol 4, Issue 5, September 2010
However, hyperspectral imaging has some limitations including the need to know the chromophores and structure of the tissue prior to image analysis.15,16,40 Thus, a hyperspectral imager developed for tissue oximetry from intact skin must be recalibrated to analyze reflectance from an open wound, for example. Furthermore, the experimental apparatus remains expensive and, while the image analysis is rapid, the clinical implementation remains cumbersome and relatively slow.
Future directions in the use of hyperspectral imaging for diabetic foot wound care include expanding the spectral range of the device to the UV and NIR part of the spectrum to expand the list of chromophores that can be monitored. On one hand, UV spectroscopy would enable the detection of bilirubin, which is a strong indicator of bruising.61,62 On the other, NIR spectroscopy would enable the detection of water content in the skin.63 Both of these elements play a role in foot ulcer formation and healing. Detecting them would provide a more complete assessment of tissue health as well as information about the physiological mechanisms responsible for ulcer formation and healing. In the near term, Method 2, whose feasibility has been demonstrated here, should be systematically applied to all data sets analyzed by Yudovsky et al.56 The sensitivity and specificity of these methods should then be compared. Finally, the two-layer model used in Method 2 could be refined to account for differences in the skin on the plantar surface of the foot and on the rest of the body for which it has been validated.
ConclusionThis article reviewed how hyperspectral tissue oximetry can (1) monitor diabetic neuropathy,30 (2) assess the risk of diabetic foot ulcer formation,56 and (3) predict the likelihood of ulcer healing31,32 for both type 1 and type 2 diabetic patients. Hardware, experimental procedure, and image analysis methods have been described in detail. Ulcer formation and healing prediction indices have been developed based on oxy- and deoxyhemoglobin concentration maps. In addition, a new spectroscopic analysis technique40,41 was shown to have the potential to detect changes in tissue structure such as epidermal thickness prior to ulceration. This can increase the specificity of the ulcer formation prediction index and give insight into the mechanisms responsible for ulcer formation and healing. Hyperspectral imaging can allow the physician to identify diabetic feet at risk of developing ulcer(s) and to predict if existing foot ulcers will heal, all during an initial screening instead of making multiple observations over several months.
Decisions about optimal therapy can be made earlier, thereby increasing the chance of preventing foot ulceration or preserving the affected limb.
Funding:
This research was funded in part through a grant from the National Institute of Diabetes and Digestive and Kidney Diseases (R42-DK069871).
Acknowledgements:
We thank Wendy Arriaga and Gustavo Chavez from Olive View-UCLA Medical Center who were extremely helpful with data collection. We are grateful to Rick Lifsitz and Kevin Schomacker for useful discussion and exchange of information.
References:
1. Wild S, Roglic G, Green A, Sicree R, King H. Global prevalence of diabetes: estimates for the year 2000 and projections for 2030. Diabetes Care. 2004;27(5):1047-53.
2. Shaw JE, Sicree RA, Zimmet PZ. Global estimates of the prevalence of diabetes for 2010 and 2030. Diabetes Res Clin Pract. 2010;87(1):4-14.
3. Reiber GE. The epidemiology of diabetic foot problems. Diabet Med. 1996;13(Suppl 1):S6-11.
4. Boulton AJ, Armstrong DG, Albert SF, Frykberg RG, Hellman R, Kirkman MS, Lavery LA, LeMaster JW, Mills JL Sr, Mueller MJ, Sheehan P, Wukich DK. Comprehensive foot examination and risk assessment. Endocr Pract. 2008;14(5):576-83.
5. Pecoraro RE, Reiber GE, Burgess EM. Pathways to diabetic limb amputation. Basis for prevention. Diabetes Care. 1990;13(5):513-21.
6. Frykberg RG, Zgonis T, Armstrong DG, Driver VR, Giurini JM, Kravitz SR, Landsman AS, Lavery LA, Moore JC, Schuberth JM, Wukich DK, Andersen C, Vanore JV. Diabetic foot disorders: a clinical practice guideline (2006 revision). J Foot Ankle Surg. 2006;45(5 Suppl):S1-66.
7. Shearer A, Scuffham P, Gordois A, Oglesby A. Predicted costs and outcomes from reduced vibration detection in people with diabetes in the U.S. Diabetes Care. 2003;26(8):2305-10.
8. Gordois A, Scuffham P, Shearer A, Oglesby A, Tobian JA. The health care costs of diabetic peripheral neuropathy in the US. Diabetes Care. 2003;26(6):1790-5.
9. Lavery LA, Armstrong DG, Vela SA, Quebedeaux TL, Fleischli JG. Practical criteria for screening patients at high risk for diabetic foot ulceration. Arch Intern Med. 1998;158(2):157-62.
10. Boulton AJM. The diabetic foot. Medicine. 2006;34(3):87-90.
11. Delbridge L, Ctercteko G, Fowler C, Reeve TS, Le Quesne LP. The aetiology of diabetic neuropathic ulceration of the foot. Br J Surg. 1985;72(1):1-6.
12. Palumbo PJ, Melton LJ III. Peripheral vascular disease and diabetes. Diabetes in America. 1995;2:401-8.
13. Apelqvist J, Bakker K, van Houtum WH, Nabuurs-Franssen MH, Schaper NC. International consensus and practical guidelines on the management and the prevention of the diabetic foot. Diabetes Metab Res Rev. 2000;16(Suppl 1):S84-92.
1112
Hyperspectral Imaging in Diabetic Foot Wound Care Yudovsky
www.journalofdst.orgJ Diabetes Sci Technol Vol 4, Issue 5, September 2010
14. Jacques SL, Ramella-Roman JC, Lee K. Imaging skin pathology with polarized light. J Biomed Opt. 2002;7(3):329-40.
15. Zuzak KJ, Schaeberle MD, Lewis EN, Levin IW. Visible reflectance hyperspectral imaging: characterization of a noninvasive, in vivo system for determining tissue perfusion. Anal Chem. 2002;74(9):2021-8.
16. Tuchin VV. Tissue optics: light scattering methods and instruments for medical diagnosis, 2nd ed. San Diego (CA): SPIE Press; 2007.
17. Young AR. Chromophores in human skin. Phys Med Biol. 1997;42(5):789-802.
18. Anderson RR, Parrish JA. The optics of human skin. J Invest Dermatol. 1981;77(1):13-9.
19. Van Gemert MJC, Welch AJ, Star WM, Motamedi M, Cheong WF. Tissue optics for a slab geometry in the diffusion approximation. Lasers Med Sci. 1987;2(4):295-302.
20. Dwyer T, Prota G, Blizzard L, Ashbolt R, Vincensi MR. Melanin density and melanin type predict melanocytic naevi in 19-20 year olds of northern European ancestry. Melanoma Res. 2000;10(4):387-94.
21. Dwyer T, Muller HK, Blizzard L, Ashbolt R, Phillips G. The use of spectrophotometry to estimate melanin density in Caucasians. Cancer Epidemiol Biomarkers Prev. 1998;7(3):203-6.
22. Jacques SL. Origins of tissue optical properties in the UVA, visible, and NIR regions. In: Alfano RR, Fujimoto JG, editors. OSA TOPS on Advances in Optical Imaging and Photon Migration, vol. 2. Washington (DC): Optical Society of America; 1996. pp. 364-9.
23. Sarna T, Sealy RC. Photoinduced oxygen consumption in melanin systems. Action spectra and quantum yields for eumelanin and synthetic melanin. Photochem Photobiol. 1984;39(1):69-74.
24. Prahl S. Optical absorption of hemoglobin. Available from: http://omlc.ogi.edu/spectra/hemoglobin/, 2002.
25. Valencia IC, Falabella A, Kirsner RS, Eaglstein WH. Chronic venous insufficiency and venous leg ulceration. J Am Acad Dermatol. 2001;44(3):401-24.
26. Ruiz-Maldonado R, Orozco-Covarrubias ML. Postinflammatory hypopigmentation and hyperpigmentation. Semin Cutan Med Surg. 1997;16(1):36-43.
27. Falanga V, Margolis D, Alvarez O, Auletta M, Maggiacomo F, Altman M, Jensen J, Sabolinski M, Hardin-Young J. Rapid healing of venous ulcers and lack of clinical rejection with an allogeneic cultured human skin equivalent. Arch Dermatol. 1998;134(3):293-300.
28. Phillips TJ, Dover JS. Leg ulcers. J Am Acad Dermatol. 1991; 25(6 Pt 1):965-87.
29. Sigel B, Ipsen J, Felix WR Jr. The epidemiology of lower extremity deep venous thrombosis in surgical patients. Ann Surg. 1974;179(3):278-90.
30. Greenman RL, Panasyuk S, Wang X, Lyons TE, Dinh T, Longoria L, Giurini JM, Freeman J, Khaodhiar L, Veves A. Early changes in the skin microcirculation and muscle metabolism of the diabetic foot. Lancet. 2005; 366(9498):1711-7.
31. Nouvong A, Hoogwerf B, Mohler E, Davis B, Tajaddini A, Medenilla E. Evaluation of diabetic foot ulcer healing with hyperspectral imaging of oxyhemoglobin and deoxyhemoglobin. Diabetes Care. 2009;32(11):2056-61.
32. Khaodhiar L, Dinh T, Schomacker KT, Panasyuk SV, Freeman JE, Lew R, Vo T, Panasyuk AA, Lima C, Giurini JM, Lyons TE, Veves A. The use of medical hyperspectral technology to evaluate microcirculatory changes in diabetic foot ulcers and to predict clinical outcomes. Diabetes Care. 2007;30(4):903-10.
33. Vande Berg JS, Rudolph R. Pressure (decubitus) ulcer: variation in histopathology—a light and electron microscope study. Hum Pathol. 1995;26(2):195-200.
34. Sassaroli A, Fantini S. Comment on the modified Beer-Lambert law for scattering media. Phys Med Biol. 2004;49(14):N255-7.
35. Van Gemert MJ, Jacques SL, Sterenborg HJ, Star WM. Skin optics. IEEE Trans Biomed Eng. 1989;36(12):1146-54.
36. Wray S, Cope M, Delpy DT, Wyatt JS, Reynolds EO. Characterization of the near infrared absorption spectra of cytochrome aa3 and haemoglobin for the non-invasive monitoring of cerebral oxygenation. Biochim Biophys Acta. 1988;933(1):184-92.
37. Harris AP, Sendak MJ, Donham RT, Thomas M, Duncan D. Absorption characteristics of human fetal hemoglobin at wavelengths used in pulse oximetry. J Clin Monit. 1987;4(3):175-7.
38. Takatani S, Graham MD. Theoretical analysis of diffuse reflectance from a two-layer tissue model. IEEE Trans Biomed Eng. 1979;26(12):656-64.
39. Marquardt DW. An algorithm for least-squares estimation of nonlinear parameters. J Soc Indust Appl Math. 1963;11(2):431-41.
40. Yudovsky D, Pilon L. Rapid and accurate estimation of blood saturation, melanin content, and epidermis thickness from spectral diffuse reflectance. Appl Opt. 2010;49(10):1707-19.
41. Yudovsky D, Pilon L. Simple and accurate expressions for diffuse reflectance of semi-infinite and two-layer absorbing and scattering media. Appl Opt. 2009;48(35):6670-83.
42. Van Gemert MJ, Star WM. Relations between the Kubelka-Munk and the transport equation models for anisotropic scattering. Lasers Life Sci. 1987;1(98):287-98.
43. Yudovsky D, Pilon L. Retrieving skin properties from in vivo diffuse reflectance measurements on human skin. J Biophotonics. Forthcoming 2010.
44. Gambichler T, Matip R, Moussa G, Altmeyer P, Hoffmann K. In vivo data of epidermal thickness evaluated by optical coherence tomography: effects of age, gender, skin type, and anatomic site. J Dermatol Sci. 2006;44(3):145-52.
45. Sandby-Møller J, Poulsen T, Wulf HC. Epidermal thickness at different body sites: relationship to age, gender, pigmentation, blood content, skin type and smoking habits. Acta Derm Venereol. 2003;83(6):410-3.
46. Lee Y, Hwang K. Skin thickness of Korean adults. Surg Radiol Anat. 2002;24(3-4):183-9.
47. Kelly RI, Pearse R, Bull RH, Leveque JL, de Rigal J, Mortimer PS. The effects of aging on the cutaneous microvasculature. J Am Acad Dermatol. 1995;33(5 Pt 1):749-56.
48. Salomatina E, Jiang B, Novak J, Yaroslavsky AN. Optical properties of normal and cancerous human skin in the visible and near-infrared spectral range. J Biomed Opt. 2006;11(6):064026.
49. Bashkatov AN, Genina EA, Kochubey VI, Tuchin VV. Optical properties of human skin, subcutaneous and mucous tissues in the wavelength range from 400 to 2000 nm. J Phys D Appl Phys. 2005;38(15):2543-55.
50. Simpson CR, Kohl M, Essenpreis M, Cope M. Near-infrared optical properties of ex-vivo human skin and subcutaneous tissues measured using the Monte Carlo inversion technique. Phys Med Biol. 1998;43(9):2465-78.
51. Dwyer PJ, DiMarzio CA. Hyperspectral imaging for dermal hemoglobin spectroscopy. Proceedings of the SPIE - Subsurface Sensors and Applications. 1999;3752:72-82.

1113
Hyperspectral Imaging in Diabetic Foot Wound Care Yudovsky
www.journalofdst.orgJ Diabetes Sci Technol Vol 4, Issue 5, September 2010
52. Gillies R, Freeman JE, Cancio LC, Brand D, Hopmeier M, Mansfield JR. Systemic effects of shock and resuscitation monitored by visible hyperspectral imaging. Diabetes Technol Ther. 2003;5(5):847-55.
53. Zonios G, Bykowski J, Kollias N. Skin melanin, hemoglobin, and light scattering properties can be quantitatively assessed in vivo using diffuse reflectance spectroscopy. J Invest Dermatol. 2001;117(6):1452-7.
54. Kalani M, Brismar K, Fagrell B, Ostergren J, Jörneskog G. Transcutaneous oxygen tension and toe blood pressure as predictors for outcome of diabetic foot ulcers. Diabetes Care. 1999;22(1):147-51.
55. Sheffield PJ. Measuring tissue oxygen tension: a review. Undersea Hyperb Med. 1998;25(3):179-88.
56. Yudovsky D, Nouvong A, Schomacker K, Pilon L. Assessing diabetic foot ulcer development risk with hyperspectral tissue oximetry. J Biomed Opt. 2010. (To be Published).
57. Ferguson MW, Herrick SE, Spencer MJ, Shaw JE, Boulton AJ, Sloan P. The histology of diabetic foot ulcers. Diabet Med 1996;13(Suppl 1):S30-3.
58. Witkowski JA. Parish LC. Histopathology of the decubitus ulcer. J Am Acad Dermatol. 1982;6(6):1014-21.
59. Doi M, Tominaga S. Spectral estimation of human skin color using the Kubelka-Munk theory. Proceedings of the SPIE - Color Imaging VIII: Processing, Hardcopy, and Applications. 2003;5008:221-8. doi:10.1117/12.472026
60. Flewelling R. Noninvasive optical monitoring. In: Bronzion J, editor. The biomedical engineering handbook. Boca Roton (FL): IEEE Press; 1981. pp. 1-11.
61. Hamdy MK, Kunkle LE, Rheins MS, Deatherage FE. Bruised tissue III. Some factors affecting experimental bruises. J Anim Sci. 1957;16(2):496-501.
62. Stephenson T. Ageing of bruising in children. J R Soc Med. 1997;90(6):312-4.
63. Ryan TJ, Thoolen M, Yang YH. The effect of mechanical forces (vibration or external compression) on the dermal water content of the upper dermis and epidermis, assessed by high frequency ultrasound. J Tissue Viability. 2001;11(3):97-101.