hypothesis testing. statistical methods estimation hypothesis testing inferential statistics...
TRANSCRIPT

HYPOTHESIS TESTING

StatisticalMethods
EstimationHypothesis
Testing
InferentialStatistics
DescriptiveStatistics
Statistical Methods

Statistical estimation
Population
Random sample
Parameters
Statistics
Every member of the population has the same chance of beingselected in the sample
estimation

Hypothesis Testing
Population
I believe the population mean age is 50 (hypothesis).
Mean X = 20
Random sample
Reject hypothesis! Not close.
Reject hypothesis! Not close.

Reason and Intuition

What is a What is a Hypothesis?Hypothesis?
A statistical hypotesis is simply a claim about a population that can be put to a test by drawing a random sample
A belief about a population parameter
• Parameter is population mean, proportion, variance
• Must be stated before analysis
I believe the mean GPA
of this class is 3.5!
© 1984-1994 T/Maker Co.

Statistical inference, Role of chance.
Formulate hypotheses
Collect data to test hypotheses
•Reason and intuition •Empirical observation
•Scientific knowledge

Formulate hypotheses
Collect data to test hypotheses
Accept hypothesis Reject hypothesis
C H A N C E
Random error (chance) can be controlled by statistical significanceor by confidence interval
Systematic error
Statistical Cont..

Testing of hypotheses Type I and Type II Errors
- level of significance 1- - power of the test
No study is perfect, there is always the chance for error
Decision H0 true / H A false H0 false / H A true Accept H 0 /
A OK p=1-
Type II error ( ) p=
Reject H 0 A
Type I error ( ) p=
OK p=1-

Errors in Making Decision
1. Type I Error• Reject true null hypothesis• Has serious consequences
• Probability of Type I Error is (alpha) Called level of significance
2. Type II Error• Do not reject false null hypothesis
• Probability of Type II Error is (beta)

& Have an Inverse Relationship
You can’t reduce both errors simultaneously!
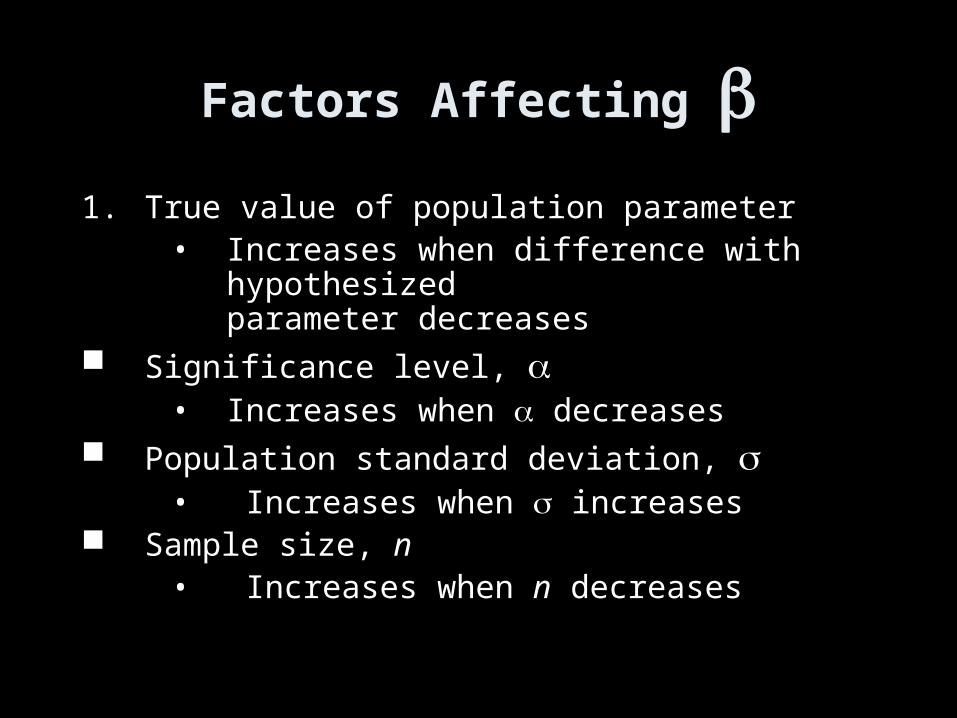
Factors Affecting 1. True value of population parameter
• Increases when difference with hypothesizedparameter decreases
Significance level, • Increases when decreases
Population standard deviation, • Increases when increases
Sample size, n• Increases when n decreases

p-Value
Probability of obtaining a test statistic more extreme
(or than actual sample value, given H0 is true
Called observed level of significance
• Smallest value of for which H0 can be rejected
1. Used to make rejection decision
• If p-value , do not reject H0
• If p-value < , reject H0

Testing of hypothesesDefinition of p-value.
AGE
58.853.848.843.838.833.828.823.8
90
80
70
60
50
40
30
20
10
0
95%2.5% 2.5%
If our observed age value lies outside the black lines, the probability of getting a value as extreme as this if the null hypothesis is true is < 5%
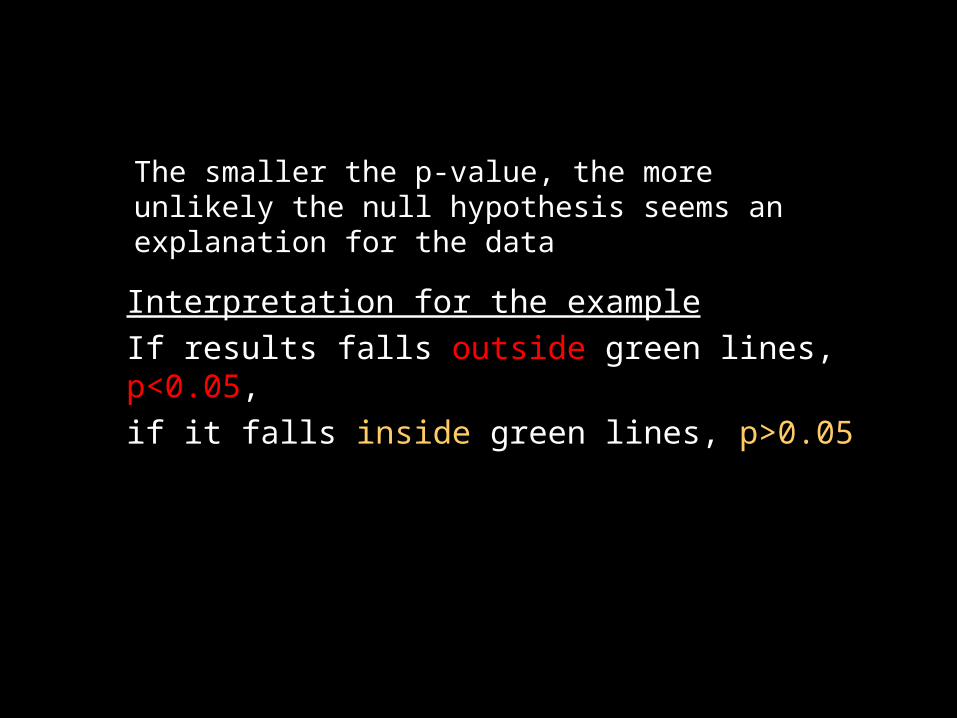
The smaller the p-value, the more unlikely the null hypothesis seems an explanation for the data
Interpretation for the exampleIf results falls outside green lines, p<0.05, if it falls inside green lines, p>0.05
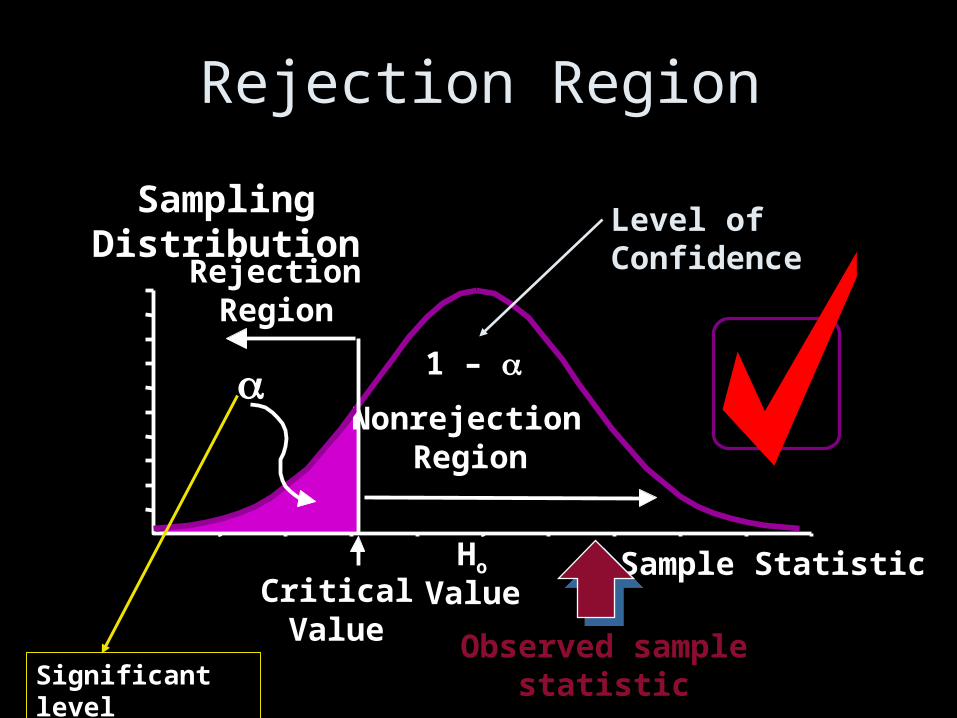
Rejection Region
Ho
ValueCriticalValue
Sample Statistic
RejectionRegion
NonrejectionRegion
Sampling Distribution
1 –
Level of Confidence
Observed sample statisticSignificant level

Rejection Cont..
Ho
Value CriticalValue
CriticalValue
1/2 1/2
Sample Statistic
RejectionRegion
RejectionRegion
NonrejectionRegion
Sampling Distribution
1 –
Level of ConfidenceSampling Distribution
Level of Confidence
Observed sample statistic

Build hypothesis
Null hypothesis H00 - - there is no difference
Alternative hypothesis Haa - question explored by the investigator
Statistical method are used to test hypotheses
The null hypothesis is the basis for statistical test.

Null Hypothesis H0
A statement about the value of a population parameter
Null Hypothesis
1. What is tested
2. Has serious outcome if incorrect decision made• Always has equality sign: =, or • Designated H0 (pronounced H-oh)
• Specified as H0: µ = some numeric value
– Specified with = sign even if or
– Example, H0: µ = 3

Alternative Hypothesis
• Opposite of null hypothesis
• Always has inequality sign: , or • Designated Ha
• Specified Ha: ,, or some value
Example, Ha: < 3
Alternative Hypothesis H1:
A statement that is accepted if the sample data provide evidence that
the null hypothesis is false

Test statistic Test statistic
z, t, F, 2
A value, determined from sample information, used to determine whether or not to reject the null hypothesis.

Identifying Hypotheses Steps
D o n o t re jec t n u ll R e jec t n u ll an d accep t a lte rn a te
S tep 5 : Take a sam p le , a rrive a t a d ec is ion
S tep 4 : F orm u la te a d ec is ion ru le
S tep 3 : Id en tify th e tes t s ta tis t ic
S tep 2 : S e lec t a leve l o f s ig n ifican ce
S tep 1 : S ta te n u ll an d a lte rn a te h yp o th eses

Example
The processors of Fries’ Catsup indicate on the label that the bottle contains 16 ounces of catsup. The standard deviation of the process is 0.5 ounces. A sample of 36 bottles from last hour’s production revealed a mean weight of 16.12 ounces per bottle. At the .05 significance level is the process out of control? That is, can we conclude that the mean amount per bottle is different from 16 ounces?
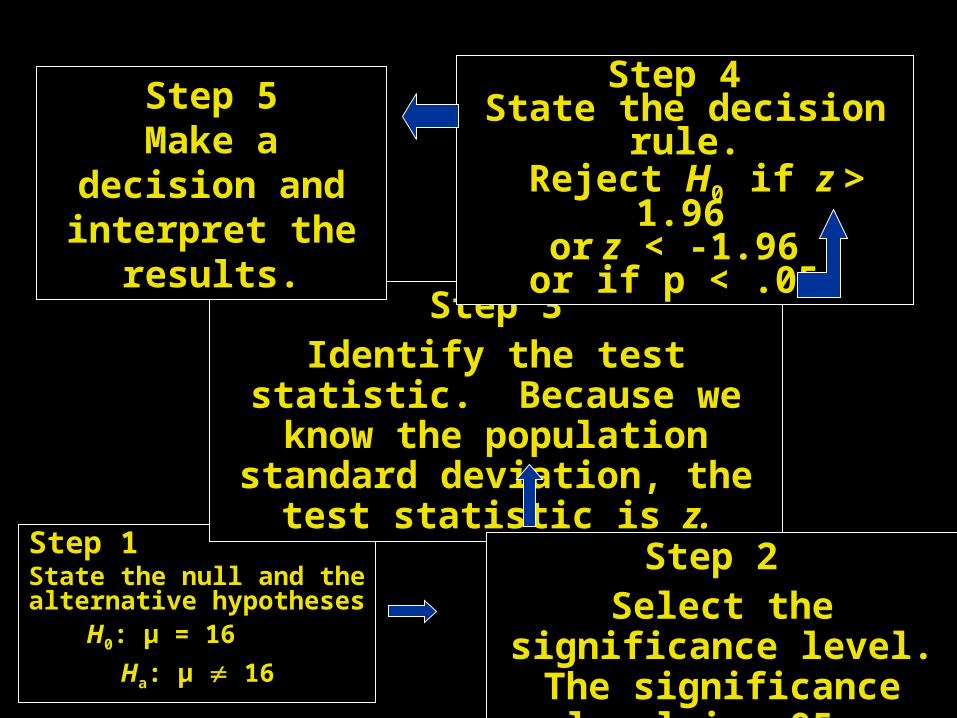
Step 1 State the null and the alternative hypotheses H0: µ = 16
Ha: µ 16
Step 3Identify the test statistic. Because we know the population standard
deviation, the test statistic is z.
Step 2 Select the significance level. The significance level is .05.
Step 4 State the decision rule. Reject H0 if z > 1.96
or z < -1.96 or if p < .05.
Step 5Make a decision and interpret the results.

z=X−μ
σ=
16 .12−16 .000 .5
=0 .24
¿Computed z of 0.24
< Critical z of 1.96,
Do not reject the null hypothesis.
Step 5: Make a decision and interpret the results.
We cannot conclude the
mean is different from 16 ounces.

z=X−m
s / n
Testing for the Testing for the Population Mean: Population Mean:
Large Sample, Large Sample, Population Standard Population Standard Deviation UnknownDeviation Unknown
Here is unknown, so we estimate it with the sample
standard deviation s.
As long as the sample size n > 30, z can be approximated using
Roder’s Discount Store chain issues its own credit card. Lisa, the credit manager, wants to find out if the mean monthly unpaid balance is more than $400. The level of significance is set at .05. A random check of 172 unpaid balances revealed the sample mean to be $407 and the sample standard deviation to be $38.
Should Lisa conclude that the population mean is greater than $400, or is it reasonable to assume that the difference of $7 ($407-$400) is due to chance?

Step 1
H0: µ < $400
H1: µ > $400
Step 2The significance
level is .05.
Step 3 Because the sample is large
we can use the z distribution as the test
statistic.
Step 4H0 is rejected if
z > 1.65
Step 5Make a decision and interpret the
results.

z=X− μ
s / n=
$ 407−$ 400
$ 38 /172=2 . 42
oComputed z of 2.42
> Critical z of 1.65,
Step 5Make a decision and interpret the
results.
Lisa can conclude that the mean unpaid balance
is greater than $400.

t=X−μ
s /n
The critical value of t is determined by its degrees of
freedom equal to n-1.
Testing for a Testing for a Population Mean: Population Mean:
Small Sample, Small Sample, Population Population
Standard Deviation Standard Deviation UnknownUnknown
The test statistic is the t
distribution.

The current rate for producing 5 amp fuses at Neary Electric Co. is 250 per hour. A new machine has been purchased and installed that, according to the supplier, will increase the production rate. The production hours are normally distributed. A sample of 10 randomly selected hours from last month revealed that the mean hourly production on the new machine was 256 units, with a sample standard deviation of 6 per hour.
At the .05 significance level can Neary conclude that the new machine is faster?

Step 4 State the decision rule.There are 10 – 1 = 9 degrees of freedom.
Step 1
State the null and alternate hypotheses.
H0: µ < 250
H1: µ > 250
Step 2 Select the level of
significance. It is .05.
Step 3 Find a test statistic. Use the t distribution since is not known and n < 30.
The null hypothesis is rejected if t > 1.833

t=X−μ
s / n=
256−250
6 /10=3 .162
oComputed t of 3.162 >Critical t of 1.833
Step 5 Make a decision and interpret the
results.
The mean number of amps produced is more than 250 per
hour.
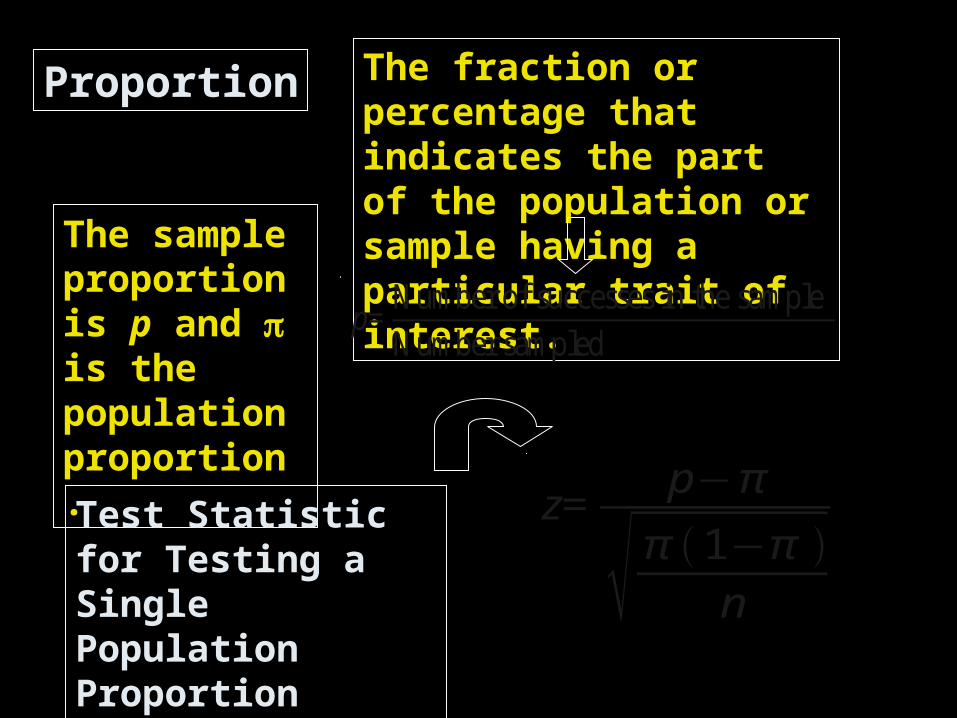
z=p−π
π 1−π n
The sample proportion is p and is the population proportion.
The fraction or percentage that indicates the part of the population or sample having a particular trait of interest.
p=Number of successes in the sampleNumber sampled
ProportionProportion
Test Statistic for Testing a Single Population Proportion

In the past, 15% of the mail order solicitations for a certain charity resulted in a financial contribution. A new solicitation letter that has been drafted is sent to a sample of 200 people and 45 responded with a contribution. At the .05 significance level can it be concluded that the new letter is more effective?

Step 1State the null and the alternate hypothesis.
H0: p < .15 H1: p > .15
Step 2Select the level of
significance. It is .05.
Step 3Find a test statistic. The z distribution is the test statistic.
Step 4State the decision rule.The null hypothesis is rejected if z is greater
than 1.65 .
Step 5Make a decision and interpret the results.

z=p−π
π 1−π n
=
45200
−. 15
.15 1−. 15200
=2 . 97
Because the computed z of 2.97 > critical z of 1.65, the null hypothesis is rejected. More than 15 percent responding with a pledge. The new letter is more effective.
Step 5: Make a decision and interpret the results.

THANK YOU