hypothetical portfolio illustration -...
TRANSCRIPT

Hypothetical Portfolio Illustration06-30-2003 to 09-30-2004
Portfolio SummaryPlanning Assumptions
Performance
Federal Income Tax RateCapital Gain Tax RateState Tax RateTax Paid Out of PocketRebalance
Net Dollars InvestedFinal Market ValueAverage Annualized ReturnCumulative Return
0%0%0%
No
$118,530$130,948
7.80%9.88%
Portfolio Custom Benchmark
10
20
30
40
50
60
70
80
90
100
110
120
130
140
150
160
170
180
190
200(Value: $000)
06-03 07-03 08-03 09-03 10-03 11-03 12-03 01-04 02-04 03-04 04-04 05-04 06-04 07-04 08-04
Investment DetailPeriod Beginning Balance New Investment Distribution/Withdrl Total Reinvest Charges & Fees Taxes Due Market Value Total Return %
0.00 130,000 11,470 3,294 475 0 130,948 7.80Totals
0 120,000 0 0 420 0 119,580 -0.35June 2003119,580 0 0 123 0 0 119,086 -0.41July 2003119,086 0 0 188 0 0 118,054 -0.87August 2003118,054 0 0 253 0 0 118,800 0.63September 2003
118,800 10,000 0 154 0 0 134,047 4.08October 2003134,047 0 0 189 0 0 136,058 1.50November 2003136,058 0 0 395 0 0 140,697 3.41December 2003140,697 0 0 115 0 0 142,467 1.26January 2004
142,467 0 0 273 0 0 143,939 1.03February 2004143,939 0 0 200 0 0 141,730 -1.53March 2004141,730 0 0 156 0 0 138,893 -2.00April 2004138,893 0 0 257 0 0 140,054 0.84May 2004
140,054 0 11,470 311 55 0 130,758 1.55June 2004130,758 0 0 150 0 0 129,375 -1.06July 2004129,375 0 0 214 0 0 130,248 0.67August 2004130,248 0 0 315 0 0 130,948 0.54September 2004
Page 1 of 7Release date 09-30-2004
©2004 Morningstar Associates, LLC. All Rights Reserved. The information, data, analyses and opinions contained herein (1) include the confidential and proprietary information of Morningstar, (2) may not be copied or redistributed,(3) do not constitute investment advice offered by Morningstar, (4) are provided solely for informational purposes and therefore are not an offer to buy or sell a security, and (5) are not warranted to be correct, complete or accurate. Except as otherwise required by law, Morningstar shall not be responsible for any trading decisions, damages or other losses resulting from, or related to, this information, data, analyses or opinions or their use. This report is supple- mental sales literature. If applicable it must be preceded or accompanied by a prospectus, or equivalent, and disclosure statement.
Note: Portions of the analysis are based on pre-inception returns. Please read disclosure for more information.

Hypothetical Illustration for Merrill Lynch Money Market (MM)10-01-2003 to 09-30-2004
Security SummaryInitial Subsequent ReinvestInvestment Invest/Withdwl Distributions Liquidate Charges and Fees Market Value
Amount Amount Freq Income Cap Front Annual End$Load Fee %Gains
10,000 0 - Y Y N 0.00% 0 10,139
Custom Benchmark
Tax Rates
Performance
Market Value Breakdown
Federal Income Tax RateCapital Gain Tax RateState Tax RateTax Paid
Net Dollars InvestedFinal Market ValueAverage Annualized ReturnCumulative Return
Out of Pocket
28%15%0%
$10,000$10,139
1.39%1.39%
7-day Yield 0.95%
End
PrincipalIncomeCap Gain
100.0%0.0%0.0%
10,000
20,000(Value: $)
10-03 11-03 12-03 01-04 02-04 03-04 04-04 05-04 06-04 07-04 08-04
Investment DetailPeriod Beginning Balance New Investment Distribution/Withdrl Total Reinvest Charges & Fees Taxes Due Market Value Total Return %
0.00 10,000 0 0 0 0 10,139 1.39Totals
0 10,000 0 0 0 0 10,015 0.15October 200310,015 0 0 0 0 0 10,015 0.00November 200310,015 0 0 0 0 0 10,031 0.15December 200310,031 0 0 0 0 0 10,046 0.15January 2004
10,046 0 0 0 0 0 10,046 0.00February 200410,046 0 0 0 0 0 10,062 0.15March 200410,062 0 0 0 0 0 10,062 0.00April 200410,062 0 0 0 0 0 10,077 0.15May 2004
10,077 0 0 0 0 0 10,092 0.15June 200410,092 0 0 0 0 0 10,108 0.15July 200410,108 0 0 0 0 0 10,123 0.15August 200410,123 0 0 0 0 0 10,139 0.15September 2004
Page 1 of 17Release date 09-30-2004
©2004 Morningstar Associates, LLC. All Rights Reserved. The information, data, analyses and opinions contained herein (1) include the confidential and proprietary information of Morningstar, (2) may not be copied or redistributed,(3) do not constitute investment advice offered by Morningstar, (4) are provided solely for informational purposes and therefore are not an offer to buy or sell a security, and (5) are not warranted to be correct, complete or accurate. Except as otherwise required by law, Morningstar shall not be responsible for any trading decisions, damages or other losses resulting from, or related to, this information, data, analyses or opinions or their use. This report is supple- mental sales literature. If applicable it must be preceded or accompanied by a prospectus, or equivalent, and disclosure statement.
Performance DisclosureThe performance data quoted represents past performance and does not guarantee future results. The investment return and principal value of an investment willfluctuate thus an investor's shares, when redeemed, may be worth more or less than their original cost. Current performance may be lower or higher than return data quoted herein. For performance data current to most recent month end, please call 800 123-4567 or visit www.merrilllynch.com. An investmentin the fund is not insured or guaranteed by the FDIC or any other government agency. The current yield quotation more closely reflects the current earnings of the money market fund than the total return quotation. Although the fund seeks to preserve the value of your investment at $1.00 per share, it is possible to losemoney by investing in the fund.

Hypothetical Illustration for AARP Var Annty Dreyfus Apprec (VA)06-30-2003 to 09-30-2004
Security SummaryInitial SubsequentInvestment Invest/Withdwl Liquidate Contract Charge Charges and Fees Market Value
Amount Amount Freq Front Surrender Charge Period End$$ %Load Amount % Years
10,000 0 - N 25 0.00 0.00% 5.00-0.00 6 10,816
Custom Benchmark
Tax Rates
Performance
Federal Income Tax RateCapital Gain Tax RateState Tax RateTax Paid
Net Dollars InvestedFinal Market ValueAverage Annualized ReturnCumulative Return
Out of Pocket
28%15%0%
$10,000$10,816
6.45%8.16%
10,000
20,000(Value: $)
06-03 07-03 08-03 09-03 10-03 11-03 12-03 01-04 02-04 03-04 04-04 05-04 06-04 07-04 08-04
Performance DisclosureThe performance data quoted represents past performance and does not guarantee future results. The investment return and principal value of an investment willfluctuate thus an investor's shares, when redeemed, may be worth more or less than their original cost. Current performance may be lower or higher than returndata quoted herein. For performance data current to the most recent month-end, please call 800-923-3334 or visit www.thehartford.com
Investment DetailPeriod Beginning Balance New Investment Distribution/Withdrl Total Reinvest Charges & Fees Taxes Due Market Value Total Return %
0.00 10,000 0 0 25 0 10,816 6.45Totals
0 10,000 0 0 0 0 10,000 0.00June 200310,000 0 0 0 0 0 9,964 -0.36July 20039,964 0 0 0 0 0 10,095 1.31August 2003
10,095 0 0 0 0 0 10,078 -0.17September 2003
10,078 0 0 0 0 0 10,466 3.86October 200310,466 0 0 0 0 0 10,603 1.31November 200310,603 0 0 0 0 0 11,120 4.87December 200311,120 0 0 0 0 0 11,235 1.03January 2004
11,235 0 0 0 0 0 11,473 2.12February 200411,473 0 0 0 0 0 11,173 -2.61March 200411,173 0 0 0 0 0 11,188 0.13April 200411,188 0 0 0 0 0 11,178 -0.09May 2004
11,178 0 0 0 25 0 11,260 0.74June 200411,260 0 0 0 0 0 10,928 -2.95July 200410,928 0 0 0 0 0 11,003 0.69August 200411,003 0 0 0 0 0 10,816 -1.70September 2004
Page 2 of 17Release date 09-30-2004
©2004 Morningstar Associates, LLC. All Rights Reserved. The information, data, analyses and opinions contained herein (1) include the confidential and proprietary information of Morningstar, (2) may not be copied or redistributed,(3) do not constitute investment advice offered by Morningstar, (4) are provided solely for informational purposes and therefore are not an offer to buy or sell a security, and (5) are not warranted to be correct, complete or accurate. Except as otherwise required by law, Morningstar shall not be responsible for any trading decisions, damages or other losses resulting from, or related to, this information, data, analyses or opinions or their use. This report is supple- mental sales literature. If applicable it must be preceded or accompanied by a prospectus, or equivalent, and disclosure statement.
Market Value Breakdown
7-day Yield 0.00%
End
PrincipalIncomeCap Gain
100.0%0.0%0.0%

Hypothetical Illustration for ABN AMRO High Yield Bd I (MF)06-30-2003 to 09-30-2004
Security SummaryInitial Subsequent ReinvestInvestment Invest/Withdwl Distributions Liquidate Charges and Fees Market Value
Amount Amount Freq Income Cap Front Annual Deferred Load Period End$Gains Load Fee % Amount % Years
10,000 0 - Y Y N 0.000.00% 0.00-0.00 0 11,297
Custom Benchmark
Tax Rates
Performance
Market Value Breakdown
Federal Income Tax RateCapital Gain Tax RateState Tax RateTax Paid
Net Dollars InvestedFinal Market ValueAverage Annualized ReturnCumulative Return
Out of Pocket
28%15%0%
$10,262$11,297
8.14%10.31%
End
PrincipalIncomeCap Gain
91.5%8.5%0.0%
10,000
20,000(Value: $)
06-03 07-03 08-03 09-03 10-03 11-03 12-03 01-04 02-04 03-04 04-04 05-04 06-04 07-04 08-04
Performance DisclosureThe performance data quoted represents past performance and does not guarantee future results. The investment return and principal value of an investment willfluctuate thus an investor's shares, when redeemed, may be worth more or less than their original cost. Current performance may be lower or higher than returndata quoted herein. For performance data current to the most recent month-end, please call 800-992-8151 or visit www.abnamrofunds.com
Investment DetailPeriod Beginning Balance New Investment Distribution/Withdrl Total Reinvest Charges & Fees Taxes Due Market Value Total Return %
0.00 10,000 0 942 0 262 11,297 8.14Totals
0 10,000 0 0 0 0 10,000 0.00June 200310,000 0 0 34 0 0 9,854 -1.47July 20039,854 0 0 54 0 0 9,978 1.26August 20039,978 0 0 62 0 0 10,211 2.34September 2003
10,211 0 0 63 0 0 10,376 1.61October 200310,376 0 0 54 0 0 10,491 1.11November 200310,491 0 0 77 0 0 10,681 1.81December 200310,681 0 0 64 0 0 10,786 0.99January 2004
10,786 0 0 60 0 0 10,814 0.26February 200410,814 0 0 72 0 0 10,907 0.86March 200410,907 0 0 65 0 96 10,825 -1.63April 200410,825 0 0 63 0 0 10,655 -1.57May 2004
10,655 0 0 71 0 0 10,779 1.16June 200410,779 0 0 70 0 0 10,946 1.55July 200410,946 0 0 70 0 0 11,134 1.72August 200411,134 0 0 65 0 166 11,297 -0.03September 2004
Page 3 of 17Release date 09-30-2004
©2004 Morningstar Associates, LLC. All Rights Reserved. The information, data, analyses and opinions contained herein (1) include the confidential and proprietary information of Morningstar, (2) may not be copied or redistributed,(3) do not constitute investment advice offered by Morningstar, (4) are provided solely for informational purposes and therefore are not an offer to buy or sell a security, and (5) are not warranted to be correct, complete or accurate. Except as otherwise required by law, Morningstar shall not be responsible for any trading decisions, damages or other losses resulting from, or related to, this information, data, analyses or opinions or their use. This report is supple- mental sales literature. If applicable it must be preceded or accompanied by a prospectus, or equivalent, and disclosure statement.

Hypothetical Illustration for AIG Profile VA Fidel Mny Mkt (VA)06-30-2003 to 09-30-2004
Security SummaryInitial SubsequentInvestment Invest/Withdwl Liquidate Contract Charge Charges and Fees Market Value
Amount Amount Freq Front Surrender Charge Period End$$ %Load Amount % Years
10,000 0 - N 30 0.00 0.00% 6.00-0.00 8 9,913
Custom Benchmark
Tax Rates
Performance
Federal Income Tax RateCapital Gain Tax RateState Tax RateTax Paid
Net Dollars InvestedFinal Market ValueAverage Annualized ReturnCumulative Return
Out of Pocket
28%15%0%
$10,000$9,913-0.69%0.67%
10,000
20,000(Value: $)
06-03 07-03 08-03 09-03 10-03 11-03 12-03 01-04 02-04 03-04 04-04 05-04 06-04 07-04 08-04
Investment DetailPeriod Beginning Balance New Investment Distribution/Withdrl Total Reinvest Charges & Fees Taxes Due Market Value Total Return %
0.00 10,000 0 0 30 0 9,913 -0.69Totals
0 10,000 0 0 0 0 10,000 0.00June 200310,000 0 0 0 0 0 9,995 -0.05July 20039,995 0 0 0 0 0 9,991 -0.04August 20039,991 0 0 0 0 0 9,986 -0.05September 2003
9,986 0 0 0 0 0 9,981 -0.05October 20039,981 0 0 0 0 0 9,978 -0.04November 20039,978 0 0 0 0 0 9,973 -0.05December 20039,973 0 0 0 0 0 9,969 -0.04January 2004
9,969 0 0 0 0 0 9,965 -0.04February 20049,965 0 0 0 0 0 9,960 -0.05March 20049,960 0 0 0 0 0 9,955 -0.04April 20049,955 0 0 0 0 0 9,951 -0.04May 2004
Page 4 of 17Release date 09-30-2004
©2004 Morningstar Associates, LLC. All Rights Reserved. The information, data, analyses and opinions contained herein (1) include the confidential and proprietary information of Morningstar, (2) may not be copied or redistributed,(3) do not constitute investment advice offered by Morningstar, (4) are provided solely for informational purposes and therefore are not an offer to buy or sell a security, and (5) are not warranted to be correct, complete or accurate. Except as otherwise required by law, Morningstar shall not be responsible for any trading decisions, damages or other losses resulting from, or related to, this information, data, analyses or opinions or their use. This report is supple- mental sales literature. If applicable it must be preceded or accompanied by a prospectus, or equivalent, and disclosure statement.
Market Value Breakdown
7-day Yield 0.95%
End
PrincipalIncomeCap Gain
100.0%0.0%0.0%
Performance DisclosureThe performance data quoted represents past performance and does not guarantee future results. The investment return and principal value of an investment willfluctuate thus an investor's shares, when redeemed, may be worth more or less than their original cost. Current performance may be lower or higher than return data quoted herein. For performance data current to most recent month end, please call 800 123-4567 or visit www.aig.com. An investment in the fund is not insured or guaranteed by the FDIC or any other government agency. The current yield quotation more closely reflects the current earnings of the money market fund than the total return quotation. Although the fund seeks to preserve the value of your investment at $1.00 per share, it is possible to losemoney by investing in the fund.

Hypothetical Illustration for Aberdeen Global Income (CE)06-30-2003 to 09-30-2004
Security SummaryInitial Subsequent ReinvestInvestment Invest/Withdwl Distributions Liquidate Charges and Fees Market Value
Amount Amount Freq Income Cap Front Annual End$Load Fee %Gains
10,000 0 - Y Y N 0.00% 0.00 11,673
Custom Benchmark
Tax Rates
Performance
Market Value Breakdown
Federal Income Tax RateCapital Gain Tax RateState Tax RateTax Paid
Net Dollars InvestedFinal Market ValueAverage Annualized ReturnCumulative Return
Out of Pocket
28%15%0%
$10,214$11,67311.43%14.55%
End
PrincipalIncomeCap Gain
93.2%6.8%0.0%
10,000
20,000(Value: $)
06-03 07-03 08-03 09-03 10-03 11-03 12-03 01-04 02-04 03-04 04-04 05-04 06-04 07-04 08-04
Performance DisclosureThe performance data quoted represents past performance and does not guarantee future results. The investment return and principal value of an investment willfluctuate thus an investor's shares, when redeemed, may be worth more or less than their original cost. Current performance may be lower or higher than returndata quoted herein. For performance data current to the most recent month-end, please call - or visit www.aberdeen-asset.com
Investment DetailPeriod Beginning Balance New Investment Distribution/Withdrl Total Reinvest Charges & Fees Taxes Due Market Value Total Return %
0.00 10,000 0 770 0 214 11,673 11.43Totals
0 10,000 0 0 0 0 10,000 0.00June 200310,000 0 0 50 0 0 9,560 -4.40July 20039,560 0 0 50 0 0 9,170 -4.08August 20039,170 0 0 50 0 0 10,047 9.57September 2003
10,047 0 0 50 0 0 11,493 14.39October 200311,493 0 0 51 0 0 12,076 5.07November 200312,076 0 0 51 0 0 12,103 0.22December 200312,103 0 0 51 0 0 11,489 -5.07January 2004
11,489 0 0 51 0 0 11,745 2.23February 200411,745 0 0 52 0 0 11,942 1.68March 200411,942 0 0 52 0 84 10,338 -14.09April 200410,338 0 0 52 0 0 10,599 2.52May 2004
10,599 0 0 52 0 0 10,556 -0.40June 200410,556 0 0 53 0 0 11,143 5.56July 200411,143 0 0 53 0 0 11,302 1.42August 200411,302 0 0 53 0 130 11,673 2.14September 2004
Page 5 of 17Release date 09-30-2004
©2004 Morningstar Associates, LLC. All Rights Reserved. The information, data, analyses and opinions contained herein (1) include the confidential and proprietary information of Morningstar, (2) may not be copied or redistributed,(3) do not constitute investment advice offered by Morningstar, (4) are provided solely for informational purposes and therefore are not an offer to buy or sell a security, and (5) are not warranted to be correct, complete or accurate. Except as otherwise required by law, Morningstar shall not be responsible for any trading decisions, damages or other losses resulting from, or related to, this information, data, analyses or opinions or their use. This report is supple- mental sales literature. If applicable it must be preceded or accompanied by a prospectus, or equivalent, and disclosure statement.
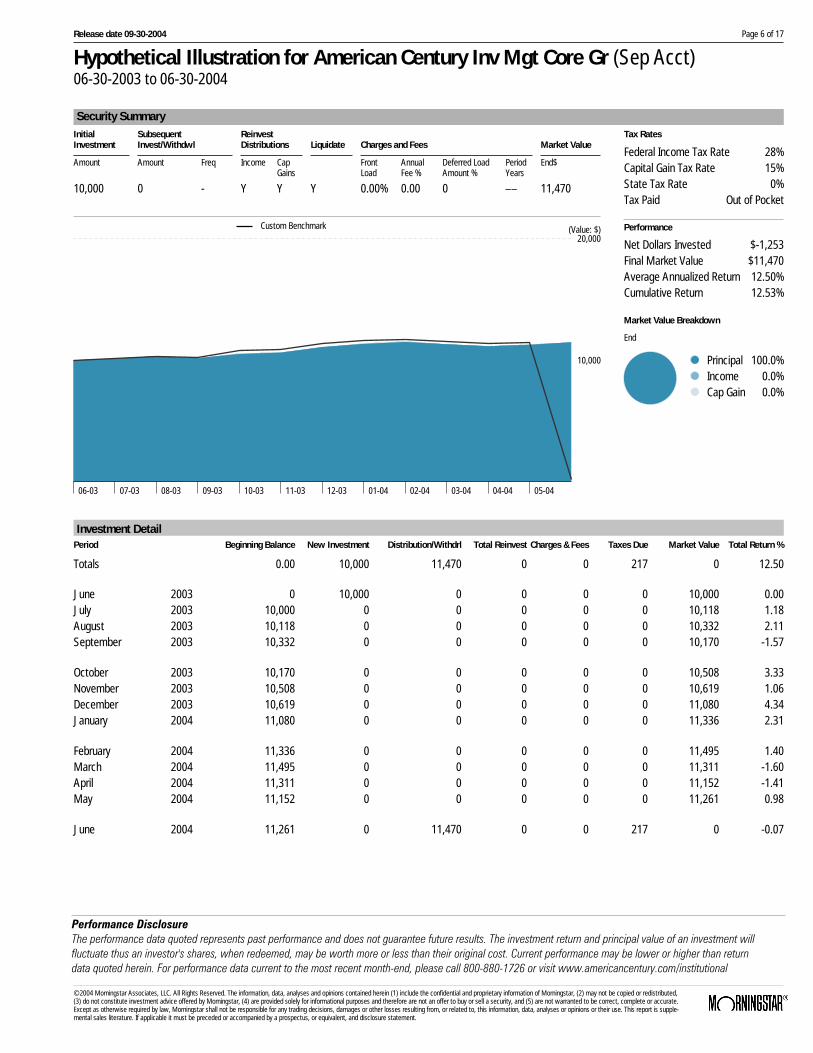
Hypothetical Illustration for American Century Inv Mgt Core Gr (Sep Acct)06-30-2003 to 06-30-2004
Security SummaryInitial Subsequent ReinvestInvestment Invest/Withdwl Distributions Liquidate Charges and Fees Market Value
Amount Amount Freq Income Cap Front Annual Deferred Load Period End$Gains Load Fee % Amount % Years
10,000 0 - Y Y Y 0.000.00% 0 __ 11,470
Custom Benchmark
Tax Rates
Performance
Market Value Breakdown
Federal Income Tax RateCapital Gain Tax RateState Tax RateTax Paid
Net Dollars InvestedFinal Market ValueAverage Annualized ReturnCumulative Return
Out of Pocket
28%15%0%
$-1,253$11,47012.50%12.53%
End
PrincipalIncomeCap Gain
100.0%0.0%0.0%
10,000
20,000(Value: $)
06-03 07-03 08-03 09-03 10-03 11-03 12-03 01-04 02-04 03-04 04-04 05-04
Performance DisclosureThe performance data quoted represents past performance and does not guarantee future results. The investment return and principal value of an investment willfluctuate thus an investor's shares, when redeemed, may be worth more or less than their original cost. Current performance may be lower or higher than returndata quoted herein. For performance data current to the most recent month-end, please call 800-880-1726 or visit www.americancentury.com/institutional
Investment DetailPeriod Beginning Balance New Investment Distribution/Withdrl Total Reinvest Charges & Fees Taxes Due Market Value Total Return %
0.00 10,000 11,470 0 0 217 0 12.50Totals
0 10,000 0 0 0 0 10,000 0.00June 200310,000 0 0 0 0 0 10,118 1.18July 200310,118 0 0 0 0 0 10,332 2.11August 200310,332 0 0 0 0 0 10,170 -1.57September 2003
10,170 0 0 0 0 0 10,508 3.33October 200310,508 0 0 0 0 0 10,619 1.06November 200310,619 0 0 0 0 0 11,080 4.34December 200311,080 0 0 0 0 0 11,336 2.31January 2004
11,336 0 0 0 0 0 11,495 1.40February 200411,495 0 0 0 0 0 11,311 -1.60March 200411,311 0 0 0 0 0 11,152 -1.41April 200411,152 0 0 0 0 0 11,261 0.98May 2004
11,261 0 11,470 0 0 217 0 -0.07June 2004
Page 6 of 17Release date 09-30-2004
©2004 Morningstar Associates, LLC. All Rights Reserved. The information, data, analyses and opinions contained herein (1) include the confidential and proprietary information of Morningstar, (2) may not be copied or redistributed,(3) do not constitute investment advice offered by Morningstar, (4) are provided solely for informational purposes and therefore are not an offer to buy or sell a security, and (5) are not warranted to be correct, complete or accurate. Except as otherwise required by law, Morningstar shall not be responsible for any trading decisions, damages or other losses resulting from, or related to, this information, data, analyses or opinions or their use. This report is supple- mental sales literature. If applicable it must be preceded or accompanied by a prospectus, or equivalent, and disclosure statement.

Hypothetical Illustration for Costco Wholesale (Stk)06-30-2003 to 09-30-2004
Security SummaryInitial Subsequent ReinvestInvestment Invest/Withdwl Dividends Liquidate Charges and Fees Market Value
Amount Amount Freq Purchase Purchase Annual End$% $ Fee %
10,000 0 - Y N 0.00 0.00 0.00 11,400
Custom Benchmark
Tax Rates
Performance
Market Value Breakdown
Federal Income Tax RateCapital Gain Tax RateState Tax RateTax Paid
Net Dollars InvestedFinal Market ValueAverage Annualized ReturnCumulative Return
Out of Pocket
28%15%0%
$10,015$11,40010.89%13.85%
End
PrincipalIncomeCap Gain
99.5%0.5%0.0%
10,000
20,000(Value: $)
06-03 07-03 08-03 09-03 10-03 11-03 12-03 01-04 02-04 03-04 04-04 05-04 06-04 07-04 08-04
Performance DisclosureThe performance data quoted represents past performance and does not guarantee future results. The investment return and principal value of an investment willfluctuate thus an investor's shares, when redeemed, may be worth more or less than their original cost. Current performance may be lower or higher than returndata quoted herein. For performance data current to the most recent month-end, please call 425 313-8100 or visit http://www.costco.com
Investment DetailPeriod Beginning Balance New Investment Distribution/Withdrl Total Reinvest Charges & Fees Taxes Due Market Value Total Return %
0.00 10,000 0 55 0 15 11,400 10.89Totals
0 10,000 0 0 0 0 10,000 0.00June 200310,000 0 0 0 0 0 10,107 1.07July 200310,107 0 0 0 0 0 8,811 -12.81August 20038,811 0 0 0 0 0 8,511 -3.41September 2003
8,511 0 0 0 0 0 9,686 13.80October 20039,686 0 0 0 0 0 9,787 1.04November 20039,787 0 0 0 0 0 10,158 3.80December 2003
10,158 0 0 0 0 0 10,093 -0.65January 2004
10,093 0 0 0 0 0 10,617 5.20February 200410,617 0 0 0 0 0 10,276 -3.22March 200410,276 0 0 0 0 0 10,246 -0.29April 200410,246 0 0 27 0 0 10,384 1.35May 2004
10,384 0 0 0 0 0 11,282 8.65June 200411,282 0 0 27 0 0 11,181 -0.90July 200411,181 0 0 0 0 0 11,307 1.13August 200411,307 0 0 0 0 15 11,400 0.69September 2004
Page 7 of 17Release date 09-30-2004
©2004 Morningstar Associates, LLC. All Rights Reserved. The information, data, analyses and opinions contained herein (1) include the confidential and proprietary information of Morningstar, (2) may not be copied or redistributed,(3) do not constitute investment advice offered by Morningstar, (4) are provided solely for informational purposes and therefore are not an offer to buy or sell a security, and (5) are not warranted to be correct, complete or accurate. Except as otherwise required by law, Morningstar shall not be responsible for any trading decisions, damages or other losses resulting from, or related to, this information, data, analyses or opinions or their use. This report is supple- mental sales literature. If applicable it must be preceded or accompanied by a prospectus, or equivalent, and disclosure statement.

Hypothetical Illustration for Fidelity Magellan (MF)06-30-2003 to 09-30-2004
Security SummaryInitial Subsequent ReinvestInvestment Invest/Withdwl Distributions Liquidate Charges and Fees Market Value
Amount Amount Freq Income Cap Front Annual Deferred Load Period End$Gains Load Fee % Amount % Years
10,000 0 - Y Y N 0.000.00% 0.00-0.00 0 11,178
Custom Benchmark
Tax Rates
Performance
Market Value Breakdown
Federal Income Tax RateCapital Gain Tax RateState Tax RateTax Paid
Net Dollars InvestedFinal Market ValueAverage Annualized ReturnCumulative Return
Out of Pocket
28%15%0%
$10,025$11,178
9.08%11.52%
End
PrincipalIncomeCap Gain
99.2%0.8%0.0%
10,000
20,000(Value: $)
06-03 07-03 08-03 09-03 10-03 11-03 12-03 01-04 02-04 03-04 04-04 05-04 06-04 07-04 08-04
Performance DisclosureThe performance data quoted represents past performance and does not guarantee future results. The investment return and principal value of an investment willfluctuate thus an investor's shares, when redeemed, may be worth more or less than their original cost. Current performance may be lower or higher than returndata quoted herein. For performance data current to the most recent month-end, please call 800-343-3548 or visit www.fidelity.com
Investment DetailPeriod Beginning Balance New Investment Distribution/Withdrl Total Reinvest Charges & Fees Taxes Due Market Value Total Return %
0.00 10,000 0 91 0 25 11,178 9.08Totals
0 10,000 0 0 0 0 10,000 0.00June 200310,000 0 0 0 0 0 10,132 1.32July 200310,132 0 0 0 0 0 10,300 1.66August 200310,300 0 0 0 0 0 10,148 -1.48September 2003
10,148 0 0 0 0 0 10,643 4.88October 200310,643 0 0 0 0 0 10,690 0.44November 200310,690 0 0 66 0 0 11,249 5.23December 200311,249 0 0 0 0 0 11,393 1.28January 2004
11,393 0 0 0 0 0 11,555 1.42February 200411,555 0 0 0 0 0 11,409 -1.26March 200411,409 0 0 0 0 19 11,214 -1.87April 200411,214 0 0 24 0 0 11,332 1.05May 2004
11,332 0 0 0 0 0 11,497 1.46June 200411,497 0 0 0 0 0 11,047 -3.91July 200411,047 0 0 0 0 0 11,074 0.24August 200411,074 0 0 0 0 7 11,178 0.88September 2004
Page 8 of 17Release date 09-30-2004
©2004 Morningstar Associates, LLC. All Rights Reserved. The information, data, analyses and opinions contained herein (1) include the confidential and proprietary information of Morningstar, (2) may not be copied or redistributed,(3) do not constitute investment advice offered by Morningstar, (4) are provided solely for informational purposes and therefore are not an offer to buy or sell a security, and (5) are not warranted to be correct, complete or accurate. Except as otherwise required by law, Morningstar shall not be responsible for any trading decisions, damages or other losses resulting from, or related to, this information, data, analyses or opinions or their use. This report is supple- mental sales literature. If applicable it must be preceded or accompanied by a prospectus, or equivalent, and disclosure statement.

Hypothetical Illustration for General Electric (Stk)06-30-2003 to 09-30-2004
Security SummaryInitial Subsequent ReinvestInvestment Invest/Withdwl Dividends Liquidate Charges and Fees Market Value
Amount Amount Freq Purchase Purchase Annual End$% $ Fee %
10,000 0 - Y N 0.00 0.00 0.00 12,074
Custom Benchmark
Tax Rates
Performance
Market Value Breakdown
Federal Income Tax RateCapital Gain Tax RateState Tax RateTax Paid
Net Dollars InvestedFinal Market ValueAverage Annualized ReturnCumulative Return
Out of Pocket
28%15%0%
$10,097$12,07415.44%19.74%
End
PrincipalIncomeCap Gain
97.0%3.0%0.0%
10,000
20,000(Value: $)
06-03 07-03 08-03 09-03 10-03 11-03 12-03 01-04 02-04 03-04 04-04 05-04 06-04 07-04 08-04
Performance DisclosureThe performance data quoted represents past performance and does not guarantee future results. The investment return and principal value of an investment willfluctuate thus an investor's shares, when redeemed, may be worth more or less than their original cost. Current performance may be lower or higher than returndata quoted herein. For performance data current to the most recent month-end, please call 203 373-2211 or visit http://www.ge.com
Investment DetailPeriod Beginning Balance New Investment Distribution/Withdrl Total Reinvest Charges & Fees Taxes Due Market Value Total Return %
0.00 10,000 0 350 0 97 12,074 15.44Totals
0 10,000 0 0 0 0 10,000 0.00June 200310,000 0 0 0 0 0 9,916 -0.84July 20039,916 0 0 0 0 0 10,310 3.97August 2003
10,310 0 0 66 0 0 10,459 1.44September 2003
10,459 0 0 0 0 0 10,178 -2.68October 200310,178 0 0 0 0 0 10,059 -1.17November 200310,059 0 0 70 0 0 10,940 8.76December 200310,940 0 0 0 0 0 11,876 8.55January 2004
11,876 0 0 71 0 0 11,554 -2.71February 200411,554 0 0 0 0 0 10,844 -6.15March 200410,844 0 0 0 0 38 10,641 -2.22April 200410,641 0 0 0 0 0 11,057 3.91May 2004
11,057 0 0 71 0 0 11,581 4.74June 200411,581 0 0 0 0 0 11,885 2.62July 200411,885 0 0 0 0 0 11,720 -1.38August 200411,720 0 0 71 0 59 12,074 2.52September 2004
Page 9 of 17Release date 09-30-2004
©2004 Morningstar Associates, LLC. All Rights Reserved. The information, data, analyses and opinions contained herein (1) include the confidential and proprietary information of Morningstar, (2) may not be copied or redistributed,(3) do not constitute investment advice offered by Morningstar, (4) are provided solely for informational purposes and therefore are not an offer to buy or sell a security, and (5) are not warranted to be correct, complete or accurate. Except as otherwise required by law, Morningstar shall not be responsible for any trading decisions, damages or other losses resulting from, or related to, this information, data, analyses or opinions or their use. This report is supple- mental sales literature. If applicable it must be preceded or accompanied by a prospectus, or equivalent, and disclosure statement.

Hypothetical Illustration for Nuveen All-Amer Muni A (MF)06-30-2003 to 09-30-2004
Security SummaryInitial Subsequent ReinvestInvestment Invest/Withdwl Distributions Liquidate Charges and Fees Market Value
Amount Amount Freq Income Cap Front Annual Deferred Load Period End$Gains Load Fee % Amount % Years
10,000 0 - Y Y N 0.004.20% 0.00-0.00 0 10,200
Custom Benchmark
Tax Rates
Performance
Market Value Breakdown
Federal Income Tax RateCapital Gain Tax RateState Tax RateTax Paid
Net Dollars InvestedFinal Market ValueAverage Annualized ReturnCumulative Return
Out of Pocket
28%15%0%
$10,180$10,200
0.16%0.20%
End
PrincipalIncomeCap Gain
93.6%6.4%0.0%
10,000
20,000(Value: $)
06-03 07-03 08-03 09-03 10-03 11-03 12-03 01-04 02-04 03-04 04-04 05-04 06-04 07-04 08-04
Performance DisclosureThe performance data quoted represents past performance and does not guarantee future results. The investment return and principal value of an investment willfluctuate thus an investor's shares, when redeemed, may be worth more or less than their original cost. Current performance may be lower or higher than returndata quoted herein. For performance data current to the most recent month-end, please call 800-257-8787 or visit www.nuveen.com
Investment DetailPeriod Beginning Balance New Investment Distribution/Withdrl Total Reinvest Charges & Fees Taxes Due Market Value Total Return %
0.00 10,000 0 645 420 180 10,200 0.16Totals
0 10,000 0 0 420 0 9,580 -4.20June 20039,580 0 0 40 0 0 9,220 -3.76July 20039,220 0 0 40 0 0 9,260 0.43August 20039,260 0 0 40 0 0 9,554 3.18September 2003
9,554 0 0 40 0 0 9,524 -0.32October 20039,524 0 0 41 0 0 9,671 1.54November 20039,671 0 0 83 0 0 9,790 1.23December 20039,790 0 0 0 0 0 9,826 0.36January 2004
9,826 0 0 41 0 0 10,019 1.97February 200410,019 0 0 39 0 0 9,959 -0.59March 20049,959 0 0 40 0 80 9,710 -3.29April 20049,710 0 0 40 0 0 9,686 -0.24May 2004
9,686 0 0 80 0 0 9,776 0.92June 20049,776 0 0 0 0 0 9,876 1.03July 20049,876 0 0 40 0 0 10,091 2.17August 2004
10,091 0 0 81 0 100 10,200 0.09September 2004
Page 10 of 17Release date 09-30-2004
©2004 Morningstar Associates, LLC. All Rights Reserved. The information, data, analyses and opinions contained herein (1) include the confidential and proprietary information of Morningstar, (2) may not be copied or redistributed,(3) do not constitute investment advice offered by Morningstar, (4) are provided solely for informational purposes and therefore are not an offer to buy or sell a security, and (5) are not warranted to be correct, complete or accurate. Except as otherwise required by law, Morningstar shall not be responsible for any trading decisions, damages or other losses resulting from, or related to, this information, data, analyses or opinions or their use. This report is supple- mental sales literature. If applicable it must be preceded or accompanied by a prospectus, or equivalent, and disclosure statement.

Hypothetical Illustration for Oppenheimer Capital Ap N (MF)06-30-2003 to 09-30-2004
Security SummaryInitial Subsequent ReinvestInvestment Invest/Withdwl Distributions Liquidate Charges and Fees Market Value
Amount Amount Freq Income Cap Front Annual Deferred Load Period End$Gains Load Fee % Amount % Years
10,000 0 - Y Y N 0.000.00% 1.00-0.00 2 11,340
Custom Benchmark
Tax Rates
Performance
Market Value Breakdown
Federal Income Tax RateCapital Gain Tax RateState Tax RateTax Paid
Net Dollars InvestedFinal Market ValueAverage Annualized ReturnCumulative Return
Out of Pocket
28%15%0%
$10,000$11,34010.54%13.40%
End
PrincipalIncomeCap Gain
100.0%0.0%0.0%
10,000
20,000(Value: $)
06-03 07-03 08-03 09-03 10-03 11-03 12-03 01-04 02-04 03-04 04-04 05-04 06-04 07-04 08-04
Performance DisclosureThe performance data quoted represents past performance and does not guarantee future results. The investment return and principal value of an investment willfluctuate thus an investor's shares, when redeemed, may be worth more or less than their original cost. Current performance may be lower or higher than returndata quoted herein. For performance data current to the most recent month-end, please call 800-525-7048 or visit www.oppenheimerfunds.com
Investment DetailPeriod Beginning Balance New Investment Distribution/Withdrl Total Reinvest Charges & Fees Taxes Due Market Value Total Return %
0.00 10,000 0 0 0 0 11,340 10.54Totals
0 10,000 0 0 0 0 10,000 0.00June 200310,000 0 0 0 0 0 10,280 2.80July 200310,280 0 0 0 0 0 10,593 3.05August 200310,593 0 0 0 0 0 10,407 -1.76September 2003
10,407 0 0 0 0 0 10,970 5.41October 200310,970 0 0 0 0 0 11,111 1.29November 200311,111 0 0 0 0 0 11,581 4.23December 200311,581 0 0 0 0 0 11,786 1.77January 2004
11,786 0 0 0 0 0 11,813 0.23February 200411,813 0 0 0 0 0 11,666 -1.25March 200411,666 0 0 0 0 0 11,395 -2.32April 200411,395 0 0 0 0 0 11,587 1.69May 2004
11,587 0 0 0 0 0 11,804 1.87June 200411,804 0 0 0 0 0 11,337 -3.96July 200411,337 0 0 0 0 0 11,208 -1.14August 200411,208 0 0 0 0 0 11,340 1.18September 2004
Page 11 of 17Release date 09-30-2004
©2004 Morningstar Associates, LLC. All Rights Reserved. The information, data, analyses and opinions contained herein (1) include the confidential and proprietary information of Morningstar, (2) may not be copied or redistributed,(3) do not constitute investment advice offered by Morningstar, (4) are provided solely for informational purposes and therefore are not an offer to buy or sell a security, and (5) are not warranted to be correct, complete or accurate. Except as otherwise required by law, Morningstar shall not be responsible for any trading decisions, damages or other losses resulting from, or related to, this information, data, analyses or opinions or their use. This report is supple- mental sales literature. If applicable it must be preceded or accompanied by a prospectus, or equivalent, and disclosure statement.

Hypothetical Illustration for Pfizer (Stk)06-30-2003 to 09-30-2004
Security SummaryInitial Subsequent ReinvestInvestment Invest/Withdwl Dividends Liquidate Charges and Fees Market Value
Amount Amount Freq Purchase Purchase Annual End$% $ Fee %
10,000 0 - Y N 0.00 0.00 0.00 9,177
Custom Benchmark
Tax Rates
Performance
Market Value Breakdown
Federal Income Tax RateCapital Gain Tax RateState Tax RateTax Paid
Net Dollars InvestedFinal Market ValueAverage Annualized ReturnCumulative Return
Out of Pocket
28%15%0%
$10,067$9,177-7.15%-8.89%
End
PrincipalIncomeCap Gain
97.6%2.4%0.0%
10,000
20,000(Value: $)
06-03 07-03 08-03 09-03 10-03 11-03 12-03 01-04 02-04 03-04 04-04 05-04 06-04 07-04 08-04
Performance DisclosureThe performance data quoted represents past performance and does not guarantee future results. The investment return and principal value of an investment willfluctuate thus an investor's shares, when redeemed, may be worth more or less than their original cost. Current performance may be lower or higher than returndata quoted herein. For performance data current to the most recent month-end, please call 212 573-2323 or visit http://www.pfizer.com
Investment DetailPeriod Beginning Balance New Investment Distribution/Withdrl Total Reinvest Charges & Fees Taxes Due Market Value Total Return %
0.00 10,000 0 239 0 67 9,177 -7.15Totals
0 10,000 0 0 0 0 10,000 0.00June 200310,000 0 0 0 0 0 9,769 -2.31July 20039,769 0 0 44 0 0 8,803 -9.89August 20038,803 0 0 0 0 0 8,938 1.54September 2003
8,938 0 0 0 0 0 9,297 4.02October 20039,297 0 0 44 0 0 9,923 6.73November 20039,923 0 0 0 0 0 10,443 5.24December 2003
10,443 0 0 0 0 0 10,827 3.68January 2004
10,827 0 0 50 0 0 10,881 0.50February 200410,881 0 0 0 0 0 10,406 -4.37March 200410,406 0 0 0 0 25 10,617 1.79April 200410,617 0 0 50 0 0 10,542 -0.70May 2004
10,542 0 0 0 0 0 10,226 -3.00June 200410,226 0 0 0 0 0 9,534 -6.77July 20049,534 0 0 51 0 0 9,798 2.77August 20049,798 0 0 0 0 42 9,177 -6.76September 2004
Page 12 of 17Release date 09-30-2004
©2004 Morningstar Associates, LLC. All Rights Reserved. The information, data, analyses and opinions contained herein (1) include the confidential and proprietary information of Morningstar, (2) may not be copied or redistributed,(3) do not constitute investment advice offered by Morningstar, (4) are provided solely for informational purposes and therefore are not an offer to buy or sell a security, and (5) are not warranted to be correct, complete or accurate. Except as otherwise required by law, Morningstar shall not be responsible for any trading decisions, damages or other losses resulting from, or related to, this information, data, analyses or opinions or their use. This report is supple- mental sales literature. If applicable it must be preceded or accompanied by a prospectus, or equivalent, and disclosure statement.

Hypothetical Illustration for iShares Dow Jones US Total Market Ind (ETF)06-30-2003 to 09-30-2004
Security SummaryInitial Subsequent ReinvestInvestment Invest/Withdwl Distributions Liquidate Charges and Fees Market Value
Amount Amount Freq Income Cap Front Annual Deferred Load Period End$Gains Load Fee % Amount % Years
10,000 0 - Y Y N 0.000.00% 0 __ 11,740
Custom Benchmark
Tax Rates
Performance
Market Value Breakdown
Federal Income Tax RateCapital Gain Tax RateState Tax RateTax Paid
Net Dollars InvestedFinal Market ValueAverage Annualized ReturnCumulative Return
Out of Pocket
28%15%0%
$10,056$11,74013.19%16.83%
End
PrincipalIncomeCap Gain
98.2%1.8%0.0%
10,000
20,000(Value: $)
06-03 07-03 08-03 09-03 10-03 11-03 12-03 01-04 02-04 03-04 04-04 05-04 06-04 07-04 08-04
Performance DisclosureThe performance data quoted represents past performance and does not guarantee future results. The investment return and principal value of an investment willfluctuate thus an investor's shares, when redeemed, may be worth more or less than their original cost. Current performance may be lower or higher than returndata quoted herein. For performance data current to the most recent month-end, please call - or visit www.ishares.com
Investment DetailPeriod Beginning Balance New Investment Distribution/Withdrl Total Reinvest Charges & Fees Taxes Due Market Value Total Return %
0.00 10,000 0 202 0 56 11,740 13.19Totals
0 10,000 0 0 0 0 10,000 0.00June 200310,000 0 0 0 0 0 10,172 1.72July 200310,172 0 0 0 0 0 10,411 2.35August 200310,411 0 0 35 0 0 10,291 -1.15September 2003
10,291 0 0 0 0 0 10,908 6.00October 200310,908 0 0 0 0 0 11,035 1.16November 200311,035 0 0 48 0 0 11,549 4.66December 200311,549 0 0 0 0 0 11,806 2.22January 2004
11,806 0 0 0 0 0 11,961 1.32February 200411,961 0 0 37 0 0 11,815 -1.23March 200411,815 0 0 0 0 23 11,551 -2.43April 200411,551 0 0 0 0 0 11,744 1.67May 2004
11,744 0 0 38 0 0 11,986 2.06June 200411,986 0 0 0 0 0 11,475 -4.27July 200411,475 0 0 0 0 0 11,574 0.86August 200411,574 0 0 45 0 33 11,740 1.15September 2004
Page 13 of 17Release date 09-30-2004
©2004 Morningstar Associates, LLC. All Rights Reserved. The information, data, analyses and opinions contained herein (1) include the confidential and proprietary information of Morningstar, (2) may not be copied or redistributed,(3) do not constitute investment advice offered by Morningstar, (4) are provided solely for informational purposes and therefore are not an offer to buy or sell a security, and (5) are not warranted to be correct, complete or accurate. Except as otherwise required by law, Morningstar shall not be responsible for any trading decisions, damages or other losses resulting from, or related to, this information, data, analyses or opinions or their use. This report is supple- mental sales literature. If applicable it must be preceded or accompanied by a prospectus, or equivalent, and disclosure statement.

The performance data quoted represents past performance and does notguarantee future results. The investment return and principal value of aninvestment will fluctuate thus an investor's shares, when redeemed, may beworth more or less than their original cost. Current performance may be loweror higher than return data quoted herein. For information current to the mostrecent month-end, please visit www.morningstaradvisor.com/familyinfo.
An investment in the fund is not insured or guaranteed by the FDIC or anyother government agency. The current yield quotation more closely reflects thecurrent earnings of the money market fund than the total return quotation.Although the fund seeks to preserve the value of your investment at $1.00 pershare, it is possible to lose money by investing in the fund.
Standardized Returns assume reinvestment of dividends and capital gains. Itdepicts performance without adjusting for the effects of taxation, but areadjusted to reflect sales charges and ongoing fund expenses. If adjusted fortaxation, the performance quoted would be significantly reduced. For variable
annuities, additional expenses will be taken in account, including M&E riskcharges, administration fees, fund-level expenses such as management feesand operating fees, and policy-level charges such as surrender, contract andsales charges.
After-tax returns are calculated using the highest individual federal marginalincome tax rates, and do not reflect the impact of state and local taxes. Actualafter tax returns depend on the investor's tax situation and may differ fromthose shown.The after tax returns shown are not relevant to investors whohold their fund shares through tax-deferred arrangements such as 401(k) plansor an IRA. After-tax returns exclude the effects of either the alternative mini-mum tax or phase-out of certain tax credits. Any taxes due are as of the timethe distributions are made, and the taxable amount and tax character of eachdistribution is as specified by the fund on the dividend declaration date. Dueto foreign tax credits or realized capital losses, after-tax returns may begreater than before tax returns. After-tax returns for exchange-traded fundsare based on net asset value.
Disclosure for Standardized and Tax Adjusted ReturnsPage 14 of 17
Annualized returns 09-30-2004
on Distribution on Distributions and Sales of SharesReturns after Taxes (%)
ABN Amro High Yield Bd IFidelity MagellanNuveen All-Amer Muni AOppenheimer Capital Ap NiShares Dow Jones US Total Market Ind-NAV
Standardized Returns (%)
ABN Amro High Yield Bd IFidelity MagellanNuveen All-Amer Muni AOppenheimer Capital Ap NAARP Var Annty Dreyfus Apprec (VA)AIG Profile VA Fidel Mny Mkt (VA)iShares Dow Jones US Total Market Ind-NAViShares Dow Jones US Total Market Ind-MktAberdeen Global Income-NAVAberdeen Global Income-MktMerrill Lynch Money Market Standard & Poor’s 500Lehman Bro’s Agg Bond IndexMSCI EAFE Index Ndtr_D3-Month T-bill
7-dayYield
1 Yr 5 Yr 10 Yr SinceInception
InceptionDate
Sep AcctIncept Date
Max FrontLoad %
Max BackLoad %
Expense Ratio %
–––––
0.67––––
1.00––––
10.6310.151.847.970.87
–9.4120.1119.877.815.580.72
13.853.68
22.081.08
––2.53
5.05–
–3.90–2.14
––
7.4110.312.87
–1.307.48
–0.853.02
–9.205.75
–––––
8.268.20
–11.077.654.014.14
10.2118.816.88
–4.563.50
–0.72–3.97–3.93
7.016.082.99
––––
06–200305–196310–198803–200103–199704–199606–200006–200003–199203–199201–1998
––––
––––
12–199604–1996
–––––
NANA
4.20NANANANANANANANA
NANANA
1.005.006.00NANANANANA
1.250.700.821.431.301.690.200.202.302.301.26
1 Yr 5 Yr 10 Yr SinceInception
InceptionDate
1 Yr 5 Yr 10 Yr SinceInception
7.829.821.847.97
13.60
––3.05
5.04––
–7.625.72
––
7.5215.856.82
–4.68–4.50
06–200305–196310–198803–200106–2000
6.836.592.895.189.21
––2.30
5.06––
–7.295.70
––
7.1015.666.76
–3.86–4.66
© 2004 Morningstar Associates, LLC. All Rights Reserved. The information, data, analyses and opinions contained herein (1) include the confidential and proprietary information of Morningstar, (2) may not be copied or redistributed, (3) do not constitute investment advice offered by Morningstar, (4) are provided solely for informational purposes and therefore are not an offer to buy or sell a security, and (5) are not warranted to be correct, com-plete or accurate. Except as otherwise required by law, Morningstar shall not be responsible for any trading decisions, damages or other losses resulting from, or related to, this information, data, analyses or opinions or their use. This report is supplemental sales literature. If applicable it must be preceded or accompanied by a prospectus, or equivalent, and disclosure statement.

Page 15 of 17
© 2004 Morningstar Associates, LLC. All Rights Reserved. The information, data, analyses and opinions contained herein (1) include the confidential and proprietary information of Morningstar, (2) may not be copied or redistributed, (3) do not constitute investment advice offered by Morningstar, (4) are provided solely for informational purposes and therefore are not an offer to buy or sell a security, and (5) are not warranted to be correct, com-plete or accurate. Except as otherwise required by law, Morningstar shall not be responsible for any trading decisions, damages or other losses resulting from, or related to, this information, data, analyses or opinions or their use. This report is supplemental sales literature. If applicable it must be preceded or accompanied by a prospectus, or equivalent, and disclosure statement.
Hypothetical ReportDisclosure Statement
This illustration may reflect the results of systematic investments and/or with-drawals. Systematic investment does not ensure a profit, nor does it protectthe investor against a loss in a declining market. Also, systematic investingwill not keep an investor from losing money if shares are sold when the mar-ket is down.
Investment Summary GraphThe investment summary graph plots the approximate market value of thesecurity or portfolio over the investing horizon. It may also include the totalinvestment assumed in the illustration and/or a benchmark. Total investmentincludes dollar inflows and outflows, including inflows representing notedtaxes and wrap fees paid out of pocket. If a benchmark index is included on agraph, it assumes a similar pattern of investment/withdrawal as for the secu-rity or portfolio. Taxes and transaction costs are not applied to the benchmarkindex. Note that direct investment in an index is not possible. Indexes areunmanaged portfolios representing different asset classes, with varying levelsof associated risk. The benchmark index included in the graph may or may notrepresent an appropriate or accurate comparison with the security or portfolioillustrated.
Standardized ReturnsFor ETFs, the standardized returns reflect performance, both at market priceand NAV price, without adjusting for the effects of taxation or brokers com-missions. These returns are adjusted to reflect all ongoing ETF expenses andassume reinvestment of dividends and capital gains. If adjusted, the effects oftaxation would reduce the performance quoted.
For money market mutual funds, standardized return is total return adjustedfor sales charges and reflects all ongoing fund expenses. Current 7-day yieldmore closely reflects the current earnings of the money market fund than thetotal return quotation.
For mutual funds, standardized return is total return adjusted for sales chargesand reflects all ongoing fund expenses. Following this disclosure statement,standardized returns for each portfolio holding are shown.
For VA subaccounts, standardized return is total return based on its inceptiondate within the separate account and is adjusted to reflect recurring and non-recurring charges such as surrender fees, contract charges, maximum front-end load, maximum deferred load, maximum M&E risk charge, administrationfees, and actual ongoing fund-level expenses.
For VL subaccounts, standardized return is total return based on its inceptiondate within the separate account and is adjusted to reflect recurring and non-recurring charges such as surrender fees, contract charges, maximum front-end load, maximum deferred load, maximum M&E risk charge, administrationfees, and actual ongoing fund-level expenses. For VLs, additional fees specificto a VL policy such as transfer fees and cost of insurance fees, which arebased on specific characteristics on an individual, are not included.If VL feeswere included in the return calculations, the performance would have beensignificantly lower. An investor should contact their financial advisor and askfor a personalized performance illustration, either hypothetical or historical,which reflects all applicable fees and charges including the cost of insurance.Please review the prospectus and SAI for more detailed information.
Investment RiskMarket Price Risk: The market price of ETFs and closed-end funds traded onthe secondary market is subject to the forces of supply and demand and thusindependent of the CE/ETF’s NAV. This can result in the market price trading ata premium or discount to the NAV, which will affect the investment value.
Market Risk: The market prices of closed-end funds and ETFs can fluctuate asthe result of several factors, such as security-specific factors or general
GeneralThis is an illustration of a simulated investment and assumes the portfolioholding(s) were purchased on the first day of the period indicated. Sales andtax charges, including those required in the event of transfers between assets,are taken into account at the rates shown and may be higher or lower thanwhat an investor would have actually paid had the investments been pur-chased then or now. The performance data represents past performance and isnot indicative of future results. Principal value and investment returns will fluc-tuate, and an investor's shares/units when redeemed may be worth more orless than the original investment.
The underlying holdings of the portfolio are not federally or FDIC-insured andare not deposits or obligations of, or guaranteed by, any financial institution.Investment in securities involve investment risks including possible loss of prin-cipal and fluctuation in value.
The investment returns do not reflect active trading and do not necessarilyreflect the results that might have been achieved by active management of theaccount. The investment returns of other clients of the adviser may differ mate-rially from the investment portrayed.
The information contained in this report is from the most recent informationavailable to Morningstar as of the release date, and may or may not be anaccurate reflection of the current composition of the securities included in theportfolio. There is no assurance that the weightings, composition and ratioswill remain the same.
Pre-inception ReturnsThe analysis in this report may be based, in part, on adjusted historical returnsfor periods prior to the fund’s actual inception. These calculated returns reflectthe historical performance of the oldest share class of the fund, adjusted toreflect the fees and expenses of this share class. These fees and expenses arereferenced in the report’s Charges and Fees section. When pre-inception dataare presented in the report, the header at the top of the report will indicatethis.
While the inclusion of pre-inception data provides valuable insight into theprobable long-term behavior of newer share classes of a fund, investors shouldbe aware that an adjusted historical return can only provide an approximationof that behavior. For example, the fee structures between a retail share classwill vary from that of an institutional share class, as retail shares tend to havehigher operating expenses and sales charges. These adjusted historical returnsare not actual returns. Calculation methodologies utilized by Morningstar maydiffer from those applied by other entities, including the fund itself.
The investment returns do not necessarily reflect the deduction of all invest-ment advisory fees. Client investment returns may be reduced if additional feesare incurred.
Performance for closed-end and exchange-traded funds is calculated based onthe fund's end of the day market prices as reported by the New York StockExchange. Separate account performance is based on the mean experience ofan investor in the account.
© 2004 Morningstar Associates, LLC. All Rights Reserved. The information, data, analyses and opinions contained herein (1) include the confidential and proprietary information of Morningstar, (2) may not be copied or redistributed, (3) do not constitute investment advice offered by Morningstar, (4) are provided solely for informational purposes and therefore are not an offer to buy or sell a security, and (5) are not warranted to be correct, com-plete or accurate. Except as otherwise required by law, Morningstar shall not be responsible for any trading decisions, damages or other losses resulting from, or related to, this information, data, analyses or opinions or their use. This report is supplemental sales literature. If applicable it must be preceded or accompanied by a prospectus, or equivalent, and disclosure statement.

Page 16 of 17
Hypothetical ReportDisclosure Statement continued
© 2004 Morningstar Associates, LLC. All Rights Reserved. The information, data, analyses and opinions contained herein (1) include the confidential and proprietary information of Morningstar, (2) may not be copied or redistributed, (3) do not constitute investment advice offered by Morningstar, (4) are provided solely for informational purposes and therefore are not an offer to buy or sell a security, and (5) are not warranted to be correct, com-plete or accurate. Except as otherwise required by law, Morningstar shall not be responsible for any trading decisions, damages or other losses resulting from, or related to, this information, data, analyses or opinions or their use. This report is supplemental sales literature. If applicable it must be preceded or accompanied by a prospectus, or equivalent, and disclosure statement.
investor sentiment. Therefore, investors should be aware of the prospect ofmarket fluctuations and the impact they may have on the market price.
Non-Diversified Funds/Subaccounts: Investing most of their assets in a smallnumber of issuers involves additional risks, including share price fluctuations,because of the increased concentration of investments.
Tax-Free Municipal Bond Funds/Subaccounts: The income from tax-free munic-ipal bond funds may be subject to state and local taxation and the AlternativeMinimum Tax.
High-Yield Bond Funds/Subaccounts:Investing in lower-rated debt securities(commonly referred to as junk bonds) involves additional risks because of thelower credit quality of the securities in the portfolio. The investor should beaware of the possible higher level of volatility, and increased risk of default.
Sector Funds/Subaccounts: Investing exclusively in one sector or industryinvolves additional risks. The lack of industry diversification subjects theinvestor to increased industry-specific risks.
Small Company Stock Funds/Subaccounts: Investing in stocks of small compa-nies involves additional risks. Smaller companies typically have a higher riskof failure, and are not as well established as larger blue-chip companies.Historically, smaller-company stocks have experienced a greater degree ofmarket volatility than the overall market average.
Foreign Securities Funds/Subaccounts: Investing in foreign securities involvesspecial additional risks. These risks include, but are not limited to, currencyrisk, political risk, and risk associated with varying accounting standards.
Emerging Market Funds/Subaccounts: Investing in foreign securities involvesspecial additional risks. These risks include, but are not limited to, currencyrisk, political risk, and risk associated with varying accounting standards.Investing in emerging markets may accentuate these risks.
Mid Cap Funds/Subaccounts: Investing in companies with smaller market cap-italizations involves additional risks. The securities of these companies may bemore volatile and less liquid than the securities of larger companies.
Definitions of Report TermsAverage Annualized Return: Average annualized money-weighted return (inter-nal rate of return). In illustrations with time periods less than one year, thisfigure is not annualized.
Capital Gains (Individual Report): Percentage of the total market value of theholding that is attributable to the reinvestment of capital gains distributions.
Charges & Fees (Investment Detail): The sum of fees charged to the investorduring the period, including front- or deferred loads, VA charges, and annualfees.
Cumulative Return: The total money-weighted return of the investment overthe entire time period of the illustration.
Distribution/Withdrl: The sum of distributions not reinvested, plus any cashwithdrawals during the period.
Income (Individual Report): The percentage of the total market value of the
holding that is attributable to the reinvestment of income or dividend distribu-tions.
Liquidate: Indicates whether the advisor chose to liquidate the holding on theend date.
Median (Comparison Report): The total money-weighted return (internal rateof return) of the median security in the illustration for the calendar year indi-cated.
New investment: Any new cash invested during the period.
Principal (Individual Reports): The percentage of the total market value of theholding that is attributable to new investment.
Rebalance (Planning Assumptions): Indicates whether rebalancing is used,and its frequency. "No" indicates no rebalancing. Options for rebalancing fre-quency are monthly, quarterly, semi-annually, and annually.
Rebalance (Investment Assumptions): Percentage of total asset allocation tobe maintained in this holding through rebalancing.
Securities Returns (Comparison Report): The total money-weighted return(internal rate of return) for the holding in the calendar year indicated, takinginto account cash flows, charges, and fees.
Subsequent Invest/Withdwl: The amount, type, and frequency of subsequentinvestments or withdrawals from the holding. Withdrawals are representedby a negative number. Systematic investments and withdrawals may be mademonthly, quarterly, semi-annually, or annually. If "Custom," a custom scheduleof investments or withdrawals was used.
Taxes Due: The total amount of taxes due from the investor, determined byapplying specified tax rates to distributions and sale of shares during eachcalendar year.
Total Investment: The total out-of-pocket expense for the investor. Includesnew investment, annual fees paid to advisor, and taxes due. This figure is netof withdrawals, including liquidation.
Total Reinvest: The sum of distributions reinvested during the period.
Total Return %: The total money-weighted return (internal rate of return) oninvestments for the period.

Custom Benchmark DisclosureBenchmark: Custom
Custom Benchmark: 60-30 Custom Benchmark Ticker Security type Allocation %S&P 500 INX IDX 60.00Lehman Brothers Aggregate Bond X100M9 IDX 30.003 Month T-Bill X100O5 IDX 10.00
3 Month T-BillAs tracked by the Wall Street Journal, this benchmark measure the yields of bank-sponsored certificates of deposit.
Lehman Brothers Aggregate Bond: Govt/Credit Index, the Mortgage-Backed Securities Index, and the Asset-Backed Securities Index.
Standard & Poor's 500: A market capitalization-weighted index of 500 widely held stocks often used as a proxy for the stock market.
Page 17 of 17
©2004 Morningstar Associates, LLC. All Rights Reserved. The information, data, analyses and opinions contained herein (1) include the confidential and proprietary information of Morningstar, (2) may not be copied or redistributed,(3) do not constitute investment advice offered by Morningstar, (4) are provided solely for informational purposes and therefore are not an offer to buy or sell a security, and (5) are not warranted to be correct, complete or accurate. Except as otherwise required by law, Morningstar shall not be responsible for any trading decisions, damages or other losses resulting from, or related to, this information, data, analyses or opinions or their use. This report is supple- mental sales literature. If applicable it must be preceded or accompanied by a prospectus, or equivalent, and disclosure statement.

Hypothetical Portfolio Illustration Continued06-30-2003 to 09-30-2004
Security Summary% of Total Market Value
Start
End
06-30-2003
09-30-2004
10
20
30
40
50
60
70
80
90
100
110
120
130
140
150
160
170
180
190
200(Value: $000)
06-03 07-03 08-03 09-03 10-03 11-03 12-03 01-04 02-04 03-04 04-04 05-04 06-04 07-04 08-04
Investment Assumptions
Mutual Fund Name Holding PeriodInitialInvestment
SubsequentInvest/Withdwl
ReinvestDistributions
Liqui-date
Re-balance Charges and Fees Market Value
Start End Amount Amount Freq Income CapGains
% FrontLoad
AnnualFee%
Deferred LoadAmount%
PeriodYears
End$
ABN AMRO High Yield Bd I 06-03 09-04 10,000 0 - Y Y N - 0.000.00% 0.00-0.00 0 11,297Fidelity Magellan 06-03 09-04 10,000 0 - Y Y N - 0.000.00% 0.00-0.00 0 11,178Nuveen All-Amer Muni A 06-03 09-04 10,000 0 - Y Y N - 0.004.20% 0.00-0.00 0 10,200Oppenheimer Capital Ap N 06-03 09-04 10,000 0 - Y Y N - 0.000.00% 1.00-0.00 2 11,340iShares Dow Jones US Total Marke... 06-03 09-04 10,000 0 - Y Y N - 0.000.00% 0.00-0.00 0 11,740
Stock Name Holding PeriodInitialInvestment
SubsequentInvest/Withdwl
ReinvestDividends
Liqui-date
Re-balance Charges and Fees Market Value
Start End Amount Amount Freq % Purchase%
Purchase$
AnnualFee%
End$
Costco Wholesale 06-03 09-04 10,000 0 - Y N - 0.00 0.00 0.00 11,400General Electric 06-03 09-04 10,000 0 - Y N - 0.00 0.00 0.00 12,074Pfizer 06-03 09-04 10,000 0 - Y N - 0.00 0.00 0.00 9,177
Variable Annuity Subaccount Name Holding PeriodInitialInvestment
SubsequentInvest/Withdwl
Liqui-date
Re-balance Contract Charge Charges and Fees Market Value
Start End Amount Amount Freq % $ % FrontLoad
Surr ChargeAmount%
PeriodYears
End$
AARP Var Annty Dreyfus Apprec 06-03 09-04 10,000 0 - -N 25 0.00 0.00% 5.00-0.00 6 10,816AIG Profile VA Fidel Mny Mkt 06-03 09-04 10,000 0 - -N 30 0.00 0.00% 6.00-0.00 8 9,913
Page 2 of 7Release date 09-30-2004
©2004 Morningstar Associates, LLC. All Rights Reserved. The information, data, analyses and opinions contained herein (1) include the confidential and proprietary information of Morningstar, (2) may not be copied or redistributed,(3) do not constitute investment advice offered by Morningstar, (4) are provided solely for informational purposes and therefore are not an offer to buy or sell a security, and (5) are not warranted to be correct, complete or accurate. Except as otherwise required by law, Morningstar shall not be responsible for any trading decisions, damages or other losses resulting from, or related to, this information, data, analyses or opinions or their use. This report is supple- mental sales literature. If applicable it must be preceded or accompanied by a prospectus, or equivalent, and disclosure statement.

Hypothetical Portfolio Illustration Continued06-30-2003 to 09-30-2004
Investment Assumptions
Separate Account Name Holding PeriodInitialInvestment
SubsequentInvest/Withdwl
ReinvestDistributions
Liqui-date
Re-balance Charges and Fees Market Value
Start End Amount Amount Freq Income CapGains
% FrontLoad
AnnualFee%
Deferred LoadAmount%
PeriodYears
End
American Century Inv Mgt Core Gr 06-03 06-04 10,000 0 - Y Y Y - 0.000.00% 0 0
Closed End Fund Name Holding PeriodInitialInvestment
SubsequentInvest/Withdwl
ReinvestDividends
Liqui-date
Re-balance Charges and Fees Market Value
Start End Amount Amount Freq Income CapGains
% FrontLoad
AnnualFee%
End$
Aberdeen Global Income 06-03 09-04 10,000 0 - Y Y N 0.000.00%- 11,673
Money Market Name Holding PeriodInitialInvestment
SubsequentInvest/Withdwl
ReinvestDividends
Liqui-date
Re-balance Charges and Fees Market Value
Start End Amount Amount Freq Income CapGains
% FrontLoad
AnnualFee%
End$
Merrill Lynch Money Mkt 10-03 09-04 10,000 0 - Y Y N 00.00%- 10,139
Page 3 of 7Release date 09-30-2004
©2004 Morningstar Associates, LLC. All Rights Reserved. The information, data, analyses and opinions contained herein (1) include the confidential and proprietary information of Morningstar, (2) may not be copied or redistributed,(3) do not constitute investment advice offered by Morningstar, (4) are provided solely for informational purposes and therefore are not an offer to buy or sell a security, and (5) are not warranted to be correct, complete or accurate. Except as otherwise required by law, Morningstar shall not be responsible for any trading decisions, damages or other losses resulting from, or related to, this information, data, analyses or opinions or their use. This report is supple- mental sales literature. If applicable it must be preceded or accompanied by a prospectus, or equivalent, and disclosure statement.

The performance data quoted represents past performance and does notguarantee future results. The investment return and principal value of aninvestment will fluctuate thus an investor's shares, when redeemed, may beworth more or less than their original cost. Current performance may be loweror higher than return data quoted herein. For information current to the mostrecent month-end, please visit www.morningstaradvisor.com/familyinfo.
An investment in the fund is not insured or guaranteed by the FDIC or anyother government agency. The current yield quotation more closely reflects thecurrent earnings of the money market fund than the total return quotation.Although the fund seeks to preserve the value of your investment at $1.00 pershare, it is possible to lose money by investing in the fund.
Standardized Returns assume reinvestment of dividends and capital gains. Itdepicts performance without adjusting for the effects of taxation, but areadjusted to reflect sales charges and ongoing fund expenses. If adjusted fortaxation, the performance quoted would be significantly reduced. For variable
annuities, additional expenses will be taken in account, including M&E riskcharges, administration fees, fund-level expenses such as management feesand operating fees, and policy-level charges such as surrender, contract andsales charges.
After-tax returns are calculated using the highest individual federal marginalincome tax rates, and do not reflect the impact of state and local taxes. Actualafter tax returns depend on the investor's tax situation and may differ fromthose shown.The after tax returns shown are not relevant to investors whohold their fund shares through tax-deferred arrangements such as 401(k) plansor an IRA. After-tax returns exclude the effects of either the alternative mini-mum tax or phase-out of certain tax credits. Any taxes due are as of the timethe distributions are made, and the taxable amount and tax character of eachdistribution is as specified by the fund on the dividend declaration date. Dueto foreign tax credits or realized capital losses, after-tax returns may begreater than before tax returns. After-tax returns for exchange-traded fundsare based on net asset value.
Disclosure for Standardized and Tax Adjusted ReturnsPage 4 of 7
Annualized returns 09-30-2004
on Distribution on Distributions and Sales of SharesReturns after Taxes (%)
ABN Amro High Yield Bd IFidelity MagellanNuveen All-Amer Muni AOppenheimer Capital Ap NiShares Dow Jones US Total Market Ind-NAV
Standardized Returns (%)
ABN Amro High Yield Bd IFidelity MagellanNuveen All-Amer Muni AOppenheimer Capital Ap NAARP Var Annty Dreyfus Apprec (VA)AIG Profile VA Fidel Mny Mkt (VA)iShares Dow Jones US Total Market Ind-NAViShares Dow Jones US Total Market Ind-MktAberdeen Global Income-NAVAberdeen Global Income-MktMerrill Lynch Money Market Standard & Poor’s 500Lehman Bro’s Agg Bond IndexMSCI EAFE Index Ndtr_D3-Month T-bill
7-dayYield
1 Yr 5 Yr 10 Yr SinceInception
InceptionDate
Sep AcctIncept Date
Max FrontLoad %
Max BackLoad %
Expense Ratio %
–––––
0.67––––
1.00––––
10.6310.151.847.970.87
–9.4120.1119.877.815.580.72
13.853.68
22.081.08
––2.53
5.05–
–3.90–2.14
––
7.4110.312.87
–1.307.48
–0.853.02
–9.205.75
–––––
8.268.20
–11.077.654.014.14
10.2118.816.88
–4.563.50
–0.72–3.97–3.93
7.016.082.99
––––
06–200305–196310–198803–200103–199704–199606–200006–200003–199203–199201–1998
––––
––––
12–199604–1996
–––––
NANA
4.20NANANANANANANANA
NANANA
1.005.006.00NANANANANA
1.250.700.821.431.301.690.200.202.302.301.26
1 Yr 5 Yr 10 Yr SinceInception
InceptionDate
1 Yr 5 Yr 10 Yr SinceInception
7.829.821.847.97
13.60
––3.05
5.04––
–7.625.72
––
7.5215.856.82
–4.68–
06–200305–196310–198803–200106–2000
6.836.592.895.189.21
––2.30
5.06––
–7.295.70
––
7.1015.666.76
–3.86–
© 2004 Morningstar Associates, LLC. All Rights Reserved. The information, data, analyses and opinions contained herein (1) include the confidential and proprietary information of Morningstar, (2) may not be copied or redistributed, (3) do not constitute investment advice offered by Morningstar, (4) are provided solely for informational purposes and therefore are not an offer to buy or sell a security, and (5) are not warranted to be correct, com-plete or accurate. Except as otherwise required by law, Morningstar shall not be responsible for any trading decisions, damages or other losses resulting from, or related to, this information, data, analyses or opinions or their use. This report is supplemental sales literature. If applicable it must be preceded or accompanied by a prospectus, or equivalent, and disclosure statement.

Page 5 of 7
© 2004 Morningstar Associates, LLC. All Rights Reserved. The information, data, analyses and opinions contained herein (1) include the confidential and proprietary information of Morningstar, (2) may not be copied or redistributed, (3) do not constitute investment advice offered by Morningstar, (4) are provided solely for informational purposes and therefore are not an offer to buy or sell a security, and (5) are not warranted to be correct, com-plete or accurate. Except as otherwise required by law, Morningstar shall not be responsible for any trading decisions, damages or other losses resulting from, or related to, this information, data, analyses or opinions or their use. This report is supplemental sales literature. If applicable it must be preceded or accompanied by a prospectus, or equivalent, and disclosure statement.
Hypothetical ReportDisclosure Statement
This illustration may reflect the results of systematic investments and/or with-drawals. Systematic investment does not ensure a profit, nor does it protectthe investor against a loss in a declining market. Also, systematic investingwill not keep an investor from losing money if shares are sold when the mar-ket is down.
Investment Summary GraphThe investment summary graph plots the approximate market value of thesecurity or portfolio over the investing horizon. It may also include the totalinvestment assumed in the illustration and/or a benchmark. Total investmentincludes dollar inflows and outflows, including inflows representing notedtaxes and wrap fees paid out of pocket. If a benchmark index is included on agraph, it assumes a similar pattern of investment/withdrawal as for the secu-rity or portfolio. Taxes and transaction costs are not applied to the benchmarkindex. Note that direct investment in an index is not possible. Indexes areunmanaged portfolios representing different asset classes, with varying levelsof associated risk. The benchmark index included in the graph may or may notrepresent an appropriate or accurate comparison with the security or portfolioillustrated.
Standardized ReturnsFor ETFs, the standardized returns reflect performance, both at market priceand NAV price, without adjusting for the effects of taxation or brokers com-missions. These returns are adjusted to reflect all ongoing ETF expenses andassume reinvestment of dividends and capital gains. If adjusted, the effects oftaxation would reduce the performance quoted.
For money market mutual funds, standardized return is total return adjustedfor sales charges and reflects all ongoing fund expenses. Current 7-day yieldmore closely reflects the current earnings of the money market fund than thetotal return quotation.
For mutual funds, standardized return is total return adjusted for sales chargesand reflects all ongoing fund expenses. Following this disclosure statement,standardized returns for each portfolio holding are shown.
For VA subaccounts, standardized return is total return based on its inceptiondate within the separate account and is adjusted to reflect recurring and non-recurring charges such as surrender fees, contract charges, maximum front-end load, maximum deferred load, maximum M&E risk charge, administrationfees, and actual ongoing fund-level expenses.
For VL subaccounts, standardized return is total return based on its inceptiondate within the separate account and is adjusted to reflect recurring and non-recurring charges such as surrender fees, contract charges, maximum front-end load, maximum deferred load, maximum M&E risk charge, administrationfees, and actual ongoing fund-level expenses. For VLs, additional fees specificto a VL policy such as transfer fees and cost of insurance fees, which arebased on specific characteristics on an individual, are not included.If VL feeswere included in the return calculations, the performance would have beensignificantly lower. An investor should contact their financial advisor and askfor a personalized performance illustration, either hypothetical or historical,which reflects all applicable fees and charges including the cost of insurance.Please review the prospectus and SAI for more detailed information.
Investment RiskMarket Price Risk: The market price of ETFs and closed-end funds traded onthe secondary market is subject to the forces of supply and demand and thusindependent of the CE/ETF’s NAV. This can result in the market price trading ata premium or discount to the NAV, which will affect the investment value.
Market Risk: The market prices of closed-end funds and ETFs can fluctuate asthe result of several factors, such as security-specific factors or general
GeneralThis is an illustration of a simulated investment and assumes the portfolioholding(s) were purchased on the first day of the period indicated. Sales andtax charges, including those required in the event of transfers between assets,are taken into account at the rates shown and may be higher or lower thanwhat an investor would have actually paid had the investments been pur-chased then or now. The performance data represents past performance and isnot indicative of future results. Principal value and investment returns will fluc-tuate, and an investor's shares/units when redeemed may be worth more orless than the original investment.
The underlying holdings of the portfolio are not federally or FDIC-insured andare not deposits or obligations of, or guaranteed by, any financial institution.Investment in securities involve investment risks including possible loss of prin-cipal and fluctuation in value.
The investment returns do not reflect active trading and do not necessarilyreflect the results that might have been achieved by active management of theaccount. The investment returns of other clients of the adviser may differ mate-rially from the investment portrayed.
The information contained in this report is from the most recent informationavailable to Morningstar as of the release date, and may or may not be anaccurate reflection of the current composition of the securities included in theportfolio. There is no assurance that the weightings, composition and ratioswill remain the same.
Pre-inception ReturnsThe analysis in this report may be based, in part, on adjusted historical returnsfor periods prior to the fund’s actual inception. These calculated returns reflectthe historical performance of the oldest share class of the fund, adjusted toreflect the fees and expenses of this share class. These fees and expenses arereferenced in the report’s Charges and Fees section. When pre-inception dataare presented in the report, the header at the top of the report will indicatethis.
While the inclusion of pre-inception data provides valuable insight into theprobable long-term behavior of newer share classes of a fund, investors shouldbe aware that an adjusted historical return can only provide an approximationof that behavior. For example, the fee structures between a retail share classwill vary from that of an institutional share class, as retail shares tend to havehigher operating expenses and sales charges. These adjusted historical returnsare not actual returns. Calculation methodologies utilized by Morningstar maydiffer from those applied by other entities, including the fund itself.
The investment returns do not necessarily reflect the deduction of all invest-ment advisory fees. Client investment returns may be reduced if additional feesare incurred.
Performance for closed-end and exchange-traded funds is calculated based onthe fund's end of the day market prices as reported by the New York StockExchange. Separate account performance is based on the mean experience ofan investor in the account.
© 2004 Morningstar Associates, LLC. All Rights Reserved. The information, data, analyses and opinions contained herein (1) include the confidential and proprietary information of Morningstar, (2) may not be copied or redistributed, (3) do not constitute investment advice offered by Morningstar, (4) are provided solely for informational purposes and therefore are not an offer to buy or sell a security, and (5) are not warranted to be correct, com-plete or accurate. Except as otherwise required by law, Morningstar shall not be responsible for any trading decisions, damages or other losses resulting from, or related to, this information, data, analyses or opinions or their use. This report is supplemental sales literature. If applicable it must be preceded or accompanied by a prospectus, or equivalent, and disclosure statement.

Page 6 of 7
Hypothetical ReportDisclosure Statement continued
© 2004 Morningstar Associates, LLC. All Rights Reserved. The information, data, analyses and opinions contained herein (1) include the confidential and proprietary information of Morningstar, (2) may not be copied or redistributed, (3) do not constitute investment advice offered by Morningstar, (4) are provided solely for informational purposes and therefore are not an offer to buy or sell a security, and (5) are not warranted to be correct, com-plete or accurate. Except as otherwise required by law, Morningstar shall not be responsible for any trading decisions, damages or other losses resulting from, or related to, this information, data, analyses or opinions or their use. This report is supplemental sales literature. If applicable it must be preceded or accompanied by a prospectus, or equivalent, and disclosure statement.
investor sentiment. Therefore, investors should be aware of the prospect ofmarket fluctuations and the impact they may have on the market price.
Non-Diversified Funds/Subaccounts: Investing most of their assets in a smallnumber of issuers involves additional risks, including share price fluctuations,because of the increased concentration of investments.
Tax-Free Municipal Bond Funds/Subaccounts: The income from tax-free munic-ipal bond funds may be subject to state and local taxation and the AlternativeMinimum Tax.
High-Yield Bond Funds/Subaccounts:Investing in lower-rated debt securities(commonly referred to as junk bonds) involves additional risks because of thelower credit quality of the securities in the portfolio. The investor should beaware of the possible higher level of volatility, and increased risk of default.
Sector Funds/Subaccounts: Investing exclusively in one sector or industryinvolves additional risks. The lack of industry diversification subjects theinvestor to increased industry-specific risks.
Small Company Stock Funds/Subaccounts: Investing in stocks of small compa-nies involves additional risks. Smaller companies typically have a higher riskof failure, and are not as well established as larger blue-chip companies.Historically, smaller-company stocks have experienced a greater degree ofmarket volatility than the overall market average.
Foreign Securities Funds/Subaccounts: Investing in foreign securities involvesspecial additional risks. These risks include, but are not limited to, currencyrisk, political risk, and risk associated with varying accounting standards.
Emerging Market Funds/Subaccounts: Investing in foreign securities involvesspecial additional risks. These risks include, but are not limited to, currencyrisk, political risk, and risk associated with varying accounting standards.Investing in emerging markets may accentuate these risks.
Mid Cap Funds/Subaccounts: Investing in companies with smaller market cap-italizations involves additional risks. The securities of these companies may bemore volatile and less liquid than the securities of larger companies.
Definitions of Report TermsAverage Annualized Return: Average annualized money-weighted return (inter-nal rate of return). In illustrations with time periods less than one year, thisfigure is not annualized.
Capital Gains (Individual Report): Percentage of the total market value of theholding that is attributable to the reinvestment of capital gains distributions.
Charges & Fees (Investment Detail): The sum of fees charged to the investorduring the period, including front- or deferred loads, VA charges, and annualfees.
Cumulative Return: The total money-weighted return of the investment overthe entire time period of the illustration.
Distribution/Withdrl: The sum of distributions not reinvested, plus any cashwithdrawals during the period.
Income (Individual Report): The percentage of the total market value of the
holding that is attributable to the reinvestment of income or dividend distribu-tions.
Liquidate: Indicates whether the advisor chose to liquidate the holding on theend date.
Median (Comparison Report): The total money-weighted return (internal rateof return) of the median security in the illustration for the calendar year indi-cated.
New investment: Any new cash invested during the period.
Principal (Individual Reports): The percentage of the total market value of theholding that is attributable to new investment.
Rebalance (Planning Assumptions): Indicates whether rebalancing is used,and its frequency. "No" indicates no rebalancing. Options for rebalancing fre-quency are monthly, quarterly, semi-annually, and annually.
Rebalance (Investment Assumptions): Percentage of total asset allocation tobe maintained in this holding through rebalancing.
Securities Returns (Comparison Report): The total money-weighted return(internal rate of return) for the holding in the calendar year indicated, takinginto account cash flows, charges, and fees.
Subsequent Invest/Withdwl: The amount, type, and frequency of subsequentinvestments or withdrawals from the holding. Withdrawals are representedby a negative number. Systematic investments and withdrawals may be mademonthly, quarterly, semi-annually, or annually. If "Custom," a custom scheduleof investments or withdrawals was used.
Taxes Due: The total amount of taxes due from the investor, determined byapplying specified tax rates to distributions and sale of shares during eachcalendar year.
Total Investment: The total out-of-pocket expense for the investor. Includesnew investment, annual fees paid to advisor, and taxes due. This figure is netof withdrawals, including liquidation.
Total Reinvest: The sum of distributions reinvested during the period.
Total Return %: The total money-weighted return (internal rate of return) oninvestments for the period.

Custom Benchmark DisclosureBenchmark: Custom
Custom Benchmark: 60-30 Custom Benchmark Ticker Security type Allocation %S&P 500 INX IDX 60.00Lehman Brothers Aggregate Bond X100M9 IDX 30.003 Month T-Bill X100O5 IDX 10.00
3 Month T-BillAs tracked by the Wall Street Journal, this benchmark measure the yields of bank-sponsored certificates of deposit.
Lehman Brothers Aggregate Bond: Govt/Credit Index, the Mortgage-Backed Securities Index, and the Asset-Backed Securities Index.
Standard & Poor's 500: A market capitalization-weighted index of 500 widely held stocks often used as a proxy for the stock market.
Page 7 of 7
©2004 Morningstar Associates, LLC. All Rights Reserved. The information, data, analyses and opinions contained herein (1) include the confidential and proprietary information of Morningstar, (2) may not be copied or redistributed,(3) do not constitute investment advice offered by Morningstar, (4) are provided solely for informational purposes and therefore are not an offer to buy or sell a security, and (5) are not warranted to be correct, complete or accurate. Except as otherwise required by law, Morningstar shall not be responsible for any trading decisions, damages or other losses resulting from, or related to, this information, data, analyses or opinions or their use. This report is supple- mental sales literature. If applicable it must be preceded or accompanied by a prospectus, or equivalent, and disclosure statement.