i-5 express lanes toll feasibility study · shawn murinko at 360-705- 7097 or [email protected]....
TRANSCRIPT

I-5 Express Lanes Toll Feasibility Study
Prepared for Governor Chris Gregoire and the 2011 Washington State Legislature
June 2011

Title VI Statement to Public: WSDOT ensures full compliance with Title VI of the Civil Rights Act of 1964 by prohibiting discrimination against any person on the basis of race, color, national origin or sex in the provision of benefits and services resulting from its federally assisted programs and activities. For questions regarding WSDOT’s Title VI Program contact Jonté Sulton at 360-705-7082 or [email protected]. Americans with Disabilities Act (ADA) Information: Materials can be provided in alternative formats for people with disabilities by calling Shawn Murinko at 360-705- 7097 or [email protected]. Persons who are deaf or hard of hearing may contact Office of Equal Opportunity through the Washington Relay Service at 7-1-1.
11-06-0777
For more information contact:
Rob Fellows, Policy and Planning ManagerWSDOT Toll Division401 Second Ave S, Suite 200Seattle, WA [email protected]

I-5 Express Lanes Toll Feasibility Study | iiiWashington State Department of Transportation
Table of Contents
Executive Summary .................................................................................... 1
Introduction ................................................................................................. 1
Legislative Directive ..................................................................................... 1
Background .................................................................................................. 2
Study Approach ........................................................................................... 3
Definition and Assumptions ......................................................................... 3
Summary of Findings ................................................................................... 4
Value Pricing Revenue Generation Potential .......................................... 4
Maximizing Efficient Operation of the Corridor .................................... 5
Economic Considerations for Future Corridor Investments ................... 6
Regional Transportation System Impacts ............................................... 6
1 Background .............................................................................................. 7
Introduction ................................................................................................. 7
I-5 Express Lanes Proviso ............................................................................ 7
Project Context ............................................................................................. 8
Express Lanes Design and Operations .................................................... 8
State and Regional Context ....................................................................10
Study Purpose and Approach .....................................................................11
Purpose ..................................................................................................11
Approach ................................................................................................11
2 Analysis Assumptions ............................................................................ 13
Operating Concept and Toll Collection Methods ........................................13
Related Capital Improvements and Cost Estimate Methodology ...............14
Capital Cost Estimate Methodology ......................................................15
Financial Analysis Process and Assumptions .............................................16
Gross Toll Traffic and Revenue Projections ........................................... 17
Operating Deductions and Net Toll Revenue Projections ......................21
Financial Analysis Assumptions ................................................................ 24

3 Findings .................................................................................................. 25
Preliminary Engineering, Capital, and Operating Cost Projections ..........................................................................................25
Traffic and Congestion Impacts .................................................................25
Regional Impacts ........................................................................................27
Financial Analysis Results ..........................................................................29
Toll bond proceeds available for capital investment in FY 2015 .............29
Excess toll revenues available for annual, pay-as-you-go uses starting FY 2017 .....................................................................................29
Revenues would cover routine facility O&M costs .................................30
Economic considerations for future corridor investments ......................30
Responses to Proviso Questions .................................................................31
Value Pricing Revenue Generation Potential .........................................31
Maximizing Efficient Operation of the Corridor ...................................31
Economic Considerations for Future Corridor Investments ..................32
Regional Transportation System Impacts ..............................................32
4 Next Steps ............................................................................................. 33
Appendix: I-5 Express Lane System Pre-Design Study ...........................................A-1
Background ..............................................................................................A-1
Project Objectives ......................................................................................A-1
Why consider changing HOV lanes into Express Toll Lanes? ..............A-2
An express toll lane system for I-5 ............................................................A-3
Extent of an express toll lane system ....................................................A-3
Illustrating the concept ........................................................................A-3
Phasing Plan and Cost Projections ............................................................A-5
Capital Cost Estimates ........................................................................ A-6
Operational and Financial Analysis Assumptions and Approach ............A-7
Toll bond proceeds available for capital investments ...........................A-7
Excess toll revenues available for annual, pay-as-you-go uses ............. A-8
Revenues would cover routine facility O&M operations and maintenance ..................................................................................A-9
Next Steps ............................................................................................... A-10

I-5 Express Lanes Toll Feasibility Study | 1Washington State Department of Transportation
Executive Summary Introduction
This report answers a specific charge posed by the 2010 Washington State Legislature: to assess the feasibility and impacts of tolling the Interstate 5 reversible express facility between downtown Seattle and Northgate. The report presents the results of a planning-level study of the costs, potential revenues, economic considerations and transportation system impacts of collecting tolls in this corridor. Unlike previous toll feasibility studies, no specific improvements or uses of toll revenues have been identified – so the costs and revenues associated with tolling the existing express lane facility are described, but without describing benefits that could make the costs worthwhile or mitigations that might be needed to respond to traffic diverted to different ramps or roadways.
The report describes the assumptions made to conduct the analysis, the key analysis steps, and the resulting findings including specific responses to the four questions posed by the legislature. The results represent a planning-level analysis, and far more work would be needed to refine estimates, benefits and impacts to the level needed to prior to making tolling and project decisions.
Legislative Directive
The 2010 legislature adopted a budget proviso directing the Washington State Department of Transportation (WSDOT) to study the feasibility of implementing tolls on the reversible I-5 express lane roadway, using federal grant monies received for a broader study on express toll lanes described in the Appendix. WSDOT was directed to submit a final report on the findings to the Joint Transportation Committee by June 30, 2011 and to address these issues:
• the potential for value pricing to generate revenues for needed transportation facilities
• maximizing the efficient operation of the corridor
• economic considerations for future system investments
• an analysis of the impacts to the regional transportation system

Washington State Department of Transportation 2 | I-5 Express Lanes Toll Feasibility Study
Background
The I-5 reversible express lanes operate between downtown Seattle and Northgate, with direct connections to and from the I-5 mainline at each end. There are four lanes in the central portion, narrowing to one lane at the south end and two lanes at the north end. The express lanes generally operate 18 hours a day, seven days a week, southbound in the morning and northbound in the afternoon and are open to all traffic; however, some lanes and ramps are restricted to high occupancy vehicles (HOVs) with two or more occupants.
The section of I-5 between downtown Seattle and Northgate, where the express lanes operate, has the highest traffic volume of any corridor in the state. An average 272,000 vehicles crossed the I-5 Ship Canal Bridge each weekday in 2010. The reversible roadway carries approximately 20 percent of this traffic – though it carries a higher portion of traffic during peak periods. The express lanes also serve the state’s highest transit volumes which are expected to decrease as future rail extensions are completed. I-5 mainline lanes paralleling the express lanes are routinely congested for 12 hours on weekdays. It is not unusual for travel on the mainline in the opposite direction of the express lanes to take 30 minutes longer in the peak hour than under free-flowing off-peak conditions.
Within the express lanes traffic is generally free-flowing for 15 of the 18 hours they are open. There are, however, significant bottlenecks at each end of the facility where the express lanes rejoin the mainline. The express lanes were designed at a time when commuter traffic was primarily destined to downtown Seattle, however travel patterns today represent multiple destinations, and the demand of traffic passing through downtown Seattle is far greater than available capacity.

I-5 Express Lanes Toll Feasibility Study | 3Washington State Department of Transportation
Study Approach
This study is a planning level toll feasibility study, using existing traffic and financial modeling tools and data, planning-level cost estimates and revenue/financing analyses. Preliminary findings were shared with a multi-agency coordinating committee, including members from local and regional agencies, the Federal Highway Administration (FHWA), the Washington State Transportation Commission (WSTC) and Washington State Patrol. The study did not include public involvement or environmental analysis, which would be conducted in a future stage if a toll proposal is carried forward and uses for toll revenue are defined.
Definition and Assumptions
The study assumes variable tolls would be implemented on the express lanes, while keeping the current physical configuration and operational hours. Thus, capital costs would be kept to a minimum. Unlike today, all but one access ramp at NE 65th Street would be open to all toll-paying traffic. For the purposes of the analysis, transit and 3-person HOVs were assumed to be toll-exempt.
Tolls would be collected at a single mid-corridor toll point, and would be either dynamic: changing in response to actual congestion conditions on the roadway; or variable: changing by time of day on a scheduled pattern. Tolls would be collected electronically using transponders and photo tolling, with invoices mailed to vehicle owners who don’t maintain a Good To Go! account.
Because this analysis seeks to assess how much funding could potentially be generated by tolling the express lanes, toll rates were set to emphasize revenue generation. Lower express lanes toll rates could be chosen to target higher traffic throughput, with lower diversion to the mainline and other routes, but would also generate less revenue.
Capital costs associated with the project would include toll collection equipment, pavement markings, additional loop detectors to provide real-time traffic information for dynamic tolling, and signage. Tolls would pay for operating and maintenance costs, including the costs to operate and maintain the roadway as well as tolling equipment.

Washington State Department of Transportation 4 | I-5 Express Lanes Toll Feasibility Study
Summary of Findings
Following is a summary of key findings, given the set of tolling and financial assumptions described; as well as economic, demographic and land use assumptions built into the regional transportation demand model. Some of the impacts shown could be mitigated depending on how toll revenues are used.
Value Pricing Revenue Generation Potential • Assuming an opening in fiscal year (FY) 2016, tolling the express lanes
would generate up to $22 million of net revenue in FY 2017.
• Net toll revenue could grow significantly over time as growth in traffic and congestion increase the time savings provided by the tolled express lanes, the willingness to pay tolls and thus the toll rates required to maintain the traffic throughput target.
• The future net revenue from these tolls could finance up to $185 million in capital improvements under the assumed toll rates and escalation, with funding delivered in FY 2015.
• Excess net revenues after paying debt service could be available for other incremental pay-as-you-go uses; these are estimated at $6 million initially in FY 2017 with growth over time.
• Net toll revenues, and any upfront funding contribution that they may provide with toll bond financing, are net of deductions for facility operations and maintenance (O&M) costs, toll collection O&M costs, credit card fees, uncollectible accounts, and, in the case of financing, contributions to a facility O&M reserve fund.
• Because tolls are also assumed to pay for facility O&M (but not major preservation), existing annual maintenance funds would be available for other uses.

I-5 Express Lanes Toll Feasibility Study | 5Washington State Department of Transportation
Maximizing Efficient Operation of the Corridor• The pricing approach modeled would improve the speed and reliability of
traffic in the reversible lanes. The greatest improvement would accrue to traffic passing through Seattle, but downtown trips would also benefit.
• It is expected that value pricing could cause a significant improvement in reliability for those people paying tolls that is not fully captured by the regional travel model.
• The level of benefits accruing to toll paying customers depends on how the express lanes are operated to target vehicle throughput.
- Higher toll rates and lower throughput targets will tend to maximize the travel time savings of the express lanes and promote revenue generation. To ascertain both the revenue potential and user benefits of pricing, this study analyzed higher toll rates.
- Lower toll rates and higher throughput targets, provided that tolls are high enough to help alleviate bottlenecks and congestion, will tend to provide less time savings per toll vehicle, but potentially more system delay reduction by spreading those benefits across more toll paying customers, while also minimizing diversion and congestion impacts to the mainline.
• Approximately 22 percent of daily traffic from the express lanes would shift to the mainline or other routes. This is equivalent to approximately four percent of total daily traffic on I-5. Approximately three-fourths of this traffic would shift to the mainline and one quarter, less than one percent of the daily traffic on I-5, would change to another route.
• Peak hour through-traffic speeds on the express lanes would increase 16 to 17 mph. Traffic speeds for traffic destined to and from downtown Seattle ramps would increase by 7 to 17 mph. Mainline peak hour speeds in the direction of express lanes flow could be reduced by as much as 4 to 5 mph.
• Bottleneck queues, where express lanes traffic returns to mainline I-5 and where mainline traffic enters the express lanes, will be reduced.
• Eliminating HOV only ramp restrictions on the downtown Seattle ramps would redistribute traffic among those ramps, reducing intersection congestion at the Mercer Street and Stewart Street ramps and increasing congestion at the Cherry Street/Columbia Street and Pike Street ramps. More detailed operational analysis is needed to fully understand these effects.
• Eliminating HOV lane and ramp restrictions and queuing for traffic returning to the I-5 mainline would cause traffic and speeds to be more evenly distributed between lanes within the express lanes, especially in the southbound direction.
• Travel time improvements in the express lanes would also improve transit travel times. However, traffic redistribution on the downtown ramps could affect transit in a variety of positive and negative ways that need to be investigated further.

Washington State Department of Transportation 6 | I-5 Express Lanes Toll Feasibility Study
Economic Considerations for Future Corridor Investments• Tolling the express lanes would provide revenue that would be available
for transportation uses.
• The benefits would depend on how toll revenues are used.
- Toll revenues could be leveraged for any I-5 transportation capital improvement, such as increased capacity through Seattle or the corridor build-out of an I-5 express toll lanes system (see Appendix).
- Toll revenues could address preservation, maintenance and safety backlogs in the corridor.
Regional Transportation System Impacts• Modeling shows no significant impact on other major regional facilities.
• Some nearby corridors show moderate increases in volume, such as the University Bridge and the SR 99 Aurora Bridge.

I-5 Express Lanes Toll Feasibility Study | 7Washington State Department of Transportation
1 BackgroundIntroduction
This report answers a specific charge posed by the 2010 Washington State Legislature: to assess the feasibility and impacts of tolling the Interstate 5 reversible express facility between downtown Seattle and Northgate. The report provides information similar to other legislatively requested toll feasibility studies. It presents the results of a planning-level study of the costs, potential revenues, economic considerations, and transportation system impacts of collecting tolls in this corridor. Because the legislature chose to fund this work using a federal value pricing grant,
an appendix describes the preliminary results of the remainder of work funded by the federal grant, which is focused on developing a system plan for an express toll lane system in the Puget Sound Region.
It is important to note that this report differs from other toll feasibility reports in one significant way. Other toll feasibility studies describe the feasibility and effects of using tolling to construct a defined set of transportation improvements. For this study, however, neither specific improvements nor uses of revenues are specified. As a result, only partial answers can be provided to the questions raised in the legislative proviso. To evaluate and understand the full set of benefits and drawbacks of any tolling proposal requires both definition of the toll program and a description of how toll revenues will be used. This report describes the cost and revenues associated with tolling an existing facility, but without also describing the benefits that might make the costs worthwhile. In order to move beyond this feasibility report to an actual tolling proposal—and to engage in a public conversation about it— a critical step will be to define what, among the long list of improvement and preservation needs for I-5, might be funded as a result of tolling.
The report describes the assumptions made to conduct the analysis, the key analysis steps and the resulting findings including specific responses to the four questions posed by the legislature. The analysis was a collaborative effort between a consultant team, WSDOT and PSRC. The results represent a planning-level analysis, and far more work would be needed to refine estimates, benefits and impacts prior to making tolling and project decisions.
I-5 Express Lanes Proviso
The 2010 legislature adopted a budget proviso in ESSB 6381, directing WSDOT to assess the feasibility of tolling the I-5 express lanes, the separate reversible roadway in the center of I-5 between downtown Seattle and Northgate. The study was conducted as part of the “Express Lanes System Concept Study”, also known as the Express Lanes System Pre-Design Project, which is still underway and further described in the Appendix.
$790,000 of the motor vehicle account--federal appropriation is provided solely for the Express Lanes System Concept Study project, identified as project 800020A. As part of this project, the department shall prepare a comprehensive tolling study of the Interstate 5 express lanes to determine the feasibility of administering tolls within the corridor. The department shall regularly report to the Washington transportation commission regarding the progress of the study. The elements of the study must include, at a minimum:
(i) The potential for value pricing to generate revenues for needed transportation facilities;
(ii) Maximizing the efficient operation of the corridor;
(iii) Economic considerations for future system investments; and
(iv) An analysis of the impacts to the regional transportation system.
(b) The department shall submit a final report on the study to the joint transportation committee by June 30, 2011.
99
99
5
405
90
520
Puget Sound
Shoreline
Northgate
DowntownSeattle Bellevue
Kirkland
Snohomish County
Bothell

Washington State Department of Transportation 8 | I-5 Express Lanes Toll Feasibility Study
Project Context
Express Lanes Design and OperationsThe express lanes extend for 7.14 miles between James Street in downtown Seattle and NE 103rd Street at Northgate, with direct connections to and from the I-5 mainline at each end. The reversible roadway begins near James Street in downtown Seattle where a single lane connects from mainline I-5, and a second lane is added from the Cherry Street/Columbia Street ramp. The facility widens to four lanes in the central portion before narrowing to two lanes returning to mainline I-5 at Northgate. When operating southbound, of the four lanes in the central portion, three feed ramps into downtown Seattle and one lane connects back to the I-5 mainline south of Seattle. The reversible express lanes operate southbound in the morning and northbound in the afternoon, 18 hours a day seven days a week, and are open to all traffic. Generally, the lanes are closed between 11 p.m. and 5 a.m., to reduce nighttime noise impacts on neighboring residents.
Three ramps at Cherry Street /Columbia Street, Pike Street and NE 65th Street are restricted to HOVs with two or more occupants, as are some lane segments connecting to each ramp and to the northbound mainline lanes. When operating northbound, the left-most lane becomes an HOV lane after the State Route 522/Lake City Way exit, so one HOV and one general purpose lane connect back to the mainline. In the southbound direction, one HOV lane begins just south of the I-5 Ship Canal Bridge and continues to the Cherry Street/Columbia Street off-ramp. Another HOV lane begins at the Stewart Street off-ramp and continues to the Pike Street off-ramp. The single general purpose lane that returns to mainline I-5 operates in the center lane between these two HOV lanes, and is often full of stopped traffic while HOV traffic speeds by on either side.
When the express lanes were designed and built in the 1960s, traffic patterns focused heavily on commute trips in and out of downtown Seattle. While there is still a large volume of traffic commuting into and out of the city, overall traffic patterns have become more widely dispersed and far more demand exists for traffic passing through downtown Seattle than can be accommodated on I-5. Two lanes in each direction on mainline I-5 allow drivers to pass through downtown Seattle without changing lanes, and the express lane roadway provides a third lane in the open direction.
NE 103rd St
To/From Mainline I-5
Lake City WayLake City Way
NE 42nd St
Stewart St
Howell St
Olive Way
Terry Ave
9th Ave
5th Ave
4th Ave
Pine St
Pike St
Columbia StCherry St To/From Mainline I-5
Intersection Details
UniversityDistrict
Northgate
DowntownSeattle
5
5
N
1st A
ve N
E
7th
Ave
NE
NE Ravenna Blvd
NE 65th St
Mercer St
Northbound
Southbound
HOV
I-5 Express Lanes Toll Feasibility Study | 9Washington State Department of Transportation
Performance statistics include:
• Volumes: The express lanes operate in the highest volume corridor in the region carrying an average of 272,000 vehicles on an average weekday in 2010
- Mainline lanes: 217,000 vehicles (80 percent of total on a daily basis)
- Express lanes: 55,000 vehicles (20 percent of total – higher during peak periods)
- Because the reversible lanes are open only 18 out of 24 hours, their share of traffic during hours of operation is slightly higher than the 80/20 split represented by total daily volumes.
• Congestion: I-5 mainline lanes paralleling the express lanes are routinely congested in at least one direction for 12 hours on weekdays. It is not unusual for travel on the mainline in the direction opposite of the express lanes to take 30 minutes longer than under free-flowing conditions.
- Within the express lanes traffic is generally free-flowing for 15 of the 18 hours the lanes are in operation. There are, however, significant bottlenecks at the north and south ends of the express lanes where they narrow to one or two lanes (southbound and northbound respectively) and merge back into the mainline roadway.
- Vehicles using the express lanes generally save 2 to 3 minutes in travel time compared to vehicles in the mainline lanes, during the most congested morning and afternoon peak hours. Travel times in the express lanes are also more reliable than those in the mainline.
- The mainline lanes often experience the greatest congestion in the off-peak direction because of the imbalance in capacity—there are eight lanes in the peak direction versus four lanes in the off-peak direction, while traffic demand is more evenly split. This is particularly noticeable in the southbound direction when the express lanes are operating northbound.
• Transit: The combined corridor—mainline and express lanes—carries more transit vehicles and passengers than any other corridor in the state. The portion of transit riders using I-5 will likely decrease in the future as planned rail extensions are completed and bus service is reduced.

Washington State Department of Transportation 10 | I-5 Express Lanes Toll Feasibility Study
State and Regional ContextTolling the I-5 express lanes is consistent with the strategies of Moving Washington, WSDOT’s vision of investments and priorities for the next 10 years. Moving Washington is a plan to reduce congestion and improve mobility by focusing on three key strategies:
• Manage demand by offering more choices to commuters and promoting alternatives to driving alone including easy transit access and telecommuting
• Operate efficiently the existing capacity by applying “Smarter Highways” strategies, including ramp metering, Active Traffic Management Systems (ATMS) and express toll lanes
• Add capacity strategically, focusing on key bottlenecks.
Variable pricing on the express lanes would be consistent with the Moving Washington efficiency and demand management strategies, and revenues could be applied to implementing all three Moving Washington strategies.
The Puget Sound Region’s transportation plan, Transportation 2040, was recently adopted by the Puget Sound Regional Council (PSRC). The plan envisions funding future transportation improvements by transitioning from existing revenue sources such as fuel and sales taxes, to user fees. PSRC’s financial strategy starts with developing high occupancy toll (HOT) lanes, and tolling individual highway extension and bridge projects in their entirety as they are implemented. The plan calls for full highway system tolls through King, Pierce and Snohomish counties by 2040.
Based on current economic conditions, it is likely that tolling revenue will be needed for a portion of the costs to implement the Moving Washington program, and to implement the regional transportation plan and financial strategies.

I-5 Express Lanes Toll Feasibility Study | 11Washington State Department of Transportation
Study Purpose and Approach
PurposeThe purpose of this study was to address issues raised by the legislature with regards to the revenue potential of value pricing, efficient operation of the corridor, economic considerations and impacts to the regional transportation system of tolling the I-5 express lanes.
The information generated from this study will be used to inform the legislature, governor, the WSTC, and stakeholders, in decisions regarding whether further consideration and development of a toll and improvement proposal is warranted.
ApproachIn practice, toll studies and analyses in Washington state fall into three categories:
• Level 1: Planning level toll feasibility studies are technical analyses conducted using existing traffic and financial modeling tools and data, with limited or no public and stakeholder involvement. These produce planning-level cost estimates and revenue/financing analyses. This study is a level 1 toll planning-level feasibility study.
• Level 2: Project level toll studies are more detailed technical analyses. Level 2 studies are sufficient to describe project-level costs and impacts to prepare environmental studies and conduct more detailed revenue analysis and public outreach efforts. The legislature has previously commissioned this type of study to engage stakeholders and the public prior to considering whether to authorize tolling to help fund specific improvement projects.
• Level 3: Investment grade traffic and revenue studies are prepared immediately prior to obtaining financing. This more comprehensive study is used by lenders and credit rating agencies to understand and assess financing risks prior to issuing bonds. Building upon earlier work, a level 3 study updates and revises traffic models, makes independent updates to input assumptions, conducts detailed data collection, and applies specialized analysis tools to prepare traffic and revenue projections appropriate for financing objectives.
Figure 1:Tolling Concept
NE 103rd St
To/From Mainline I-5
Lake City WayLake City Way
NE 42nd St
To/From Mainline I-5
UniversityDistrict
Northgate
DowntownSeattle
5
5
N
1st A
ve N
E
NE 65th St
Mercer St
Stewart St
Howell St
Pine StPike St
Columbia StCherry St
Northbound
Southbound
HOV
PotentialToll Point

Washington State Department of Transportation 12 | I-5 Express Lanes Toll Feasibility Study
This study is a planning level toll feasibility study. It has not included public outreach, which would occur at a later stage of project development if and when an improvement program is defined and tolling authority is contemplated to fund it.
The study was carried out by WSDOT with the assistance of the PSRC and consultants specializing in freeway design and operations, travel demand modeling and financial analysis including tolling. A coordinating committee with membership from local and regional agencies, FHWA, WSTC and the Washington State Patrol reviewed initial study findings.
The I-5 express lanes at Lakeview Boulevard East

I-5 Express Lanes Toll Feasibility Study | 13Washington State Department of Transportation
2 Analysis AssumptionsA series of analysis assumptions were made for the purpose of estimating capital and operating costs, modeling facility performance and traffic impacts, forecasting revenue, and assessing financial results. They are not meant to represent decisions about how the project might ultimately be financed, implemented and operated, but are considered a reasonable “guess” about how tolls would be implemented. If the project was to go forward, final decisions in these areas would be made during final project development, which would include a more detailed traffic and revenue study, financial analysis, and consultation with other agencies, WSTC and the public.
Operating Concept and Toll Collection Methods
For the purpose of this analysis the following operational and tolling assumptions were modeled:
• Hours of operations would be 5 a.m. to 8 p.m.
• All vehicles, including medium and large trucks would be permitted to pay the toll and use the express lanes.
• HOV 3+ (including transit) would not be tolled.
• HOV ramp restrictions on downtown Seattle ramps at Cherry Street/Columbia Street and Pike Street would be removed. The southbound on-ramp from NE 65th Street on ramp would remain HOV only under the tolled reversible lanes scenario due to its limited capacity.
• The express lanes would operate with a single mid-corridor toll point (see Figure 1). All traffic on the express lanes would use the segment between Mercer Street and the NE 42nd Street, and the toll point could be located anywhere in that segment.
• Tolls would be collected electronically using transponders or photo tolling (Pay By Mail), with invoices mailed to registered owners of vehicles that are not associated with a Good To Go! account.
Washington State Department of Transportation 14 | I-5 Express Lanes Toll Feasibility Study
Related Capital Improvements and Cost Estimate Methodology
For the purpose of this analysis the following capital improvements, primarily associated with tolling, were assumed:
• Toll point: A single toll collection location would be installed between the south end of the I-5 Ship Canal Bridge and the Mercer Street ramp, likely consisting of two gantries to capture front and rear license plates, with sufficient cameras and toll readers to capture all traffic.
• Pavement markings: Pavement markings would be modified to remove HOV designations and lane striping on the approaches to the reversible lanes at Northgate as well as on the lanes and at the ramps now operating as HOV only.
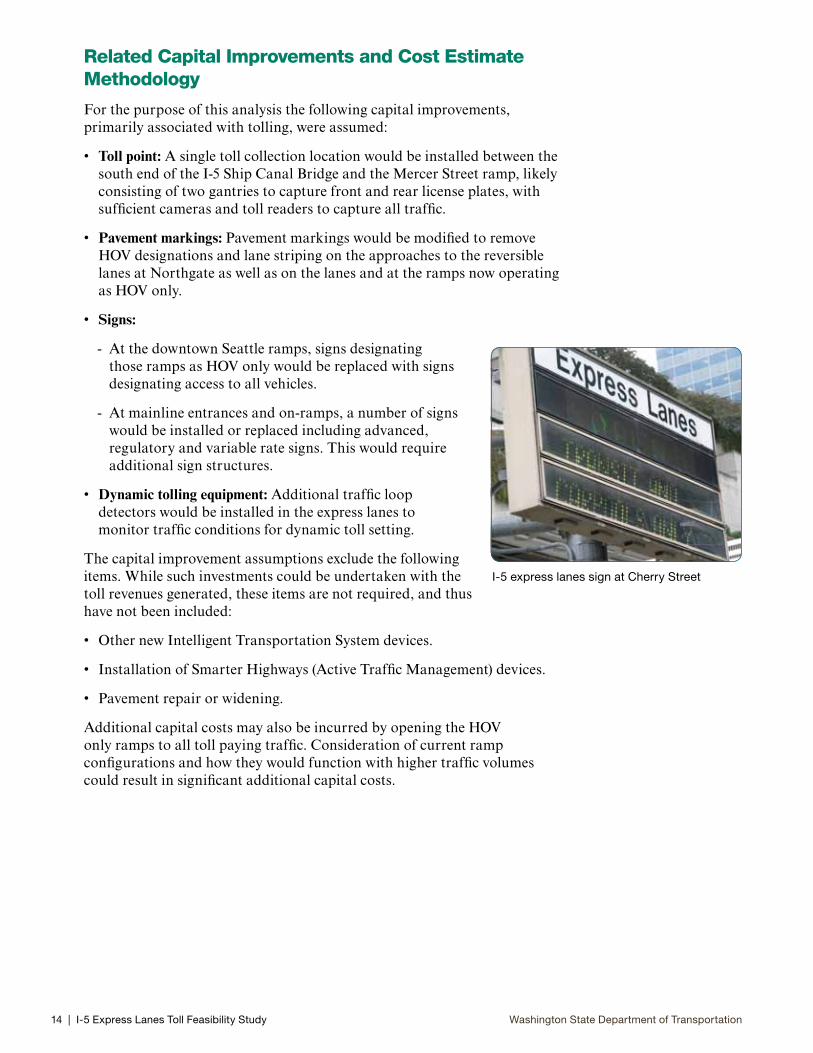
• Signs:
- At the downtown Seattle ramps, signs designating those ramps as HOV only would be replaced with signs designating access to all vehicles.
- At mainline entrances and on-ramps, a number of signs would be installed or replaced including advanced, regulatory and variable rate signs. This would require additional sign structures.
• Dynamic tolling equipment: Additional traffic loop detectors would be installed in the express lanes to monitor traffic conditions for dynamic toll setting.
The capital improvement assumptions exclude the following items. While such investments could be undertaken with the toll revenues generated, these items are not required, and thus have not been included:
• Other new Intelligent Transportation System devices.
• Installation of Smarter Highways (Active Traffic Management) devices.
• Pavement repair or widening.
Additional capital costs may also be incurred by opening the HOV only ramps to all toll paying traffic. Consideration of current ramp configurations and how they would function with higher traffic volumes could result in significant additional capital costs.
I-5 express lanes sign at Cherry Street

I-5 Express Lanes Toll Feasibility Study | 15Washington State Department of Transportation
Capital Cost Estimate MethodologyThe design for this project is at a conceptual level of design that is less than two percent complete. Cost estimates were based on recent procurements and elements developed for other WSDOT projects.
Quantities and construction costs were identified only for major project items, including new overhead sign structures, variable message signs and toll collection equipment.
Allowances for temporary erosion and storm water control, traffic control during construction, and contractor mobilization, are based on the percentage of total construction cost these items represent on similar urban projects. Allowances were made for project elements not yet fully defined at the current conceptual level of design. Project costs for sales tax, construction engineering and contingencies were based on typical percentages of construction cost for WSDOT projects.
Environmental and public outreach costs reflect the project team’s assessment that an Environmental Impact Statement (EIS) process could be required. No allowance was made for additional project related investments that might be identified during a future environmental and public outreach process. These additional project related investments could be needed to gain project approvals from the FHWA. Therefore the estimate for design and environmental work should be considered a baseline to which additional cost will be needed if other project elements are required.

Washington State Department of Transportation 16 | I-5 Express Lanes Toll Feasibility Study
Financial Analysis Process and Assumptions
The toll analysis performed for this feasibility study was relatively high level, relying primarily on available data and existing analysis tools. It is intended to help decision-makers ascertain if the express lane tolling concept warrants further study. The analysis framework was built on, and is consistent with other recently completed toll studies, including the SR 520 bridge replacement, I-405 express toll lanes, and Alaskan Way Viaduct replacement.
Figure 2Financial Analysis Process
ProjectSpecifications
Concepts ofOperations
Traffic Modeling
RevenueModeling
FinancialModeling
• Where and what is the project?
• Type of tolls: flat, variable, or dynamic
• Capital cost estimates
• Determine specific toll rates to meet project objectives (revenue generation, traffic management, or a combination)
• Annual gross toll revenue projections
• Deductions from gross toll revenues
• Annual net toll revenue projections
• Toll funding contribution to project
• Match timing of sources available to desired uses
Figure 2 shows the sequence of steps in the analysis; however, the process typically involves iteration at several stages. The financial analysis portion of the process is focused on the latter three steps in the above process diagram, and can be described simply as:
1. Prepare gross toll traffic and revenue projections
2. Prepare net toll revenue estimates
3. Assess the financial capacity of net toll revenues
The following discussion provides additional detail regarding each of these three steps. As a general note, date assumptions cited in this section typically reference the state’s fiscal year (FY), which is from July 1 of the preceding calendar year to June 30 of the calendar year (i.e. FY 2015 is the period from July 1, 2014 to June 30, 2015).

I-5 Express Lanes Toll Feasibility Study | 17Washington State Department of Transportation
Gross Toll Traffic and Revenue ProjectionsTraffic modeling was performed using the PSRC’s regional travel demand model to assess traffic volumes and the impacts of pricing the I-5 express lanes. The model version also employed for the SR 520 Final Environmental Impact Statement and its future network which includes the SR 520 corridor improvements, the SR 167 HOT Lanes, I-405 Express Toll Lanes and the SR 99 Bored Tunnel alternative. The model is designed to simulate travel behavior, including approximating traffic congestion and people’s willingness to:
• Pay a peak period toll to avoid congestion
• Choose to travel during less congested times and pay a lower toll
• Choose other travel options (i.e. transit)
• Choose a different route to avoid the toll altogether (i.e., use the I-5 mainline instead of the express lanes)
The trip table for regional travel used for the traffic modeling in this study, assumes that the total number of trips does not change with the addition of tolling. Every trip will occur, though the route, time period and/or destination may change for some trips as a result of tolling. The modeling assumptions and processes for modeling pricing would be refined if the project were to move forward, utilizing a more detailed and comprehensive simulation and travel demand analysis of traveler responses to pricing.
The key inputs to the toll feasibility modeling conducted for this study are the assumed toll rates (by time period), vehicle classifications, background network conditions, and information about how people value time. A brief summary of selected input assumptions is provided below.
Pricing Methods and ObjectivesToll rates could vary over the course of the day using either of the following methods:
• Dynamic pricing adjusts tolls every few minutes in response to real-time conditions in the corridor to maintain the volume of traffic arriving at bottleneck locations.
• Variable pricing uses a schedule of tolls that vary at different times of day, but are always the same one day to the next if for travel at the same time period.
The modeling undertaken for a feasibility study such as this is not developed to a level of complexity that would allow testing dynamic tolling with day-to-day variation in travel patterns. Rather, a typical weekday is modeled, testing a series of toll rates at different times of the day to simulate variable pricing. However, the approach undertaken did allow for tolls to increase year-to-year in order to maintain operating objectives in the same manner as would occur with dynamic tolling.

Washington State Department of Transportation 18 | I-5 Express Lanes Toll Feasibility Study
The PSRC regional model provides traffic outputs for five time periods over a typical 24 hour weekday for two forecast years, 2015 (FY 2016) and 2030 (FY 2031). Traffic projections across the five weekday time periods were adjusted to align with the assumed hours of operation — 5 AM to 8 PM — which match the operating hours assumed for the Eastside Corridor Tolling Study.
A toll rate assumption was established for each weekday time period in both model years. For the morning and afternoon peak periods during which congestion is most likely to occur, tolls were set to emphasize revenue generation, which tends to be linked to vehicle throughput levels that allow for free-flow conditions. With growing congestion over time, such tolls may need to escalate at higher rates than general inflation in order to maintain their revenue emphasis and corresponding free-flow vehicle throughput target. It’s important to understand that revenue-emphasizing toll rates were considered for analysis purposes to assess the funding potential of tolling the express lanes. Lower toll rates could result in higher facility throughput and lower diversion to other routes, but would generate less revenue for use on transportation improvements. Future decisions on toll rates and policies will be made by the legislature in consultation with the WSTC.
Figure 3 illustrates a continuum of toll levels and impacts. At the left end, congestion and bottlenecks can occur during peak periods in the absence of tolling. Implementing tolls can help manage demand to reduce congestion and optimize throughput, where combined delay in both the tolled and toll-free lanes is minimized. Higher tolls will further improve flow conditions and travel time savings in the tolled lanes and, up to a point, generate additional revenue. Based on multiple model iterations, peak period tolls were identified for this feasibility study that would emphasize revenue, provide free-flow travel conditions in the Express Lanes, but stop short of the revenue maximizing tolls.
Figure 3Continuum of Toll Rates Between Traffic and Revenue Optimization
What would happen if the tolls were lower?
The tolls analyzed for this study emphasize revenue generation, and would tend to more consistently deliver free-flow conditions.
Lower tolls could also achieve good flow conditions in the Express Lanes while allowing them to serve more vehicles. Furthermore, by reducing toll diversion to the mainline, lower tolls could result in a more balanced, optimal vehicle throughput for the entire I-5 corridor. While the travel time benefits per vehicle for the tolled Express Lanes may be lower, extending those benefits to more vehicles while reducing demand for the mainline could minimize overall I-5 corridor delay.
Throughput optimizing tolls could be as much as 50 percent lower than those used in this study during peak periods. However, lower tolls would reduce the gross and net revenue that could be generated and put to productive use for corridor improvements, or other yet to be identified needs.

I-5 Express Lanes Toll Feasibility Study | 19Washington State Department of Transportation
Toll Rates and EscalationThe following table summarizes the opening year express lane toll rates analyzed for this study, in both current and 2015/FY 2016 year of opening dollars.
Table 1Study Toll Rates
Weekday Periods Travel Direction
Potential Revenue Emphasizing Toll Rate1
Today’s Dollars (2010 / FY 2011)
Opening Year Dollars (2015/FY 2016)
Early Morning (5 - 6 AM) Southbound $1.20 $1.35
Morning Peak Period (6 - 9 AM) Southbound $4.30 $4.85
Midday (9 AM - 3 PM) Both/Reverses2 $1.55 $1.75
Afternoon Peak Period (3 - 6 PM) Northbound $5.50 $6.20
Evening (6 - 8 PM) Northbound $1.20 $1.351 Rates shown are for passenger cars and light trucks; medium and large trucks assumed to pay multiples of
1.5 and 2.0 times these tolls, respectively.2 Note that the Express Lanes would reverse direction from Southbound to Northbound during this period.
The tolls shown above reflect those for a passenger vehicle, which includes all standard two-axle vehicles, motorcycles, and light trucks of less than 10,000 pounds gross vehicle weight. For the purpose of this analysis, base toll multipliers of 1.5x and 2.0x were assumed for medium and heavy trucks, respectively. Medium trucks were assumed to be three axle vehicles and heavy trucks were considered as tractor-trailers with four or more axles.
Toll Rate EscalationFuture general price inflation was assumed to be 2.5 percent per year. In the absence of any traffic growth or other factors affecting travel decisions, I-5 users willingness to pay tolls for the time savings provided by the express lanes would be expected to go up in step with general inflation. This assumption reflects that average wages and household incomes by and large keep pace with general inflation. However, growing demand for travel in the I-5 corridor will cause mainline congestion to worsen, thereby increasing the time savings benefits afforded by the tolled express lanes. Higher time savings benefits will attract more users to the express lanes, and in order to continue to provide those time savings benefits, the toll will have to increase in real terms to keep the express lane throughput relatively constant. Absent such real toll increases, increased demand for the express lanes would cause their performance to degrade.

Washington State Department of Transportation 20 | I-5 Express Lanes Toll Feasibility Study
The modeling work optimized toll rates for the two analysis years, 2015 (FY 2016) and 2030 (FY 2031). Growing traffic congestion over this period yielded real growth in tolls that averaged 1.9 percent per year over this 15 year period prior to considering general inflation. Factoring in general price inflation gives the combined toll escalation in year of collection dollars necessary to calculate revenue. Table 2 below shows the traffic congestion growth and general inflation components of the assumed toll escalation required to maintain the initial revenue emphasis and free-flow objectives of the peak period tolls.
Table 2Toll Rate Escalation Factors
Weekday Periods
Potential Toll Rate Escalation
FY 2016-2031 FY 2032-2045*
Congestion Real Growth Component
Projected Inflation
Component
Overall Toll Rate
Escalation
Overall Toll Rate
Escalation*
Early Morning (5 - 6 AM) 0.0% 2.5% 2.5% 2.5%
Morning Peak Period (6 - 9 AM) 1.6% 2.5% 4.2% 2.5%
Midday (9 AM - 3 PM) 2.7% 2.5% 5.3% 2.5%
Afternoon Peak Period (3 - 6 PM) 1.7% 2.5% 4.2% 2.5%
Evening (6 - 8 PM) 0.0% 2.5% 2.5% 2.5%
* Beyond FY 2031, toll rate escalation is limited to projected inflation at 2.5% per year
Note that the midday period has the highest rate of real toll growth, though it starts from a considerably lower toll. Because the I-5 mainline is already highly congested during the morning and afternoon peak periods today, there is not as much room for overall traffic growth, and thus, increased time savings in the tolled express lanes as there would be in the relatively uncongested midday hours. As corridor traffic grows and spreads into the midday hours, they will become increasingly congested, which will drive up the willingness for some users to pay for the express lanes time savings.
Beyond 2030 (FY 2031), the growth in regional traffic was assumed to diminish to zero. Under this assumption, the revenue emphasis and free-flow objectives of the peak period tolls can would be maintained by tolls keeping pace with inflation; no real increases would be needed.
Gross Revenue ProjectionsDaily revenues are calculated from the PSRC model traffic volumes by period for a typical weekday in 2015 (FY 2016) and 2030 (FY 2031). Because the PSRC model does not predict weekend traffic revenue, modest assumptions were made to allow for weekend days to include 40 percent of the weekday toll traffic and 20 percent of the weekday toll revenue. The smaller share of weekday revenue applied to weekends assumes that weekend tolls would average about one-half those of a weekday, though the time of day patterns would likely be different, with the highest weekend tolls during a the broad midday hours.

I-5 Express Lanes Toll Feasibility Study | 21Washington State Department of Transportation
The annual traffic and gross revenue projections take into account these weekend assumptions. Interpolation between, and extrapolation beyond, the two model forecast years provides a stream of gross revenues from FY 2016 out through FY 2045. The extrapolation of toll revenues beyond FY 2031 is essentially driven from toll escalation in step with inflation; traffic growth and its congestion-induced real growth in toll rates are assumed to fade out.
Two adjustments were then made to the annual traffic and gross toll revenue stream generated by the modeling process. First, a ramp-up adjustment of 85 percent was applied during the first year of operations. This adjustment essentially allows for 15 percent less toll traffic in the first year while the traveling public gets accustomed to the concept, acquires Good To Go! accounts, figures out their best option for travel, etc. A second adjustment involved a 10 percent reduction in traffic in every year to account for non-participants. Non-participants reflect the possibility that a portion of I-5 users may never use the tolled express lanes, due to lack of an account, unfamiliarity with the system and the ability to use photo tolling to pay by mail, or any other reason, and would likely include a relatively high number of non-resident I-5 users.
Operating Deductions and Net Toll Revenue ProjectionsNet revenues, after certain deductions – costs for uncollectible accounts, credit card fees, toll collection O&M, and facility O&M – represent the revenues that would be available to finance an up front capital investment and/or provide for more incremental investments or improvements on a pay-as-you-go basis. These deductions from the annual gross revenues include everything needed to collect tolls, maintain and operate the toll system and the roadway. These expenditures were estimated using several sources, including existing roadway maintenance costs, existing and projected toll collection and equipment vendor costs, as well as WSDOT budget information. A graphic illustrating the process from gross to net revenues is provided in Figure 4.
Figure 4:Financial Analysis Process

Washington State Department of Transportation 22 | I-5 Express Lanes Toll Feasibility Study
Higher Toll Rate to Pay By Mail While most customers would pay for a toll transaction using a Good To Go! account, those without a prepaid account would receive a toll bill in the mail. Customers using the Pay By Mail option would pay a higher toll rate, assumed to be $1.50 higher than the base toll. The $1.50 increment is intended to cover the added cost of billing the customer and collecting tolls due.
The higher Pay By Mail toll revenues are assumed to be net revenue neutral, with the added $1.50 incremental toll rate equal to the incremental costs of mailing and collecting photo toll bills so the same net revenue is generated regardless of payment type.
For the purpose of this feasibility analysis, Good To Go! customers were assumed to comprise 70 percent of the I-5 traveler market during the initial year of operations, with Pay By Mail customers comprising 20 percent, and the aforementioned non-participants comprising the remaining 10 percent of I-5 travelers.
Uncollectible AccountsA small portion of toll revenues will not be collected as a result of a customers’ failure to pay a toll bill, an unreadable transponder or license plate, or invalid registration information. The majority of “revenue leakage” is assumed to be associated with Pay By Mail transactions, which, unlike Good To Go! transactions, are not pre-paid. The revenue leakage associated with Pay By Mail transactions is included in the calculation of the $1.50 Pay By Mail toll rate increment discussed above.
Credit Card FeesIt is assumed that credit and debit cards will be accepted as a valid form of payment. Transactions paid via credit and debit card are assumed to be subject to a vendor processing fee, which is typically a fixed fee plus a percentage of the amount charged. For the purpose of this estimate, it was assumed that the portion of revenue collected via credit/debit card transactions would be subject to a vendor fee of 2.5 percent.
Toll Collection Operations &MaintenanceToll collection O&M costs include the variable costs associated with processing a toll transaction, the state’s fixed oversight and management costs, plus the toll collection equipment O&M and replacement costs.
Toll transactions are assumed to be processed by the statewide customer service center vendor. For the purpose of this analysis, costs were assumed to vary according to the total volume and type (Good To Go! or non-account) of toll transactions. Costs for variable toll collection O&M costs were developed using a transaction-based workflow, which assigns a probability and cost to various transaction outcomes and aggregates those costs into a single estimate.
Fixed state costs include management, accounting/finance, and marketing functions, as well as oversight of the tolling vendor(s). Fixed state costs were estimated using information from the WSDOT Toll Division budget projections for SR 520 operations, scaled down for the I-5 express lanes.

I-5 Express Lanes Toll Feasibility Study | 23Washington State Department of Transportation
Toll collection systems (TCS) operations and maintenance costs include all activities required for continuous, uninterrupted revenue collection. These activities include cleaning/aligning cameras, configuring transponders and transponder antennae, and maintaining data connections to the toll equipment. In addition to routine O&M, costs for periodic replacement of the toll equipment were also included. Both O&M and renovation and rehabilitation costs were based on information from the current TCS vendor contract for the statewide tolling system, as well as cost information from other toll systems across the United States. The estimated costs are based on a single tolling point for the express lanes.
Facility Operations and MaintenanceFacility O&M cost estimates were based on current expenditures in the I-5 express lanes, inflated to year of expenditure values using an assumed inflation rate of 2.5 percent per year. Existing costs were identified using WSDOT’s maintenance accountability process for the portion of the roadway associated with the express lanes.
Operations and Maintenance Reserve AccountThis analysis assumed that gross revenues would contribute to an O&M reserve account that would be established for all facility and toll collection O&M expenditures. This reserve is provided for financing purposes as a buffer, should toll revenues lag behind or fluctuate from planned levels or should unforeseen expenditures be incurred. It was assumed that the O&M reserve account would be funded incrementally, maintaining a balance equal to 50 percent of the total projected O&M expenditures for a given year.
Table 3Summary of Net Toll Revenue Assumptions
Category Assumption
Payment Market Share (FY 2016/FY 2026)
Good To Go!........................................70% / 80%
Pay by Mail……………………………20% / 10%
Non-participant*…………………….10% / 10%
Uncollectible AccountsFY 2016…………………………………………….7%
FY 2026…………………………………………….3%
Credit Card / Banking Fees% of Revenue Paid via Credit Card……90%
Credit Card Fee Rate ……………………….2.5%
Average Customer Service Center (CSC) Cost per Transaction (2015 dollars)
$0.35 per transaction
Annual Facility O&M Costs (2015 dollars) $1.2 million
O&M Reserve AccountContributions made annually to keep reserve fund balance at 50% of annual toll collection and facility O&M expenses.
* Accounted for in the annual gross traffic and revenue projections
Washington State Department of Transportation 24 | I-5 Express Lanes Toll Feasibility Study
Financial Analysis Assumptions
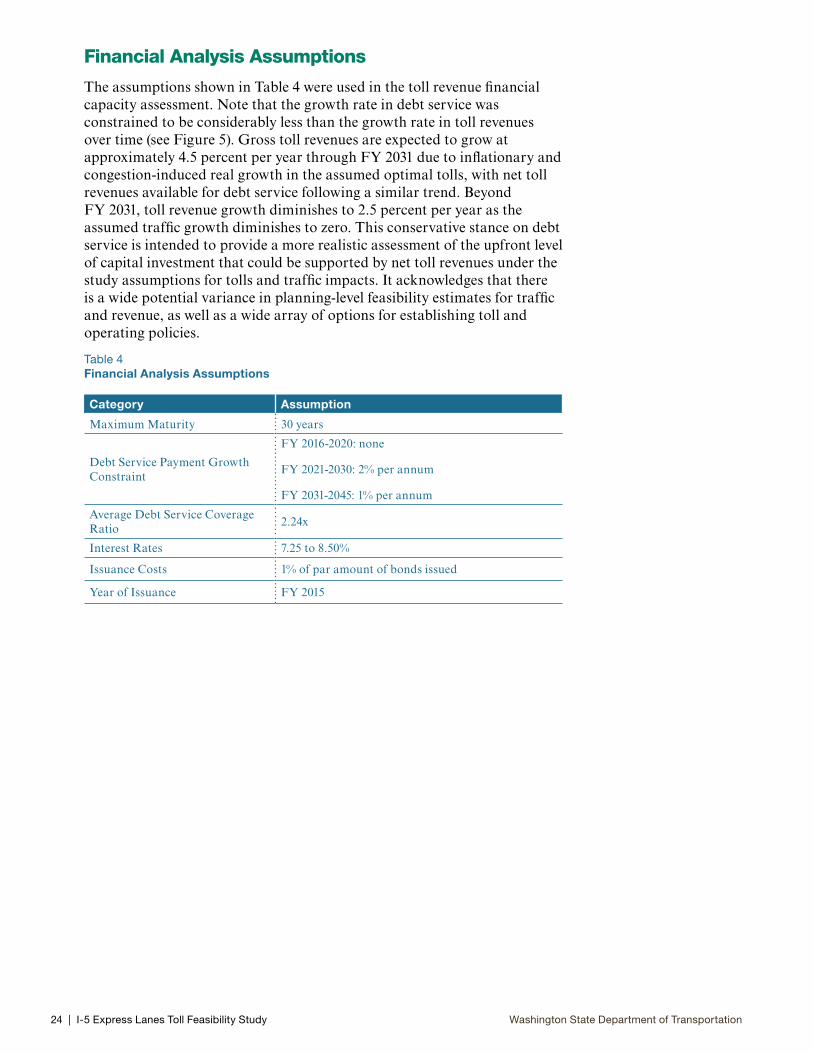
The assumptions shown in Table 4 were used in the toll revenue financial capacity assessment. Note that the growth rate in debt service was constrained to be considerably less than the growth rate in toll revenues over time (see Figure 5). Gross toll revenues are expected to grow at approximately 4.5 percent per year through FY 2031 due to inflationary and congestion-induced real growth in the assumed optimal tolls, with net toll revenues available for debt service following a similar trend. Beyond FY 2031, toll revenue growth diminishes to 2.5 percent per year as the assumed traffic growth diminishes to zero. This conservative stance on debt service is intended to provide a more realistic assessment of the upfront level of capital investment that could be supported by net toll revenues under the study assumptions for tolls and traffic impacts. It acknowledges that there is a wide potential variance in planning-level feasibility estimates for traffic and revenue, as well as a wide array of options for establishing toll and operating policies.
Table 4Financial Analysis Assumptions
Category Assumption
Maximum Maturity 30 years
Debt Service Payment Growth Constraint
FY 2016-2020: none
FY 2021-2030: 2% per annum
FY 2031-2045: 1% per annum
Average Debt Service Coverage Ratio
2.24x
Interest Rates 7.25 to 8.50%
Issuance Costs 1% of par amount of bonds issued
Year of Issuance FY 2015

I-5 Express Lanes Toll Feasibility Study | 25Washington State Department of Transportation
3 FindingsPreliminary Engineering, Capital, and Operating Cost Projections
Key findings: Preliminary engineering and capital costs to toll the express lanes, would be modest and likely total less than one year’s toll revenue.
Preliminary engineering cost estimates are:
• $3 to $4 million environmental analysis and public outreach, depending on the level of analysis required.
• $1.7 million for design.
Capital cost estimates are:
• $11 million for construction (developed following the guidelines in WSDOT’s Cost Estimating Manual for Planning Level Estimates).
Operations and maintenance cost estimates in the initial year of operation (FY 2016) are:
• $3.5 million to collect tolls.
• $0.5 million to maintain on-site toll equipment.
• $1.2 million for roadway O&M.
Traffic and Congestion Impacts
Key findings: Tolling the express lanes would reduce volumes and increase speed and reliability on the express lanes, while slightly increasing volumes and reducing speed and reliability on the parallel mainline lanes. Overall volumes in the corridor would not change significantly, and the project is expected to have little effect on other major regional facilities. These findings do not reflect the possible benefits of corridor improvements or mitigations that could be funded by toll revenues.
Tolling the express lanes would cause some shift in traffic between the mainline lanes and the express lanes. Overall volumes in the corridor would not change significantly. The following results apply to the toll rates analyzed for this feasibility study. The toll rates analyzed are not intended to be a recommendation, and lower toll rates may have equal feasibility with a different distribution of impacts.
• The added volumes on the mainline would result in reduced peak period average speeds of 4 to 5 mph, which would increase motorists travel times by 2.3 to 3.7 minutes in peak periods.
• Express lane drivers passing through downtown Seattle would experience increased speeds in the peak periods of 16 to 17 mph, and save between 5.4 to 6.4 minutes. This is the result of reduced volumes at the bottleneck queues returning to the mainline lanes at each end of the express lanes.

Washington State Department of Transportation 26 | I-5 Express Lanes Toll Feasibility Study
• Drivers traveling to downtown in the express lanes during the morning peak hour would experience speed increases of 7 to 17 mph, saving them 1.6 to 3.8 minutes on average.
• The total number of vehicles crossing the I-5 Ship Canal Bridge is similar between toll free operation and the tolled express lanes option, with a total decrease of about 2,000 vehicles (or less than 1 percent) on a per day basis.
• Removing the HOV restrictions from the downtown Seattle ramps that provide access to and from the express lanes would allow traffic to redistribute itself between the ramps, with the currently restricted ramps seeing higher volumes and the currently unrestricted ramps seeing lower volumes, as illustrated in Table 5.
• Allowing general purpose traffic to use the Pike Street ramp increases peak hour volumes on the ramp by about 66 percent, and daily volumes by about 5,100 vehicles.
• Allowing general purpose traffic to use the Cherry Street/Columbia Street ramp triples peak hour volumes on the ramp and daily volumes by about 9,100 vehicles.
• More work is required in a future operational study to determine the impacts of ramp volume changes on adjacent intersections for both passenger vehicles and buses; and to determine improvements, mitigations or alternative operating concepts that could reduce any negative effects.
• The two unrestricted downtown Seattle ramps, at Mercer and Stewart streets, would see large reductions in both peak hour and daily volumes, as drivers would choose to use more conveniently located ramps. While arterial impacts have not been modeled, these reductions are expected to improve traffic on streets adjacent to these ramps.
• The redistribution of traffic among downtown Seattle ramps would also balance traffic among the lanes in the reversible roadway itself, and reduce the speed differential between lanes.
• Traffic volume in the express lanes would decrease. Crossing the I-5 Ship Canal Bridge, there would be 880 fewer vehicles in the morning peak hour and 1,540 fewer vehicles in the afternoon peak hour. These reductions are in single occupancy vehicles and two person carpools.
• Traffic volume in the mainline would increase. Crossing the I-5 Ship Canal Bridge, there would be 350 more vehicles in the morning peak hour and 610 more vehicles in the afternoon peak hour. These increases are less than the reductions in the express lanes. The reductions can be attributed to drivers diverting to other corridors, modifying their commute times to be out of the peak, switching to transit or 3+ carpools or not making the trip.
• Even though 880 fewer vehicles are expected to travel in the express lanes in the morning peak hour, an increase of 210 person trips is estimated during this time. In the afternoon peak hour, the 1,540 fewer vehicles would represent a reduction of only 580 person trips.

I-5 Express Lanes Toll Feasibility Study | 27Washington State Department of Transportation
Regional Impacts
Tolling of the I-5 express lanes is expected to have little noticeable effect on major regional facilities, except for minor fluctuations to the vehicle volumes in the HOV Lanes on SR 520.
• Some nearby corridors show moderate increases in volume, such as the University Bridge and the SR 99 Aurora Bridge. The analysis showed an average decrease of 2,000 vehicles per weekday on I-5 due to express lanes tolling.
• Travelers’ choices of which facilities and modes to use do not change greatly between the toll-free and tolled options.
Table 5Year 2015 Changes in Modeled I-5 Express Lane Ramp and Screenline Vehicle Volumes Due to Tolling
Change in I-5 Express Lane Downtown Seattle Ramp Volumes
Southbound AM Peak Hour
Northbound PM Peak Hour
RampNo Tolls Volume
Change with Tolls
No Tolls Volume
Change with Tolls
Mercer Ramp 370 -320 950 -890
Stewart Ramp 1,570 -1,260 1,440 -1,130
Pike/Pine Ramp 350 +300 450 +230
Cherry/Columbia Ramp 210 +800 270 +690
Change in Through-trip Volumes (at each end of reversible lanes)
Southbound AM Peak Hour
Northbound PM Peak Hour
ScreenlineNo Tolls Volume
Change with Tolls
No Tolls Volume
Change with Tolls
To/From Mainline at Northgate 3,080 -180 2,380 +650
To/From Mainline at James St. 2,110 -400 2,300 -440

Washington State Department of Transportation 28 | I-5 Express Lanes Toll Feasibility Study
Table 6Year 2015 Change in Traffic and Person Volumes Due to Tolling: I-5 Mainline and Reversible Roadways at the Ship Canal Bridge
Time Period Roadway
Vehicle Volume Person Volume
Without TollChange
with Tolls Without TollChange
with Tolls
AM PeakReversible Roadway 4,600 -880 10,170 +210
Southbound Mainline I-5 7,810 +350 9,160 +420
PM PeakReversible Roadway 5,410 -1,540 11,120 -580
Northbound Mainline I-5 7,800 +610 9,050 +880
Table 7Year 2015 Changes in Average Speed and Travel Time For Typical Trips on I-5 Due to Tolling
Time Period Roadway Segment Change in SpeedChange in
Travel Time
AM Peak (Southbound)
Northgate to Stewart + 17 mph - 3.8 minutes
Northgate to Cherry + 4 mph - 0.8 minutes
Through-trips on Express Lanes + 17 mph - 5.4 minutes
Through-trips on Mainline I-5 - 4 mph - 2.3 minutes
PM Peak (Northbound)
Through-trips on Express Lanes + 17 mph - 6.4 minutes
Through-trips on Mainline I-5 - 5 mph - 3.7 minutes
I-5 Express Lanes Toll Feasibility Study | 29Washington State Department of Transportation
Financial Analysis Results
Key findings: Based on the assumptions used in this feasibility study, tolling the I-5 express lanes could generate funding sufficient to finance capital projects of up to $185 million, as well as excess revenues—starting at $6 million in FY 2017—available for pay-as-you-go-uses.
Toll bond proceeds available for capital investment in FY 2015Based on the revenue-emphasizing toll rates and toll escalation analyzed for this study, along with the aforementioned financing assumptions, annual net toll revenues generated by the express lanes are estimated to finance $185 million in net bond proceeds for capital uses in FY 2015. Due to the low capital costs associated with implementing tolling on the express lanes relative to the projected toll revenues, the project costs of $11 million would be easily covered with additional bonding capacity of $174 million remaining for other purposes.
The costs for environmental documentation, public outreach and preliminary engineering cannot be paid with toll bond proceeds, unlike costs for construction, implementation or capital equipment. The reason for this is that such financing cannot be procured without a commitment to invest in the project that will generate the revenues to repay those bonds.
Excess toll revenues available for annual, pay-as-you-go uses starting FY 2017Excess toll revenues are projected to be generated in each year from debt service on bond coverage, which is the assumed margin or cushion by which net toll revenues need to exceed the debt service payments in order to obtain financing. The excess toll revenue share of net revenues is expected to grow over time if the traffic and revenue projections are met; this is because debt service is assumed to grow more slowly than net revenues. These revenues could provide additional funding for incremental annual investments on a pay-as-you-go basis.
Under the initial projections of this study, net toll revenues available for debt service are projected to grow by more than 5 percent per year, on average, from the period between FY 2021-30, with annual growth diminishing slightly thereafter. Toll rates, and thus net revenues, grow faster than general inflation because increasing traffic congestion on the I-5 mainline over time increases the savings benefits provided by the tolled express lanes.
For purposes of this analysis, debt service growth was limited to 2 percent between FY 2021-31, and 1 percent thereafter in order to maintain a more level debt service profile. A graphic illustrating the estimated net toll revenues and debt service is provided in Figure 5.
The white space in Figure 5 between the debt service bars and the projected net revenue line represents the in excess toll revenues that are assumed to be available for pay-as-you-go uses, with a one-year lag applied since the funds cannot be spent until they are collected. Based on the assumptions

Washington State Department of Transportation 30 | I-5 Express Lanes Toll Feasibility Study
used in this analysis, net revenues in excess of debt service would total up to $6 million in FY 2017. Assuming no change in operating policy that would favor even greater revenue generation, excess net revenues could grow to more than $40 million by FY 2056 (the last year for which revenues are assumed to be used to repay outstanding debt). Beginning in FY 2057 all net revenues would be available for pay-as-you-go uses.
Revenues would cover routine facility O&M costsToll revenues would not only cover the costs associated with toll collection, but are also assumed to provide funds to pay for routine facility operating and maintenance costs that are currently paid for by other state revenues. This would free up those existing state funds for other maintenance uses. Note that this analysis has not assumed that excess toll revenues would be directed to specific major preservation.
Economic considerations for future corridor investmentsThe benefits from project revenues available for transportation uses would depend on how that revenue is used. Project revenues could provide seed money for I-5 capacity improvements in Seattle or build-out of express toll lanes on I-5 between Tacoma and Everett (see Appendix). Project revenues could also address preservation, maintenance and safety backlog in the corridor.
Figure 5: Projected Net Toll Revenues and Debt Service

I-5 Express Lanes Toll Feasibility Study | 31Washington State Department of Transportation
Responses to Proviso Questions
The legislative proviso directed the study to address four specific elements. Preliminary findings in those areas are as follows:
Value Pricing Revenue Generation Potential • Assuming an opening in fiscal year (FY) 2016, tolling the express lanes
would generate up to $22 million of net revenue in FY 2017 (the year after opening).
• Net toll revenue could grow significantly overtime as growth in traffic and congestion increase the time savings provided by the tolled express lanes, the willingness to pay tolls, and thus, the toll rates required to maintain the traffic throughput target.
• The future net revenue from these tolls could finance up to $185 million in capital improvements under the assumed toll rates and escalation, with funding delivered in FY 2015..
• Excess net revenues after paying debt service could be available for other incremental pay-as-you-go uses; these are estimated at $6 million initially in FY 2017 with growth over time.
• Net revenues and any upfront funding contribution that they may provide with toll bond financing, are net of deductions for facility operations and maintenance (O&M) costs, toll collection O&M costs, credit card fees, uncollectible accounts, and, in the case of financing, contributions to a facility O&M reserve fund.
• Because tolls are also assumed to pay for facility O&M (but not major preservation), existing annual maintenance program funds would be available for other uses.
Maximizing Efficient Operation of the Corridor• The pricing approach modeled would improve the speed and reliability
of traffic in the express lanes. The greatest improvement would accrue to traffic passing through Seattle, but downtown trips would also benefit.
• It is expected that value pricing could cause a significant improvement in reliability for those people paying tolls that is not fully captured by the regional travel model.
• The level of benefits accruing to toll paying customers depends on how the express lanes are operated to target vehicle throughput.
- Higher toll rates and lower throughput targets will tend to maximize the travel time savings of the express lanes and promote revenue generation.To ascertain both the revenue potential and user benefits of pricing, this study analyzed higher toll rates.
- Lower toll rates and higher throughput targets, provided that tolls are high enough to help alleviate bottlenecks and congestion, will tend to provide less time savings per toll vehicle, but potentially more system delay reduction by spreading those benefits across more toll paying customers, while also minimizing diversion and congestion impacts to the mainline.

Washington State Department of Transportation 32 | I-5 Express Lanes Toll Feasibility Study
• Approximately 22 percent of daily traffic from the express lanes would shift to the mainline or other routes. This is equivalent to about four percent of total daily I-5 traffic. Approximately three-fourths of the diverted traffic would shift to the I-5 mainline and one-quarter, or less than one percent of the daily traffic on I-5, would change to another route.
• Peak hour through traffic speeds on the reversible lanes would increase by 16 to 17 mph. Traffic speeds for traffic destined to and from the downtown Seattle reversible ramps would increase by 7 to 17 mph. Mainline peak hour speeds in the direction of express lanes flow may be reduced by as much as 4 to 5 mph.
• Bottleneck queues, where the express lanes return to mainline I-5 and where mainline traffic enters the express lanes, would be reduced.
• Eliminating HOV only ramp restrictions on the downtown Seattle ramps would redistribute traffic among those ramps, reducing intersection congestion at the Mercer Street and Stewart Street ramps and increasing congestion at the Cherry Street/Columbia Street and Pike Street ramps. More detailed operational analysis is needed to fully understand these effects.
• Eliminating HOV lane and ramp restrictions and queuing for traffic returning to the mainline roadway would cause traffic and speeds to be more evenly distributed between lanes within the express lanes, especially in the southbound direction.
• Travel time improvements in the express lanes would also improve transit travel times. However, traffic redistribution on the downtown ramps could affect transit in a variety of positive and negative ways that need to be investigated further.
Economic Considerations for Future Corridor Investments• The project would provide revenue that would be available for
transportation uses.
• The benefits would depend on how revenues are used.
- Toll revenues could be leveraged for any I-5 transportation capital improvement, such as increased capacity through Seattle or corridor build-out of the I-5 express toll lanes (See Appendix).
- Toll revenues could address preservation, maintenance and safety backlog in the corridor.
Regional Transportation System Impacts• Modeling shows no significant impact on other major regional facilities.
• Some nearby corridors show moderate increases in volume, such as the University Bridge and the SR 99 Aurora Bridge.
I-5 approaching the Ship Canal Bridge

I-5 Express Lanes Toll Feasibility Study | 33Washington State Department of Transportation
4 Next Steps If the legislature wishes to move ahead on tolling the I-5 express lanes, several steps, staged over at least three years, would be needed before tolling could begin. In the first and potentially the second year, the project would be developed, assessed and presented for public comment prior to returning to the legislature to request toll authority. The following steps would be needed, initially estimated to cost approximately $5 million in total:
1. Define the proposal: Before environmental analysis and public outreach can be conducted, it will be important to define how toll revenues would be used in order to understand the full benefits and impacts. Research has shown that tolls may be accepted by the public, but only if the benefits are understood and the use of revenues is addressed. The legislature could propose tolling without identifying specific associated improvements, but in that case some indication about generally how revenues would be applied would be needed before discussing the project with the public. Note that the cost and schedule to prepare environmental analysis and project design will depend on how the total project is defined including funded improvements.
2. Develop and refine the proposal: The physical improvements associated with the defined project need to be brought to a preliminary level of engineering to better understand the impacts. More intensive transportation modeling is needed, including traffic simulation modeling, to answer key design and toll concept questions and to better understand detailed transportation system and diversion effects. Some key questions that need to be addressed at this step include:
• Whatareneteffectsoftollsandwhatassociatedimprovements are proposed?
• Whatchangesshouldbemadetoreduceormitigatetolldiversionorimpacts at ramps?

Washington State Department of Transportation 34 | I-5 Express Lanes Toll Feasibility Study
3. Prepare the tolling concept of operations: Identify how tolls will be assessed, and in consultation with the WSTC, answer key policy issues that will affect toll system design and revenue analysis.
Some key questions that need to be addressed at this step include:
• Whatdiscountsorexemptionsshouldapplytocarpoolsor other vehicles?
• Willpricingbeonafixeddailyscheduleoradjusteddynamicallyin real time?
• ShouldsomerampsretainHOVonlyrestrictions?
• Shouldthepricevaryfordifferentdowntownramps,ortoreturntotheI-5 mainline?
• Howwilltollsandcarpooldiscountsorexemptionsbeenforced?
• WhatpricingwillapplytousersenteringandexitingSR520usingtheplanned future direct access ramp?
4. Prepare environmental studies: Prepare an environmental analysis or impact statement to disclose the benefits and effects of the complete proposal. The scope of this effort will depend on what the proposed associated improvements are, but will include at a minimum transportation and environmental justice analyses.
5. Conduct more detailed (level 2 or 3) financial analysis: Before requesting toll authority for the I-5 express lanes, a more detailed financial assessment is needed based on a refined transportation modeling and toll concept. If a bond sale is contemplated immediately, then a level 3 financial grade traffic and revenue study is needed, however the perceived risk to bondholders will be lower if at least two years of operating experience has been documented, in which case a level 3 analysis could occur after tolling begins.
6. Conduct public outreach program: Similar to the 520 Toll Implementation Committee effort, a substantial public outreach program would be required to engage elected officials, jurisdictions, businesses, stakeholder groups and the public and to report findings to the legislature. Significant coordination with the city of Seattle would be needed to understand and avoid or mitigate impacts to downtown Seattle ramps.
If and when legislation is passed granting WSDOT authority to toll the I-5 express lanes, the following additional steps would be needed to implement tolls, initially estimated to cost $11 million:
7. Request federal toll authority: A formal request is needed to the FHWA that complies with existing or reauthorized federal statutes. Under current law tolling is prohibited on Interstate highways except under specific circumstances and program authorities.
8. Prepare and issue toll system procurement: To implement a tolling program on the I-5 express lanes, vendor procurement is needed to design, install, operate and maintain toll collection equipment and to pass toll transaction data to the statewide customer service vendor.

I-5 Express Lanes Toll Feasibility Study | A-1Washington State Department of Transportation
Appendix: I-5 Express Lane System Pre-Design Study
Background
In 2009, the Federal Value Pricing Pilot Program awarded WSDOT $1.28 million to study the design and implementation of a regional network of dynamically priced express toll lanes along various corridors in the Puget Sound Region through the Express Lane System Pre-Design Project. These express toll lanes would replace and in some cases expand the existing HOV lane system. Project elements mentioned in the award include evaluating the combination of pricing and access controls needed to achieve facilities that are reliable and fast, but also efficiently utilized.
As noted in the legislative proviso, this feasibility report was funded using federal grant funds awarded to complete a value pricing project titled The Express Lane System Pre-Design Project. This Appendix describes the broader project, of which the I-5 Express Lanes Feasibility Study was a part, and provides some early indication of its likely findings. The final report is due in early 2012.
Project Objectives
The Express Lanes Pre-Design project will define the steps needed, costs involved, and policy implications of evolving the Puget Sound express and HOV lanes into a dynamically priced express toll lane system that meets WSDOT’s HOV system objectives while also providing a reliable option for other paying customers when they most need a fast and reliable trip.
The project has three primary objectives:
• define the express toll lane concept, system architecture, and proposed policy framework
• identify physical improvements needed to implement the concept on I-5, and their costs
• identify potential revenues and staging to implement the system using toll revenues
This project does not include public outreach; it is intended to develop a coherent system concept prior to engaging the public and policymakers. A coordinating committee made up of internal stakeholders and outside agency representatives is meeting regularly to guide the process.

Washington State Department of Transportation A-2 | I-5 Express Lanes Toll Feasibility Study
Why consider changing HOV lanes into Express Toll Lanes?The HOV lane system has improved transit speeds and carpool use in the Puget Sound Region, but in many corridors those benefits are being degraded due to over-use. HOV lanes throughout the region have failed to meet federal and state speed and reliability standards, consequently limiting growth of transit use and person-throughput in these corridors.
WSDOT is exploring the potential of converting existing HOV lanes into a system of express toll lanes that would provide a reliable speed advantage to transit and 3-person carpools as well as to other users willing to pay for a higher level of service. Alternative approaches to providing incentives to carpool are also under study. In some cases a second express toll lane would be added to allow passing within express toll lane facilities, and to increase capacity for the express lane users. New express toll lane capacity would reduce congestion for all highway users, whether they use the express toll lanes or not.
An express toll lane system to replace existing HOV lanes is included in WSDOT’s Moving Washington program, and in the Puget Sound Regional Council’s Transportation 2040 plan.
Proposed objectives for an express toll lane system include to:
• Move more people and goods in congested freeway corridors. Manage traffic to provide safe and sustainable performance, and provide price incentives to promote higher vehicle occupancy.
• Provide value to express lane customers. Provide faster speeds and more reliable trip times for express lane customers. Implement tolling practices to provide a consistent customer experience throughout the state.
• Provide funding for critical transportation improvements. Apply revenues to fund identified transportation needs.
• Improve multi-modal transportation systems. Give priority to accommodating fast and reliable bus services, and provide opportunities to meet freight needs to the extent that safety and performance can be maintained.

I-5 Express Lanes Toll Feasibility Study | A-3Washington State Department of Transportation
An express toll lane system for I-5
WSDOT is midway through a planning study to identify a potential express toll lane concept for I-5. If this program was implemented, the I-5 express lanes addressed in this feasibility study would be incorporated into the express toll lanes system, and initial tolling on the reversible lanes would provide seed funds to build out the rest of the system.
Extent of an express toll lane systemTo determine the limits of a potential express toll lane system on I-5, a preliminary assessment was conducted comparing the relative portion of total cost and revenues attributable to each segment between Dupont and SR 531 in Arlington. The results showed that the segments south of SR 16 in Tacoma and north of US 2 in Everett produced only a fraction of the revenue that other segments did but required a relatively large investment because these sections do not currently have HOV lanes that can be converted to tolled lanes. Therefore, these two segments were further from further analysis.
Illustrating the conceptMore work is needed before recommendations can be provided for each segment of I-5. However, to provide an illustration of how the express toll lane concept might work, an initial best guess on how the system could be configured has been prepared for this analysis shown in Figure A-1. This best guess is intended to illustrate how tolling the I-5 express lanes could contribute to a broader implementation of express toll lanes throughout the corridor. Capacity improvements to mainline I-5 in downtown Seattle are also described, which will also address impacts from tolls on the express lanes.
405
Puget Sound
Snohomish County
King County
Pierce County
Shoreline
Lynnwood
RedmondKirkland
Bothell
Bellevue
Issaquah
Kent
Renton
FederalWay
Auburn
Everett
Marysville
Smokey Point
Northgate
Seattle
Bremerton
BainbridgeIsland
Tacoma
Puyallup
Fife
Lakewood
Dupont
5
5
5
99
161
99
16716
512
18
167509
516
520
90
405
999
531
2
Single full time lane
Dual dynamic lane
Dual full time lane
Reversible lanes
Deferred lanes
LEGEND
Figure A-1:Illustrative 1-5 Express Toll Lane System

Washington State Department of Transportation A-4 | I-5 Express Lanes Toll Feasibility Study
Aside from better reliability and throughput for HOV users, the system plan described below could add new capacity benefits to three primary user groups:
• Snohomish County to Seattle travelers. The system described would add a second express lane, in the direction the reversible lanes operate, providing more capacity in the commute direction between Northgate and Lynnwood or points north.
• Trips through downtown Seattle. A third northbound lane would be provided on mainline I-5 through the bottleneck at Seneca Street, and a transit shoulder lane would be provided between Olive Way and SR 520. These two projects would add new capacity on mainline I-5, reducing the impact of traffic diverted by tolling the reversible roadway. One lane on the reversible roadway would be separated from the others and would operate southbound at all times from NE 65th Street to downtown to relieve congestion southbound at the I-5 Ship Canal Bridge, addressing a significant problem that occurs 7 days a week. (The feasibility of this concept is being assessed).
• South King and North Pierce County travelers. An additional express toll lane would be built in each direction between Tacoma and Tukwila. While not modeled as part of this project, toll revenues from this segment could contribute to completion of corridor extension projects on SR 509 and SR 167.

I-5 Express Lanes Toll Feasibility Study | A-5Washington State Department of Transportation
Figure A-2: Phasing Plan Assumed for Financial Analysis
Puget Sound
Snohomish County
King County
Lynnwood
Everett
Seattle
Tacoma
5
5
5
16
167
520
90
405
LEGEND
Phase 1
Phase 2
Phase 3
For the financial analysis, three implementation phases were assumed, illustrated in Figure A-2:
• Phase 1:
Implement tolling on the express lanes, with a capital cost of $13 million (inflated to the year of expenditure).
• Phase 2:
Convert HOV lanes between Tacoma and Everett to express toll lanes. Add a second peak-direction only express toll lane (shown as a dotted line in figure to denote part-time 2-lane operation) between Northgate and Lynnwood. Install active traffic management from SR 16 in Tacoma to US 2 in Everett, with a capital cost of $675 million (inflated to the year of expenditure).
• Phase 3:
Add a second express toll lane in each direction between Tacoma and Tukwila, with a capital cost of $501 million (inflated to the year of expenditure).
Phasing Plan and Cost Projections
For illustrative purposes, a scenario has been prepared to implement an express toll lane system in phases, funded by toll revenues from previous phases. The first phase would be to toll the reversible express lane facility as described in the body of this report. The phasing plan is an input to the financial analysis, which will show how revenues from each phase can provide financing for the phases that follow.

Washington State Department of Transportation A-6 | I-5 Express Lanes Toll Feasibility Study
Capital Cost EstimatesFor this feasibility level analysis, capital costs were estimated in current dollars, then inflated to year of expenditure (YOE) dollars and spread evenly across the years within each construction phase. Inflation was assumed to be 2.5 percent per year. As illustrated in Figure A-3, the total Phase 2 costs of $674 million (YOE) have been distributed evenly across the four years of construction in that phase, so the total cost in each year is approximately $169 million. Costs in each year of Phase 3 amount to approximately $125 million.
It is not anticipated that capital costs will be evenly distributed as shown below; however, lacking a more comprehensive cost estimate, and for this planning-level estimate, a detailed analysis of the capital construction costs was not merited, nor would it have significantly changed the financial analysis results.
Figure A-3Estimated Capital Costs by Phase and Fiscal Year (YOE)
0
$20
$40
$60
$80
$100
$120
$140
$160
$180
$200
FY 2026FY 2025FY 2024FY 2023FY 2022FY 2021FY 2020FY 2019FY 2018FY 2017FY 2016FY 2015
dollars in millions (YOE)
Preliminary Engineering
Construction
Phase 1 Total: $13 MPhase 2 Total: $675 MPhase 3 Total: $501 MProject Total (YOE): $1,189 M
Phase 1
Phase 2
Phase 3

I-5 Express Lanes Toll Feasibility Study | A-7Washington State Department of Transportation
Operational and Financial Analysis Assumptions and Approach
This analysis of the full I-5 express toll lanes system was conducted using an approach similar to the express lanes study, and the financial and operational assumptions are generally consistent with those used to evaluate the express lanes, with a few exceptions noted below:
• Medium and heavy trucks would be prohibited from using the Express Toll Lanes except in the reversible roadway.
• A contra-flow lane would be operated in the reversible roadway beginning in FY 2020 as part of the Phase 2 capital improvements.
• Facility and toll collection O&M expenses would be scaled up to reflect the larger system and higher number of toll transactions, but the estimate methodology would remain consistent.
• A ramp-up adjustment of 85 percent would be applied to the first year of each new phase of traffic and revenue, or FY 2016, FY 2020, and FY 2026 (opening of phases 1, 2, and 3, respectively).
Overall, the approach of this analysis is consistent with the framework of other recent WSDOT toll studies, including the SR 520 Program, I-405 Express Toll Lanes, and SR 99 Alaskan Way Viaduct Replacement.
Initial Financial Analysis Results
Key finding: Based on the revenue-emphasizing toll rate and escalation assumptions used in this feasibility study, implementing the I-5 Express Toll Lane system could generate a net revenue stream that could support financing (toll bond proceeds) sufficient to fund capital projects of up to $745 million, plus generate excess toll revenues—starting at $11 million in FY 2021— that would be available for incremental, pay-as-you-go uses.
Toll bond proceeds available for capital investmentsImplementing the express toll lanes on I-5 would generate funding to cover up to nearly 70 percent of total construction costs across all three phases of the project. Of this amount, the Phase 1 express lane tolling conversion construction costs would be fully funded up to 55 percent of the Phase 2 construction would be funded, and up to 90 percent of Phase 3 construction could be funded. Despite the funding gap identified for Phase 2 construction, this analysis assumed that other funding would be available to complete construction in order to implement Phase 3 and gain the benefit of the increased financial capacity of Phase 3 toll funding. If additional funding outside of toll revenues did not become available to complete Phase 2, toll funding would not be available for the subsequent construction of Phase 3.

Washington State Department of Transportation A-8 | I-5 Express Lanes Toll Feasibility Study
Excess toll revenues available for annual, pay-as-you-go usesExcess toll revenues are projected to be generated in each year from debt service coverage, which is the assumed margin or cushion by which net toll revenues need to exceed the debt service payments in order to obtain financing. The excess toll revenue share of net revenues is expected to grow over time if the traffic and revenue projections are met; this is because debt service is assumed to grow more slowly than net revenues. These revenues could provide additional funding for incremental annual investments on a pay-as-you-go basis.
Under the initial projections of this study, net toll revenues available for debt service are projected to grow in excess of 6 percent per year, on average, for the period between FY 2021-30, and more than 3 percent thereafter. However, for the purpose of this analysis, debt service growth was limited to 2 percent between FY 2021-31, and 1 percent thereafter in order to maintain a more level debt service profile. This growth limit was applied to the revenues within a given phase of construction, so limits were not applied to revenues resulting from added phases (i.e. the revenue step exhibited with completion of each major construction phase). A graphic illustrating the estimated net toll revenues and debt service is provided in Figure A-4.
The white space between the debt service bars and the projected net revenue line in Figure A-5 represents the net toll revenues in excess of debt service that are assumed to be available for pay-as-you-go uses, with a one-year lag applied (the funds cannot be spent until they have been collected). Based on the assumptions used in this analysis, net revenues in excess of debt service would total up to $11 million in FY 2021. Absent a change in operating policy that would favor revenue generation, excess net revenues could grow to nearly by $320 million by FY 2055 (the last year for which net revenues are assumed be used to repay outstanding debt service). Beginning in FY 2056, all net revenues would be available for pay-as-you-go uses.

I-5 Express Lanes Toll Feasibility Study | A-9Washington State Department of Transportation
Revenues would cover routine facility O&M operations and maintenanceToll revenues would not only cover the costs associated with toll collection, but would also provide funds to pay for routine facility operating and maintenance costs currently paid for by other state revenues. This would free up those existing funds for maintenance other uses. Note that this analysis has not assumed that excess toll revenues would be directed to specific major preservation, renovation or rehabilitation projects.
Figure A-4: Projected Net Toll Revenues and Debt Service

Washington State Department of Transportation A-10 | I-5 Express Lanes Toll Feasibility Study
Next Steps
The Express Lanes System Pre-Design Project is midway through its course, and its final project report is due in early 2012.
Several steps would be needed concurrently to advance the express toll lane concept on I-5:
• Policy Concurrence and Detailed Concept of Operations: Key policy decisions about pricing approach, technology choices, carpool incentives and design guidance are needed to inform design and operation analysis. Policies would be proposed by WSDOT in consultation with the WSTC and subject to public comment. A detailed concept of operations is needed to guide design activities.
• Project Development: Additional work is needed to develop preliminary designs and cost estimates for each roadway segment and to confirm the feasibility of program elements where questions remain, particularly for projects considered for early implementation stages.
• Traffic and Revenue Assessment and Program Development: A more detailed (level 2) traffic and revenue analysis is needed to refine revenue estimates based on an operational model. Alternative staging plans will assess whether bond financing or pay-as-you-go financing methods are appropriate, and describe which projects can be completed within the defined period addressed in an environmental analysis.
• Environmental Analysis and Public Outreach: A programmatic assessment of program benefits and environmental impacts will be required for the full corridor. A significant public outreach program will be required in advance of requesting toll authority from both the legislature and the FHWA. Public outreach would address both the proposed improvement program as well as proposed policies that would guide to its operation.