i. bank presidents and the regional - the federal reserve
TRANSCRIPT

Economist, Federal Reserve Bank ofBoston. The author zoishes to thankRichard Kopcke and Stephen McNeesfor all their comments. Valuable re-search assistance was provided byJeffrey B. Liebman.
l ’t is often argued that the institutional structure of the FederalReserve System influences the formulation and attainment of na-
.tional monetary policy goals. Havrilesky (1987, 1990), Havrileskyand Gildea (1990), and Belden (1989), for example, assert that Presiden-tial appointment of members of the Board of Governors producesmonetary policy sensitive to current political conditions. Conversely,the same literature, going back to Clifford (1965), also maintains that thepower and independence of District Bank presidents remove them fromaccountability. As a result, some describe the Bank presidents as "tooconservative," while others depict them as too sensitive to regionaleconomic conditions. The first of these descriptions of Bank presidentbehavior is examined in Tootell (1990b). The latter characterization isinvestigated here: does the decentralization of the Federal ReserveSystem (Fed) produce national monetary policy overly responsive toregional performance? This article quantifies the influence of regionalconditions on District Bank voting by analyzing the monetary policyactually advocated by individual members of the Federal Open MarketCommittee (FOMC). The results indicate that District Bank presidentsset policy dependent on national, not their regional, conditions.
District Bank presidents do play a major role in the formulation otmonetary policy. The Federal Reserve Bank of New York always has oneof the twelve votes at the policy-making FOMC meetings, and four ofthe remaining eleven votes rotate among the other Bank presidents. Theenfranchisement of the Bank presidents is historical, perhaps an attemptto allay regional fears that monetary policy would accommodate theinterests of the money center banks, although this article will suggestother reasons why the regional structure endures. Empowering regionalinstitutions, however, could breed internecine squabbling at FOMCpolicy meetings. Whenever significant deviation between local andnational interests occurs, or, in other words, when large variation existsin the economic performance of different regions, the potential for

regional conflict at the FOMC exists. Tootell (1990a)and Rosengren (1990) reveal the extent of the dispar-ity in regional economic performance. The imperfectcorrelations between regional and national conditionspermit an exploration of whether local interests playa disproportionately important role in the determina-tion of Bank presidents’ FOMC voting.
This article tests whether regional economic per-formance excessively influences the votes of Districtpresidents. To explore the issue effectively, section Icontains detailed analysis of why Bank presidentsmight vote on the basis of regional economic condi-tions. Because the empirical issues are complicated, amodel of FOMC member behavior is carefully articu-lated. Section II discusses why the data-used and themethodology chosen best examine the policy inten-tions of the FOMC. Section III presents the evidenceconcerning the effect of regional economic conditionson Bank president voting. A variety of tests cons.is-tently’rejects the hypothesis that regional economicperformance determines District policy-making. Infact, the results may highlight certain benefits to thecurrent FOMC structure. A conclusion is provided insection IV.
I. Bank Presidents and the RegionalEconomy
Economic theory advises that regional economicconditions should have no effect on national policyindependent of their impact on national perfor-mance. It is inefficient to use a national instrument,such as monetary policy, solely to influence regionaleconomic performance. As an example, assume thatreal income in Region A declines while the rest of thecountry is fully employed. If the Fed eases policy,income may rise in A, but national inflation increases.Using a national instrument to affect a local target islike shooting a fly with a howitzer; one may be rid ofthe insect, but the collateral damage can be extensive.Employing a tool with less general effects, like agovernment works project in that area, would raiseRegion A’s output without producing economywideinflation. Efficient use of policy, therefore, dictatesthat regional data should not affect Bank presidentFOMC votes outside of their influence on the nationalnumbers. The national data correctly weight theimportance of the regional variables in the economy-wide objectives of monetary policy, and thus, thevotes of Bank presidents should only depend on thenational figures.
A simple economic model can be applied toanalyze the choices the FOMC makes. Since severalsubtle but important characteristics of this modelwill be highlighted, care is given to its exposition.All FOMC members are assumed to maximize theirutility,
Max u(QE, I~E), (1)MP
by selecting the optimal monetary policy, MP, subjectto two constraints,
QE, 15E = fl(MPt, (2)
and
MP = f2(Institutional Constraints), (3)
where QE is the expected growth in real activity, ~E isexpected inflation, and f~t represents all the informa-tion possessed by the FOMC member at the timepolicy is determined. Utility is assumed to be afunction of the policymaker’s expectation of outputgrowth and inflation; it depends on the expectationsof these variables since monetary policy affects fu-ture, not current, conditions.1 If other variables are ofconcern to the policymaker, they can also be includedin the utility function. FOMC members choose themonetary policy that makes them as well-off aspossible.
However, two constraints affect their policy se-lection. Equation 2 describes how the policymakerformulates his or her expectations of the goals. Theexpectations of output growth and inflation are theFOMC member’s best forecasts of these variablesgiven both the information they possess at the timeand the monetary policy they initiate. The fl functiontranslates MPt and f~t into these best estimates. Inessence, fl is the policymaker’s model of the econ-omy; it transforms the values of known economicvariables, such as the money supply, interest rates,wages, fiscal policy, and the like, into future inflationand output growth. In fact, this model may differamong FOMC members; for a given monetary policy,two different policymakers with identical informationsets can expect different values of future inflation andoutput growth if they possess different f~s.
The second constraint represents the institutionalfactors that may limit policymakers’ choices. For exam-ple, political pressures might affect FOMC votes. Eitherthe Congress, which created the Federal Reserve Sys-tem, or the Administration, which appoints Boardgovernors, could influence the behavior of the FOMC.
4 March/April 1991 New England Economic Review

Equation 3 introduces potential institutional costs toselecting the monetary policy that the FOMC findsoptimal when equation 2 is the only constraint.
Although theory suggests that Bank presidentsshould not set policy contingent on regional eco-nomic conditions independent of their effect on na-tional performance, the above paradigm illustratesthree broad explanations for why they might. Bankpresidents may care disproportionately about re-gional economic performance, thus injecting regionalvariables into their utility functions. Alternatively,the information sets, or the models, of the Bankpresidents may be overly weighted toward regionalvariables. And finally, equation 3 emphasizes thatBank presidents may have institutional constraints ontheir behavior that could depend on regional condi-tions. Each explanation is discussed in detail below.Note, however, that the same methodology could beused to analyze Board governors. Regional variableswould probably not be relevant in that case, butdifferent models, fls, or institutional constraintsmight be important.
The procedure for appointment of District Bankpresidents, as well as other aspects of the institu-tional structure of the regional Banks, could producea constraint, represented by equation 3 in the abovemodel, that binds District presidents to vote based onregional conditions. The Board of Directors of theDistrict Bm~k plays an important role in selecting theBank’s president, even though the Board of Governorsmust approve the nominations. Furthermore, the Di-rectors, in conjunction with the Board, also determinethe president’s salary. In fact, they also recommendchanges in the discount rate. Although Bank presidentshave considerable latitude in their FOMC voting, theywish to maintain good relations with their local Board.The Board of Directors consists of three local bankers,three local businessmen, and three other citizens. Theirinterests are generally more closely connected to re-gional economic conditions than to national perform-ance.2 It is, therefore, easy to conceive of the regionalconcerns of the Directors influencing the president’schoice of monetary policy. If the District Boards do careinordinately about the local economy and Bank presi-dents’ obligations to their District Boards do produce adifferent opportunity set, District presidents might votedependent on regional economic performance.
On the other hand, Bank president utility func-tions could contain expectations of regional activity aswell as the national goals included in equation 1.These utility functions may be skewed towardregional conditions because the directors who nomi-
nate Bank presidents might be biased toward in-dividuals with such concerns. A prerequisite fornomination might be that one care disproportionatelyabout local economic performance. Perhaps a moreintuitive explanatio~ for excessive regional concerns,however, relies on the local nature of the experiencesand relationships of the Bank presidents. Their con-tinual contact with the local community could makethem overly sympathetic to their region’s predic-
If presidents" votes are excessivelysensitive to regional performance,the resulting monetary policy is
suboptimal.
ament.3 If presidents’ votes are excessively sensitiveto regional performance, because of differences intheir constraint sets or utility functions, the resultingmonetary policy is suboptimal.
Finally, regional variables may influence DistrictBank votes because their information sets or theirmodels include a large share of regional data. Infor-mation sets and models are examined together be-cause the two are so difficult to disentangle. Theimportance of the f~t can best be illustrated by exam-ining the behavior of Bank presidents in relation toBoard governors. Assume each District president hasan information set before the FOMC meeting thatdiffers from the information sets of the other presi-dents and that of the Board governors. Bank presi-dents could-conceivably possess superior informationon their regional economy because of both theirknowledge of variables that are not aggregated intonational figures and the lags that occur in datacollection and aggregation. Conversely, Board gover-nors could be more closely in tune with the nationalnumbers since the large Board staff meticulouslycompiles and analyzes these data. If the two groupsshare information perfectly during the FOMC meet-ing and they possess identical models, fls, they willhave the same expectations of output growth andinflation. Identical information sets, along with thesame models and tastes, would produce identical votes.However, if they imperfectly share information, theirvotes could diverge even though their goals and con-straints are identical. Monetary policy is ineffident, but
MarchlApril 1991 New England Economic Review 5
the root of the problem is the imperfectly shared infor-mation.
Not only might all FOMC members not possessthe same information, they also need not possessthe same model. In fact, certain District Banks areassociated with certain paradigms. These variousmodels, or fl functions, may emphasize differentpieces of information and produce different expecta-tions of the same goals. One would think, however,in the long run, different models could not be asource of divergent votes. If, for example, one re-gional Bank’s model is a superior predictor of futureGNP growth and inflation, then the FOMC shouldeventually recognize and share it. That model wouldthen be vital to all FOMC members, and their fore-casts would tend to converge.4 Furthermore, anyreliance of a Bank model upon a regional indicatorbeyond its ability to predict national performancewould be inefficient. If regional economic deve!gp-menf~ do not help forecast the variables of interest tothe Fed, or the FOMC members do not believe thatthey do, then these variables would have to beincluded in the utility functions of the Bank presi-dents in order to be significant in determining FOMCvotes. Utilizing the model outlined in equations 1 to3, the following two sections scrutinize the data toexamine whether regional variables do influenceBank presidents’ voting.
II. The Data and MethodologyExamining FOMC votes is both the only way to
separate the monetary policy intentions of Boardgovernors from those of Bank presidents, necessarywhen testing the effect of regional variables, and thesuperior method to analyze the determinants of thatpolicy. The traditional reaction function literature, inMcNees (1986), Havrilesky (1987), and Alesina andSachs (1988), for example, measures the response ofan assumed Fed intermediate target, such as thefederal funds rate or the money supply, to assortedvariables, like the growth rate of real GNP and therate of inflation. Yet, using the movement of anassumed Fed intermediate target to proxy for theintentions of monetary policy not only fails to distin-guish between the policy advocated by regional Bankpresidents and Board governors but also createsserious problems in interpreting policy intentions.
In the context of the model outlined in section I,this methodology would substitute equation 3’ for 3,as monetary policy intentions are not directly mea-
sured but only approximated by the behavior of anassumed intermediate target, It.
It = f3(structural equations, institutional
constraints, shocks ....). (3’)
In the original model, changes in monetary policywere due to shifts in tastes or constraints. As dis-cussed in Abrams, Froyen, and Waud (1980), unex-pected movements in the Fed’s intermediate targetcan, however, occur for reasons not associated withthe variables of concern to the Fed. Because the"structural equations" for this instrument canchange, one cannot be certain that monetary policyhas shifted when the intermediate target that proxiesfor monetary policy intentions moves. The value ofthe intermediate target can change without a changein monetary policy intentions, and monetary policycan shift without movement in It.
An example best illustrates this side effect ofusing an intermediate target as a yardstick of mone-tary policy. Assume It is the money supply. Ananticipated and accommodated movement in moneydemand unrelated to the variables of concern to theFed will alter the money supply without changingFed intentions. This shock affects It through the f3function in equation 3’, yet monetary policy remainsconstant. The traditional reaction function analysis
Examining FOMC votes is boththe only way to separate themonetary policy intentions ofBoard governors from those of
Bank presidents and the superiormethod to analyze the
determinants of member votes.
interprets the change in money supply as eitherexpansionary or contractionary monetary policy. Infact, during the 1970s and early 1980s institutionalchanges in banking caused unexpected movementsin money realizations,s Since the relationship be-tween the level of the instrument and the course ofmonetary policy is, in reality, unstable, the method-ology represented by (3’) makes impossible any in-vestigation of monetary policy intentions, as well as
6 March/April 1991 New England Economic Review

any attempt to disentangle the various roles con-straints and tastes play in the formation of monetarypolicy.
The measure of the intention of monetary policyused in this paper does not suffer from the problemsencountered by the intermediate target proxy. Theactual vote of each member of the FOMC, whetherfor policy loosening, tightening, or no change, isrecorded in the policy directives issued six weeksafter every FOMC meeting. In these directives,FOMC members clearly discuss their votes in thecontext of their goals, and, in fact, the directives arefairly clear about when policy and intermediate tar-gets diverge. FOMC votes, therefore, allow the sep-aration of the movement in the intermediate_~targetfrom the monetary policy intentions of each memberof the FOMC. For this reason, the goals in equation 1,QE and 1~E, do not include any intermediate targets.Money, for example, is absent from the utility func-tion in equation 1 even though many are "con-cerned" about it, because it is only an instrument toattain the goals of high GNP growth and price levelstability. Counting the votes that dictate the directionof policy, not the movement of some intermediatetarget of the Fed’s, winnows out most of the struc-tural fluctuations unrelated to changes in policyintentions.6
Furthermore, directly measuring the vote~ of theFOMC members avoids the problem of decidingwhich intermediate target the Fed is using. If theincorrect target is examined, then no inferences aboutthe direction of monetary policy are possible, nomatter how stable the tool. This issue is discussed indetail in Luckett and Ports (1978, 1980) and Tootell/1990b). Since FOMC votes indicate the direction ofpolicy, not which tool is used to accomplish thatdirective, this methodology circumvents another dif-ficulty found in the traditional literature.
Accordingly, this article investigates the effect ofcurrent and expected economic conditions on FOMCvoting by estimating the influence of certain explan-atory variables, many examined in the traditionalreaction function literature, on the probability ofvoting for tightening, loosening, or no change inpolicy.7 The ability to distinguish between the votesof Bank presidents and Board governors also allowsan examination of whether regional variables affectthe probability of District presidents voting for certainpolicies. The regional indicators used here are eco-nomic data for each Fed district. If these variablessignificantly affect the votes of the District Bankpresidents, then regional variables are influencing
their monetary policy, whether because of differentconstraints or different utility functions.
Deciphering the intentions of policy from thedirectives is, of cqurse, somewhat subjective. Al-though disagreements could arise over any one mem-ber’s intentions at a particular meeting, the directivesare usually clear; thus, votes are as good a proxy formembers’ policy desires as exist. Over the 1965-85sample, approximately 58 percent of the votes castwere for no change in policy, 25 pe, rcent were fortightening, and 17 percent were "for loosening. The
The "Green Book," circulated toFOMC mernbers before each
meeting, contains the Board staff’sexpectations of the future paths of
output growth, inflation, andunemployment.
large proportion of votes for no change illustrates thedeliberate nature of monetary policy; the Fed was notconstantly attempting to fine-tune the economy.. Fur-thermore, episodes of tightening and looseningtended to be clumped together, indicating a,"gradu-dlism" in policy tightening or easing. As Brainard(1967) points out, doubts about the magnitude of theeffect of changing policy provide a justification forrelatively ~mall policy moves at one time; the Fedpreferred a-series of-slight policy changes in the samedirection to a large single jump.
Both actual and forecasted data are used toexamine the effect on FOMC voting of national andregional variables. Unfortunately, testing the effect ofregional conditions on Bank president voting is inhib-ited by the dearth of economic data collected at thestate level. This study aggregated the statewide datathat were available into Fed District figures.8 Contem-poraneous values of regional and national eml~loy-ment growth rates and unemployment rates, nationalinflation rates, and dummies for the deviations ingrowth of real per-capita gross regional product wereused in the analysis.9 Alternatively, since the lags inthe effects of Fed policy require the FOMC to react toits expectations about future economic variables, the
March/April 1991 New England Economic Review 7

sensitivity of FOMC voting to forecasts of nationalunemployment, real GNP growth, and inflation werealso examined. The "Green Book," which is circu-lated to FOMC members before each meeting, con-tains the Board staff’s expectations of the future pathsof output growth, inflation, and unemployment. Thecontemporaneous data provide proxies for the re-gional economic conditions while the Green Bookforecasts furnish good measures of the Board staff’sexpectations of the national variables.1°
Because policy decisions depend so heavily onthe exact information available at the time, care mustbe given in each estimation procedure to the timing ofthe data. The frequency of the explanatory variablesfound in the Green Book exactly coincides with theFOMC votes, and these forecasts are updated beforeeach FOMC meeting. The independent variables that
Table 1Regional Effects on the Simple Model
(1) (2) (3) (4) (5)All FOMC All FOMC Board Banks BanksMembers Members Only Only Only
TighteningC -2.241 -2.371 -2.75 -2.023 -2.145
(13.21) (13.65) (11.21).(8.07) (8.38){~E .136 .078 .038 .087 .027
(8.07) (4.11 ) (1.33) (3.32) (.88)I~E .163 .157 .172 .135 .129
(7.30) (7.01) (5.58) (4.12) (3.92)~L .118 .08 .028
(7.01) (4.19) (1.21)U~L .213 .164
(6.63) (4.06)Loosening.c
F~L
U~L
.175 .190 .176 .206 .215(.97) (1.04) (.73) (.72) (.74)
-.211 -.176 -.129 -.208 -.138(11.79) (8.59) (4.34) (6.87) (3.85)-.177 -.176 -.164 -.190 -.186(6.12) (6.04) (4.27) (4.18) (4.02)
-.057 -.030 .028(3.12) (1.31) (1.00)
-.115 -.167(3.65) (3.50)
Note: t statistics in parentheses. 0E is the. forecast ot real outpulgrowth and t~E is the !orecast of inflation..USL is the rate of nationalemployment growth, RL the regional rate. RL in equation (2) uses theDistrict employment growth rate for Bank presidents and the nationalrate for the Board governors.
are not found in the Green Book, however, have afrequency different from the Green Book forecastsand the FOMC votes. Employment growth, for ex-ample, is released monthly, while the FOMC has metfrom eight to twelve times a year over the sampleperiod investigated in this article. To account for thisproblem, the most recent employment growth figureavailable before the FOMC meeting is used as anexplanatory variable for that meeting’s vote. The testsin this paper are constructed to ensure that theindependent variables contain the most recent addi-tions to each member’s information set.
IlL The Results
This section begins with the empirical results ofthe simple model described in section I. The effects ofregional variables on District president voting arethen examined. A variety of indicators of Districtconditions are tested and all reject any effect ofregional variables on Bank voting. Next is shown therobustness of the result when adding other nationalvariables, consistent with the past work on Fedreaction functions. Complicating the voting functionin no way alters the rejection of regional effects.Finally, the coefficients are interpreted as functions oftastes and constraints.
Regional Variables in tile General Model
Table 1 presents the results using multinomiallogit estimation for the simplest model in section I.The equations in Table 1 are derived from the utilityfunction given in the model; the FOMC sets mone-tary policy in order to attain its output growth andinflation targets. The first equation in Table 1 pro-vides the coefficients for the effect on the probabilityof voting to tighten (top panel) and loosen (bottompanel) relative to a vote of no change, given theGreen Book forecasts of the change in real GNP andinflation.11 The coefficients on all these forecasts areof the expected sign and are statistically significant.As expected real GNP growth increases, the proba-bility of voting for tightening rises while the proba-bility of voting for loosening declines.12 Similarly, anincrease in expected inflation raises the probability oftightening and decreases the probability of loosening.This result supports the hypothesis that the Fedattempts to maintain a balance between outputgrowth and inflation.
As employment growth is one of the best indi-
8 March/April 1991 New England Economic Review

cators of regional economic conditions, it is the firstcomponent of regional information tested. Equation(2) of Table 1 adds a regional employment growthrate to the first equation in Table 1. Since this equa-tion examines the FOMC as a whole, the employmentgrowth rate uses the regional employment for eachDistrict Bank and national employment for the Boardof Governors. The coefficients on all the variables inthe second equation are statistically significant and ofthe anticipated sign. When employment growthrises, the probability of voting for tighter policy rises
The employment data suggest thatBank presidents vote on national,
not regional, vari~abtes.
and for looser policy falls. Similarly, when the ex-pected inflation rate increases, the probability oftightening rises and the probability of looseningdeclines. The magnitudes of the coefficients on theGreen Book forecasts of real GNP growth decrease,but they remain statistically significant. Again, thesecoefficients are consistent with the belief that the Fedattempts to balance off the performance of the realeconomy, proxied by employment growth, and infla-tion.
The significance of the employment variable is ofcentral concern to this article. Equation (2) in Table 1suggests the potential importance of regional vari-ables. However, since the regional employment vari-able for the FOMC as a whole combines the Districtemployment growth faced by the Bank presidentswith the national employment growth faced by theBoard governors, the finding of a significant effect onvoting for this variable could be due to the over-whelming significance of the national employmentfigures for the Bo.ard governors. To test this hypoth-esis, the regression is divided into a Board equation(3) and a Bank equation (4). Although the magnitudeof the regional employment growth coefficients fallslightly when examining the Bank equation, (4),versus the FOMC equation, (2), the coefficient forloosening is correctly signed and statistically signifi-cant ~vhile that for tightening is ~orrectly signed. 13 Anincrease in employment growth in a given Fed Dis-trict increases the probability of that District’s presi-dent voting for tighter policy and decreases theprobability that he or she will vote for loosening. The
significance of the regional employment growth co-efficient for the Bank presidents seems to suggest thatDistrict Bank presidents do vote based on regionaleconomic conditions.
However, once the national employment growthrate is accounted for in the Bank presidents’ votingfunction, the regional variable loses all significance.Including the national employment growth in theBank presidents’ equation, equation (5) of Table 1,tests whether the regional variable helps explainDistrict Bank voting beyond its correlation with itsnational counterpart. Both the statistical significanceand the magnitude of the coefficient on regionalemployment growth collapse, while the coefficientfor national employment growth is statistically signif-icant and large. Although the regional and nationalemployment growth rates are far from perfectly cor-related, they move together sufficiently so that thechange in regional employment was given credit forthe change in national employment when the na-tional rate was omitted in equation (4); the regionalemployment growth in equation (4) merely capturesthe effect of changes in national employment on Bankpresident voting. In fact, the employment data sug-gest that Bank presidents vote based on national, notregional, variables.
Robustness Using Other Measures of RegionalActivity
~ Other proxies for regional economic performanceare also investigated to ensure that regional condi-tions are being captured effectively. It is possible thatDistrict employment growth is not the best indicatorof local conditions. Therefore, the effect of Districtunemployment rates, although available in sufficientlength only for the larger states, is tested under theidentical procedure used in Table 1.14 The pattern ofresults using regional and national unemploymentrates is similar to that using regional and nationalemployment growth; although the regional unem-ployment rate shows some statistical significance inan estimation including the Green Book forecasts ofreal GNP growth and inflation alone, when thenational unemployment rate is included, the regiona!figure loses all significance. Again, regional unem-ployment is only acting as a proxy for the movementin the national number.
Another possible measure of regional conditionsis a dummy variable derived from an estimate ofGross District Product. The effect on voting of devi-ations of the Fed District product from its trend
March/April 1991 New England Economic Review 9

growth rate is examined, is Again, this different mea-sure of District conditions basically replicates theresults using regional employment growth. Equa-tions consisting of this dummy variable and theGreen Book forecasts of real GNP growth and infla-tion find slight significance for the dummy, but all thesignificance disappears when this variable’s nationalcounterpart is included. Thus, the rejection of theimportance of regional economic conditions is ex-tremely robust to different proxies for regional eco-nomic conditions.
Robustness of Results Using Other NationalVariables
The omission of other variables of interest to theFed could affect the outcomes of these tests; inclusionof these other variables might reverse the finding ofinsignificant regional effects. These variables, men-tioned throughout the traditional reaction f.~nctionliterature, could be other goals of the Fed, or otherimportant indicators besides the Green Book fore-casts. For example, some District Banks are believedto emphasize the growth of the monetary aggregatesmore than others. These Banks may believe that themoney supply is a better predictor of long-run infla-tion, and thus weight it more heavily than the otherFOMC members. Although an exhaustive test of allthe variables hypothesized to be of interest to the Fedis beyond the scope of this article, the robustness ofthe rejection of regional concerns is examined fordifferent specifications for the Fed’s behavior.
The Fed may be concerned with real variablesbesides output growth. Table 2 contains the coeffi-cient estimates of the basic voting function, equation(1) of Table 1, when first the national employmentgrowth rate, then the Green Book forecast of thechange in the unemployment rate, and finally bothvariables are added to the regression. Using either ofthese two measures clearly reduces the size of thecoefficient on the Green Book forecast of GNPgrowth. And, when all three are included in the sameequation, both the forecast of GNP growth and theforecast of unemployment rate changes tend to losesignificance and importance. Essentially the threevariables are attempting to measure the same thing,the Fed’s concern about the performance of the realside of the economy; as a result, each variable’s effecton voting is difficult to disentangle from the others’.For this reason only one such measure of real activity,the Green Book forecast of real GNP growth, will beused subsequently.~6
Tests were performed to ensure that the rejectionof the regional variables is robust to the use of theseother proxies for the FOMC’s national goals. Inequation (5) of Table 1 the importance of regionalemployment is rejected when both national employ-ment growth and real GNP forecasts are considered.In fact, when the GNP forecasts are dropped fromthat equation, regional employment still produces nostatistically significant effect on Bank president vot-ing; when only inflation expectations and regionalemployment are considered, regional employment isimportant, but when national employment ds addedto the equation the regional variable loses all signifi-cance. Furthermore, replacing the Green Book fore-cast of output growth in equation (1) of Table 1 withits prediction of national unemployment rate changesproduces the identical result; the change in regionalunemployment is somewhat significant when only itand inflation forecasts are included in the regression,
Table 2Alternative Targets of Real Activity
(1) (2) (3)All FOMC All FOMC All FOMCMembers Members Members
TighteningC -2.464 -2.154 -2.594
(13.95) (11.67) (13.09)(~E .032 .115 .057
(1.53) (4.56) (2.14)U~L .202 .212
(8.69) (8.74)AuneE -.265 .336
(1.25) (1.46)15E .152 .160 .154
(6.76) (7.19) (6.83)LooseningC .202 -.428 -.239
(1.05) (1.97) (1.07)0E -.133 -.07 -.052
(5.83) (2.21) (1.62)USE -.125 -.092
(5.10) (3.55)AuneE 1.33 .962
(5.18) (3.55)~ -.173 -.161 -.164
(5.87) (5.43) (5.51)Note: t statistics in parentheses. (3E, ~, and ~uneE are lhe GreenBook forecasts o! output growth, inflation and change in the unem-ployment rate. USL is the growth rate of national employment.
10 March/April 1991 New England Economic Review

but regional unemployment loses all significancewhen its national counterpart is included. The previ-ous results are, therefore, robust to alternative spec-ifications of the national goals of monetary policy.Using national employment growth or unemploy-ment expectations as Fed goals rather than real GNPgrowth still produces a rejection of the hypothesisthat District Bank presidents are overly concernedabout regional performance.
Other variables frequently hypothesized as im-portant to the Fed were also examined. For example,some of the traditional reaction function literatureincludes money supply growth since it is believed tobe an intermediate Fed target. The Fed attempts toachieve some rate of money growth in-order to attainits goals for GNP and inflation. Basically, the Fed maybe thought to use the rate of growth in the moneysupply as an accurate indicator of future nominaloutput growth. Yet, for money growth to be impor-tant in equations that include the Green Book fore-casts of inflation and output growth, FOMC membersmust either believe money growth is not adequatelyconsidered in these forecasts, or care about horizonsdifferent from the Green Book forecasts and believethat money growth helps predict GNP growth andinflation at these different horizons, or care aboutmoney for its own sake. Furthermore, the traditionalliterature has also hypothesized that the Fed is con-cerned with smoothing interest rates. The laggedchange in the federal funds rate might be an impor-tant determinant of FOMC votes and is, therefore,also added to the basic voting equation. 17 The FOMCequations are used to test the importance of moneygrowth and lagged changes in the interest rate sincethey are national, not regional, variables.
Equation (1) of Table 3 includes the rate ofgrowth in the money supply. It is statistically signif-icant and of the expected sign; when money growthis high (low) the probability of tightening (loosening)increases. The coefficient is, however, quite small,between one-seventh and one-tenth the magnitudeof the other coefficients. Equation (2) in Table 3 addsthe lagged change in the federal funds rate to equa-tion (1) of that table.18 The coefficients for this vari-able are large and also statistically significant. Theprobability of tightening (loosening) rises (falls) aftera recent change in the federal.funds rate.
Yet, rather than capturing concerns over interestrate smoothing, the lagged federal funds rate isprobably illustrating certain time series properties ofFOMC policy. The Fed tends to tighten or loosenslowly; that is why similar votes are clumped to-
Table 3Alternative National Targets
(1) (2)All FQMC All FOMCMembers Members
C -2.439 -2.535(12.88) (12.66)
(~E .139 .132(8.18) (7.29)
15E .170 .110(7.53) (4.4)
~ .022 .06(2.44) (6.05)
&FF .921(8.82)
_LooseninqC .335 .329
(1.74) (1.68)(~E -.21 -.150
(11.68) (7.90)I~ -.179 -.179
(6.20) (6.01)
i~1 -.024 -.063(2.50) (5.43)
~FF -1.21(10.51)
Note: t statistics in parentheses. (~E an~ I~E are the Green Booklorecasts of output growth and inllation. M is the growth rate of M1.AFF is the lagged change in the federal funds rate.
gether. The lagged change in the federal funds rate ismerely a surrogate for last month’s monetary policy.In fact, when a dummy variable of various lags wasused to capture lagged policy, the change in thefederal funds rate lost all significance and magni-tude.~9 Both the money growth rate and the laggedchange in the federal funds rate are statisticallysignificant in Table 3, but the added information theyprovide appears less important; the coefficient onmoney is small relative to the other coefficients, andthe lagged federal funds rate simply seems to becatching the serial correlation of policy votes.
What is essential to this study, however, is thatneither variable affects the coefficients for the originalequation. The Green Book forecasts of inflation andoutput growth remain essentially the same whenthese additional variables are included. Running theidentical test of the regional effects using equation (2)
March/April 1991 Nez~) England Economic Reviezo 11
of Table 3 as the base equation again rejects thehypothesis that regional performance affects FOMCvoting. Even when that test is performed for Bankpresidents only, the hypothesis is rejected. Using anyof the possible specifications in this article, it appearsthat District presidents did not vote dependent onregional employment growth.
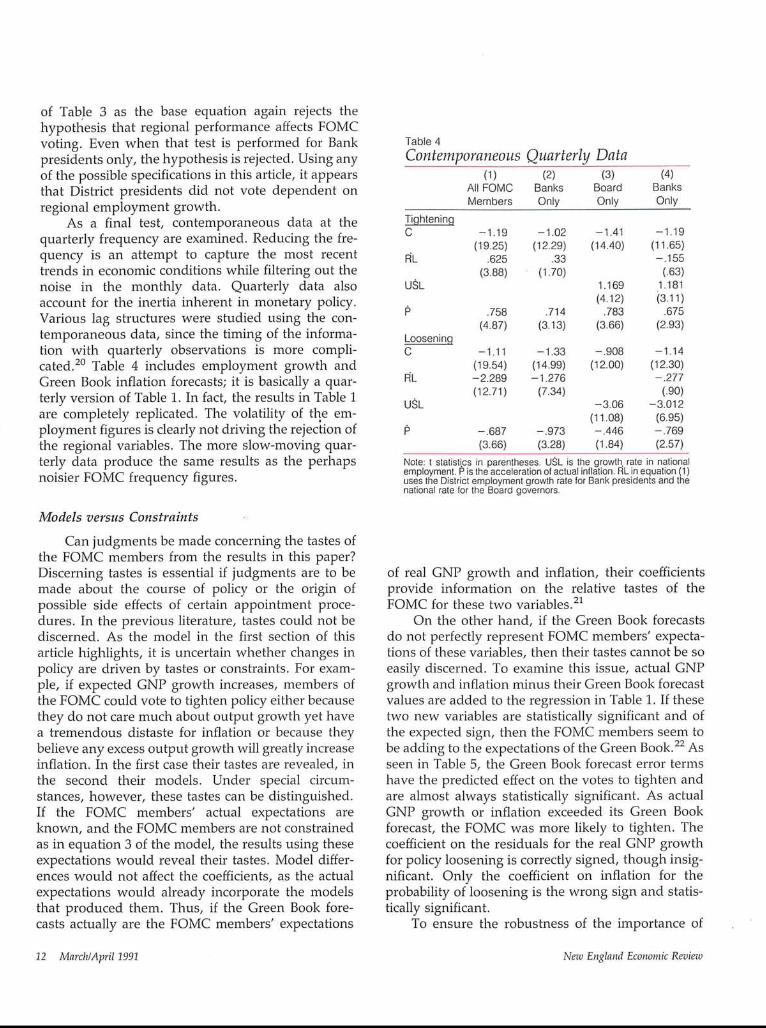
As a final test, contemporaneous data at thequarterly frequency are examined. Reducing the fre-quency is an attempt to capture the most recenttrends in economic conditions while filtering out thenoise in the monthly data. Quarterly data alsoaccount for the inertia inherent in monetary policy.Various lag structures were studied using the con-temporaneous data, since the timing of the informa-tion with quarterly observations is more compli-cated.2° Table 4 includes employment growth andGreen Book inflation forecasts; it is basically a quar-terly version of Table 1. In fact, the results in Table 1are completely replicated. The volatility of the em-ployment figures is clearly not driving the rejection ofthe regional variables. The more slow-moving quar-terly data produce the same results as the perhapsnoisier FOMC frequency figures.
Table 4Contemporaneous Quarterly Data
(1) (2) (3) (4)All FOMC Banks Board BanksMembers Only Only Only
Tightenin,qC -1.19 -1.02 -1.41 -1.19
(19.25) (12.29) (14.40) (11.65)~L .625 .33 -.155
(3.88) (1.70) (.63)U~L 1.169 1.181
(4.12) (3.11)t5 .758 .714 .783 .675
(4.87) (3.13) (3.66) (2.93)LooseninqC -1.11 -1.33 -.908 -1.14
(19.54) (14.99) (12.00) (12.30)F~L -2.289 - 1.276 -.277
(12.71) (7.34) (.90)U~L -3.06 -3.012
(11.08) (6.95)15 -.687 -.973 -.446 -.769
(3.66) (3.28) (1.84) (2.57)Note: t statistics in parentheses. U~L is the growth, rate in nalionalemployment. P is the acceleration of actual inflation. RL in equation (I)uses the District employment growth rate for Bank presidents and thenalional rate for the Board governors.
Models versus Constraints
Can judgments be made concerning the tastes ofthe FOMC members from the results in this paper?Discerning tastes is essential if judgments are to bemade about the course of policy or the origin ofpossible side effects of certain appointment proce-dures. In the previous literature, tastes could not bediscerned. As the model in the first section of thisarticle highlights, it is uncertain whether changes inpolicy are driven by tastes or constraints. For exam-ple, if expected GNP growth increases, members ofthe FOMC could vote to tighten policy either becausethey do not care much about output growth yet havea tremendous distaste for inflation or because theybelieve any excess output growth will greatly increaseinflation. In the first case their tastes are revealed, inthe second their models. Under special circum-stances, however, these tastes can be distinguished.If the FOMC members’ actual expectations areknown, and the FOMC members are not constrainedas in equation 3 of the model, the results using theseexpectations would reveal their tastes. Model differ-ences would not affect the coefficients, as the actualexpectations would already incorporate the modelsthat produced them. Thus, if the Green Book fore-casts actually are the FOMC members’ expectations
of real GNP growth and inflation, their coefficientsprovide information on the relative tastes of theFOMC for these two variables.21
On the other hand, if the Green Book forecastsdo not perfectly represent FOMC members’ expecta-tions of these variables, then their tastes cannot be soeasily discerned. To examine this issue, actual GNPgrowth and inflation minus their Green Book forecastvalues are added to the regression in Table 1. If thesetwo new variables are statistically significant and ofthe expected sign, then the FOMC members seem tobe adding to the expectations of the Green Book.22 Asseen in Table 5, the Green Book forecast error termshave the predicted effect on the votes to tighten andare almost always statistically significant. As actualGNP growth or inflation exceeded its Green Bookforecast, the FOMC was more likely to tighten. Thecoefficient on the residuals for the real GNP growthfor policy loosening is correctly signed, though insig-nificant. Only the coefficient on inflation for theprobability of loosening is the wrong sign and statis-tically significant.
To ensure the robustness of the importance of
12 March/April 1991 New England Economic Revb~v

these errors, a slightly different methodology is alsoemployed. An ordered probit is performed in whichit is assumed that as real GNP growth or inflationdecreases, the probability of a vote moves constantlyaway from tightening, through no change, andtoward loosening; the coefficients are, thus, assumedtO be constant.23 The ordered probit results suggestthat actual real GNP growth beyond the Green Bookforecast has the expected effect on FOMC policy;members are more likely to vote-for tightening (loos-ening) when GNP grows faster (slower) than theGreen Book forecast. The inflation forecast error hasno statistically significant effect in the ordered probit.
Table 5Forecasts and Expectations
(1) (2)All FOMC All FQMCMembers Members
TighteningC -2.26 -2.54
(13.15) (12.46)(~E .129 .124
(7.47) (6.67)I~E .158 .107
(7.00) (4.19)(0 - QE) .063 .064
(3.44) (3.35)(!b - IhE) .104 .111
(2.94) (3.01)t~ .057
(5.67).929
(8.89)Loosenlnqc .011 .197
(.06) (.98)-.221 -.164
(11.81) (8.21)-.160 -.172(5.47) (5.67)-.019 -.003
(.82) (.12).165 .147
(4.36) (3.79)-.056(4.77)-1.17
(10.17)Note: t statistics in pa.rentheses, QE and DE are forecasts of outputgrowth and inflation. M is the M1 growlh rate and &FF is the changein the federal funds rate. (0 - (~E) and (I~ - 15E) are the errors in theGreen Book forecasts of output growth and inflation.
The importance of the real output forecast errorseems robust; thus, the FOMC members were appar-ently bringing information beyond that contained inthe Green Book.
One possible explanation for the significance ofthe prediction error is that different Banks bringdifferent, perhaps superior, "models" to the meeting.In fact, different economic models are often associ-ated with different District Banks. If diverse modelsare driving regional Bank behavior, then individualBanks should be reacting differently to the indepen-dent variables in this study. In Tootell (1990b) avariety of tests were performed on various equationscomparing single Banks, and even a group of reput-edly conservative Banks, with the remaining DistrictBanks. The hypothesis that all Banks vote identicallycan almost never be rejected.24 The similarity of theBanks is a somewhat surprising result consideringthe diversity of the paradigms associated with dif-ferent Banks. Either the models are, in essence, notall that different, the votes of the Bank presidents are
The hypothesis that all Banks voteidentically can almost never be
rejected.
not dictated by these diverse paradigms, or a consen-sus and reconciliation is worked out in the FOMCmeeting. The similarity among Banks also justifies anempirical assumption made throughout the article:since all Banks react alike, it is not a problem to lumpthem all together and constrain them to have thesame coefficients in the above tests.
Because of the uncertainty about the exact re-gional variable to test, many different ones are exam-ined. Using all of these various regional indicators,the evidence strongly rejects the hypothesis thatBank presidents relied disproportionately on regionaleconomic conditions. Yet the FOMC members didseem to bring important information to the meetings.Tootel! (1990b) reveals the similarity in votingwhether measured between different Banks or be-tween Bank and Board; thus, this information wasshared among all FOMC members. Information wasbrought to the table but it was not regional in natureand no regional disputes occurred over it.
March/April 1991 New England Economic Review 13

IV. Conclusion
The conclusion that Reserve Bank presidentshave different concerns than Board governors hasbecome a common assumption. In one view, thesepresidents are trapped by their constituencies, theDistrict Boards of Directors, who somehow constrainor influence the presidents to protect local interests.Yet, the evidence presented here indicates that pres-idents did not manipulate monetary policy to helptheir own regional economies. Either the directorstook a broader view than the hypothesis asserts orthe presidents were more independent than as-sumed. Comparing the FOMC votes to the discountrate votes would be one way to test which of thesealternatives was more probable. A different viewpostulates that Fed Bank presidents are too politicallyindependent, and thus, far more likely to be fortighter policy. Although some differences betweenBanks were perceptible, Tootell (1990b) used themethodology presented in this article to reject the
hypothesis that Bank presidents were any more con-servative, or prone to "tight" policy, than the Boardgovernors. Since they voted the same, their choice ofmonetary policy was identical, both their models andtheir tastes were close to identical.
A consensus-forming tendency could be theforce that drives out any differences in tastes ormodels. The improvement in the Green Book fore-casts suggested in this paper was probably the resultof information added by the interaction amongFOMC members before the vote. No evidence hasbeen found to support the contention that this infor-mation was regional. Furthermore, this added infor-mation was most likely shared as all members tendedto vote alike. In fact, perhaps the ability to captureand utilize different information is the reason theregional diversity endures at the Fed. Yet, the exactappointment procedure, or institutional structure,does not seem to affect the voting behavior of FOMCmembers. Assumed differences within the Fed can-not be used as a reason to alter the institution.
i For ease of exposition, the policymaker is ~naximizing utilitywith respect to the expected values of inflation and output growthinstead of the expected unity of the actual realization of thesevariables. These two approaches are equivalent if the monetaryauthority is risk neutral. Altering the approach does not change anyof the analysis essential to this paper.
2 The nine directors of each District Bank will, in general,have much closer ties to the regional economy. Businesses whoseproducts are nationally distributed are certainly less apt to be dispro-portionately concerned with local conditions, but producers of non-traded goods and providers of regional services will be overlydependent on regional economic performance.3 A rigorous example of such a situation would model an
altruistic president. His or her utility would depend on those inclosest proximity, those he or she has the most contact with. As arestilt, the president would overly weight the utility of local residentsversus the rest of the country and tend to vote dependent on regionalperformance.
4 The change of operating procedures and instruments throughthe 1970s and 1980s signifies a change in models dominating the Fed.s In "The Case of the Missing Money" Goldfeld (1976)
examines in detail the extent of the unexpected shortfall in moneydemand produced by any traditional money demand functionbefore that time.
6 Dissents are sometimes made in FOMC voting for technicalreasons. The explanations for these technical dissents are articu-lated in the minutes of the directives. Maintaining the example inthe body of the paper, if only one FOMC member believes the moneydemand function has shifted for reasons unrelated to changes inincome or inflation, he or she might make a technical dissent forchanging the money supply while keeping policy constant. Thus,these dissents were not included as disagreements with policy in thispaper.
7 Qualitative analysis is the method used for estimation. Asthere are three alternative policy responses, the results shown inthe paper derive from multinomial logit procedures. The coeffi-cients represent the change in the probability of choosing either totighten or loosen relative to the choice of no cbange in policy atgiven values of the independent variables. Ordered probits werealso performed and are mentioned only on the rare occasion whenthey do not corroborate the logit results.
8 All data were aggregated using a weighted average. Forexample, employment growth was weighted by the state’s share intotal District employment. One complication, however, is thatseveral Fed Districts include parts of states. These states wereincorporated into the District that contained the larger share of thatstate. This problem is not serious as the divided states are usuallyquite small relative to each District.
~ The employment data were seasonally adjusted using theCensus X-11 procedure. Inflation was measured using the Con-sumer Price Index (CPI). The Gross State Product numbers arepublished by the U.S. Bureau of Economic Analysis (BEA) andwere aggregated, like the employment data, into District figures.
~o The sample periods on the two data sets do not perfectlycoincide. The contemporaneous sample ranges from 1963-86,while the Green Book data cover 196(:~85. The Green Book sampleis shorter because the forecasts were not begun until the mid-1960sand because the data are not available until five years after a givenFOMC meeting. When both types of measures are used in thesame estimation procedure, the sample is constrained by theshorter Green Book period.
~ All results presented here use the Green Book’s one-quarter-ahead forecast. The results are basically identical when the two°quarters-ahead forecast is used.~2 Various measures of the output variable were examined in
various forms of the voting function. Deviations from de-trended
14 March/April 1991 New England Economic Review
output, output growth with drift, and growth that includeddummies for the post-1974 sample all produced essentially thesame coefficients and significance levels.
13 In regressions that drop the output gro~vth variable in orderto avoid the potential collinearity problem faced by includingoutput growth and employment growth in the same equation,both regional employment growth coefficients are statisticallysignificant for the Bank equations.
14 Because unemployment rates are not available for all statesover much of the sample, the state where the District Bank islocated is used as the regional unemployment rate. This proxypermits a longer sample period. Unemployment levels andchanges were examined, in an attempt to capture movements fromsome full employment level.
15 The total Fed District product is derived from the BEA°sgross state product series. The regional output is de-trended andthe residuals are used; these deviations from trend derive fromTootell (1990a). As gross state product is an annual series, thevalue of this residual is the same over the entire year.
z6 That the lag of an actual, known, variable; the employmentgrowth rate, tends to perform better than the Green Book forecastof real GNP growth suggests that forecasts are less important thanactual recent figures. However, when testing measures of inflationthis result is reversed; generally only the Green Book forecast ofprice level changes is significant, not actual, past inflation. Becauseof both, the difficulties of interpreting coefficients when there ismulticollinearity and the results using the inflation forecasts, theGreen Book forecast of real activity is used in the remainder of thepaper.17 The Fed might be concerned about the volatility of the bond
market; thus, the FOMC will not allow the interest rates to changeradically.
is The money growth rate is for M1. The lagged change in thefederal funds rate is the monthly average of the month before theFOMC meeting.19 The dummy variable took the value of zero if the previous
vote were to tighten, one if it were for no change, and two if thevote was to loosen. Including a single lag of policy decreased thesize and significance of the lagged change in the federal funds rateby about 40 percent. Including two lags eliminated the coefficientand its significance completely.
20 The complication over the timing of the lag structure is dueto the uncertainty about information flows. For example, usingfourth-quarter growth in real GNP to explain the first-quarterFOMC vote is suspect since information on output is received overthe course of the entire quarter. However, using contemporaneousreal GNP growth assumes information not yet officially received.Regressions with different lags of the independent variables wereinvestigated and found to be fairly consistent whether contempo-raneous or lagged values are used. Note this is only a problem withthe contemporaneous quarterly data, not the Green Book forecasts.
21 This statement is true if the utility horizon is the same as the
Green Book forecasts. Also, risk neutrality is still being assumed.These assumptions allow one to factor out all the models, con-straints, and the like, to get straight to the concerns of the FOMCmembers.
22 It is possible that FOMC concerns over other variables~correlated with national conditions~ could produce statisticallysignificant forecast error coefficients. It is doubtful that tastes arethe cause of these results~ however. A large enough percentage ofthe FOMC would have to care about the same unusual variable forthe coefficient on the entire FOMC to be significant. Secondly~ thecoefficient of any" such variable, the stock market or the dollar forexample~ need not result in the correct sign of the voting coeffi-cient; what exactly" is driving movements of that variable can benegatively" or positively correlated with national conditions~ andthis correlation can change given different circumstances or shocks.Furthermore~ if this variable is an instrument~ like the money" supply"or the federal funds rate~ it is "cared about" by" definition only" in itsrelation to its targets, like GNP and inflation. Traditionally" when oneassumes some FOMC member "cares" too much about a variable~that member believes the Green Book or other forecasting tools arenot considerin~ the informational content of that variable sufficiently".This is simply a difference in models~ not a difference in utility"functions. Finally"~ includin~ many" o~ these variables, like the moneysupply" and the interest rate, failed to remove the significance of theforecast error so the error was not picking up any’ utility effects fromthese variables. Thus~ although the significance oi the error ispossibly due to a lucky" correlation~ it seems unlikely-. The problem isthe variable selected to be the instrument for expectations~ not thatthe model is misspecified.
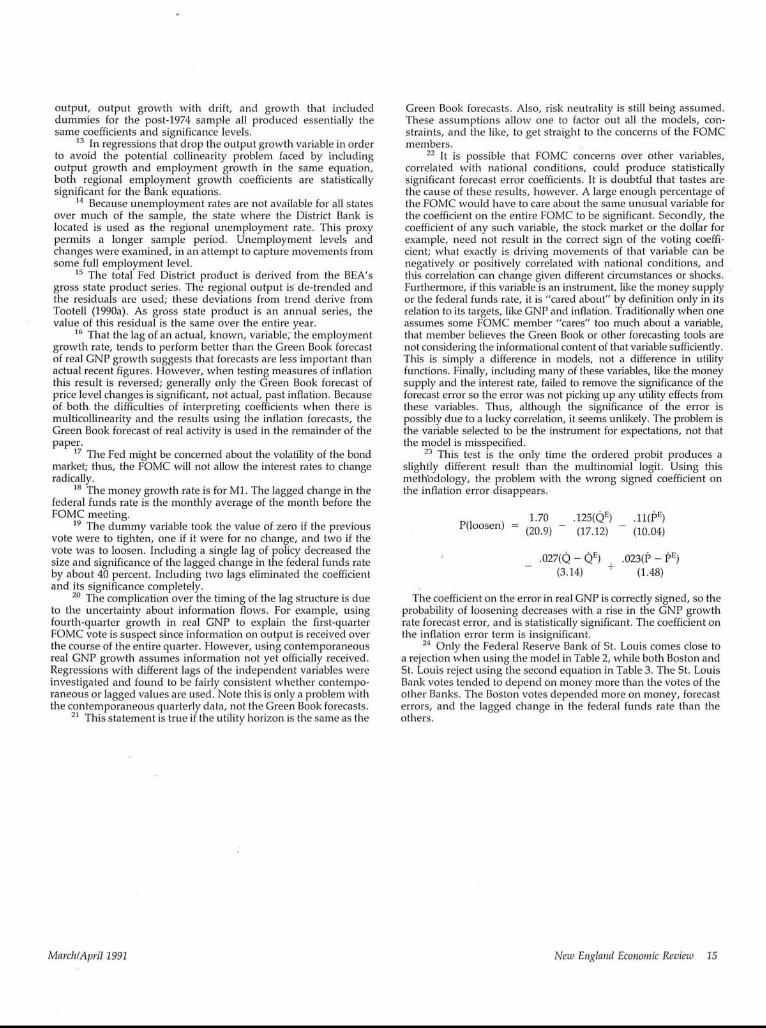
23 This test is the only time the ordered probit produces aslightly" different result than the multinomial logit. Using thismetlYodolo~y’, the problem with the wrong signed coefficient onthe inflation error disappears.
1.70 .125(QE) .11(I3E)P(loosen) = (20.9) - (17.12) - (10.04)
.027((~ - QE) .023(i5 _ 15E)-- +
(3.14) (1.48)
The coefficient on the error in real GNP is correctly signed, so theprobability of loosening decreases with a rise in the GNP growthrate forecast error, and is statistically significant. The coefficient onthe inflation error term is insignificant.
24 Only the Federal Reserve Bank of St. Louis comes close toa rejection when using the model in Table 2, while both Boston andSt. Louis reject using the second equation in Table 3. The St. LouisBank votes tended to depend on money more than the votes of theother Banks. The Boston votes depended more on money, forecasterrors, and the lagged change in the federal funds rate than theothers.
March/April 199! New England Economic Review 15

ReferencesAbrams, Richard K., Richard Froyen, and Roger Waud. 1980.
"Monetary Function Reaction Functions, Consistent Expecta-tions, and The Burns Era." Journal of Money, Credit, and Banking,vol. 12, no. 1, February, pp. 30~t2.
Alesina, Alberto and Jeffrey Sachs. 1988. "Political Parties and theBusiness Cycle in the United States, 1948-1984." Journal ofMoney, Credit, and Banking, vol. 20, no. 1, February, pp. 63~1.
Beldon, Susan. 1989. "Policy Preferences of FOMC Members asRevealed by Dissenting Votes." Journal of Money, Credit, andBanking, vol. 21, no. 4, November, pp. 432-41.
Brainard, William. 1967. "Uncertainty and the Effectiveness ofPolicy." The American Economic Review, May, pp. 411-25.
Clifford, A. Jerome. 1965. The Independence of the Federal ReserveSystem. Philadelphia, PA: University of Pennsylvania Press¯
Goldfeld, Stephen M. 1976. "The Case of the Missing Money."Brookings Papers on Economic Activity, (3), pp. 683-730.
Havrilesky, Thomas M~ 1987. "A Partisanship Theory of Fiscal andMonetary Regimes." Journal of Money, Credit, and Banking, vol.19, no. 3, August, pp. 308-25.
¯1990. "The Influence of the Federal Advisory Council on
Monetary Policy." Journal of Money, Credit, and Banking, vol. 22,no. 1, February, pp. 37-50.
Havrilesky, Thomas M. and John Gildea. 1990. "Packing the Boardof Governors." Challenge, vol. 33, no. 2, pp. 52-55.
Luckett, Dudley G. and Glenn T. Potts. 1978. "Policy Objectives ofthe Federal Reserve System." Quarterly Journal of Economics,August, pp. 525-34.
¯ 1980. "Monetary Policy and Partisan Politics." Journal ofMon~/, Credit, and Banking, vol. 12, no. 3, August, pp. 540M6.
McNees, Stephen K. 1986. "Modeling the Fed: A Forward-LookingMonetary Policy Reaction Function." New England EconomicReview, November/December, pp. 3M3.
Rosengren, Eric S. 1990. "How Diversified Is New England?" NewEngland Economic Review, November/December, pp. 3-16.
Tootell, Geoffrey M.B. 1990a. "Central Bank Flexibility and theDrawbacks to Currency Unification." New England EconomicReview, May/June, pp. 3-18.
.1990b. "Are District Banks More Conservative Than BoardGovernors?" Mimeo, Federal Reserve Bank of Boston.
16 March/April 1991 New England Economic Review