i final report part 5 implementation and monitoring
TRANSCRIPT
Page I 283Winnipeg Pedestrian and Cycling StrategiesFinal Report
5.1 Implementation Plan
5.2 Monitoring Plan
PART 5 Implementation and Monitoring

284 I Page
5.1 Implementation Plan
5.1.1 Introduction
The Pedestrian and Cycling Strategies provide a framework for making walking and cycling more safe, convenient, and comfortable modes of transportation in Winnipeg. This framework includes a series of Strategic Directions, Key Directions and Actions that together provide a comprehensive package of solutions to enable walking and cycling, including engineering, programming, and education initiatives.
The Actions of the Strategies are organized under each of the six Strategic Directions. The comprehensive package of Actions is intended to guide Winnipeg’s planning and capital investment decisions as well as on-going operations and maintenance activities to enable walking and cycling. In order to provide the City with clear directions and priorities, the Pedestrian and Cycling Strategies provide the City with a vision for the future of walking and cycling over the long-term. However, recognizing that the long-term vision will require significant investment, an implementationstrategy is required to prioritize improvements and identify short-term, medium-term, and long-term improvements.
Based on this, this chapter presents an implementation and phasing strategy, identifying priority actions over the short-term (0 to 5 years), medium term (5 to 10 years), and long-term (10 years and beyond). In addition to the short-term initiatives, the implementation and phasing strategy alsoidentifiesanumberof‘quickwin’initiativesthatthe City should begin within the next two years.
This chapter presents an implementation strategy for the Pedestrian and Cycling Strategies, which includes guiding principles, cost estimates, priorities, and a phasing approach.
Winnipeg Pedestrian and Cycling StrategiesFinal Report
Page I 285

286 I Page Winnipeg Pedestrian and Cycling StrategiesFinal Report
the Strategies on a regular basis, and should commit to reviewing and updating the Strategies every five years to update changing prioritiesandneedsandtoreflectcompletedprojects.
� The City should develop a yearly Pedestrian and Cycling Action Plan to identify upcoming projects and initiatives as part of its efforts to keep the Strategies a living document on an annual basis.
� The City should engage in Neighbourhood-Based Public Consultation to implement many recommendations of the Strategies. Many of the initiatives in the Strategies require more detailed input and technical work, and the City should work closely with its partners and with neighbourhoods as it works to move forward with priorities in the Strategies.
� Successful implementation of the Strategies require
• Increased funding levels
• Increased staff resources
• Improved monitoring
• Continued collaboration with stakeholders
5.1.2 Implementation Principles
The implementation strategy for the Pedestrian and Cycling Strategies is based on a number of principles that the City should consider as it moves forward with implementing the Strategies.
� The Pedestrian and Cycling Strategies are the first step, not the last step. The PedestrianandCyclingStrategiesarethefirststrategies of their kind developed for Winnipeg and represent a comprehensive package of engineering, programming, and education initiatives to enable walking and cycling. However, the Strategies are intended to lay the foundation for implementing the plan over the short, medium and long-term. In that regard, theStrategiesshouldbeseenasthefirststepin a long-term commitment to enabling walking and cycling. Implementation of the Strategies willrequiredsustainedanddedicatedfinancialand staff resources over the long-term.
� The Pedestrian and Cycling Strategies is a flexible and living document that should be reviewed and updated frequently. The Pedestrian and Cycling Strategies recommend a wide range of short-term initiatives to be implementedoverthenextfiveyears.Assuch,the City should monitor progress implementing
Funding
StaFF ReSouRceS
MonitoRing
collaboRation

Many of the actions recommended in these strategies simply direct the Winnipeg public Service to begin or to continue collaborating with stakeholders. It is the entintion of the strategies that this collaboration be conducted through the existing Active Transportation Advisory Committee (ATAC).
The Active Transportation Advisory Committee (ATAC) was approved by Council on April 25, 2007. The role of the ATAC is both strategic and responsive. It advises the Director of Public Works on the strategic direction of the AT program as well as makes recommendations on unexpected issues.
The mandate of the Active Transportation Advisory Committee (ATAC) is to provide advice and recommendations on Active Transportation policies, programs, priorities, facilities and standards to the Director of Public Works; Inform the public about Active Transportation and, where possible and appropriate, provide opportunities for public input; And to provide a forum in which AT issues can be discussed among the various stakeholder groups with the intent of reaching consensus on these issues.
Winnipeg Pedestrian and Cycling StrategiesFinal Report

288 I Page Winnipeg Pedestrian and Cycling StrategiesFinal Report
Page I 289Winnipeg Pedestrian and Cycling StrategiesFinal Report
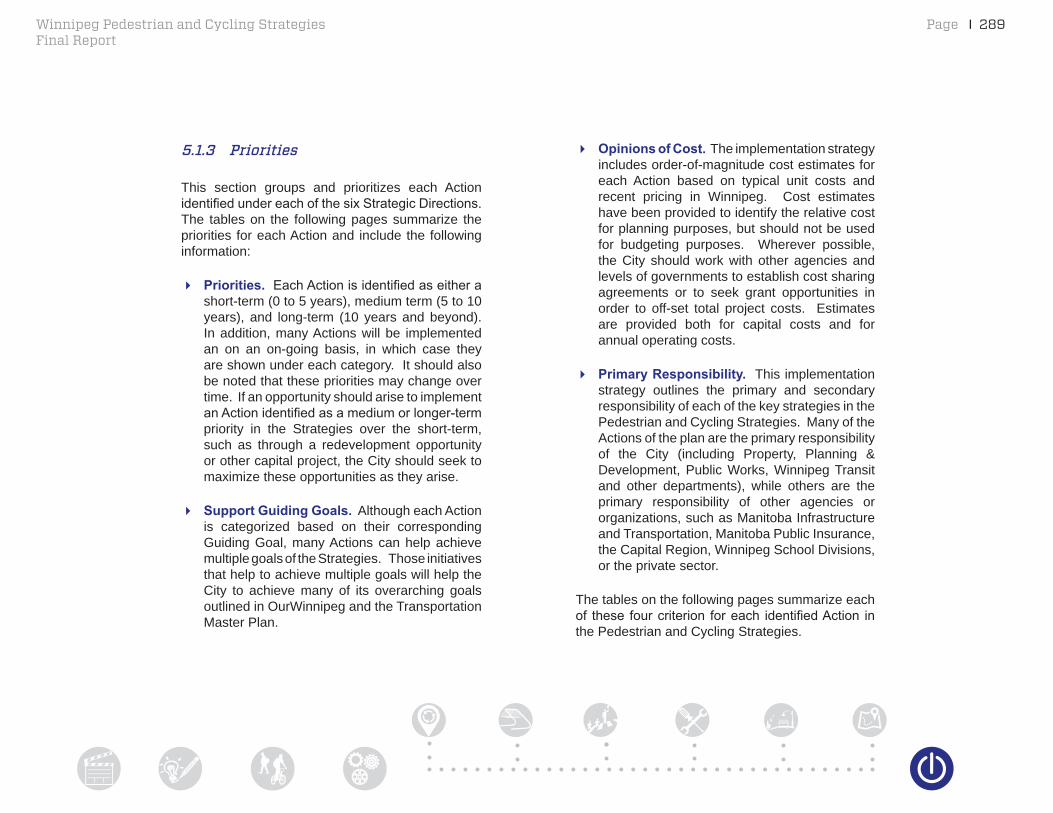
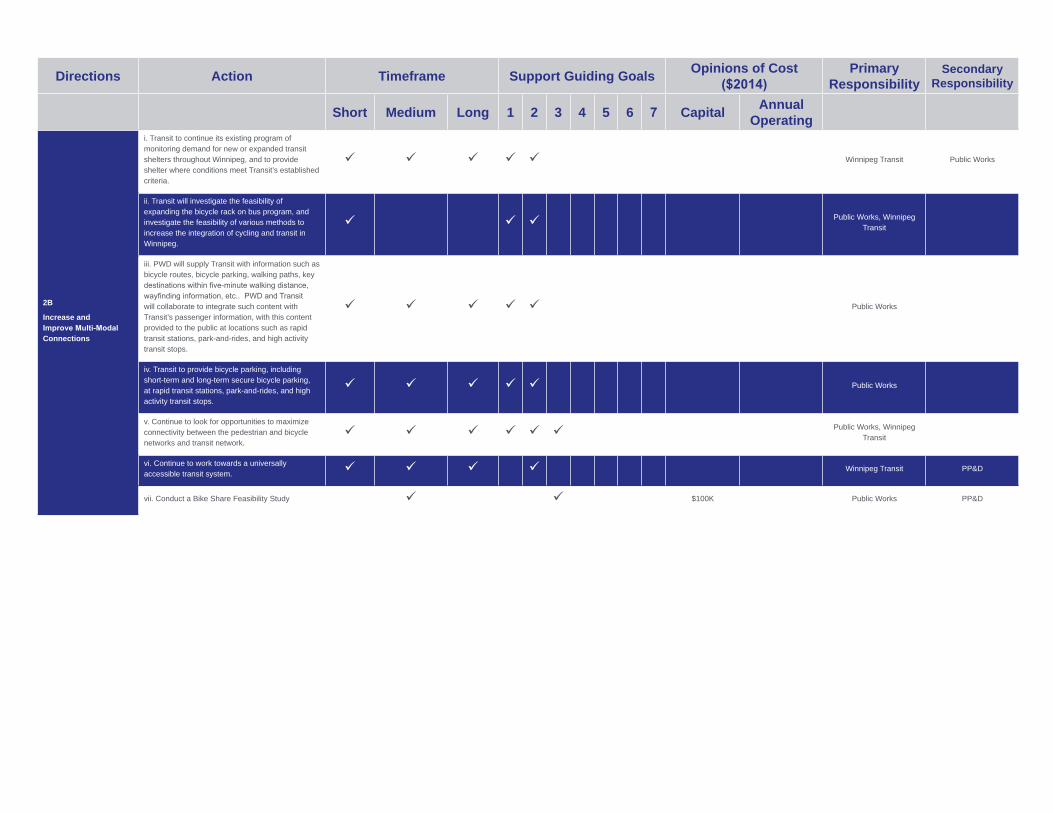
� Opinions of Cost. The implementation strategy includes order-of-magnitude cost estimates for each Action based on typical unit costs and recent pricing in Winnipeg. Cost estimates have been provided to identify the relative cost for planning purposes, but should not be used for budgeting purposes. Wherever possible, the City should work with other agencies and levels of governments to establish cost sharing agreements or to seek grant opportunities in order to off-set total project costs. Estimates are provided both for capital costs and for annual operating costs.
� Primary Responsibility. This implementation strategy outlines the primary and secondary responsibility of each of the key strategies in the Pedestrian and Cycling Strategies. Many of the Actions of the plan are the primary responsibility of the City (including Property, Planning & Development, Public Works, Winnipeg Transit and other departments), while others are the primary responsibility of other agencies or organizations, such as Manitoba Infrastructure and Transportation, Manitoba Public Insurance, the Capital Region, Winnipeg School Divisions, or the private sector.
The tables on the following pages summarize each of these fourcriterion foreach identifiedAction inthe Pedestrian and Cycling Strategies.
5.1.3 Priorities
This section groups and prioritizes each Action identifiedundereachofthesixStrategicDirections.The tables on the following pages summarize the priorities for each Action and include the following information:
� Priorities. EachActionisidentifiedaseitherashort-term (0 to 5 years), medium term (5 to 10 years), and long-term (10 years and beyond). In addition, many Actions will be implemented an on an on-going basis, in which case they are shown under each category. It should also be noted that these priorities may change over time. If an opportunity should arise to implement anActionidentifiedasamediumorlonger-termpriority in the Strategies over the short-term, such as through a redevelopment opportunity or other capital project, the City should seek to maximize these opportunities as they arise.
� Support Guiding Goals. Although each Action is categorized based on their corresponding Guiding Goal, many Actions can help achieve multiple goals of the Strategies. Those initiatives that help to achieve multiple goals will help the City to achieve many of its overarching goals outlined in OurWinnipeg and the Transportation Master Plan.

290 I Page Winnipeg Pedestrian and Cycling StrategiesFinal Report
Directions Action Timeframe Support Guiding Goals Opinions of Cost ($2014)
Primary Responsibility
Secondary Responsibility
Short Medium Long 1 2 3 4 5 6 7 Capital Annual Operating
Strategic Direction 1: Improve Connectivity
1A
Expand and Enhance the Pedestrian Network
i. Update sidewalk requirements for new developments in consultation with relevant stakeholders.
Public Works PP&D
ii. Eliminate gaps in the sidewalk network on major roads, including regional roads, arterial roads, commercial and industrial collector roads, bus routes, and truck routes.
$5M Public WorksPP&D, Winnipeg Transit, External
Stakeholders
iii.Developasidewalkinfillprograminthecapitalbudget to provide sidewalks on local roads in areas around schools, seniors centres, hospitals and other key destinations and to address gaps in the sidewalk network.
$30M Public Works PP&D
iv. Develop a sidewalk improvement program to widen sidewalks that do not meet the minimum standards. Ensure all sidewalk meet the City’s minimum width standards.
$35M Public Works
v. Provide wider sidewalks where feasible in areas of high pedestrian activity, including the downtown; regional, community and neighbourhood mixed use centres and corridors.
Public Works
vi. Seek strategic opportunities to implement new sidewalks through partnerships, other capital projects and programs and development opportunities on non-regional roads.
Public Works PP&D
vii. Develop a process to identify priorities for sidewalk implementation based on walking potential, equity, connectivity, comfort and cost.
Public Works

Page I 291Winnipeg Pedestrian and Cycling StrategiesFinal Report
Directions Action Timeframe Support Guiding Goals Opinions of Cost ($2014)
Primary Responsibility
Secondary Responsibility
Short Medium Long 1 2 3 4 5 6 7 Capital Annual Operating
1B
Expand & Enhance the Bicycle Network
i. Develop a complete, connected, and dense bicycle network throughout the City. $125M $1.4M Public Works
PP&D, Winnipeg Transit
ii. Develop a Downtown separated bicycle lane network. $7M $100K Public Works
iii. Develop a spine network to provide high quality connections to Downtown from each area of the City.
$4M $100K Public Works
iv. Develop local bicycle networks for each neighbourhood that connect to the spine network and to the Downtown.
$25M $200K Public Works PP&D
v. Identify and prioritize gaps within the bicycle network. Public Works
vi. Continue to expand the off-street pathway network. $50M $1M Public Works PP&D
vii. Support the extension of the City’s bicycle network to surrounding communities. External Stakeholders Public Works
viii. Develop and implement bicycle facility design guidelines that include a bicycle facility selection toolbasedontrafficspeedandvolumes.
Public Works
ix. Update the Transportation Standards Manual to incorporate bicycle facilities. Public Works
x. Ensure that bicycle requirements be addressed in all new and renewal road projects that are part of the bicycle network or where the road provides connectivity or support to the bicycle network .
$50M Public Works
xi. Pursue bicycle network improvements that establish access to major destinations throughout the City, including regional, community and neighbourhood mixed use centres and corridors, schools, libraries and parks.
PP&D Public Works
xii. Continue to provide, where appropriate and where suitable opportunities exist, bicycle infrastructure in conjunction with transit infrastructure such as rapid transit corridors.
Winnipeg Transit Public Works
xiii. Design new neighbourhoods to include bicycle routes that are well integrated with the existing bicycle network.
Public Works, PP&D
xiv. Where possible, utilize existing hydro and rail rights-of-way and surplus road rights-of-way as a means to provide comfortable, direct cycling routes.
$26M $100K Public WorksPP&D, External Stakeholders
xv. Maintain the asset management program for bicycle facilities and prioritize maintenance and improvements within the Downtown and along the spine network.
$25K Public Works
xvi. Develop a process to identify priorities for bicycle network implementation/improvements based on cycling potential, equity, connectivity, comfort, and cost.
Public Works
292 I Page Winnipeg Pedestrian and Cycling StrategiesFinal Report
Directions Action Timeframe Support Guiding Goals Opinions of Cost ($2014)
Primary Responsibility
Secondary Responsibility
Short Medium Long 1 2 3 4 5 6 7 Capital Annual Operating
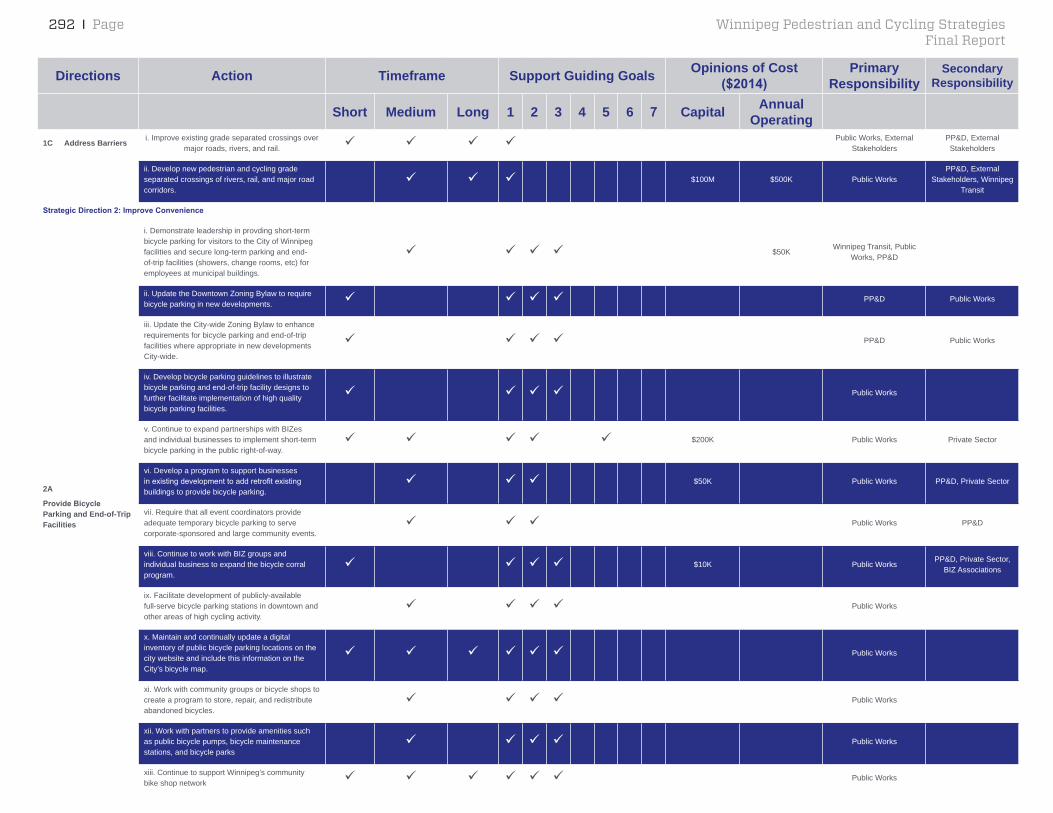
1C Address Barriers i. Improve existing grade separated crossings over major roads, rivers, and rail. Public Works, External
StakeholdersPP&D, External Stakeholders
ii. Develop new pedestrian and cycling grade separated crossings of rivers, rail, and major road corridors.
$100M $500K Public WorksPP&D, External
Stakeholders, Winnipeg Transit
Strategic Direction 2: Improve Convenience
2A
Provide Bicycle Parking and End-of-Trip Facilities
i. Demonstrate leadership in provding short-term bicycle parking for visitors to the City of Winnipeg facilities and secure long-term parking and end-of-trip facilities (showers, change rooms, etc) for employees at municipal buildings.
$50KWinnipeg Transit, Public
Works, PP&D
ii. Update the Downtown Zoning Bylaw to require bicycle parking in new developments. PP&D Public Works
iii. Update the City-wide Zoning Bylaw to enhance requirements for bicycle parking and end-of-trip facilities where appropriate in new developments City-wide.
PP&D Public Works
iv. Develop bicycle parking guidelines to illustrate bicycle parking and end-of-trip facility designs to further facilitate implementation of high quality bicycle parking facilities.
Public Works
v. Continue to expand partnerships with BIZes and individual businesses to implement short-term bicycle parking in the public right-of-way.
$200K Public Works Private Sector
vi. Develop a program to support businesses inexistingdevelopmenttoaddretrofitexistingbuildings to provide bicycle parking.
$50K Public Works PP&D, Private Sector
vii. Require that all event coordinators provide adequate temporary bicycle parking to serve corporate-sponsored and large community events.
Public Works PP&D
viii. Continue to work with BIZ groups and individual business to expand the bicycle corral program.
$10K Public WorksPP&D, Private Sector,
BIZ Associations
ix. Facilitate development of publicly-available full-serve bicycle parking stations in downtown and other areas of high cycling activity.
Public Works
x. Maintain and continually update a digital inventory of public bicycle parking locations on the city website and include this information on the City’s bicycle map.
Public Works
xi. Work with community groups or bicycle shops to create a program to store, repair, and redistribute abandoned bicycles.
Public Works
xii. Work with partners to provide amenities such as public bicycle pumps, bicycle maintenance stations, and bicycle parks
Public Works
xiii. Continue to support Winnipeg’s community bike shop network Public Works
Directions Action Timeframe Support Guiding Goals Opinions of Cost ($2014)
Primary Responsibility
Secondary Responsibility
Short Medium Long 1 2 3 4 5 6 7 Capital Annual Operating
2B
Increase and Improve Multi-Modal Connections
i. Transit to continue its existing program of monitoring demand for new or expanded transit shelters throughout Winnipeg, and to provide shelter where conditions meet Transit’s established criteria.
Winnipeg Transit Public Works
ii. Transit will investigate the feasibility of expanding the bicycle rack on bus program, and investigate the feasibility of various methods to increase the integration of cycling and transit in Winnipeg.
Public Works, Winnipeg Transit
iii. PWD will supply Transit with information such as bicycle routes, bicycle parking, walking paths, key destinationswithinfive-minutewalkingdistance,wayfindinginformation,etc..PWDandTransitwill collaborate to integrate such content with Transit’s passenger information, with this content provided to the public at locations such as rapid transit stations, park-and-rides, and high activity transit stops.
Public Works
iv. Transit to provide bicycle parking, including short-term and long-term secure bicycle parking, at rapid transit stations, park-and-rides, and high activity transit stops.
Public Works
v. Continue to look for opportunities to maximize connectivity between the pedestrian and bicycle networks and transit network.
Public Works, Winnipeg Transit
vi. Continue to work towards a universally accessible transit system. Winnipeg Transit PP&D
vii. Conduct a Bike Share Feasibility Study $100K Public Works PP&D
294 I Page Winnipeg Pedestrian and Cycling StrategiesFinal Report
Directions Action Timeframe Support Guiding Goals Opinions of Cost ($2014)
Primary Responsibility
Secondary Responsibility
Short Medium Long 1 2 3 4 5 6 7 Capital Annual Operating
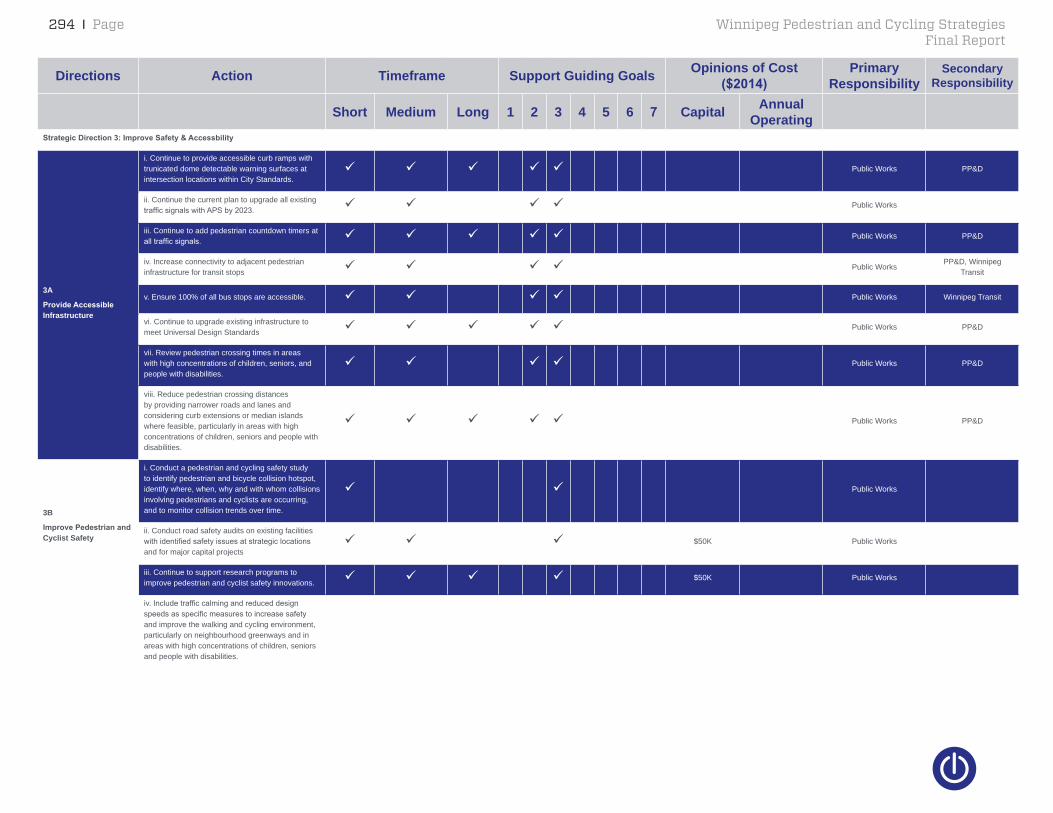
Strategic Direction 3: Improve Safety & Accessbility
3A
Provide Accessible Infrastructure
i. Continue to provide accessible curb ramps with trunicated dome detectable warning surfaces at intersection locations within City Standards.
Public Works PP&D
ii. Continue the current plan to upgrade all existing trafficsignalswithAPSby2023. Public Works
iii. Continue to add pedestrian countdown timers at alltrafficsignals. Public Works PP&D
iv. Increase connectivity to adjacent pedestrian infrastructure for transit stops Public Works
PP&D, Winnipeg Transit
v. Ensure 100% of all bus stops are accessible. Public Works Winnipeg Transit
vi. Continue to upgrade existing infrastructure to meet Universal Design Standards Public Works PP&D
vii. Review pedestrian crossing times in areas with high concentrations of children, seniors, and people with disabilities.
Public Works PP&D
viii. Reduce pedestrian crossing distances by providing narrower roads and lanes and considering curb extensions or median islands where feasible, particularly in areas with high concentrations of children, seniors and people with disabilities.
Public Works PP&D
3B
Improve Pedestrian and Cyclist Safety
i. Conduct a pedestrian and cycling safety study to identify pedestrian and bicycle collision hotspot, identify where, when, why and with whom collisions involving pedestrians and cyclists are occurring, and to monitor collision trends over time.
Public Works
ii. Conduct road safety audits on existing facilities withidentifiedsafetyissuesatstrategiclocationsand for major capital projects
$50K Public Works
iii. Continue to support research programs to improve pedestrian and cyclist safety innovations. $50K Public Works
iv.Includetrafficcalmingandreduceddesignspeedsasspecificmeasurestoincreasesafetyand improve the walking and cycling environment, particularly on neighbourhood greenways and in areas with high concentrations of children, seniors and people with disabilities.
Page I 295Winnipeg Pedestrian and Cycling StrategiesFinal Report
Directions Action Timeframe Support Guiding Goals Opinions of Cost ($2014)
Primary Responsibility
Secondary Responsibility
Short Medium Long 1 2 3 4 5 6 7 Capital Annual Operating
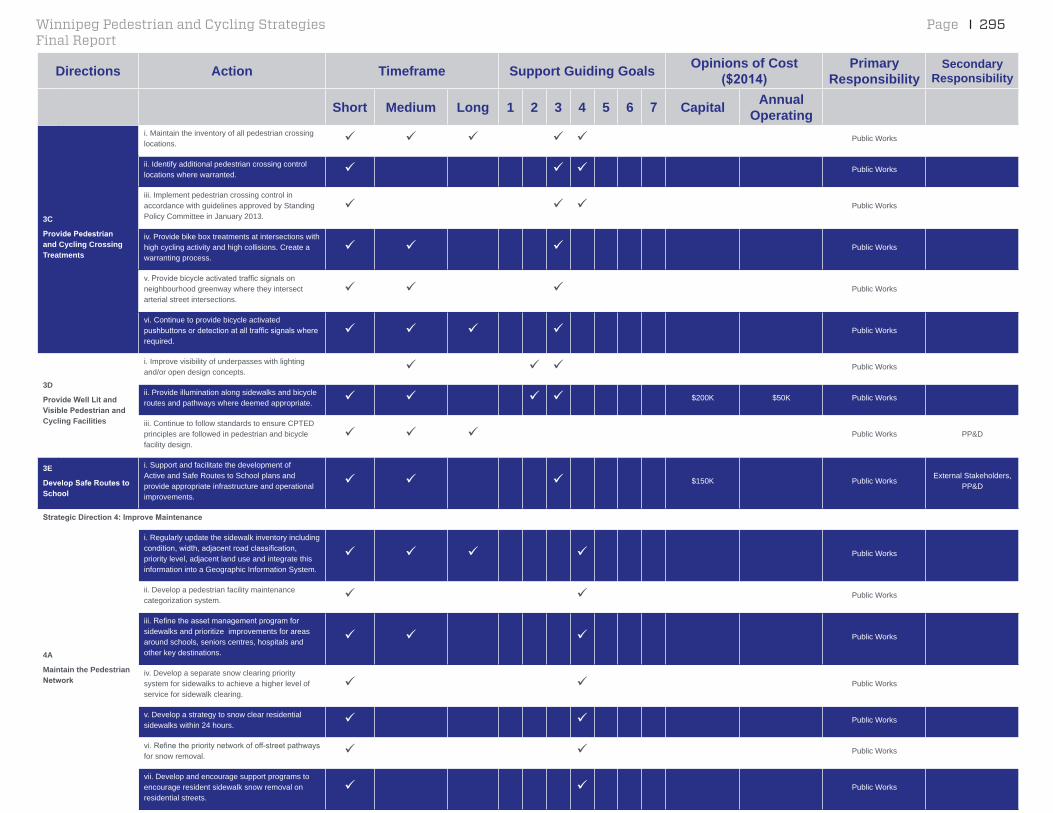
3C
Provide Pedestrian and Cycling Crossing Treatments
i. Maintain the inventory of all pedestrian crossing locations. Public Works
ii. Identify additional pedestrian crossing control locations where warranted. Public Works
iii. Implement pedestrian crossing control in accordance with guidelines approved by Standing Policy Committee in January 2013.
Public Works
iv. Provide bike box treatments at intersections with high cycling activity and high collisions. Create a warranting process.
Public Works
v.Providebicycleactivatedtrafficsignalsonneighbourhood greenway where they intersect arterial street intersections.
Public Works
vi. Continue to provide bicycle activated pushbuttonsordetectionatalltrafficsignalswhererequired.
Public Works
3D
Provide Well Lit and Visible Pedestrian and Cycling Facilities
i. Improve visibility of underpasses with lighting and/or open design concepts. Public Works
ii. Provide illumination along sidewalks and bicycle routes and pathways where deemed appropriate. $200K $50K Public Works
iii. Continue to follow standards to ensure CPTED principles are followed in pedestrian and bicycle facility design.
Public Works PP&D
3E
Develop Safe Routes to School
i. Support and facilitate the development of Active and Safe Routes to School plans and provide appropriate infrastructure and operational improvements.
$150K Public WorksExternal Stakeholders,
PP&D
Strategic Direction 4: Improve Maintenance
4A
Maintain the Pedestrian Network
i. Regularly update the sidewalk inventory including condition,width,adjacentroadclassification,priority level, adjacent land use and integrate this information into a Geographic Information System.
Public Works
ii. Develop a pedestrian facility maintenance categorization system. Public Works
iii.Refinetheassetmanagementprogramforsidewalks and prioritize improvements for areas around schools, seniors centres, hospitals and other key destinations.
Public Works
iv. Develop a separate snow clearing priority system for sidewalks to achieve a higher level of service for sidewalk clearing.
Public Works
v. Develop a strategy to snow clear residential sidewalks within 24 hours. Public Works
vi.Refinetheprioritynetworkofoff-streetpathwaysfor snow removal. Public Works
vii. Develop and encourage support programs to encourage resident sidewalk snow removal on residential streets.
Public Works
296 I Page Winnipeg Pedestrian and Cycling StrategiesFinal Report
Directions Action Timeframe Support Guiding Goals Opinions of Cost ($2014)
Primary Responsibility
Secondary Responsibility
Short Medium Long 1 2 3 4 5 6 7 Capital Annual Operating
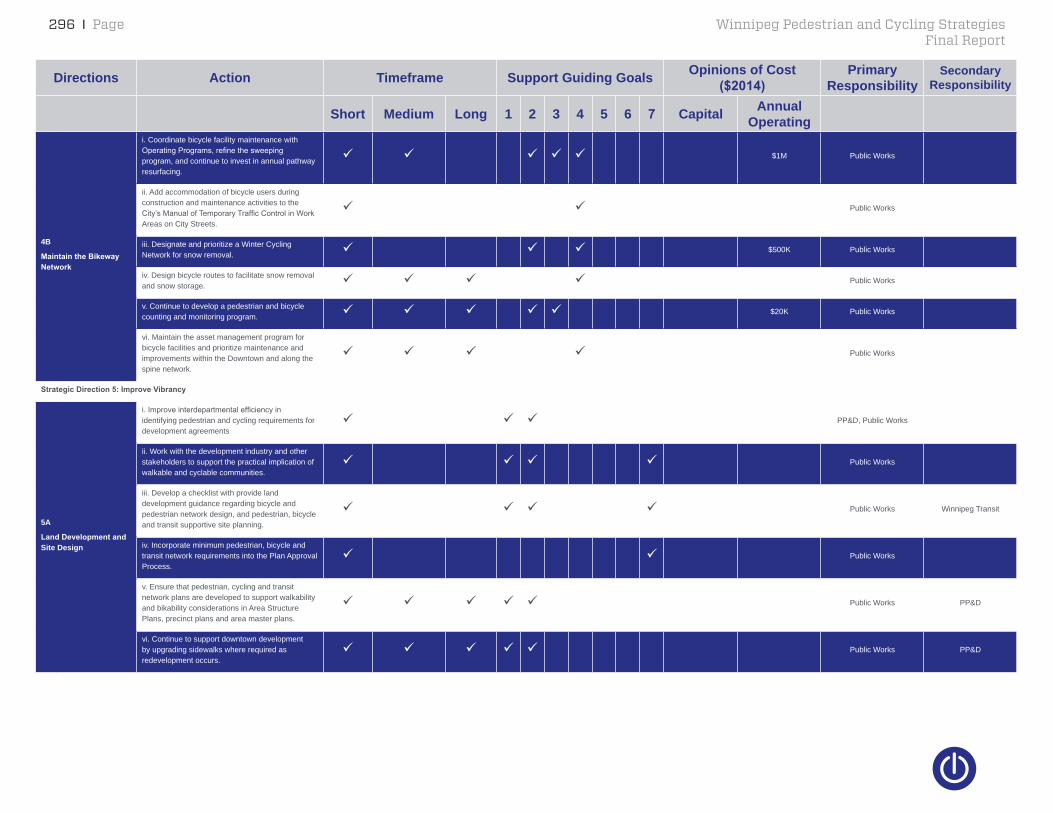
4B
Maintain the Bikeway Network
i. Coordinate bicycle facility maintenance with OperatingPrograms,refinethesweepingprogram, and continue to invest in annual pathway resurfacing.
$1M Public Works
ii. Add accommodation of bicycle users during construction and maintenance activities to the City’sManualofTemporaryTrafficControlinWorkAreas on City Streets.
Public Works
iii. Designate and prioritize a Winter Cycling Network for snow removal. $500K Public Works
iv. Design bicycle routes to facilitate snow removal and snow storage. Public Works
v. Continue to develop a pedestrian and bicycle counting and monitoring program. $20K Public Works
vi. Maintain the asset management program for bicycle facilities and prioritize maintenance and improvements within the Downtown and along the spine network.
Public Works
Strategic Direction 5: Improve Vibrancy
5A
Land Development and Site Design
i.Improveinterdepartmentalefficiencyinidentifying pedestrian and cycling requirements for development agreements
PP&D, Public Works
ii. Work with the development industry and other stakeholders to support the practical implication of walkable and cyclable communities.
Public Works
iii. Develop a checklist with provide land development guidance regarding bicycle and pedestrian network design, and pedestrian, bicycle and transit supportive site planning.
Public Works Winnipeg Transit
iv. Incorporate minimum pedestrian, bicycle and transit network requirements into the Plan Approval Process.
Public Works
v. Ensure that pedestrian, cycling and transit network plans are developed to support walkability and bikability considerations in Area Structure Plans, precinct plans and area master plans.
Public Works PP&D
vi. Continue to support downtown development by upgrading sidewalks where required as redevelopment occurs.
Public Works PP&D
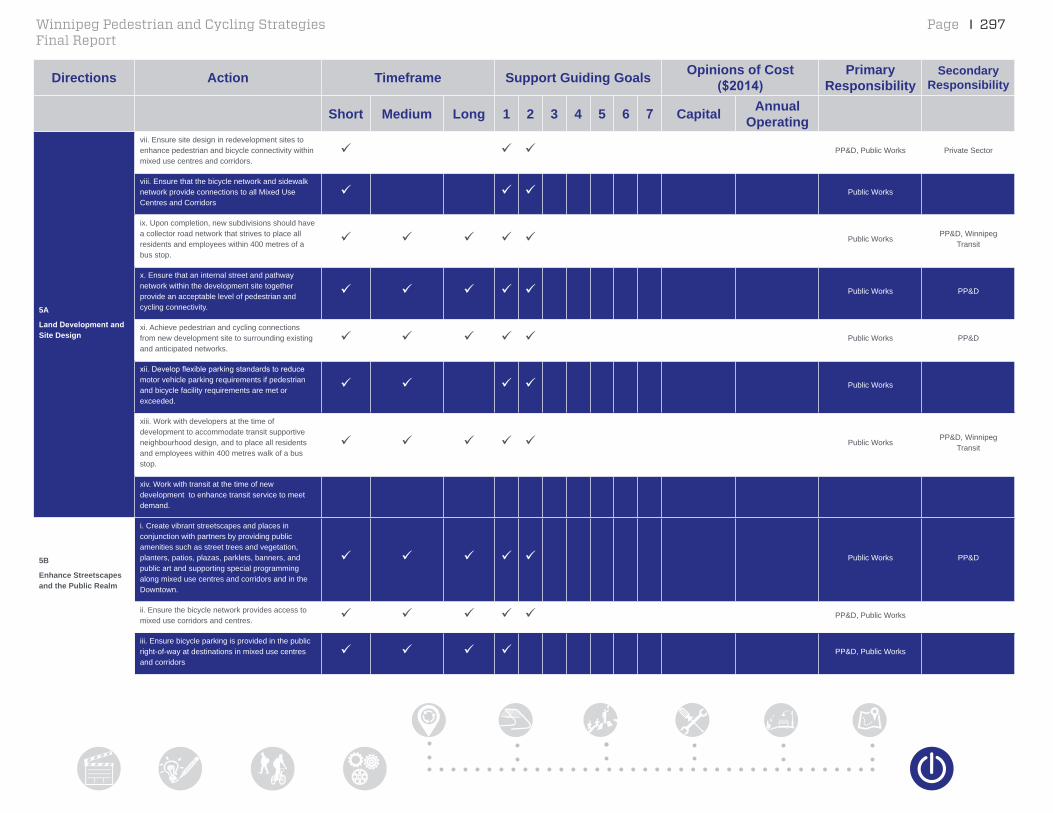
Page I 297Winnipeg Pedestrian and Cycling StrategiesFinal Report
Directions Action Timeframe Support Guiding Goals Opinions of Cost ($2014)
Primary Responsibility
Secondary Responsibility
Short Medium Long 1 2 3 4 5 6 7 Capital Annual Operating
5A
Land Development and Site Design
vii. Ensure site design in redevelopment sites to enhance pedestrian and bicycle connectivity within mixed use centres and corridors.
PP&D, Public Works Private Sector
viii. Ensure that the bicycle network and sidewalk network provide connections to all Mixed Use Centres and Corridors
Public Works
ix. Upon completion, new subdivisions should have a collector road network that strives to place all residents and employees within 400 metres of a bus stop.
Public WorksPP&D, Winnipeg
Transit
x. Ensure that an internal street and pathway network within the development site together provide an acceptable level of pedestrian and cycling connectivity.
Public Works PP&D
xi. Achieve pedestrian and cycling connections from new development site to surrounding existing and anticipated networks.
Public Works PP&D
xii.Developflexibleparkingstandardstoreducemotor vehicle parking requirements if pedestrian and bicycle facility requirements are met or exceeded.
Public Works
xiii. Work with developers at the time of development to accommodate transit supportive neighbourhood design, and to place all residents and employees within 400 metres walk of a bus stop.
Public WorksPP&D, Winnipeg
Transit
xiv. Work with transit at the time of new development to enhance transit service to meet demand.
5B
Enhance Streetscapes and the Public Realm
i. Create vibrant streetscapes and places in conjunction with partners by providing public amenities such as street trees and vegetation, planters, patios, plazas, parklets, banners, and public art and supporting special programming along mixed use centres and corridors and in the Downtown.
Public Works PP&D
ii. Ensure the bicycle network provides access to mixed use corridors and centres. PP&D, Public Works
iii. Ensure bicycle parking is provided in the public right-of-way at destinations in mixed use centres and corridors
PP&D, Public Works
298 I Page Winnipeg Pedestrian and Cycling StrategiesFinal Report
Page I 299Winnipeg Pedestrian and Cycling StrategiesFinal Report

300 I Page Winnipeg Pedestrian and Cycling StrategiesFinal Report
Directions Action Timeframe Support Guiding Goals Opinions of Cost ($2014)
Primary Responsibility
Secondary Responsibility
Short Medium Long 1 2 3 4 5 6 7 Capital Annual Operating
Strategic Direction 6: Increase Awareness
6A
Enhanced Wayfinding, Signage and Trip Planning
i.DevelopPedestrianandCyclingWayfindingGuidelines. Public Works
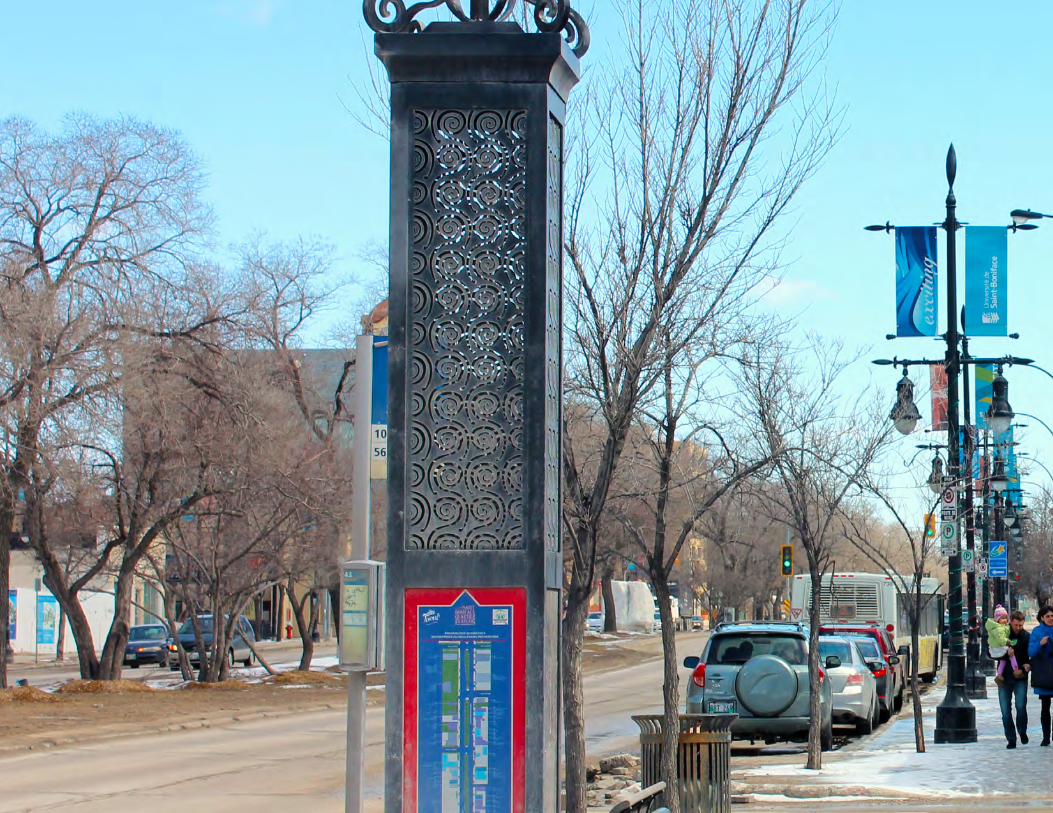
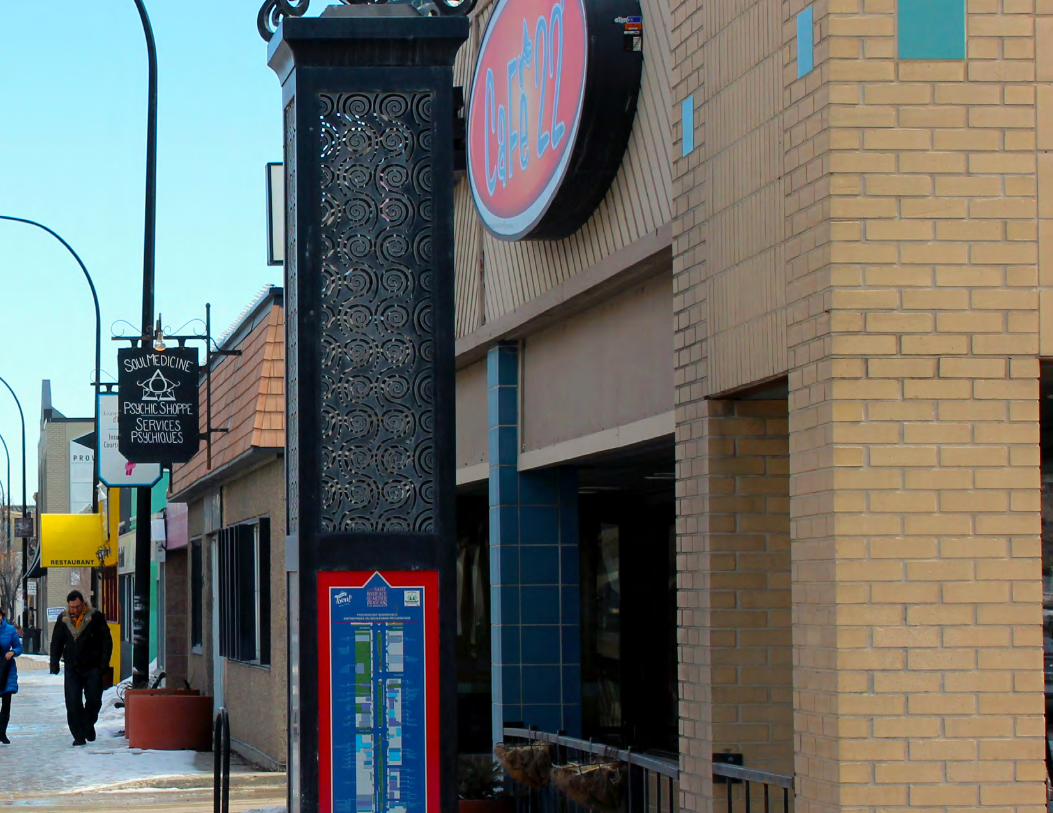
ii.EnhanceandExpandPedestrianWayfindingInformation in the Downtown as well as community and neighbourhood mixed use centres and corridors.
$300K PP&DPublic Works, BIZ
Associations
iii. Continue to produce and annually update the City-Wide Cycling Map. $50K Public Works
iv. Develop Neighbourhood-Based Walking and Cycling Maps. $50K Public Works PP&D
6B
Improve Education and Awareness
i. Make bicycle and pedestrian trip planning information widely accessible through an interactive trip planning tool and mobile application.
Public Works
ii. Support and encourage targeted community outreach programs for vulnerable populations. $10K PP&D
Public Works, External Stakeholders,
Residential Association
iii. Continue to support Active and Safe Routes to School programming. $50K Public Works
PP&D, External Stakeholders
iv. Support providing bicycle education and skills training for students in elementary, middle, and high school
Public Works
v. Support the development of Bicycle-Friendly Business Districts. $10K Public Works
BIZ Associations, Private Sector, PP&D
vi. Support the development of a bicycle tourism initiative. $10K External Stakeholders PP&D
vii. Work with partners to develop and deliver informationmaterialsoutliningthebenefitsofwalking and cycling.
$10K PP&D, Public Works
Business Associations, External Stakeholders/Community Groups (ie. Bke Winnipeg, Green
Action Centre)
viii. Support the development of a road safety awareness campaign for all road users. $50K
Public Works, External Stakeholders
External Stakeholders
ix. Work with partners to develop an education campaign targeted towards motorists. Public Works, External
Stakeholders
x. Work with the Province and Manitoba Public Insurance to include information about cycling as part of driver education and included in driver’s license test.
Public Works, External Stakeholders
xi. Support the provision of adult education and cycling skills training throughout the City year-round.
Public Works
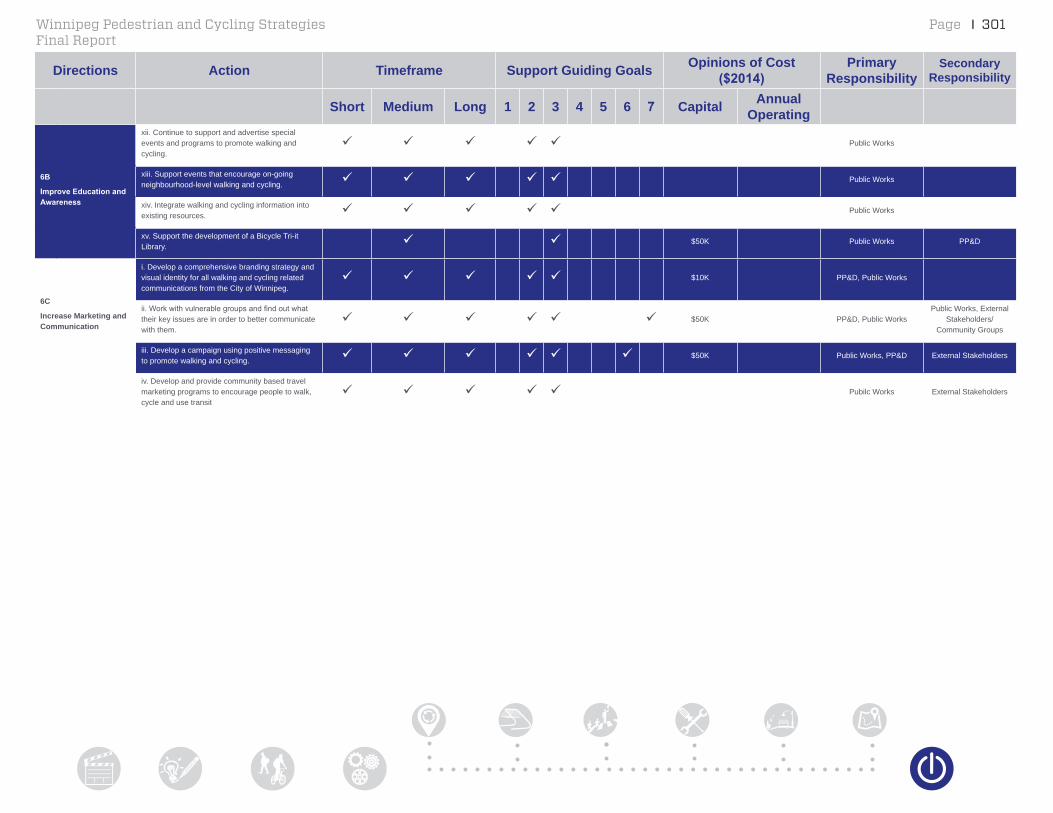
Page I 301Winnipeg Pedestrian and Cycling StrategiesFinal Report
Directions Action Timeframe Support Guiding Goals Opinions of Cost ($2014)
Primary Responsibility
Secondary Responsibility
Short Medium Long 1 2 3 4 5 6 7 Capital Annual Operating
6B
Improve Education and Awareness
xii. Continue to support and advertise special events and programs to promote walking and cycling.
Public Works
xiii. Support events that encourage on-going neighbourhood-level walking and cycling. Public Works
xiv. Integrate walking and cycling information into existing resources. Public Works
xv. Support the development of a Bicycle Tri-it Library. $50K Public Works PP&D
6C
Increase Marketing and Communication
i. Develop a comprehensive branding strategy and visual identity for all walking and cycling related communications from the City of Winnipeg.
$10K PP&D, Public Works
ii.Workwithvulnerablegroupsandfindoutwhattheir key issues are in order to better communicate with them.
$50K PP&D, Public WorksPublic Works, External
Stakeholders/Community Groups
iii. Develop a campaign using positive messaging to promote walking and cycling. $50K Public Works, PP&D External Stakeholders
iv. Develop and provide community based travel marketing programs to encourage people to walk, cycle and use transit
Pubilc Works External Stakeholders
302 I Page Winnipeg Pedestrian and Cycling StrategiesFinal Report
4. Level of Protection
5. Walking & Cycling Potential
6. Equity
7. Safety
8. Network Spine
Each criterion contains scoreable information about a facility’s ability to address an existing or future need in the City of Winnipeg. Each criterion was scoredonafive-pointscale,andtheresultswerecombined to generate an overall score for each new or upgraded pedestrian and cycling facility in the City. By combining these scores into an aggregated, a ranked project list can be developed thatreflectseachproject’srelativeprioritylevelforimplementation. The results of the analysis are not intended to be cast-in-stone, but rather to provide a flexibletooltoassisttheCityinitson-goingdecisionmaking. Each of the criteria are described in further detail below:
5.1.4 Network Prioritization
The Pedestrian and Cycling Strategies include a network of recommended pedestrian and bicycle facilities over the long-term. The implementation priorities identified in theprevioussection identifydeveloping a complete, connected and dense bicycle network and eliminating gaps in the sidewalk network as on-going priorities. This section provides the City with a prioritization process to identify priorities to improve the pedestrian and cycling network over the short-term (0 to 5 years), medium-term (5 to 10 years), and long-term (10 years and beyond).
An objective, systematic, GIS-based prioritization methodology was developed for the Pedestrian and Cycling Strategies. The prioritization methodology incorporatestheguidingprinciplesidentifiedearlierin this report and includes a Multiple Account Evaluation (MAE) that assesses each pedestrian and bicycle facility on each individual criterion. The MAE methodology includes eight criteria:
1. Network Connectivity
2. Generators
3. Access to Transit

Page I 303Winnipeg Pedestrian and Cycling StrategiesFinal Report
� Generators
This criterion measures the number of pedestrian and cycling generators in close proximity to the proposed pedestrian or bicycle facility. Improvements with a greater number of generators are likely to generate a higher demand for walking and cycling. Pedestrian and cycling generators included the Downtown, Regional Mixed Use Centres and Corridors identified in OurWinnipeg, as wellas schools and parks. The Generators score was determined by calculating the percentage of the proposed facility that was located within each buffer area. The scoring for Generators is shown below:
� Network Connectivity
This criterion measures the degree to which the proposed improvement addresses gap in the sidewalk or bicycle network. This assessment was based on the Gap Analysis that was completed for this study, and is based on the identificationofAreaGapsandSpotGaps.Thiscriterion included two separate analysis. An Area Gap Analysis was conducted to identify areas beyond a 200 metre buffer from an existing facility in the downtown core, and beyond a 400 meter buffer outside of the downtown area. The Area Gap score was generated by calculating the percentage of the proposed facility that was located within the area gap buffer. The Spot Gap Analysis was conducting by assigning cumulative scores for each type of Spot Gap. The scoring for Network Connectivity is shown below:
2 points3 points2 points1 point
Area GapNetwork GapQuality Gap
Crossing Gap
5 points4 points3 points2 points1 point
Within the Downtown Area Within 500m of Multi-Use Centre
Within a Multi-Use Corridor Within 500m of Multi-Use Corridor
Within 500m of a School or Park
304 I Page Winnipeg Pedestrian and Cycling StrategiesFinal Report
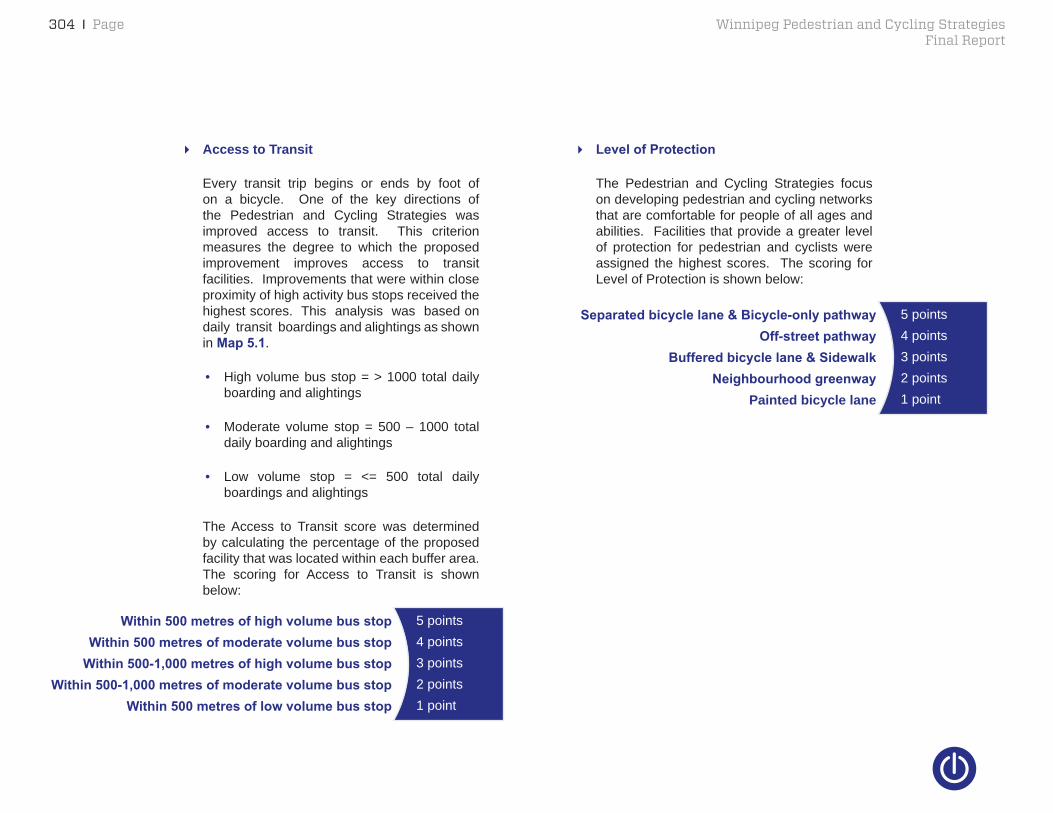
� Level of Protection
The Pedestrian and Cycling Strategies focus on developing pedestrian and cycling networks that are comfortable for people of all ages and abilities. Facilities that provide a greater level of protection for pedestrian and cyclists were assigned the highest scores. The scoring for Level of Protection is shown below:
� Access to Transit
Every transit trip begins or ends by foot of on a bicycle. One of the key directions of the Pedestrian and Cycling Strategies was improved access to transit. This criterion measures the degree to which the proposed improvement improves access to transit facilities. Improvements that were within close proximity of high activity bus stops received the highest scores. This analysis was based on daily transit boardings and alightings as shown in Map 5.1.
• High volume bus stop = > 1000 total daily boarding and alightings
• Moderate volume stop = 500 – 1000 total daily boarding and alightings
• Low volume stop = <= 500 total daily boardings and alightings
The Access to Transit score was determined by calculating the percentage of the proposed facility that was located within each buffer area. The scoring for Access to Transit is shown below:
5 points4 points3 points2 points1 point
Within 500 metres of high volume bus stopWithin 500 metres of moderate volume bus stop
Within 500-1,000 metres of high volume bus stopWithin 500-1,000 metres of moderate volume bus stop
Within 500 metres of low volume bus stop
5 points4 points3 points2 points1 point
Separated bicycle lane & Bicycle-only pathwayOff-street pathway
Buffered bicycle lane & SidewalkNeighbourhood greenway
Painted bicycle lane

Page I 305Winnipeg Pedestrian and Cycling StrategiesFinal Report Map 5.1:
Access to Transit

Page I 307Winnipeg Pedestrian and Cycling StrategiesFinal Report Map 5.2:
Reported Bicycle Collisions Between 2006 and 2010

308 I Page Winnipeg Pedestrian and Cycling StrategiesFinal ReportMap 5.3:
Reported Pedestrian Collisions Between 2006 and 2010
Page I 309Winnipeg Pedestrian and Cycling StrategiesFinal Report
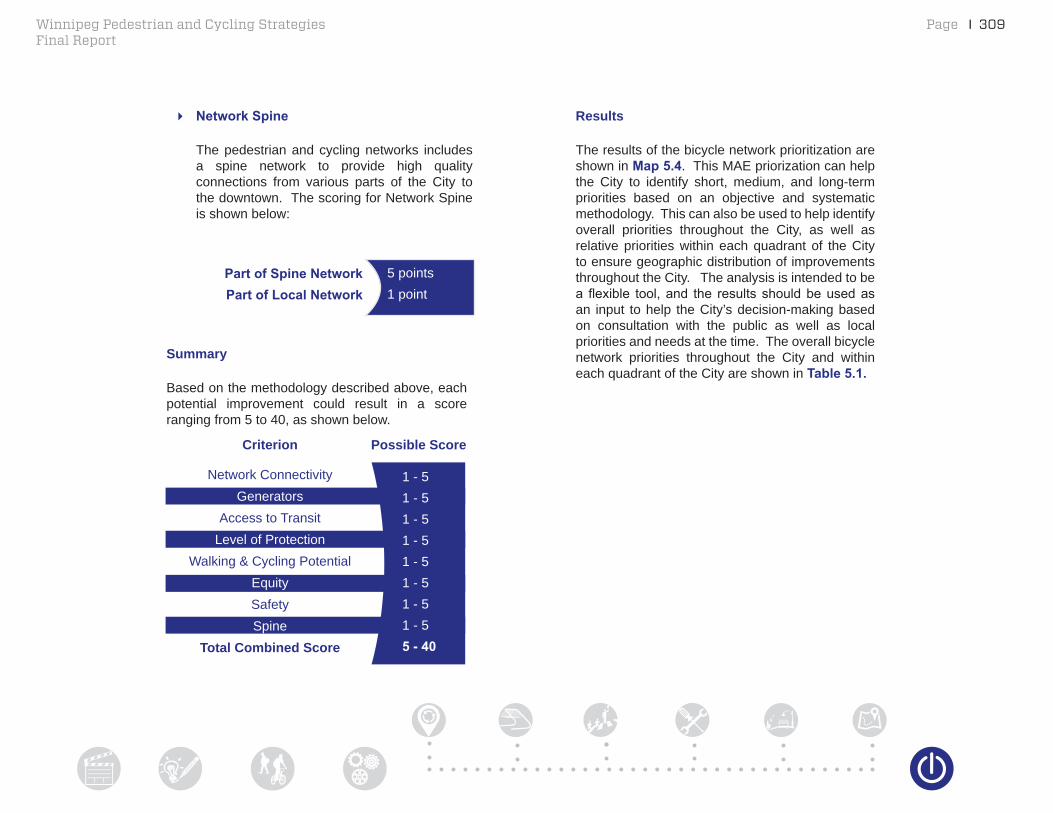
Summary
Based on the methodology described above, each potential improvement could result in a score ranging from 5 to 40, as shown below.
1 - 51 - 51 - 51 - 51 - 51 - 51 - 51 - 55 - 40
Network Connectivity
Criterion
GeneratorsAccess to Transit
Level of ProtectionWalking & Cycling Potential
EquitySafetySpine
Total Combined Score
Possible Score
� Network Spine
The pedestrian and cycling networks includes a spine network to provide high quality connections from various parts of the City to the downtown. The scoring for Network Spine is shown below:
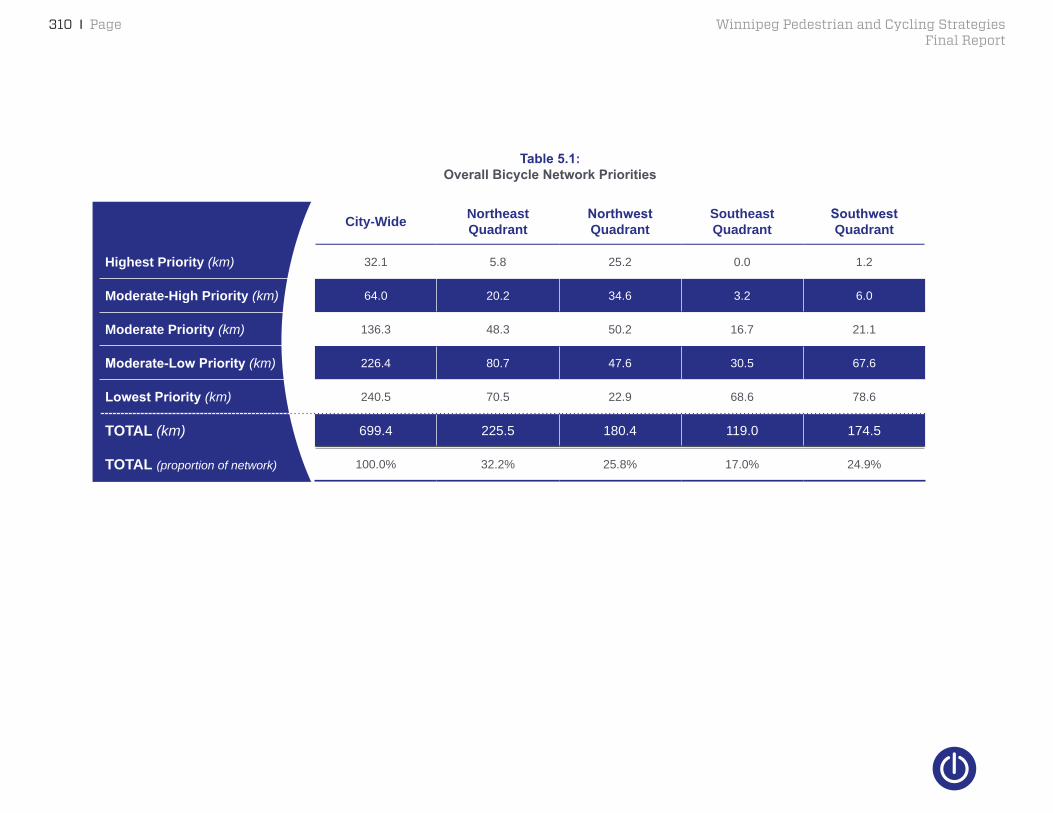
Results
The results of the bicycle network prioritization are shown in Map 5.4. This MAE priorization can help the City to identify short, medium, and long-term priorities based on an objective and systematic methodology. This can also be used to help identify overall priorities throughout the City, as well as relative priorities within each quadrant of the City to ensure geographic distribution of improvements throughout the City. The analysis is intended to be aflexible tool,and the results shouldbeusedasan input to help the City’s decision-making based on consultation with the public as well as local priorities and needs at the time. The overall bicycle network priorities throughout the City and within each quadrant of the City are shown in Table 5.1.
5 points1 point
Part of Spine NetworkPart of Local Network
310 I Page Winnipeg Pedestrian and Cycling StrategiesFinal Report
City-Wide Northeast Quadrant
Northwest Quadrant
Southeast Quadrant
Southwest Quadrant
Highest Priority (km) 32.1 5.8 25.2 0.0 1.2
Moderate-High Priority (km) 64.0 20.2 34.6 3.2 6.0
Moderate Priority (km) 136.3 48.3 50.2 16.7 21.1
Moderate-Low Priority (km) 226.4 80.7 47.6 30.5 67.6
Lowest Priority (km) 240.5 70.5 22.9 68.6 78.6
TOTAL (km) 699.4 225.5 180.4 119.0 174.5
TOTAL (proportion of network) 100.0% 32.2% 25.8% 17.0% 24.9%
Table 5.1:
Overall Bicycle Network Priorities
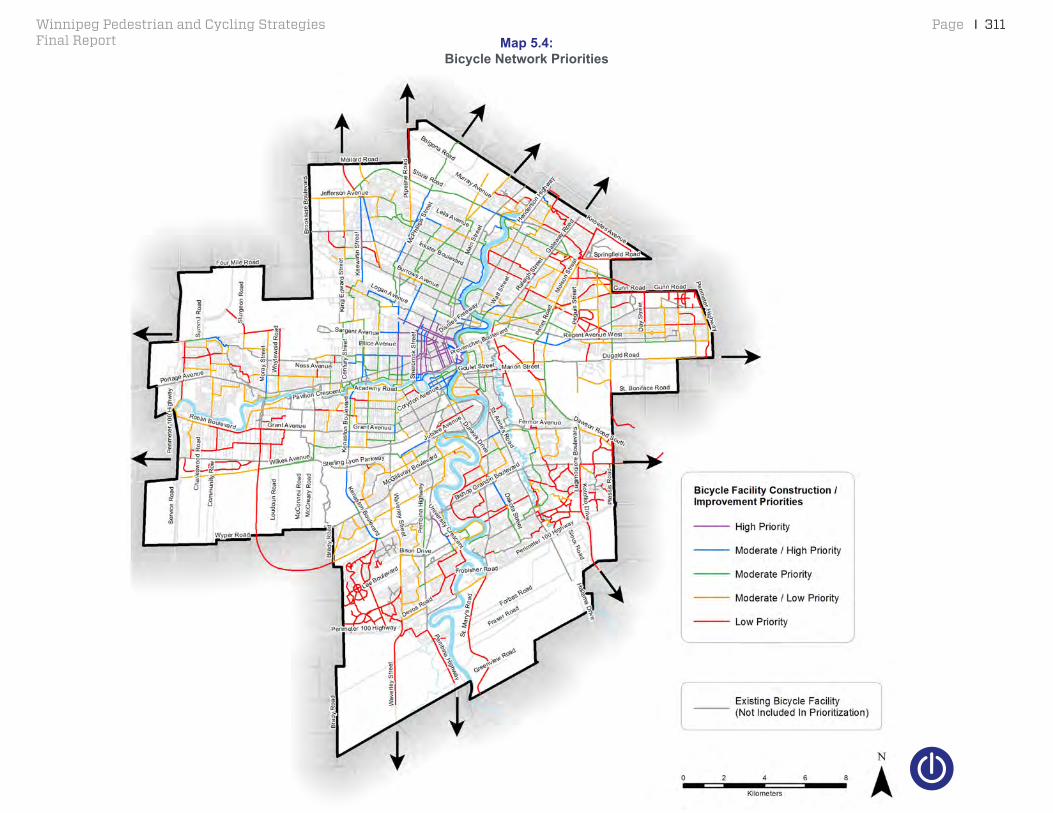
Page I 311Winnipeg Pedestrian and Cycling StrategiesFinal Report Map 5.4:
Bicycle Network Priorities
312 I Page Winnipeg Pedestrian and Cycling StrategiesFinal Report
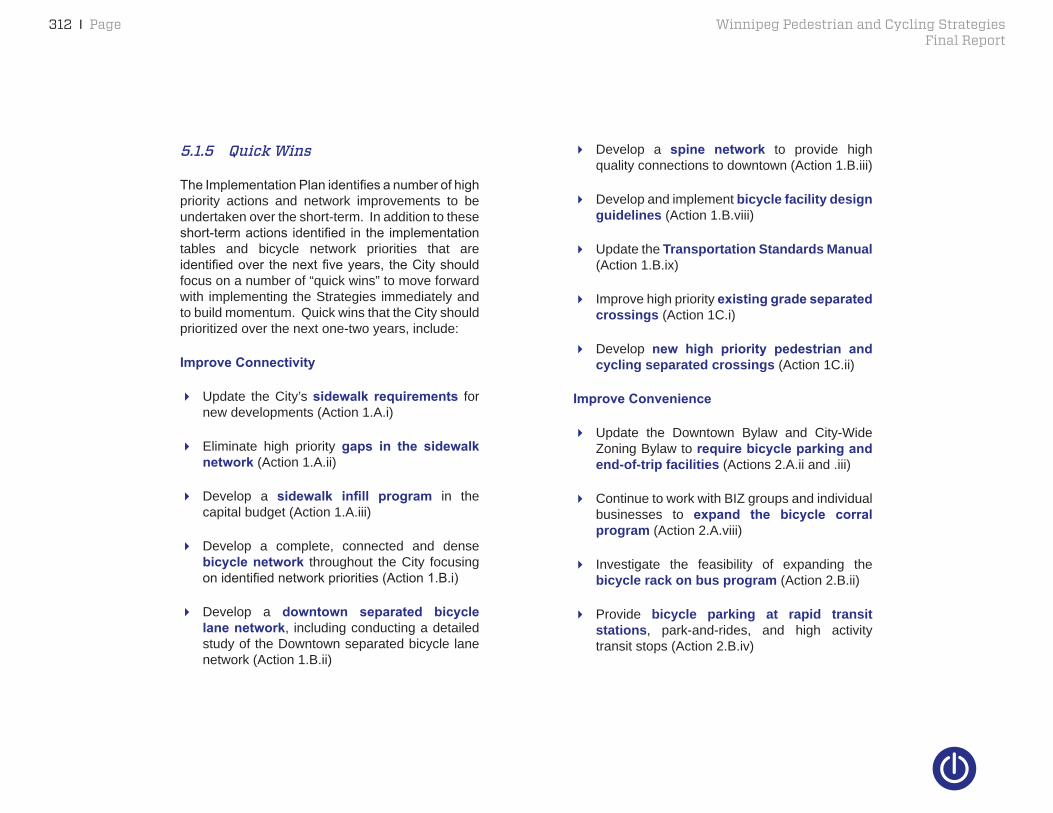
� Develop a spine network to provide high quality connections to downtown (Action 1.B.iii)
� Develop and implement bicycle facility design guidelines (Action 1.B.viii)
� Update the Transportation Standards Manual (Action 1.B.ix)
� Improve high priority existing grade separated crossings (Action 1C.i)
� Develop new high priority pedestrian and cycling separated crossings (Action 1C.ii)
Improve Convenience
� Update the Downtown Bylaw and City-Wide Zoning Bylaw to require bicycle parking and end-of-trip facilities (Actions 2.A.ii and .iii)
� Continue to work with BIZ groups and individual businesses to expand the bicycle corral program (Action 2.A.viii)
� Investigate the feasibility of expanding the bicycle rack on bus program (Action 2.B.ii)
� Provide bicycle parking at rapid transit stations, park-and-rides, and high activity transit stops (Action 2.B.iv)
5.1.5 Quick Wins
TheImplementationPlanidentifiesanumberofhighpriority actions and network improvements to be undertaken over the short-term. In addition to these short-termactionsidentifiedintheimplementationtables and bicycle network priorities that are identifiedoverthenextfiveyears,theCityshouldfocus on a number of “quick wins” to move forward with implementing the Strategies immediately and to build momentum. Quick wins that the City should prioritized over the next one-two years, include:
Improve Connectivity
� Update the City’s sidewalk requirements for new developments (Action 1.A.i)
� Eliminate high priority gaps in the sidewalk network (Action 1.A.ii)
� Develop a sidewalk infill program in the capital budget (Action 1.A.iii)
� Develop a complete, connected and dense bicycle network throughout the City focusing onidentifiednetworkpriorities(Action1.B.i)
� Develop a downtown separated bicycle lane network, including conducting a detailed study of the Downtown separated bicycle lane network (Action 1.B.ii)
306 I Page Winnipeg Pedestrian and Cycling StrategiesFinal Report
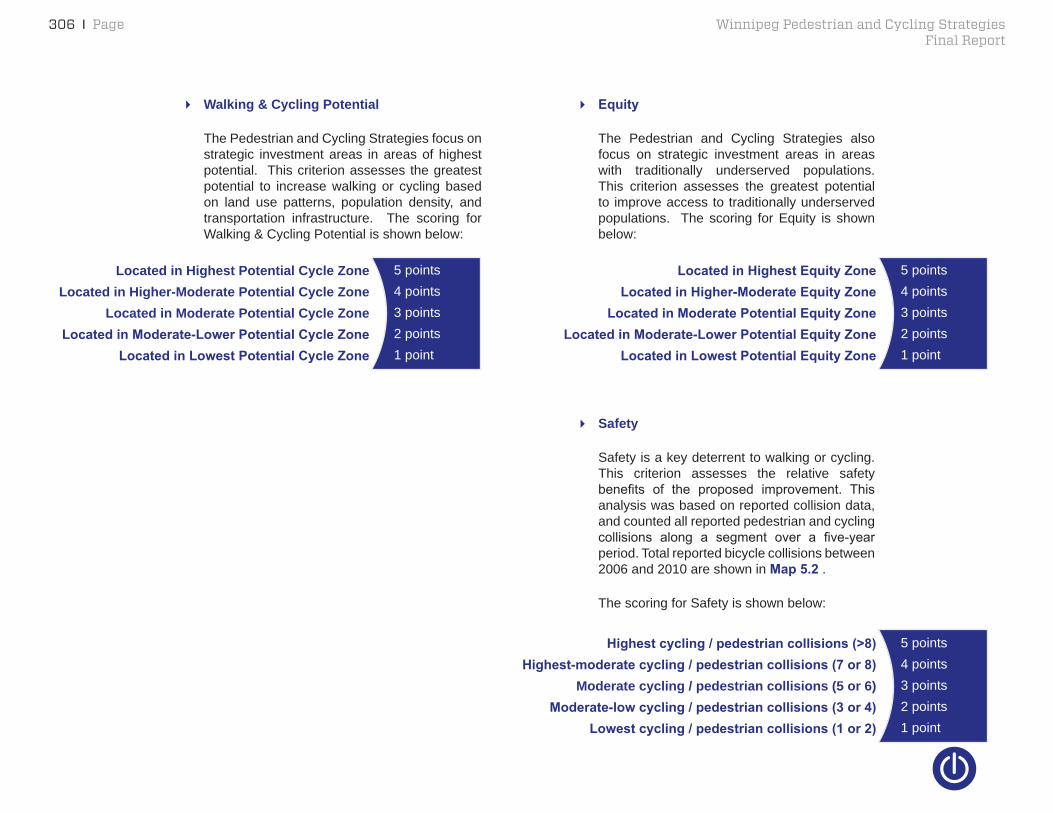
� Safety
Safety is a key deterrent to walking or cycling. This criterion assesses the relative safety benefits of the proposed improvement. Thisanalysis was based on reported collision data, and counted all reported pedestrian and cycling collisions along a segment over a five-yearperiod. Total reported bicycle collisions between 2006 and 2010 are shown in Map 5.2 .
The scoring for Safety is shown below:
5 points4 points3 points2 points1 point
Highest cycling / pedestrian collisions (>8)Highest-moderate cycling / pedestrian collisions (7 or 8)
Moderate cycling / pedestrian collisions (5 or 6)Moderate-low cycling / pedestrian collisions (3 or 4)
Lowest cycling / pedestrian collisions (1 or 2)
� Equity
The Pedestrian and Cycling Strategies also focus on strategic investment areas in areas with traditionally underserved populations. This criterion assesses the greatest potential to improve access to traditionally underserved populations. The scoring for Equity is shown below:
� Walking & Cycling Potential
The Pedestrian and Cycling Strategies focus on strategic investment areas in areas of highest potential. This criterion assesses the greatest potential to increase walking or cycling based on land use patterns, population density, and transportation infrastructure. The scoring for Walking & Cycling Potential is shown below:
5 points4 points3 points2 points1 point
Located in Highest Potential Cycle ZoneLocated in Higher-Moderate Potential Cycle Zone
Located in Moderate Potential Cycle ZoneLocated in Moderate-Lower Potential Cycle Zone
Located in Lowest Potential Cycle Zone
5 points4 points3 points2 points1 point
Located in Highest Equity ZoneLocated in Higher-Moderate Equity Zone
Located in Moderate Potential Equity ZoneLocated in Moderate-Lower Potential Equity Zone
Located in Lowest Potential Equity Zone
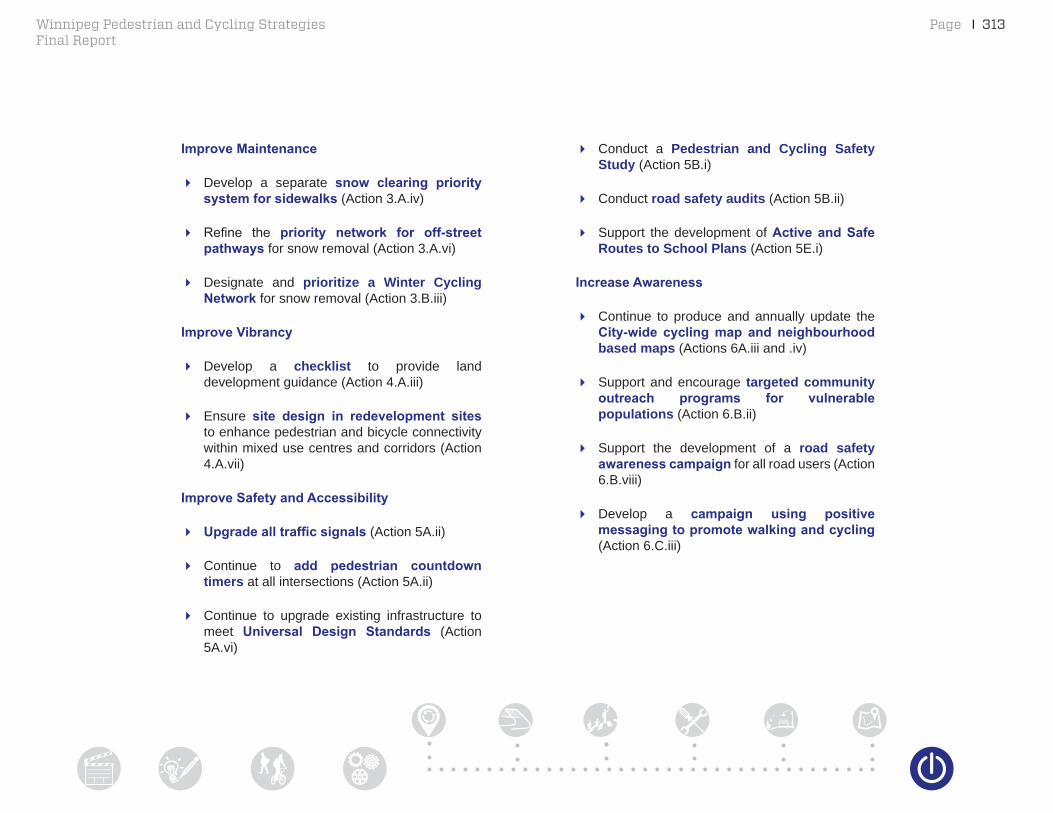
Page I 313Winnipeg Pedestrian and Cycling StrategiesFinal Report
� Conduct a Pedestrian and Cycling Safety Study (Action 5B.i)
� Conduct road safety audits (Action 5B.ii)
� Support the development of Active and Safe Routes to School Plans (Action 5E.i)
Increase Awareness
� Continue to produce and annually update the City-wide cycling map and neighbourhood based maps (Actions 6A.iii and .iv)
� Support and encourage targeted community outreach programs for vulnerable populations (Action 6.B.ii)
� Support the development of a road safety awareness campaign for all road users (Action 6.B.viii)
� Develop a campaign using positive messaging to promote walking and cycling (Action 6.C.iii)
Improve Maintenance
� Develop a separate snow clearing priority system for sidewalks (Action 3.A.iv)
� Refine the priority network for off-street pathways for snow removal (Action 3.A.vi)
� Designate and prioritize a Winter Cycling Network for snow removal (Action 3.B.iii)
Improve Vibrancy
� Develop a checklist to provide land development guidance (Action 4.A.iii)
� Ensure site design in redevelopment sites to enhance pedestrian and bicycle connectivity within mixed use centres and corridors (Action 4.A.vii)
Improve Safety and Accessibility
� Upgrade all traffic signals (Action 5A.ii)
� Continue to add pedestrian countdown timers at all intersections (Action 5A.ii)
� Continue to upgrade existing infrastructure to meet Universal Design Standards (Action 5A.vi)
314 I Page Winnipeg Pedestrian and Cycling StrategiesFinal Report
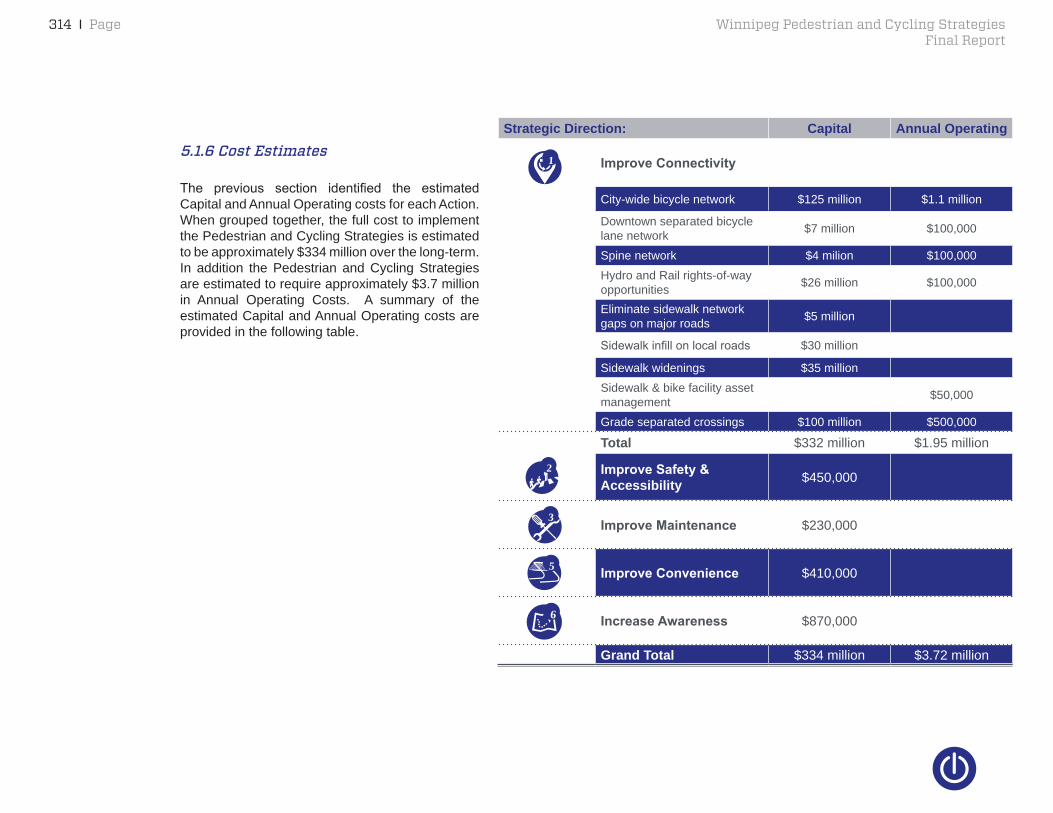
Strategic Direction: Capital Annual Operating
Improve Connectivity
City-wide bicycle network $125 million $1.1 million
Downtown separated bicycle lane network $7 million $100,000
Spine network $4 milion $100,000Hydro and Rail rights-of-way opportunities $26 million $100,000
Eliminate sidewalk network gaps on major roads $5 million
Sidewalkinfillonlocalroads $30 million
Sidewalk widenings $35 millionSidewalk & bike facility asset management $50,000
Grade separated crossings $100 million $500,000
Total $332 million $1.95 million
Improve Safety & Accessibility $450,000
Improve Maintenance $230,000
Improve Convenience $410,000
Increase Awareness $870,000
Grand Total $334 million $3.72 million
5.1.6 Cost Estimates
The previous section identified the estimatedCapital and Annual Operating costs for each Action. When grouped together, the full cost to implement the Pedestrian and Cycling Strategies is estimated to be approximately $334 million over the long-term. In addition the Pedestrian and Cycling Strategies are estimated to require approximately $3.7 million in Annual Operating Costs. A summary of the estimated Capital and Annual Operating costs are provided in the following table.
1
2
3
5
6

Page I 315Winnipeg Pedestrian and Cycling StrategiesFinal Report
• Non-regional sidewalks: Establish a new budget for 2015
• Pedestrian and bicycle crossings: Establish a reserve fund to accumulate funds for crossing improvements.
� Integration. The City should integrate cycling and pedestrian improvements with other plans and projects, where possible. In fact, approximately $55 million of the proposed pedestrian and bicycle networks will be funded through existing road renewal programs, development projects and major capital projects
� Strategic Internal and External Partnerships. To help implement the plan and leverage funding from other sources, the City should seek funding from other levels of governments, partnerships with the development industry, and integration of cycling and pedestrian improvements with other plans and projects.
5.1.7 Funding Strategy
Although the Pedestrian and Cycling Strategies are estimated to cost approximately $334 million overthelong-term,thesecostscanbesignificantlyreduced by pursuing external funding sources and partnershipopportunitiesformanyoftheidentifiedActions. This section describes several funding strategies and potential funding sources that the City may consider to help leverage its investments and to maximize its ability to implement transportation improvements.
� Capital Planning. The City should implement the plans by incorporating the recommendations into itsshort,medium,and long-termfinancialplans to ensure that projects are accounted for in the City’s capital planning process. In that regard, the City should seek changes to its Capital Budget to fund implementation of the Strategies, including:
• Bicycle corridors – double the budget by 2017
• Recreational walkways and bicycle pathways: triple the budget by 2017
• New regional sidewalks on regional sidewalks:increasethebudgetbyfivetimesby 2017

316 I Page Winnipeg Pedestrian and Cycling StrategiesFinal Report
� Staff Resources. Implementation of the Pedestrian and Cycling Strategies includes not onlyadditionalfinancialresources,buttheCityrequires additional staff resources to implement the various strategies. The TMP commits to allocatingsufficientfundinginfuturecapitalandoperating budgets to complete the pedestrian and cycling networks (Enabling Strategy (d) in the pedestrian and cycling section).
Dedicated bicycle and pedestrian program managers are common in North American cities and, along with other transportation planners and bicycling advocates, are a critical part of creating a walkable and bicycle-friendly community. The Alliance for Bicycling and Walking recently conducted an analysis of staffing in 40 of the largest American cities,which showed that cities with bicycle and pedestrian staff had higher levels of bicycling than the cities without staff. Cities with larger staff – both in count and per capita – had higher levels of bicycling and walking than cities with smaller staffs.
More than half of the responding cities had one or two staff spending at least part of their time on walking and cycling, while one quarter of the cities had more than four staff working on pedestrian and cycling issues. On a per capita basis, nearly three quarters of the sample cities
had more than one bicycle and pedestrian staff member per million residents, with one quarter of the cities employing six or more staff per one million residents as shown in Figure 5.1. The study also found that the cities with the largest dedicated pedestrian and cycling staff members are not always the largest cities. For example, Minneapolis, MN is the 46th largest city in the United States, but has the largest pedestrian and cycling staff in the United States with nineteen employees. Minneapolis also has the
Figure 5.1:
Bike/Ped Staff (Per Million People) in 40 of the Largest US Cities
Winnipeg Pedestrian and Cycling StrategiesFinal Report
second highest rate of bicycle commuting in the sample with 4.3 percent. Comparing staffinglevels to the commuter data shows that larger bicycle and pedestrian staffs are correlated with higher active transportation commuter levels. The cities without dedicated staff had the lowest average bicycle commuter share. As the size of a city’s staff increased, the average bicycle commuter mode share also increased. Cities with more than four staff averaged a ten times greater share of bicycle commuters than cities without dedicated staff.

318 I Page Winnipeg Pedestrian and Cycling StrategiesFinal Report
Asurveywasalsoconductedofstaffinglevelsin a range of Canadian cities. Dedicated bicycle and pedestrian staff in Canadian citieis ranged from two Full Time Equivalent (FTE) staff in smaller cities such as Saskatoon and Halifax, to 10.5 FTEs in Calgary and 19 FTEs in Vancouver. A summary of the staff breakdown for a sample of Canadian cities is provided in Table 5.2 below. Based on this, it is
recommended that the City of Winnipeg’s dedicated bicycle and pedestrian staff levels should be approximately 0.75 FTE per 100,000 residents in the short-term, resulting in a need for approximately 5 FTE staff in the short-term. This should increase over the long-term to be at minimum 1.0 FTE per 100,000 residents. With the City’s population growth, thisi would result in a minimum of 8 FTE staff over the long-term.
Full-Time Equivalent (FTE) Staff
2 FTEs 2 FTEs 10.5 FTEs 19 FTEs
Approximate Population 260,000 410,000 1,100,000 600,000
FTE/ 100,000 Residents 0.77 0.49 0.95 3.17
Description • 1 engineer who directs the bicycle program (5% of time)
• 1trafficEngineer(50% of time on the bicycle program and 50% on pedestrian safety issues)
• 1 engineer, Manager (20% of time on pedestrian issues)
• Technologist • Drafting tech
• 1 dedicated AT coordinator (100% of time)
• 1 supervisor (40% of time)
• A number of engineers and techologists in the Design and Construction unit that likely uses 0.5 people per year from the unit
• 1 projects leader• 1 bicycle coordinator
• 3.5trafficengineers• 1 education/ encouragement planner
• 1 EIT• 1.5 planners• 1 construction project manager
• .5 designer• .5 communicator
• 1 branch manager • 5 project/senior engineers
• 1 junior engineer/EIT
• 3 landscape architects/designers
• 6 engineering assistants
• 3 stakeholder and community relations staff
• 1 student
City City of Saskatoon
Halifax Regional Municipality
City of Calgary
City of Vancouver
Table 5.2:
Bike/Ped Staff (Per Million People) in 40 of the Largest US Cities
� In addition to maintaining a dedicated full-time Pedestrian and Cycling Coordinator position, this should include at least four dedicated full-time staff resources in the following positions:
• Bicycle and Pedestrian Design Engineer
• Bicycle and Pedestrian Planner
• Bicycle and Pedestrian Education and Promotion Coordinator
As noted previously, the City should pursue all available internal and external strategic partnerships to leverage funding for pedestrian and cycling facilities and programs, including the programs identified below.As funding opportunities changeregularly, the information in this section is subject to change. The City should regularly check with all levels of government to keep up to date on current funding opportunities.
� Provincial Programs and Initiatives.
• The City of Winnipeg is the lead on deciding when and where to build local pedestrian and cycling and trail facilities within the city limits. However, the Province is committed to supporting safe pedestrian and cycling connections and will continue to cost-share critical infrastructure for Winnipeg in the years ahead.
Page I 319Winnipeg Pedestrian and Cycling StrategiesFinal Report
320 I Page Winnipeg Pedestrian and Cycling StrategiesFinal Report
contribute the remaining funds, and in some instances, there may be private sector investment as well.
� Green Municipal Funds. The Federation of Canadian Municipalities manages the Green Municipal Fund, with a total allocation of $550 million. This fund is intended to support municipal government efforts to reduce pollution, reduce greenhouse gas emissions and improve quality of life. The expectation is that knowledge and experience gained in best practices and innovative environmental projects will be applied to national infrastructure projects.
� Private sector. Many corporations wish to be good corporate neighbours — to be active in the community and to promote environmentally-beneficial causes. Bicycleand pedestrian facilities are well-suited to corporate sponsorship, and have attracted significant sponsorship both at the local leveland throughout North America.
� Advertising. There are several options for obtaining funding for transportation projects from advertising revenues. For example, the costs of producing and distributing a bicycle route map can be partially or fully offset by selling advertising space on the map. Advertising on
• In terms of funding, the Province has a long history of supporting municipal infrastructure (including roads, bridges and active transportation) in Winnipeg and other municipalities throughout Manitoba. Since 2000, the Province of Manitoba has committed over $40M to pedestrian and cycling facilities and programming across Manitoba and Budget 2014 adds to this.
• Budget2014announcedafive-year,$250Mroad improvement plan for Winnipeg. $50M will be invested in 2014 to improve existing regional streets, residential streets and back lanes, including a dedicated $1.45M investment for sidewalks, recreational walkways and bike paths. A further $22.7M will be invested in 2014 for regional streets projects. These projects can potentially include a pedestrian and cycling component due to Winnipeg’s policy to consider pedestrians and cycling when rehabilitating streets that are part of the pedestrian and cycling network.
� Infrastructure Canada manages several programs that provide funding for environmental and local transportation infrastructure projects in municipalities across Canada. Typically, the federal government contributes one-third of the cost of municipal infrastructure projects. Provincial and municipal governments
Page I 321Winnipeg Pedestrian and Cycling StrategiesFinal Report
changing conditions which would require changes to the Strategies.
The monitoring program needs to be:
� Meaningful. The monitoring strategy should yield meaningful results and point to the success in achieving the vision, goals and targets of the Pedestrian and Cycling Strategies.
� Measurable. The monitoring program needs to establish criteria that are readily measurable and for which data or information can be readily obtained.
� Manageable. The monitoring program needs to take into account the resource limitations of the City and will identify measures where information is accessible or data is simple to collect.
The monitoring program will focus on identifying ‘measuresof success’ for two components: first,the degree of progress in implementing the plan, and secondly, the outcomes of the plan. Measures of success are described in the table below, including general measures of success for the overall Pedestrian and Cycling Strategies, as well as specific measures of success related to eachStrategic Direction.
bicycle racks and transit shelters can reduce the costs of providing those facilities. There are three bill boards located on the Northeast Pioneers Greenway. The $9,000 annual revenue from these bill boards is used by the stewardship group to improve and maintain the pathway.
� Partnerships. The City should build on its successful partnerships with other agencies, theprivatesector,andthenot-for-profitsectortohelp implement many Actions in the Pedestrian and Cycling Strategies. The City should continue to work closely with partners such as the Green Action Centre, Bike Winnipeg, Rivers West, Tourism Winnipeg, Business Associations, Community Bike Shops, and others to help implement the Pedestrian and Cycling Strategies.
5.2 Monitoring Plan
A monitoring strategy is essential to ensure that the Pedestrian and Cycling Strategies are implemented as intended, and to determine whether the plan is achieving its goals. A monitoring program will also enable City staff to appropriately allocate monetary and staff resources and to implement prioritized initiatives of the Pedestrian and Cycling Strategies. Monitoring also provides a means of identifying
322 I Page Winnipeg Pedestrian and Cycling StrategiesFinal Report
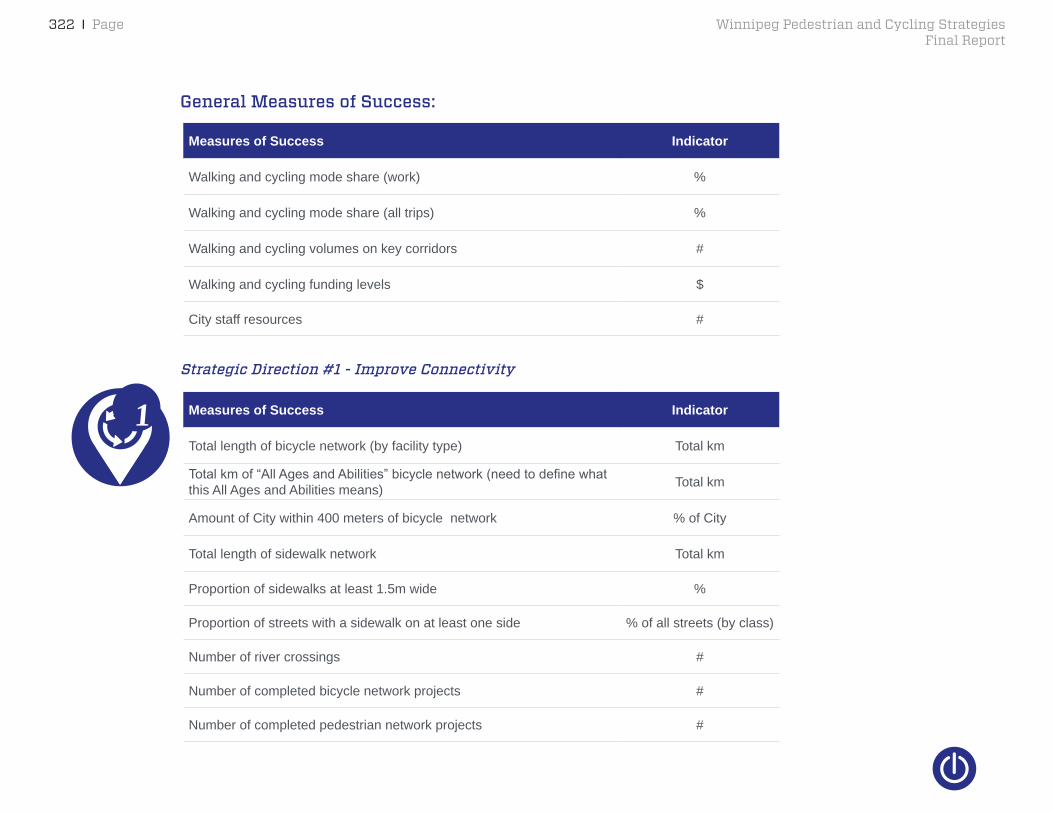
General Measures of Success:
Measures of Success Indicator
Walking and cycling mode share (work) %
Walking and cycling mode share (all trips) %
Walking and cycling volumes on key corridors #
Walking and cycling funding levels $
City staff resources #
1Strategic Direction #1 - Improve Connectivity
Measures of Success Indicator
Total length of bicycle network (by facility type) Total km
Totalkmof“AllAgesandAbilities”bicyclenetwork(needtodefinewhatthis All Ages and Abilities means) Total km
Amount of City within 400 meters of bicycle network % of City
Total length of sidewalk network Total km
Proportion of sidewalks at least 1.5m wide %
Proportion of streets with a sidewalk on at least one side % of all streets (by class)
Number of river crossings #
Number of completed bicycle network projects #
Number of completed pedestrian network projects #
Page I 323Winnipeg Pedestrian and Cycling StrategiesFinal Report
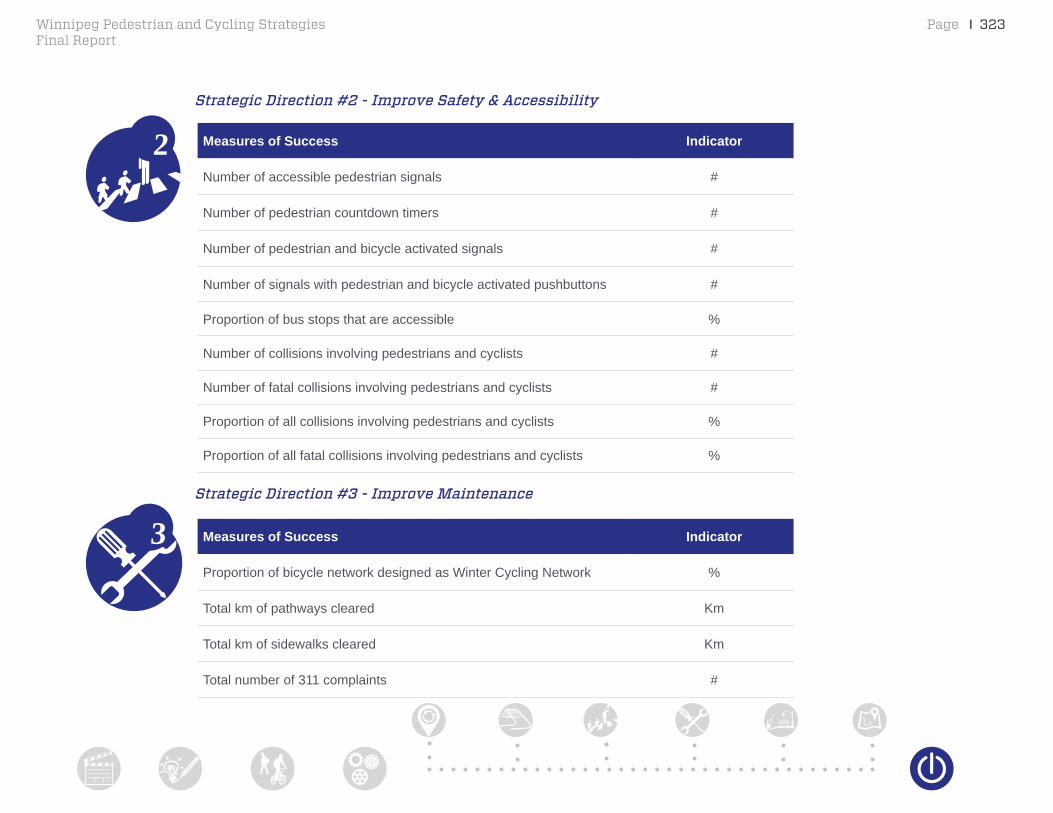
Measures of Success Indicator
Number of accessible pedestrian signals #
Number of pedestrian countdown timers #
Number of pedestrian and bicycle activated signals #
Number of signals with pedestrian and bicycle activated pushbuttons #
Proportion of bus stops that are accessible %
Number of collisions involving pedestrians and cyclists #
Number of fatal collisions involving pedestrians and cyclists #
Proportion of all collisions involving pedestrians and cyclists %
Proportion of all fatal collisions involving pedestrians and cyclists %
2
3
Strategic Direction #2 - Improve Safety & Accessibility
Measures of Success Indicator
Proportion of bicycle network designed as Winter Cycling Network %
Total km of pathways cleared Km
Total km of sidewalks cleared Km
Total number of 311 complaints #
Strategic Direction #3 - Improve Maintenance

324 I Page Winnipeg Pedestrian and Cycling StrategiesFinal Report
5
Strategic Direction #4 - Improve Vibrancy
Measures of Success Indicator
Sidewalk coverage within 400m of all mixed use centers and corridors % of streets
Bicycle network coverage within 400m of all mixed use centers and corridors km
Strategic Direction #5 - Improve Convenience
Measures of Success Indicator
Number of bicycle racks downtown #
Number of secure bicycle parking spaces at transit stations #
Proportion of buses with bicycle racks %
Proportion of bus stops with shelters %
Proportion of City within 400 meters walking distance of a bus stop %
4
Page I 325Winnipeg Pedestrian and Cycling StrategiesFinal Report
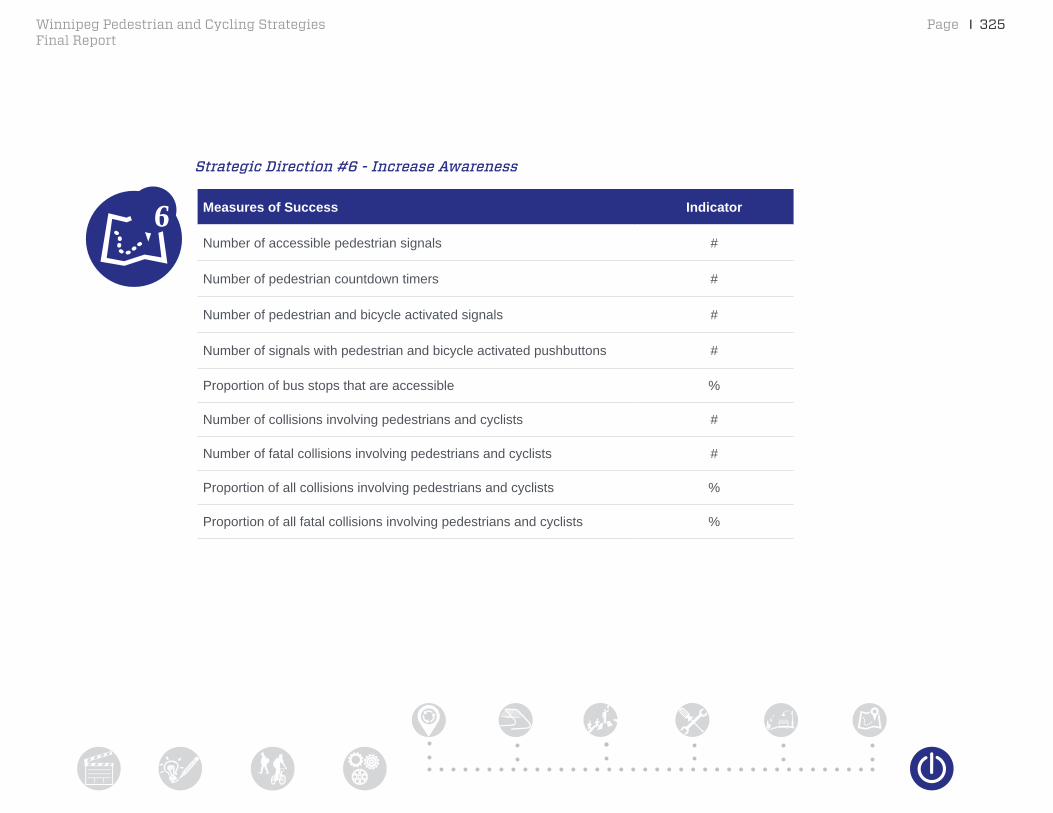
6 Measures of Success Indicator
Number of accessible pedestrian signals #
Number of pedestrian countdown timers #
Number of pedestrian and bicycle activated signals #
Number of signals with pedestrian and bicycle activated pushbuttons #
Proportion of bus stops that are accessible %
Number of collisions involving pedestrians and cyclists #
Number of fatal collisions involving pedestrians and cyclists #
Proportion of all collisions involving pedestrians and cyclists %
Proportion of all fatal collisions involving pedestrians and cyclists %
Strategic Direction #6 - Increase Awareness

326 I Page
To assist in monitoring these, and other, measures of success, the City should expand its current pedestrian and cycling monitoring initiatives, and should develop and implement a comprehensive Pedestrian and Cycling Monitoring Program within one year of adoption of this plan. This Pedestrian and Cycling Monitoring Program will help to identify baselines for each of these measures of success.
The City should follow this up by communicating the results of its Pedestrian and Cycling Monitoring Program by developing and publishing a Walking and Bicycle Account. A Walking and Bicycle Account is a tool to monitor the development of bicycling and walking activity in a community on a regular basis, and is used to assess if a community is achieving its cycling and walking objectives. Walking and Bicycle Accounts typically report on important public input that can be used and incorporated into the bicycle and pedestrian planning process. The Bicycle and Walking Account can also be, in itself, an opportunity to do community-wide marketing and communication on bicycling and walking.
Page I 327