i i 11 y , prediction- of- -check---valve performance -and
TRANSCRIPT

A
... ! 7! :--
NUREG/CR-5159:'KEI No.'1559
I t - ! . !, I I r'.
I I I - I , . .. .I . , . , , :�: -.. , , . ;
I I . .., .I . . . . 4
I 11 Y , ; - : I - .- .) I . f P � , , , - .
, I I
Prediction- of- -Check---ValvePerformance -and--- Degradationin Nuclear Power. P.lant Systems
i .
Final ReportSeptem ber 1987 - April 1988
.,.: j , . '.
Prepared by M.S. Kalsi, C.L. Horst, J.K. Wang
Kalsi Engineering, Inc.
.1 :1 I'll
Prepared forU.S. Nuclear RegulatoryCommission' . .
*.

NOTICE
This report was prepared as an account of work sponsored by an agency of the United StatesGovernment. Neither the United States Government nor any agency thereof, or any of theiremployees, makes any warranty, expressed or implied, or assumes any legal liability of re-sponsibility for, any third party's use, or the results of such use, of any information, apparatus,product or process disclosed in this report, or represents that its use by such third party' wouldnot infringe privately owned rights. -
. ~ ~ -__ ., . - -
NOTICE .
Availability of Reference Materials Cited in NRC Publications
Most documents cited in NRC publications will be available from one of the following sources:
1. The NRC Public Document Room, 1717 H Street, N.W.Washington, DC 20555
2. The Superintendent of Documents, U.S. Government Printing Office, Post Office Box 37082,Washington, DC 20013-7082
3. The National Technical Information Service, Springfield, VA 22161
Although the listing that follows represents the majority of documents cited in NRC publications.it is not intended to be exhaustive.
Referenced documents available for inspection and copying for a fee from the NRC Public Docu-ment Room include NRC correspondence and internal NRC i erioranda; NRC Office of Inspectionand Enforcement bulletins, circulars, information notices, inspection and investigation notices;Licensee Event Reports; vendor reports and correspondence; Commission papers; and applicant andlicensee documents and correspondence.
The following documents in the NUREG series are available for purchase from the GPO SalesProgram: formal NRC staff and contractor reports, NRC-sponsored conference proceedings, andNRC booklets and brochures. Also available are Regulatory Guides, NRC regulations in the Code ofFederal Regulations, and Nuclear Regulatory Commission Issuances.
Documents available from the National Technical Information Service include NUREG seriesreports and technical reports prepared by other federal agencies and reports prepared by the AtomicEnergy Commission, forerunner agency to the Nuclear Regulatory Commission.
Documents available from public and special technical libraries include all open literature items,such as books, journal and periodical articles, and transactions. Federal Register notices, federal and..state legislation, and congressional reports can usually be obtained from these libraries.
Documents such as theses, dissertations, foreign reports and translations, and non-NRC conferenceproceedings are available for purchase from the organization sponsoring the publication cited.
Single copies of NRC draft reports are available free, to the extent of supply, upon writtenrequest to the Division of Information Support Services, Distribution Section, U.S. NuclearRegulatory Commission, Washington, DC 20555.
Copies of industry codes and standards used in a substantive manner in the NRC regulatory processare maintained at the NRC Library, 7920 Norfolk Avenue, Bethesda, Maryland, and are availablethere for reference use by the public. Codes and standards are usually copyrighted and may bepurchased from the originating organization or, if they are American National Standards, from theAmerican National Standards Institute, 1430 Broadway, New York, NY 10018.

NUREG/CR-5159KEI No. 1559RG, RV
Prediction of Check ValvePerformance and Degradationin Nuclear Power Plant Systems
Final ReportSeptember 1987 - April 1988
Manuscript Completed: April 1988Date Published: May 1988
Prepared byM.S. Kalsi, C.L. Horst, J.K. Wang
Kalsi Engineering, Inc.745 Park Two DriveSugar Land, TX 77478
Prepared forDivision of EngineeringOffice of Nuclear Regulatory ResearchU.S. Nuclear Regulatory CommissionWashington, DC 20555NRC FIN D2042

ABSTRACr
Degradation and failure of swing check valves and resulting damage to plantequipment has led to a need to develop a method to predict performance and degradationof these valves in nuclear power plant systems. This Phase I investigation developedmethods which can be used to predict the stability of the check valve disk when pipingdisturbances such as elbows, reducers, and generalized turbulence sources are presentupstream of the valve within 10 pipe diameters. Major findings include the flowvelocity required to achieve a full open, stable disk position, the magnitude of diskmotion developed with these upstream disturbances with flow velocities below full openconditions, as well as disk natural frequency data which can be used to predict wearand fatigue damage. Reducers were found to cause little or no performancedegradation. Elbow effects must be considered when located within 5 diameters of thecheck valve, while severe turbulence sources have significant effect at distances to 10diameters.
Clearway swing check designs were found to be particularly sensitive tomanufacturing tolerances and installation variables making them likely candidatesfor premature failure. Reducing the disk full opening angle on these clearwaydesigns results in significant performance improvement.
iii

CONTENTS
Page
EXECUTIVE SUMMARY 1
INTRODUCTION 2
OBJECTIVES - ; 4
TEST PROGRAM -5
SCALING CONSIDERATIONS- 6
TEST SPECIMEN 7
INSTRUMENTATION 9Design Features 9
TEST RESULTS 10BASELINE TESTS 10ELBOW TESTS 11
Disk Fluctuations for Elbow Up, Od.. 11Disk Fluctuations for Elbow Down, Od 11Disk Tapping Zones 12Velocity Margin Over Vmin Required for Elbows. 12
REDUCER TESTS 13Velocity Margin Over Vmin for Reducers 13
TURBULENCE TESTS 14Multi-Hole Orifice Plates as a Turbulence Source 14Disk Fluctuation Data, 3-Inch Valve 16Disk Fluctuation Data, 6-Inch Valve 16Summary of Maximum Disk Fluctuations for Elbows, Reducers,
and Turbulence-Sources - 17DISK NATURAL FREQUENCY AND DAMPING TESTS 17DISK-TO-STOP IMPACT LOAD TESTS 17
DISCUSSION 19CLEARWAY SWING CHECK PERFORMANCE PROBLEMS 19VELOCITY MARGIN REQUIRED FOR ELBOWS AND
REDUCERS - -
THEORETICAL PREDICTION OF TURBULENCE INDUCEDDISK MOTION 20
RESULTS AND CONCLUSIONS - 23
RECOMMENDATIONS 24
REFERENCES 25
V

I
I
LIST OF FIGURES
Page1 Check Valve Configuration 27
2 Check Valve Test Setup 28
3 Kalsi Engineering, Inc. Flow Test Facility 29
4 Instrumented Valve Cross Section 30
5 Composite Plot of Disk Fluctuations for 6" Valve, Baseline Tests 31
6 Disk Projection Comparison, Clearway Swing Check Test Valve 32
7 Composite Plot of Disk Fluctuations for 3" Valve, Baseline Tests 33
8 Definition of Elbow Orientation 34
9A Composite Plot of Disk Fluctuation for 3" Valve at Various DiskStop Angles 35
9B Composite Plot of Disk Fluctuations for 6" Valve at Various DiskStop Angles 36
10A Composite Plot of Disk Fluctuations for 3" Valve at Various DiskStop Angles So
10B Composite Plot of Disk Fluctuations for 6" Valve at Various DiskStop Angles 38
11 Maximum Disk Fluctuation vs. Distance to UpstreamDisturbance 39
12 Elbow and Reducer Test Results for 3" Swing Check Valve 40
13 Elbow and Reducer Test Results for 6" Swing Check Valve 41
14 Composite Plot of Disk Fluctuations for 6" Valve with 8" x 6"Reducer at Od 42
15 3 and 6 Inch Perforated Plate Holders 43
16 Disk Motion of 3" Valve Due to Turbulence: Perforated Plates at1.5d Upstream, Stop Angle at 73° 44
17 Disk Motion of 3" Valve Due to Turbulence: Perforated Plates at2.5d Upstream, Stop Angle at 730 45
18 Disk Motion of 3" Valve Due to Turbulence: Perforated Plates at4.5d Upstream, Stop Angle at 730 46
19 Disk Motion of 3" Valve Due to Turbulence: Perforated Plates at10.5d Upstream, Stop Angle at 73° 47
vi

List of Figures (continued)Page
20 Maximum Disk Motion of 3" Valve Due to Turbulence: PerforatedPlates at 1.5 to 10.5d Upstream, Stop Angle at 730 48
21 Disk Motion of 3" Valve Due to Turbulence: Perforated Plates at2.5d Upstream, Stop Angle at 53° 49
22 Disk Motion of 3" Valve Due to Turbulence: Perforated Plates at2.5d Upstream, Stop Angle at 630 50
23 Disk Motion of 6" Valve Due to Turbulence: Perforated Plates at1.5d Upstream, Stop Angle at 70° 51
24 Disk Motion of 6" Valve Due to Turbulence: Perforated Plates at2.5d Upstream, Stop Angle at 70° 52
25 Disk Motion of 6" Valve Due to Turbulence: Perforated Plates at4.5d Upstream, Stop Angle at 70° 53
26 Disk Motion of 6" Valve Due to Turbulence: Perforated Plates at10.5d Upstream, Stop Angle at 70° 54
27 Maximum Disk Motion of 6" Valve Due to Turbulence: PerforatedPlates at 1.5 to 10.5d Upstream, Stop Angle at 700 55
28 Disk Motion of 6" Valve Due to Turbulence: Perforated Plates at2.5d Upstream, Stop Angle at 50° 56
29 Disk Motion of 6" Valve Due to Turbulence: Perforated Plates at2.5d Upstream, Stop Angle at 60" 57
30 Maximum Disk Fluctuation vs. Distance to UpstreamDisturbance 58
31 Disk Response to Disturbance, 6" Valve Natural FrequencyTests 59
32 Disk Natural Frequency 60
33 Disk-to-Stop Contact Loads, 3" Valve 61
vii

ACKNOWLEDGMENTS
We are greatful for the funding provided by the Small Business Innovation Researchprogram of the U. S. Nuclear Regulatory Commission which made this researchpossible. Special thanks are due William S. Farmer of the NRC for his guidance andencouragement throughout the project.
Individuals of the Kalsi Engineering, Inc. staff who should be recognized for theirimportant contribution toward successfully completing the project are Lannie Dietlefor his meticulous work in conducting thousands of tests, Daniel Alvarez for thedevelopment of the load cell concept employed in these tests, and Bobbie Lambert forpatiently working through many revisions and typing this manuscript in a beautifulform.
ix

EXECUTIVE SUMMARY
The purpose of this Phase I investigation'was to determine'th~e feasibility of a technicalapproach in predicting and quantifying the stability or instability of swing checkvalve diskshin piping systems which have significant flow disturbances -within 10 pipediariieters' 'upstream of the valve. Specifically, -the'effects of elbows; reducers; andturbulenie_ sources have been investigated. A' series 'of over 2,000 flow tests wereperformed to ~ifeasure' the-performance of 3-inch and 6-inch:swing check valvessubjected to these upstream disturbances.
The following is a summary of major findings from the test program:
1. Disk' stability for swing check valves can be predicted if the valve disk angle,the type and proximity of the'upstrearii disturbance, and the flow velocity-'through the valve are known. ' -.
2. To account for the presence of an upstream flow disturbance, some velocitymargin over the -minimum velocity needed to suppress disk fluctuations (andfully open it against the backstop) in an undisturbed, uniform:pipe flow isrequired. The necessary margins for various flow disturbances weredeveloped and are included in this report.
3. Clearway swing check valves are most susceptible to the effects of.upstream- disturbances such -as 'elbows and'turbulence producing devices. (A clearway
swing check is one in which the disk, at its full-open position is lifted up into thebound area and nearly out of the path of the flow stream through the valve body).Stich' valves may never achieve disk stability under certain flow conditions.:
4. One of the important findings from this research was that upstream reducershave no measurable effect on either velocity required over baseline to fully openthe valve-or on disk stability.' This holds even when the reducer is locatedimmediately adjacent to the check valve. (A reducer is defined as an elementwhich reduces the pipe size as one approaches the valve in the direction of flow.)
5. Some specific-results from Phase I tests are that at proximities of 3 to 5 pipediameters upstream, elbows require an increase in flow velocity over baselineof 10 or 15 percent to fully open the valve disk. Proximities of 0 to 1 diameterwill require up to 50 percent higher flow velocity over baseline to fully open thedisk, except for clearway designs which will require velocities more than 100percenthigherthanbaseline. ' ' ,: - -:
6. The amplitude of disk motion which occurs before fully seating the diskincreases as the'flow disturbance is brought closer to-the valve,. The maximum
- disk fluctuations in the case of a severe turbulence source can reach as'high as16 degrees' and for elbows up to 9 degrees. The reducers have negligible effecton disk fluctuations. -
- 7. 'Suitable nondimensional parameters ,were chosen in the test program to checkthe validity of the results when scaling from one size to another. 'The 3-inchand 6-inch test results show that reasonable predictions can be made whilescaling to other sizes. "
1

INTRODUCTION
Accelerated degradation of check valve internals can lead to their failure to perform,leading to serious safety consequences or causing extensive damage to other plant,components and systems. The primary cause of premature degradation is continuous.fluctuation of the disk when it is not firmly held against the backstop by the fluid forcespushing on it. The severity of the degradation depends upon the type and severity ofdisturbances in the fluid system that are present upstream of the valve which disturb theuniform flow and create velocity skew or fluctuations.
Disk fluctuation can be eliminated by,. ensuring that the valve is sized to create;sufficient flow velocity through it to fully open the disk against its backstop. However,many valve manufacturers lack accurate data to make minimum velocity (Vmin)recommendations concerning their valves. A generalized Vmin formula has recentlybeen developed (References 5, 23) for swing check valves which has been shown tocorrelate well with experimental results covering a wide range of sizes and pressureratings. It should be pointed out, however, that this formula is applicable only toinstallations in which fully developed pipe flow, unaffected by upstream disturbance,is entering the valve.
In order to predict the performance of check valves in practical installations at nuclearpower plants, additional data are needed to properly account for the effect of flowdisturbances that are, commonly present in close proximity (less than 10 pipediameters) upstream of the check valve. The minimum velocity, Vmnin, for an idealpipe flow may not be sufficient to hold the disk fully open under such conditions. One ofthe objectives of this research is to develop techniques which can be used to predictwhether disk stability can be achieved in the presence of such upstream disturbances byincreasing the velocity above Vmin and to develop the velocity margins necessary tosuppress disk fluctuations.
Another important objective of this effort is to develop techniques to quantify themagnitude and severity of disk fluctuations under various flow conditions in thepresence of these upstream disturbances when the velocity through the valve isinsufficient to hold it fully open. These techniques will aid in predicting (1) whether aswing check valve installed with a known upstream disturbance at a definedproximity will suffer from accelerated degradation, and (2) the severity of disk motionwhich causes that degradation of the internals. Eventually, the results from thesuccessful completion of the research effort envisioned under Phase I and II should beuseful in predicting suitable maintenance intervals during which the degradation iswithin acceptable limits. Within these limits the check valve should continue toperform without compromising the safety or reliability of its operation.
This report summarizes the results of the Phase I effort in which the performance ofswing check valves with certain selected upstream flow disturbances wassystematically evaluated. In a broad sense the types of flow disturbances that can befound upstream of the check valves fall into two distinct categories:
1. Piping elements such as elbows, reducers, and tees which are quite specific intheir geometry,
2. Turbulence sources which includes a large variety of devices capable ofcreating velocity fluctuations in the flow stream. This includes control valves
2

of various types -'eg., single ported globe valve,'doible ported globe valve,multiple hole cage guided trim valves, butterfly valves - pumps, and orifices,etc. ; - - .
From the first category of flow disturbances, elbows and reducers were selected forPhase I testing since these are the most commonly used piping elements upstream ofcheck valves. Phase I testing also included the investigation of an upstreamturbulence source. In order to generically characterize the effect of the various types ofturbulence sources described above, orifice plates with multiple holes were used. Byvarying the size and number of holes, the two important characteristics of turbulence,e.g., eddy size (or scale of turbulence) and the intensity of turbulence-could becontrolled independently. Multiple-hole orifice plates have the additional advantageof.creating uniform .turbulence across the pipe cross-section, which provides data ofmore general utility than some specific throttling devices, e.g., butterfly valves thathave been used in the past (References 5, 24), which introduce a velocity skew alongwith turbulence. Extensive testing was done using several perforated -plates to developupper bounds of disk fluctuation under the most severe turbulent conditions.- Thesebounding disk fluctuation results can be used to make conservative predictions aboutcheck valve degradation. Additionally, some interesting trends were-found whichshow how the size of holes in the orifice plates affects the severity of disk fluctuations.
It should be pointed out that until recently there had been no reported results of researchdirected at systematic evaluation of upstream disturbances on check valveperformance, even though some unique configurations-have been investigated(References 13, 24,25). Reference 5 reports the results of the first such effort towards thesystematic evaluation of upstream disturbances completed by the investigators in thepresent research. 'That work included investigation of elbows and a throttled butterflyvalve as a turbulence source. However, the velocity increments used in those tests wererelatively coarse and they did not permit an accurate determination of the velocity atwhich the disk begins to impact the backstop and when it finally reaches its fully openposition. Secondly, the butterfly valve introduces a velocity skew along with intendedturbulence which prevented any useful velocity margin data over Vmin to be extractedfrom these tests. The Phase I tests were designed to specifically overcome theselimitations and to develop more general, upper bound data for turbulence as well asreducers.
The tests were performed on two different sizes of swing check valves (3- and 6-inch)with an adjustable stop to simulate the disk angle variations found in valves made bydifferent manufacturers. An important consideration in this Phase I effort was to usemethods which can allow the results to be scaled and applied to other sizes. All together,over 2,000 tests explored the effects of elbows, reducers, and turbulence sourcesupstream of the check valve.
Phase I effort also included a thorough review of the current state of the art influid/structure interaction techniques, and their capabilities and limitation to predictdisk response to upstream turbulence if the turbulence characteristics are known.
This report summarizes the results of the experimental and theoretical investigationcompleted under Phase I.
3

OBJECTIVES
The objective of the Phase I effort was to determine the feasibility of a technicalapproach in predicting and quantifying the stability or instability of the swing checkvalve disks in practical piping systems which have a significant'flow disturbancewithin 10 pipe diameters upstream of the valve.
More specifically, the objectives were to
1. Develop a general approach which can be used to modify the Vmin formula toaccount for the orientation and' oroximity of an upstream elbow;
2.' Develop a general approach to account for the effect of an upstream reducer onthe Vmin formula;
3. Develop'techniques for predicting the amplitudi'and frequency of check valvedisk motion in' the presence of an upstream turbulence source. 'These resultscan be used-in a' Phase II program to develop 'quafntitative wear and fatigueprediction techniques;-
4. Establish velocity margins above Vmin necessary to fully open the disk andsuppress disk oscillations' due to' 1, 2, and 3 above.'
A test program wa's'devised to me'et these objectives. The tests were performed'on 3-inchand 6-inch swing check valves supplied by MCC Pacific'Valve Company. The valvesare similar to that shown in Figure 1. The tests 'were performed at Kalsi Engineering,Inc.'s flow test"'facility in Sugar Land, Texadsi(Figures 2 and 3). Water at outdoorambient temperature was used as the'flow media at velocities between 1.5 and 25 feet persecond. 'All together, over 2,000 tests explored the' effects of elbows, reducers, andturbulence upstream of the check valve.
4

TEST PROGRAM
Phase I testing was divided into six major areas as follows:
1. Baseline Tests: To e'stablish check valve performance with uniform, fullydeveloped flow unaffected'by upstream'disturbances. '
2. Elbo'w Tests: To'determine the effect of elbow orientation and proximity oncheck valve performance. Elbow up and down orientations were tested atupstream distances from 0 to 5 pipe diameters. Based upon earlier test results,the effects 'of elbows b'eyond 5 pipe 'diameters are known to be insignificant.
3. Reducer Tests: Similar in nature to the elbow tests, a pipe reducer was installedupstream at distances from 0 to 5 diameters. A reducer is defined as anelement that decreases the pipe size when moving in the direction of flow.
4. Turbulence Tests: Turbulence was developed by flowing through a perforatedplate upstream of the check valve. A selection of plates was -available withdifferent numbers and sizes of holes. Geometric scaling of plate geometry wasmainrtain'ed between both valves. The turbulence source was located from 1.5 to10.5 diameters upstream of the check valve:
5. Disk Natural Frequency and Damping Tests: A series 'of tests were run tomeasure the disk/hinge arm natural frequency and damping under actual'flowing conditions. 'The data from these tests will be be used in Phase II todevelop predictive techniques to quantify wear and fatigue of the hinge pin anddisk stud connection, the two known weakest areas in swing check valves.
6. Tapping Force Tests: To quantify the magnitude and duration of disk impactswith the backstop, a load cell was inco'rporated in''an' adjustable backstopmechanism. Transient disk contact with the backstop' could then be recorded aswell as the steady-state load when the disk is pegged in the fully open condition.
.~~ . . . . .
5

I
SCALING CONSIDERATIONS
One of the important considerations in Phase I work was to properly take the pertinentnondimensional scaling parameters into account. Two sizes of valve, 3-inch and 6-inch, were tested so that data can be used to check the validity of how the results scale upbetween the two sizes using the nondimensional parameters chosen.
The following table lists the dimensional and nondimensional parameters that wereused in the tests:
D = Nominal size of the valve; diameter of the upstream pipe
L = Distance between the valve end and upstream disturbance
L/D = Nondimensional distance between the valve end and upstreamdisturbance; also referred to as proximity of the disturbance
AO = Disk fluctuation angle
9 = Total fluid impingement angle against the disk (see Figure 1)= [90° - (the angle swept by disk from fully closed to fully open position)]
V = Flow velocity through the valve, based on valve inlet area
V ' = Velocity required to fully open the valve with an upstream disturbance
Vniin = Minimum flow velocity required to fully open the disk against thebackstop without any upstream disturbance
V'(Vmin = Nondimensional velocity ratio used to express velocity marginsneeded over Vmin to stabilize the disk in the presence of an upstreamdisturbance
Cup = (Same definition as ratio V'/Vmin) A nondimensional velocitymargin factor to account for upstream disturbances
Standard short-radius 90-degree elbows and concentric reducers manufactured byVictaulic Company were used in these tests. They were dimensionally inspected todetermine what, if any, deviations exist in the geometrical scaling between the 3- and6-inch sizes. It was found that the ratio of mean elbow radius and the inside diameterof the elbow varied by approximately ± 10 percent around the mean value of 1.075. Theangle of the concentric reducers was also found to be consistent: between 14 and 15degrees for both reducers, which equates to a total included angle of about 30 degrees.
Geometrical similarity was also maintained in the design of various multiple-holeorifice plates used in tests on the 3-inch and 6-inch valves. The size and number ofholes used in these plates is shown in Table 3. The hole size governs the size of eddiesemitted by an orifice plate. The ratio between the eddy size and physical dimensions ofthe check valve disk is an important nondimensional scaling parameter forfluid/structure interaction caused by turbulence.
6

TESrTSPECMIENS K
The valves used throughout the test program were 3-inch, 300-pound and six-inch, 600-pound clearway swing check valves. Dimensional and physical data are presented forboth valves in tables 1A and 1B. Both valves were modified to incorporate an LVDT(Linear Variable Differential Transformer) type of displacement transducer formeasurement of disk/hinge arm motion and an adjustable backstop assembly(Figure 4). The adjustable backstop takes the place of the fixed backstop which isnormally cast integrally into the bonnet in these valves. The adjustment mechanismallows the stop position to be varied, thus simulating different full-open disk positionscovering the range of variations found in valves made by different manufacturers. Inaddition, the backstop assembly incorporates a load cell which provides directmeasurement of the loads developed whenever the disk contacts the stop.
7

I
Table 1A
VALVE DATA FOR 3-INCH VALVE
Valve Type 3", 300# Swing Disk Check
Manufacturer MCC Pacific Valve Company
Weight and Dimensional Data.
Disk Weight (ind. nut) 1.94 lbs.
Hinge Arm Weight 0.72 lbs.
Hinge Pin Diameter 0.375"
Disk O.D. 3.90"
Seat Bore Diameter 3.0"
Seat Tilt From Vertical 3°
Full Open Angle 73°
Table 1B
VALVE DATA FOR 6-INCH VALVE
Valve Type 6", 300# Swing Disk Check
Manufacturer MCC Pacific Valve Company
Weight and Dimensional Data
Disk Weight (incl. nut) 8.94 lbs.
Hinge Arm Weight 3.38 Ibs.
Hinge Pin Diameter 0.500"
Disk O.D. 6.90"
Seat Bore Diameter 6.0"
Seat Tilt From Vertical 30
Full Open Angle 700
8

INSTRUMENTATION
Design Features ..*.* . -
The load cell apparatus.incorporates a spring to preload the stop rod against the loadcell, thus.taking up-any clearance that might exist. Thisfeature prevents unwantedload amplification that can be caused by impact of the stop rod against the load cell ifany clearance is present between them. A static seal was used to isolate the load cellfrom the valve interior. -This results in a fictitious disk-to-stop load in response tovalve internal pressure. To. minimize this load, the pressure effective area was madeas small as practical resulting in a pressure induced load of 2 pounds at 75 psig.
Disk motion measurement was accomplished by. attaching the LVDT core directly tothe hinge arm,-with a stiff plastic tube capable .of transmitting push/pull motion whileretaining the ability to flex slightly. to accommodate kinematic restraints of thearrangement. This connecting link transformed the rotary motion of the hinge arminto linear displacement of the LVDT core. Calibration of the apparatus against diskangle proved the mechanism to be nearly linear with a worst case error of ± 0.5degrees., Under certain flow conditions turbulence-in the valve can buffet theconnecting link causing displacement of the LVDT core, not associated with diskmotion. 'This phenomenon was eliminated by placing a protective aluminum tube overthe connecting link to shield it from the turbulence.--:
Flow rates were calculated by measuring the pressure drop across an orifice plate. Theentire orifice meter run is constructed in accordance with the requirements ofANSI/API 2530. Three different orifice sizes were used to provide flow accuracy of+ 0.5 percent over a range of 1.3 to 27 feet per~second (water). This flow range exceedsthat required for the present test program. .
The following parameters were measured and recorded during each of the testsperformed: disk.motion, backstop load, flow orifice AP (for flow velocity), and pressureupstream of the check valve. In addition, during the turbulence tests, a second pressuremeasurement was added to monitor pressure drop across the perforated plate. Each ofthe analog signals was acquired through a 12-bit analog-to-digital converter, thenstored on disk:' A test log was also printed out documenting important test parametersand summary test data.
-~ ~ F-.''
* .- '
9

I
ESTR rSUuTSIdentical tests were run on both 3-inch and 6-inch swing check valves. The flowvelocity range spanned 1.5 to 25 feet per second, using water. Flow velocity incrementswere varied to adequately characterize disk motion through the velocity range.Therefore, in the velocity range where the disk begins to tap against the stop, relativelyfine velocity increments were taken, typically 0.1 to 0.2 fps. Once the disk was pegged,the velocity increments were increased to 2 fps. This methodology' allowed a moreprecise determination of the velocity at which tapping begins and the velocity at whichthe disk becomes pegged against the stop. On average, 20 separate tests were needed tocover the 1.5 to 25 fps range at one disk stop angle.
Data were taken at stop angles of 53 degrees, 63 degrees, and 73 degrees for the 3-inchvalve and 50 degrees, 60 degrees, and 70 degrees for the 6-inch valve. The 73- and 70-degree positions represent the as-manufactured full-open angle for'the 3-inch and 6-inch valves respectively.
BASELINE TESTSBaseline tests establish performance data when' the valve is presented with, fullydeveloped pipe flow. To provide these flow conditions, 20 diameters of straight pipeincorporating a section of flow straightening vanes was installed upstream. Thisupstream configuration exceeds ANSI/API Standard 2530 requirements for a flowmetering piping run. Results of the baseline tests for the 6-inch valve are presented inFigure 5, which shows peak-to-peak disk motion reported as ± 3cs (standard deviations)from the mean disk position plotted against flow velocity. Data for all three stoppositions are shown. Inspection of Figure 5 shows that the highest levels of disk motionreaching 1.5 to 2 degrees, occur between 4 and 6 fps. We can conclude that diskfluctuation values of about 2 degrees (peak to peak) are the lowest that' can be expected,even with the best upstream conditions we can create. This minimum amount of diskmotion must be expected whenever Vznl ,has not been reached. Figure 5 can be used to'point out other important aspects'of valve behavior. First; disk miotion occurs over amuch wider range of velocities for the 70-degree'stop angle than at 50 degrees and 60degrees. This can be seen by measuring the velocity range over which diskfluctuations exceed 1 degree*. Table 2 shows the velocity range and span in fps for thethree stop angles. This range is also indicated in Figure 5.
Table 2
6-INCH VALVE DISK MOTION
Stop Velocity VelocityAngle Range Span, fps
50° 3.8 - 4.9 1.1
60° 3.8 - 6.5 2.7
70° 3.8 - 13.8 10.0
0 Because of mechanical clearances in the LVDT assembly are variable, we haveestablished a 10 fluctuation level (± 0.50) as the threshold below which we considerthe disk actually seated against the backstop.
10

The wide velocity span oveii'which disk'motion occurs alt7ehe70-degree stop angle' isinherent in the' design of a clearway swing' check'valve: As' was reported in Reference5, this is due in large part to the shieldin'g effect'of the valve body/bonnet area when thevalve is opened to the clearway position. Figure 6 shows in cross-section how theclearway design causes the disk to be lifted very nearly out of the normal flow streamthrough the valve. Measurements of the twovalves show'thatlthe 6-inch disk protrudes0.8 inches into the flow stream while the 3Winch disk has no'protrusidn. Data from the3-inchbvalve baseline tests are presented'in Figure 7. Again, the maxir'mum' fluctuationlevelsiare'in the 2-degree range and the range over'which disk motion occurs is much'-wider at the 73-degree stop angle than at 63 degrees or 53 degrees.:
ELBOW TESTSTests were run with elbows at proximities of 0, 1, 3, and 5 diameters upstream of thecheck valves and oriented both up and down. Tests were not-run at distances beyond 5dbecause results reported in Reference 5 showed that at distances of 5 diameters and,beyond, the effects of elbows become very small, approaching the performance achievedwith baseline conditions. 'To avoid confusion, Figure 8 shows sketches representingthe definitions used in this text for elbow up and elbow-down orientations.
A detailed review and comparison will be made of the elbow test results at Od for the 3-and 6-inch valves. Remaining data will be covered later in this section.
Disk Fluctuations for Elbow Up, Od .
Figures 9A and 9B show the results of disk fluctuation vs. flow velocity tests for the 3-and'6-inch valves. Maximum disk motion for both valves occurred when the stop waspositioned at the clearway positions of 73- and 70 degrees for 3- and 6-inch valvesrespectively. Values of approximately 9- and 6 degrees'were recorded for the 3- and 6-inch valves respectively. The levels 'of fluctuation' at the 600/630-and 500/530 stoppositions were lower than those reached at the clearway position. As seen in thebaseline data, the velocity range over which disk motion occurs is much wider at70°/730 than at the lower angles. Most interesting, however, is the fact that for the 3-inchvalve a stable, fully open disk position 'was never achieved at the 73-degree clearway.stop position even at velocities of 24 to 25 fps. This phenomenon did not occur duringelbow tests reported in Reference 5 which showed the 3-inch valve reaching a fully opencondition at 18 fps. This demonstrates the extreme sensitivity of the clearway design tominor changes in flow conditions or actual pbsitioningiof the disk near the-nominal73-degree position.- The 3-inch valve, with no disk projection into the flow stream, isvery sensitive to physical changes in the piping setup or conditions inside the valve.The 6-inch valve, with some disk projection into-the flow stream, is less sensitive tothese changes. '
,-. It -. , : , .
DiskFluctuations forElbowDown, Od . ,Figures 1OA and 10B show the elbow down test results for the 3- and 6-inch valves. Thesame conclusion's are reached as for the elbow up case, except that the maximum diskfluctuations'are not as high. This is due to the fact that the highest levels of turbulence:exist along the inner radius of an elbow (Reference 6); thus, the elbow down orientationpositions this more turbulent portion of the flow further from the valve disk than theelbow up orientation. Once again the 3-inch valve exhibits the inability to reach astable, fully open position.
Figure 11.compares the maximum disk fluctuation for both valves at each- locati6n'tested. To normalize the data, both horizontal axes haveibeen'offset to account for what
11

I
amounts to a built-in length of straight pipe between the flange face and the disk regioninside the valve. This distance measures 2d and 1.5d for the 3- and 6-inch valverespectively. The highest levels of disk motion occur at elbow proximities of Od andgenerally decrease as the elbow is moved further from the valve.
Disk Tapping Zones .-.
Another important aspect of check valve behavior is disk tapping. Disk tapping occurswhen the flow velocity is not quite sufficient to firmly seat the disk against the stop, sothat fluctuations in disk motion cause the disk to repeatedly tap. against the stop.Tapping stops when flow velocity, is raised to the point where the disk becomes firmlyseated or pegged. By carefully determining the flow velocity at which tapping beginsand the velocity at which the disk becomes pegged, the tapping "zone" can be defined infeet per second.
By examining the elbow test data, the following observations about disk tapping can bemade:
1. The onset of tapping begins at lower flow velocities when-the elbow is oriented upthan when oriented down. This results in wider tapping zones for elbow up.installations compared to elbow down. This is particularly evident at Od and idand less so at 3d and 5d.-
2. The tapping zone is widest with the stop angle set at 700/730, typically spans amagnitude of 2 to 4 fps.
3. The tapping zone is very narrow when the stop position is decreased to 600/630 and500/530.. At these stop positions, the onset of tapping very nearly coincides with thevelocity at which maximum disk motion occurs. A very small increment in flowvelocity is then required to peg the disk; typically less than 1 fps at 600/63° and lessthan 0.5 fps at 500/53°.
Disk tapping plays an important role in fatigue and impact wear of the disk stud andwear of the hinge pin. Once again, the clearway design is seen to be most susceptible todamage because of the wider tapping zone and the fact that the zone lies at velocities inthe. 12 to 15 fps range commonly encountered in check valve installations.
A predictive wear and fatigue model should be developed by combining this data withwear data for specific material combinations gathered as part of a Phase II program.
Velocity Margin Over Vmii Required for ElbowsFigures 12 and 13 show the results for 3- and 6-inch valves for the velocity required forfull disk opening at each stop angle plotted against the nondimensional distance to theelbow, L/D. For both valves, it can be seen that at distances of Od to id, the velocityrequired to fully open the disk can be as much as 75 percent higher than baseline in theclearway position, and, as noted earlier, may never actually become stable in the caseof the 3-inch valve at Od." At 3d and beyond, the velocity margin required drops to 10percent over baseline conditions.
The onset of tapping was defined as four disk-to-stop contacts in ten seconds.
12

At the lower disk openinzgtaingles, the velocity margins required decrease'markedly.At 600/630, a 35 percent margin is required at Od and id and io percent elsewhere. At'50°/530, a 15 percent margin is required at'Od'and id and 10 percent elsewhere.
REDUCERTESTS -.
A common piping system element found 'upstream of check valves is the pipe reducer.Marny reducer geometries'exist with'various ratios of inlet-to-outlet 'size and overalllength, as well as being fabricated or forged, concentric or eccentric; The sizes chosen''.for 'these tests were 4 'x 3 for the 3-inchbvalve ind 8 x 6 for the 6-inch valve. This'selection provides a reduction of one nominal pipe size in both cases, and maintaiins'geometric similarity in both cases by providing a reduction ratio of 0.75. The reducerswere'3;5 and 5 inches long in their ove'rall -length 'for the 3-inch and -6-inchxlves
respectively. The actual 'slope of the iwall in'the 'reduction section' wVas '6lose to"15degrees (30 degrees total included angle) for both reducess. ; ' ' '
Tests were run with the reducer placed at'the same distances from'the valve 'as theelbows: 0, 1 3, and 5 diameters. Figure 14'shows disk fluictuation'data compiled fromtests of the 6-inch valve with reducer at'Od." Interestingly, it looks very much like the'baseline test data of figures 5 and 7 with maximum disk fluctuations in' the 2-'to 2.5- -
degree range occurring between 4 and 6 fps. Velocities at which the disk reaches thefully open position are very close to baseline'levels. Data from the other proxiriiities (1,'3 and 5d)1as well~a]' the 3-inch tests sh6w':veriy similar performance. 'Unlike-elbows,'there is no characteristic increase 'in'disk'ifistability as the'ifeducer is'br'ought clos'er tothe valve?'" This is easily'seen by'reexarmining figures 11'- 13, which shbo`w summarydata for the 'rducer tests.' In Figure 11, it can be seen that maximnium- disk fluctuationsfor bih valves at a distance'are well within'the levels of baseline fluctuations shownby the dashed lines. ' ' - ''' - : ' ' ' '
Figures 12 and 13 show the velocity required 'to fully open the disk at the different stopangles. In each case, for both valves and at all stop angles and distances, the requiredvelocity is within+± 5 percent'of baseline.- These results are-in agreement with expectedbehavior based on theoretical formulations in Reference .7 where it is shown that, infact, a reducer will tend to derease the level of axial velocity variations by 'an 'amountapproximately equal to X2 where' = ratio of the contraction. For the reduce'rs testedhere, the axial velocity variation could'be expected tobe reduced by-X2 = (0.75)2, or 56percent of the-original velocity'fluctuations. IThis example applies'.to' an ideal.case,neglecting viscous effects: and compressibility and allowing no- geometricdiscontinuities which will otherwise disturb the flow field. This also assumes nocontribution of radial velocity'variations to disk instability. Although 'reducion of thislevel will not be realized in a real application, it does show that an upstream reducerwill tend to reduce axial flow fluctuations or turbulence intensity and resultant diskmotion as observed in our-tests.:
Velocity Margin over Vmin for Reducers ii - ' ' __. ' -:
To summarize the reducer test results, it can be stated that the reducers do not have anydetrimental effect on the stability of the swing check valve disk. There is essentiallyno vel6city'marginir'equired 'above Vmin to'suppress disk 'oscillations due to this type'offlow' disturbance. i In' fact ethe reducershave' 'a beneficial effe'ct'-of-decreasing theturbulence intensity that isresponsible for' causing disk'fluctuations> ' '
.. ' * ' , .. .. ' i,: : ,', ' . . . : ' . '; ' -- . .. . .
- . ? . --.r -.-;~~~ ' ' '
13
I
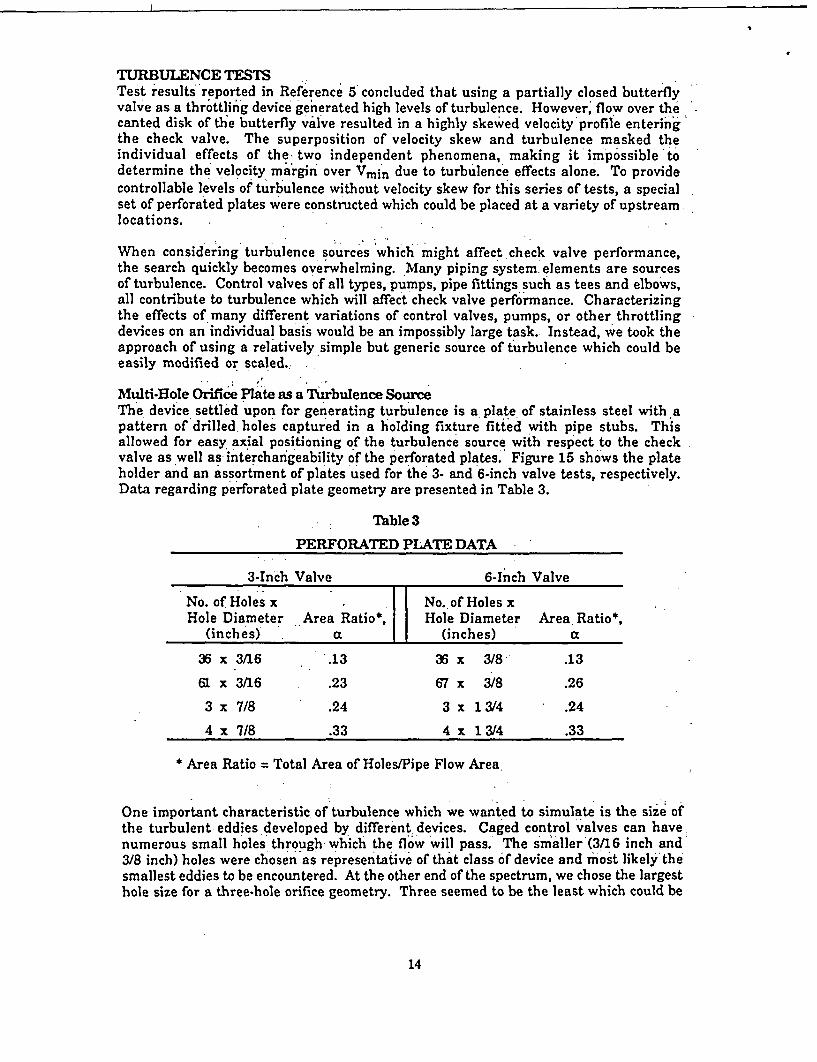
TURBULENCE TESTSTest results 'reported in Reference 5' concluded that using a partially closed butterflyvalve as a throttling device generated high levels of turbulence. However, flow over thecanted disk of the butterfly valve resulted in a highly skewed velocity'profile enteringthe check valve. The superposition of velocity skew and turbulence masked theindividual effects of the- two independent phenomena, making it 'impossible to-determine the velocity margin over Vmin due to turbulence effects alone. To providecontrollable levels of turbulence without velocity skew for this series of tests, a specialset of perforated plates were constructed which could be placed at a variety of upstreamlocations.
When considering turbulence sources which might affect.check valve performance,the search quickly becomes overwhelming. Many piping system elements are sourcesof turbulence. Control valves of all types, pumps, pipe fittings such as tees and elbows,all contribute to turbulence which will affect check valve performance. Characterizingthe effects of many different variations of control valves, pumps, or other throttlingdevices on an individual basis would be an impossibly large task. Instead, we took theapproach of using a relatively simple but generic source of turbulence which could beeasily modified or scaled..
Multi-Hole Orifice Plate as a Turbulence SourceThe device settled upon for generating turbulence is a plate of stainless steel with apattern of drilled holes captured in a holding fixture fitted with pipe stubs. Thisallowed for easy axial positioning of the turbulence source with respect to the checkvalve as well as interchangeability of the perforated plates. Figure 15 shows the plateholder and an assortment of plates used for the 3- and 6-inch valve tests, respectively.Data regarding perforated plate geometry are presented in Table 3.
Table 3
PERFORATED PLATE DATA
3-Inch Valve 6-Inch Valve
No. of Holes x No. of Holes xHole Diameter Area Ratio*, Hole Diameter Area Ratio*,
(inches) a (inches) a
36 x 3/16 .13 36 x 3/8 .13
61 x 3116 .23 67 x 3/8 .26
3 x 7/8 .24 3 x 13/4 .24
4 x 7/8 .33 4 x 13/4 .33
* Area Ratio = Total Area of Holes/Pipe Flow Area
One important characteristic of turbulence which we wanted to simulate is the size ofthe turbulent eddies developed by different devices. Caged control valves can havenumerous small holes through which the flow will pass. The smaller(3/16 inch and3/8 inch) holes were chosen as representative of that class of device and most likely'thesmallest eddies to be encountered. At the other end of the spectrum, we chose the largesthole size for a three-hole orifice geometry. Three seemed to be the least which could be
14

used without introducingtoo .much bias or unevenness'ifito the flow field across thepipe. 'Selection of the -total flow area in' the orifice, which isldethmined by the numberand size of holes, was guided'by the pump's ability' to deliver the 'required flow whilestill preventing cavitation at the'perforated plate. 'To prevent excessive cavitation,-the.cavitation index was continuously monitored during the tests. The cavitation indexwas calculated according to the formula:
Pdown- Pvap .' ;
Pup- Pdown
where ? .: ' ;
c = Cavitation Index
Pups Pdown = pressures upstream and downstream of the perforated plate, psig
Pvap = Vapor pressure of fluid, psig
For water at 1 O00F, Pvap 1 psig
So the formula simplifies to ;
P down- 1 - f
Therefore, a smaller cavitation index, a, means higher levels of cavitation.
Work 'by Tullis with single and multi-hole orifices, skirted control valves;'' andbutterfly valves (References'8,9) has helped define -a range'of operating regimes with'differing 'cavitation'characteristics ranging from incipient cavitation at'the' mild'endto choked flow at the severe end. Incipient cavitation can be characterized by soundssimilar to the' crackling of frying'bacon or popping corn. This is a very mild level of'cavitation.' -For the perforated plates used in these tests, this level of cavitation wastypically reached with cavitation indices of about a = 0.5. All tests were'performed witha = 0.7 as a minimum to guarantee no influence of cavitation.
Turbulence tests were run at flow velocities from 2.5 to 18 fps. Given the pumpcharacteristics and cavitation criterion, higher flow velocities could not be developed.Nevertheless, 18 fps was enbugh to fully open the disk against the backstop in all cases.Tests were'run at 'all three stop' angles and at'proximities of 1.5, '2.5, 4.5i'and 10.5diameters upstream. In general, the 3-hole and 36-hole plates were used to cover theflow ranges from 2 to 9 fps, and the 4-hole and 61/67 hole plates were used to cover therange from 7 to 18 fps. It should be remembered that pre~ssure drop -across anyperforate'd plate increases withb thesquare of the flow velocity.- Thus, at the low end ofthe tw~o velocity ranges just mentioned, plate'P was in the 2 to 4 psi range while at thehigh' end of the' ranges the piessure' drop was in the '25 to 35 psi range. "Detaileddiscussionrof results for the 3-inch' valve at;1.5d and 73-degree stop angle will becovered, with the remaining data summarized later in this section.., l
;15

I
Disk Fluctuation Data, 3-inch ValveFigure 16 shows the disk fluctuation data for the 3-inch valve with the stop angle at the73-degree clearway position and turbulence source at 1.5d. The overall plot representsdata from all four of the perforated plates used in the test program. Some importanttrends should be noted:
1. Peak disk fluctuations are considerably higher than for any of the elbow tests,reaching levels of over 15 degrees (peak to peak, 3a).
2. The highest levels occur in the 4 to 6 fps range with the 36-hole plate. As shownin Table 3 data for various orifice plates, this plate has the smaller (3/16")diameter holes.
3. The velocity required to fully open the disk is in the 17 to 18 fps range based upondisk fluctuation levels dropping to under 1 degree. This agrees closely with thebaseline data.
4. The darkened symbols represent those tests where tapping of the disk againstthe stop begins as flow velocity is increased. Compared to the elbow tests, thevelocity zone over which tapping occurs is wider. This is the zone over whichaccelerated fatigue and impact wear occurs.
Figures 17, 18, and 19 show the fluctuation data for the remaining proximities of 2.5,4.5, and 10.5d at the 73-degree stop angle. On each plot an upper bound curve has beendrawn for disk fluctuations at each proximity.
The upper bound data for the most severe disk fluctuations as a function of both flowvelocity and proximity of the turbulence source shown in previous figures are presentedin a more comprehensive manner in Figure 20. As one would expect, at any givenvelocity, maximum fluctuations decrease as the turbulence source is moved away fromthe valve. Also, at all proximities the maximum fluctuations occur at around 6 fps.
To complete a set of turbulence data at all stop angles, the 53-degree and 63-degreefluctuation data at 2.5d is shown in Figures 21 and 22 respectively. We see that peakfluctuations are lower than at the 73-degree stop angle, and, the velocity range over.which disk motion occurs gets; progressively, narrower as the stop angle is decreased.Additionally, the velocity range between onset of tapping (darkened symbols) and diskseating (fluctuations less than 1 degree) is much narrower as well. These trends werealso present in the elbow data. Even though disk fluctuations are much higher thanwere seen for the elbow tests, the velocity margin required over baseline to firmly seatthe disk is very similar, approximately 30 percent at 63 degrees and 15 percent at 53degrees.
Disk Fluctuation Data, -inch ValveFigures 23 through 29 represent the disk fluctuation results for the 6-inch valve withvarious orifices and their proximities. All the trends noted for the 3-inch valve datastill apply to the 6-inch valve; with the exception that at 2.5d the peak fluctuations areslightly higher at velocities above 6 fps than at 1.5d. This can be seen in Figure 27where the data are summarized. A comparison between Figure 27- and Figure 20 showsthat the overall magnitudes of the disk fluctuations are approximately the same for boththe 3-inch and the 6-inch valves, confirming the validity of scaling up of the results inthese tests.
16

Summary of Miuimurn Disk Fluctuations forElbows, Reducers, and Turbulence Sources eFigure 30 is an overall iuxiim'ary and comparison of maximu-m disk'fluctuation datafor all of the upstream disturbances tested for both valves at each proximity. Clearly,the turbulence source has the most severe effect on disk stability, with fluctuationmagnitudes reaching as high as 16 degrees at the closest proximity. As expected, thedisk fluctuations created by the turbulence source continue to decrease as the proximityfrom the check valve is increased, but even at 10.5d the magnitude is as high as withelbows at 5d. One can also see that both the 3-inch and the 6-inch valves showoverlapping data which provides some confirmation of the fact that disk motionexpressed in nondimensional terms of fluctuating angle AO is a valid scalingapproach. Comparisons made against published data by others show that our resultsbound the reported magnitudes of disk fluctuations with other turbulence sources whichinclude control valves, throttled butterfly valves, and pumps as well as the effect oflarger check valves' (References 5, 10, 13, 24, 25). 'Therefore, the upper bound'datadeveloped from' Phase I experiment'.could be"used in -pre'dicting'maximum wear orfatigue that can be caused by disk motion.
The elbow data for both' valves shows that the' overall disk motion is considerably less'than with a' turbulence source and is typically in'the range' of 3 to 5 degrees.- The'maximum fluctuations' at 'the closest proximity-of Od 'are between 6 and 9 degrees rangefor the elbow up condition, which is the most severe elbow orientation. As'reported in'previous elbow results (Reference 5), the disk' fluctuations become negligible 'beyond5d.
One of the most interesting results was the'performance of the check valve withreducers as an upstream disturbance. 'As showni in' this figure,' the disk fluctuationswith the' reducers'even at the closest proximity to the valve' are within the baselinefluctuations that were measured ivith 20d length of upstream straight pipe whichincluded a flow straightening section.' The 'restults' show that the 'reducer employed toinstall a' smaller size check'valve'in'a large'r diameter upstream pipe is not a 'detrimental disturbance in such configuration. One'should be cautioned, however, that'the'reverise situation where a reducer is being used to install a'larger size check valvein a smaller size upstream pipe (which in fact makes the reducer function as a flowexpander) is known to be a definite source of turbulence. Fortunately, for swing checkvalves such installations are rare in typical power plant systems.'
DISK NATURAL FREQUENCY AND DAMPING TESTS '
By, combining data for amplitude of 'disk motion with disk natural frequency data,estimates for hinge pin' wear and disk stud impact wear and fatigue can be made. -Tomeasure 'the 'disk natural frequeiic' tinder flowing c'onditi6ns, a simple test was runon each valve where steady state flow condition's were established with'no' upstreamdisturbance. 'A pushrod was'introduced through 'the; bonnet and used to quickly disturbth'e disk from"'it's equilibrium 'position.' A-strip chart recording was-made of the're'sulting response 'to te'distiiiban~ce. ''Figurie 31 chrs t 'a' s i '-f a ical recordingw
T ~ ~ ~ ~ ~ ~~~iue sows'a section'o atypiclredigAs' is evident from this 'recording, the disk response is relatively'highly damped. 'By'-'measuring successive peaks from a nurmber' of tests, the damping ratio -is calculated as"0.5 ±0.1 for the 6-inch valve and 0.3 0.1' for the 3-inch.' The naturai frequency tests'were performed at a number "of' flow velocities which 'correspond to' differentequilibrium'n positions' of the disk. !The' resuIts are presented in Figure 32. ' '
17

I
An analytical formulation for to predict natural frequency was also developed byconsidering the disk as a single degree of freedom spring-mass system. This ispresented in Appendix A and the results from it for the 3-inch and the 6-inch valves areplotted in Figure 32 for comparison. Another comparison was made against work bySununu (Reference 10) which suggests that the disk natural frequency is proportionalto the eddy frequency generated in normal turbulent pipe flow. This frequency can becalculated as follows:
0.04 V.,g'eddy Rpipe
Test data published in Refe'rence 10 for 2-inch and 4-inch valves is also plotted inFigure 32 for comparison.' Two trends are apparent. First is a trend of increasing disknatural frequency with decreasing valve size. Second is an" increasing naturalfrequency with increasing velocity.' Unfortunately, not enough data are'available todraw firm conclusions about the trends. Other factors such as effective 'disk weightand valve internal geometry may have some effect on the natural frequency. In factthere does not appear to be alinear relationship between natural frequency and velocityfor majority of the data as the previous ~formula suggests. Nonetheless, thesemeasurements give a reasonable quantification of disk natural frequency and form abasis for performing wear and fatigue estimates.
DISK-TO-STOP IMPACT LOAD TESTSTo calculate impact fatigue life of the disk stud/nut assembly when the disk is tappingagainst the stop, estimates of the'impact force can be made based upon the transfer ofkinetic energy of'the moving disk and hinge arm' as'sembly into strain energyabsorbed by the contacting elements. With the load cell apparatus incorporated in thestop mechanism, actual load- measurements were made for the 3-inch valve tocharacterize the load signature' when tapping. It was found that the data 'acquisitionrate had to be increased' considerably - from 40 hz (which is sufficient for themeasurement of'displacement' and pressures) to 4 khz - to properly capture theload/time history.
Figure 33 shows the results' of one'such measurement'made on the 3-inch valve underthe following conditions: flow velocity of 17.5'fps, an'upstream elbow oriented up at aproximity of id, the valve stop angle set at 73 degrees. A number of such measurementswere made under the same flowing conditions, with the highest recorded loads being 35pounds. These measurements' are,'of course, with' the clear'plastic bonnet and theadjustable'stop mechanism which was being'used in the test instead of the actual steelbonnet with'integral 'stop. In all cases,; the contact duration was between 0.003'to 0.0035seconds. To use-this load data, it is necessary to account for the relative stiffnesses ofthe test valve.bonnet/stop assembly and the actual valve. These stiffnesses can be,determined by'testing or analysis. One method would be to apply'known loads to eachassembly and measure'the displacements. Appendix B documents an analysis methodand a calculation in wliich the'relative stiffhesses are estimated. Based'on the 35-pound load measured'and this analysis approach, it is estimated that the' actual impalctload with: steel bonnet having integral stop arrangement will be approximately'270pounds for the 3-inch valve. The impact force results thus obtained can be used inpredicting impact wear between the disk/stud nut and the stop as well as fatigue life ofthis assembly.
18

DISCUSSION
CLEARWAY SWING CHECK PERFORMANCE PROBLEMSA very important result of the elbow tests conducted in this project is' the 'apparentdiscrepancy' between these'tests and those reported in Reference 5 for the minimumvelocity requirements for the 3-inch valve with' stop angle at the' 73-degree clearwayposition and elbows at Od. The earlier tests reported values of 17 fps for elbow down and18 fps for elbow up. The current test program did not fully seat the disk at velocities ashigh as 25 fps. Possible reasons for that difference can be categorized as follows:
1. Differences in flow velocities/conditions;
2. Variations in inlet piping setup;
3. Minor differences in' physical location of stop position(s). -
The first item is unlikely because no evidence of velocity based errors shows up inother tests. All eequipment was calibrated and, in fact,'was the same in both tests.
The second item could conceivably contribute if, for example, the elbow was tiltedslightly' as it was bolted to the valve.' This would cause the flow to enter the valve at adifferent angle relative to the nominal flow axis, in effect changing the full open angleof the valve. This possibility exists-because of the flexibility of the elbow/valveconnection and the difficulty in establishing :the lelbow orientation (using a bubblelevel) at this Od proximity. Finally, physical changes made to the valve between testprograms could have affected the absolute position of the adjustable stop. Sincedifferent assemblies were"iised for the adjustable-stop-devices,' there-could have beensome offset introduced at each stop position;. Although great care was taken to preventthis, a difference between assemblies of 1 degree is a possibility.
The second or third items could create' enough of a difference in this valve to accountfor the observed phenomenon. The large 73-degree opening angle of this valve,combined with the clearway design in which the disk is completely shielded fromdirect flow impingement, makes it very susceptible to these physical changes. It isimportant to realize that there are real-world analogies to both of these test relateditems. First, a real piping installation' will be as likely to'have small angularalignment variations between valve and pipe as the test setup, if not more so. A pipecould very easily be welded to a valve or flange in such a way as to introduce a couple ofdegrees of misalignment between the pipe and valve centeilines. Second, valvemanufacturing tolerances are such that the full open angle of the disk can vary by asmuch as 5 degrees, which'has been observed to be' a typical variation in product linesmade by most manufacturers. This is considerably more than the variation betweentest setups. Even a comparison between the 3-inch and the 6-inch valve (both products ofMCC Pacific Valve Company) in the full open clearway position for the valves used inour tests shows a significant difference in the velocity required to-fully open'the disk:
For these reasons, sufficient velocity margins should be used for clearway designs. To-avoid possible problems, it is best to lengthen the backstop to ensure the disk'protrusioninto the flow stream by at least 10 degrees, which has been found to provide 'much betterdisk- stability under various flow conditions and upstream' disturbances.
19

VELOCITY MARGIN REQUIRED FOR ELBOWS AND REDUCERSOne of the project objectives was to develop appropriate modifications to the minimumvelocity formula to account for upstream elbow and reducer effects and develop thevelocity margins necessary to fully open the. disk under these conditions. The datapresented in Figures 12 and 13 form the basis for these modifications. The appropriatemargins for upstream disturbances are most conveniently expressed as a multiplyingfactor:
V'min = Cup Vmin
where Vmin = minimum velocity required to fully open the disk with anupstream disturbance
Vmin = Minimum velocity required to fully open the disk with noupstream disturbance
Cup = The velocity margin factor accounting for an arbitraryupstream disturbance.
Table 3 presents values for the factor Cup for the different upstream disturbances.Keeping in mind some of the test variables, we have chosen to use factors we feelrepresent the' worst case conditions. Although this may result in somewhat highervelocities being required in certain instances, the error must be conservative to ensuresafe performance.
Table 3
VELOCITY MARGIN FACTORS FOR
UPSTREAM DISTURBANCES, Cup
Elbows Reducers50. 60' 70° 50 60 70°
Otold 1.2 1.4 1.8 1.05 1.05 1.05
1to3d 1.2 1.2 1.4 1.05 1.05 1.05
3 to 5d 1.1 1.1 1.1 1.05 1.05 1.05
Beyond 5d i.0 1.0 1.0 1.0 1.0 1.0
THEORETICAL PREDICTION OFTURBULENCE INDUCED DISK MOTION
.Discussion of the turbulence test results always involves the issue of relatinglaboratory results to the* many different real-world situations which exist. ' Oneapproach, ofcour'se, would be to test all the different types of turbulence producingdevices individually, for their'effect on check valve performance. - An effort thisextensive would"involve' many man-years of test and analysis'-time' and wouldinvariably remain incomplete as new devices arrive on the scene. An alternatemethod would be to use turbulence characteristics of the flow to predict check valve disk
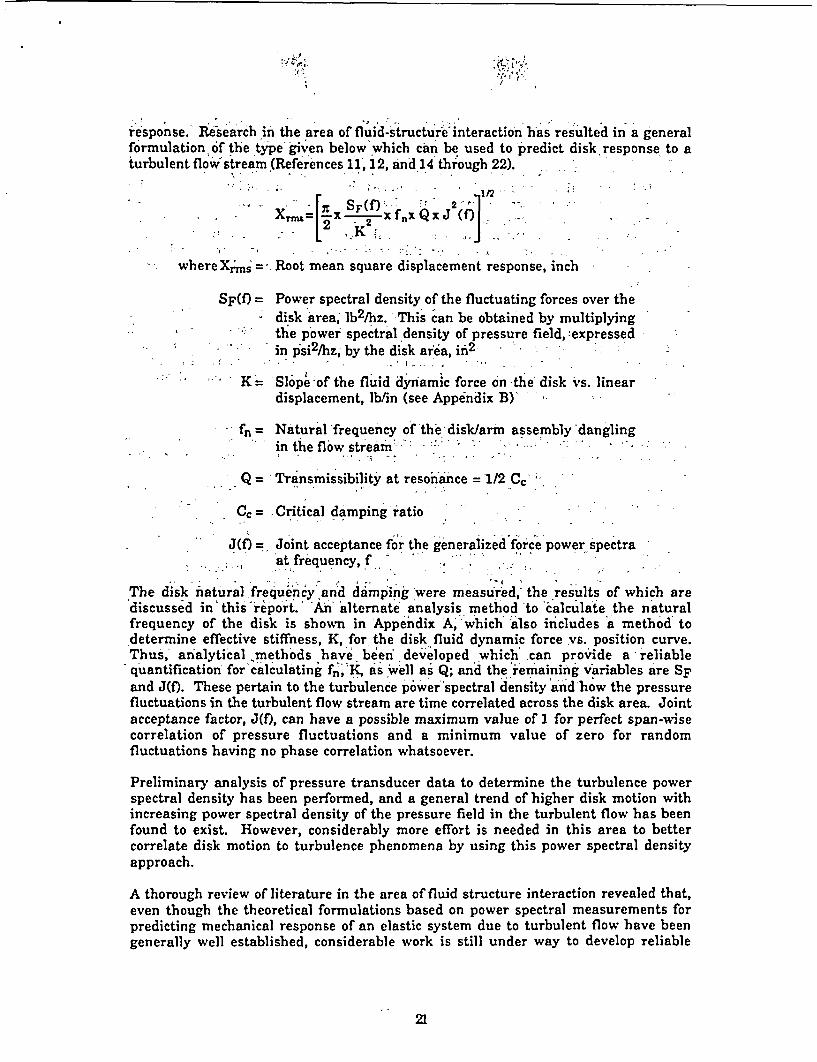
response.- Iesearch in the area of fluid-structure'interaction has resulted in a generalformulation of the type given below which can be used to 'predict disk response to aturbulent flow'stream (References 11', 12, and 14 through 22).
1/2irSF(f)2
X:MJI {X 2 XfflxQXJ
i . , ._..K.. -
whereXrms='= Root mean square displacement response, inch
SF(f) = Power spectral density of the fluctuating forces over thedisk area, lb2Ihz. This can be obtained by multiplyingthe power spectral density of pressure field, expressedin psi2/hz, by the disk area, in 2
K= Slope'of the fluid dynamic force on the disk vs. lineardisplacement, lb/in (see Appendix B)' -
fn = Natural frequency of 'the disk/arm assembly 'danglingin the flow stream' ''
Q = Transmissibility at resoi'ance = 1/2 Cc' -
Cc= Critical damping ratio
J(f) - Joint acceptance for the generalized force power spectraat frequency, f
The disk natural freque'ncy and damping were measured, the results of which arediscussed in this report. An' alternate analysis method 'to 'calculate the naturalfrequency of the disk is shown in Appendix A,'which also includes a method todetermine effective stiffness, K, for the disk fluid dynamic force vs. position curve.Thus,' analytical. methods have been developed which can provide a reliablequantification for'calculatinj fn, K, as well as Q; and the remaining variables are SFand J(f). These pertain to the turbulence power spectral density and how the pressurefluctuations in the turbulent flow stream are time correlated across the disk area. Jointacceptance factor, J(f), can have a possible maximum value of 1 for perfect span-wisecorrelation of pressure fluctuations and a minimum value of zero for randomfluctuations having no phase correlation whatsoever.
Preliminary analysis of pressure transducer data to determine the turbulence powerspectral density has been performed, and a general trend of higher disk motion withincreasing power spectral density of the pressure field in the turbulent flow has beenfound to exist. However, considerably more effort is needed in this area to bettercorrelate disk motion to turbulence phenomena by using this power spectral densityapproach.
A thorough review of literature in the area of fluid structure interaction revealed that,even though the theoretical formulations based on power spectral measurements forpredicting mechanical response of an elastic system due to turbulent flow have beengenerally well established, considerable work is still under way to develop reliable
21

correlation between theoretical predictions and actual tests (References 11, 12 and 14through 22). State of the ,art in this very active area of research still relies heavily uponsound experimental mneasurements which'then form the basis to refline the theoreticalmodels that predict structural response. Vibration resp'onse of cylindrical tubessubjected to cross flow and axial flow is one subject that has been studied extensively bymany different researchers because of its obvious importance to the nuclear powerreactors, heat exchangers, and condensers. This has resulted in significantadvancements in the development of analytical models,' but they are limited to thecylindrical tube structures. Even for this well-studied structure, not much dataregarding power 'spectral density of the pressure field are available in the openliterature.
Therefore, recognizing the limitations of the current state of the art in this field and thelong-term research effort needed to develop reliable analytical methods to predict diskmotions, the effort under Phase I put more focus on developing the needed informationby systematic experimentation using a turbulence source of generic nature. In order toensure that the results have general applicability, suitable: nondimensional scalingfactors were used in our test program.
As presented in detail in the previous sections, many tests were conducted with multi-hole orifice plates in which different sizes and'number of holes were used to control thetwo important characteristics of turbulence: eddy size and turbulence intensity.Proximity of the turbulence source was varied up to 10.5d from the valve. Extensivedata were generated for both 3-inch and 6-inch valves which are presented in Figures16 through 26, 28, and 29. The most important results from these turbulence tests,however, are presented in the family of bounding curves which relate the maximumdisk fluctuation experienced as a function of flow velocity and proximity of theturbulence source and are'shown in Figures 20, 27, and 30. 'Any data available frompublished sources quantifying the disk response due to various turbulence sources(References 5, 10, 13, 24, 25) were reviewed and compared against these boundingcurves. It was found that in no case did the maximum disk fluctuation exceed thevalues plotted in this family of bounding curves.
Thus, these bounding curves, which were produced from our Phase I effort, can be usedto predict maximum swing check valve disk response with a severe turbulence sourcepresent at a defined proximity upstream of the valve.

I 1<11
RESULTS AND CONCLUSIONS
* Phase I has resulted in the development of extensive data and techniques that can be.used to predict the stability of swing check valves under three different types ofupstream disturbances: elbows, reducers, and turbulence sources.' The majorconclusion from Phase I is that the swing check valve disk performance can bepredicted. The specific predictions include: '
* Whether disk stability can'be achieved for a swing check valve' of known diskangle with an upstream disturbance at a defined proximity.
* The-increase in velocity required over Vmin to achieve stability:when adisturbance is present upstream of the valve;
* The maximum disk fluctuations that can be expected due to these upstreamdisturbances.' To predict the worst-ca'se disk fluctuations caused by a severeupstream turbulence source, upper bound curves have been developed;-
* The range of velocity over which'the ^disk fluctuations can cause tapping againstthe backstop which results in impact wear and fatigue of the disk-to-hinge armconnection. The zone of velocity over which the disk is free-swinging withoutimpact has also been defined for various configurations of valves and upstreamdisturbances. In the free-swinging zone, only hinge pin wear is of concern.
In addition to these major conclusions which relate to the specific objectives of Phase I,the important results obtained are summarized below:
1. Stability of clearway swing check valves can be very sensitive to manufacturingtolerances and the physical alignment of piping to the valve. Clearway designswith closely coupled elbows may not attain a stable fully open disk position withany flow velocity.
2. Decreasing the fully open disk angle, *, by 10 degrees in clearway designsgreatly enhances disk stability at the fully open position. It also reduces thevelocity required to fully open the valve;
3. Upstream reducers have little or no disturbing effect on disk stability or velocityrequired to fully open the valve. Reducers are used in the sense that it reduces theflow area as flow approaches the valve;
4. Maximum disk motion due to an upstream turbulence source can be much higherthan for upstream elbows, depending upon the severity of the source. Whencalculating wear, turbulence sources out to 10d upstream must be considered;
5. The minimum velocity margins over Vmin for elbows depend upon the diskopening angle, elbow orientation, and the proximity. Table 3 shows theminimum margins necessary.
6. The minimum velocity margin required to fully open the disk for non-clearwayvalves with an upstream turbulence source is 10 percent higher than baselineconditions, assuming the velocity field remains uniform across the pipe section.Higher velocity margins might be required in the case of turbulence combinedwith velocity skew effects.
23

RECOMMENDATIONS
To achieve the eventual goal of quantifying degradation trends when swing checkvalves are used in less than fully open conditions, which is the case with many valvesin nuclear power plants,' further'research is'necessary. 'Phase I has resulted inproviding definite information regarding flow conditions and the upstreamdisturbances which can cause accelerated wear.n It has also produced data regardingmaximum disk fluctuation, disk tapping zone, and free-swinging zone, which providethe basis for developing quantitative predictions of degradation.
Research should be continued to use the disk'stability information from Phase I todevelop quantitative fatigue and wear life predictions. This can serve as a basis tomake objective decisions regarding suitable maintenance intervals over which checkvalve degradation is within acceptable safe'limits and- which will 'not jeopardize itsoperation. Phase II research, aimed at developing such predictive techniques,verifying them, in controlled' laboratory, conditions, and correlating them with actualplant data should be conducted. The eventual goal of this research effort is to improvethe safety and reliability of check valves in nuclear power plant service properlyaccounting for the expected degradation trends.
24

,r,. ,s,^
M USCES. - -. ,
1. Check Valve Failures or Degradation, Significant Operating Experience ReportNo. 86-3, Institute of Nuclear Power Operations, Atlanta, GA, October 1986.
2. Aging and Service Wear of Check Valves Used in Engineered Safety-FeatureSystems of Nuclear Power Plants, NRC NUREG/CR-4302, Vol. 1, December 1985.
3. Loss of Power and Water Hammer Event at San Onofre Unit 1 on November 21,1985, NRC NUREG-1190.
4. Chiu, Chong, and M. S.: Kalsi. Failure 'Analysis of Swing Check Valves - SanOnofre Nuclear Generation Site - Unit 1, NRC Docket No. 50-206, April I986.
5. Application Guidelines for Check Valves in Nuclear Power Plants, EPRI NP-5475, January 1988. - -
6. Idelchik, I.E. Handbook of Hydraulic Resistances, 2nd Edition, HemispherePublishing Corporation, New York, 1986. ' -
7. Ward-Smith, A. J. -Internal Fluid Flow: The fluid Dynamics of Flow in Pipesand Ducts, Clarence Press, Oxford, 1980.. - -
8. Tullis, J. Paul, et al. Perforated Plates 'as Hydraulic Energy Dissipators, UtahWater Research Laboratory, Utah State University, no date.
9. Tullis,- J. Paul.- Valve Sizing to Avoid Cavitation, Utah Water.ResearchLaboratory, Utah State University, no date.
10. Sununu, John E. -Wear in Check Valves Due to Flow Induced Motion, Master'sThesis, Massachusetts Institute of Technology, May 1987.
11. Blevins, R. D. Flow Induced Vibration, Van Nostrand-Reinhold,1977.
12. Flow-Induced Vibration of Power Plant Components, edited by M. K. Au-Yang,ASME Paper No.,PVP-41,1980.
13. Tullis, J.; P., and W. J. Rahmeyer. Performance Tests on Feedwater CheckValves for San Onofre Nuclear Power Plant, Phase A and Phase'B, Utah StateUniversity Foundation Report, April 1986.
14. Flow-Induced Vibration Design Guidelines, edited by P. Y. Chen, ASME No.PVP-Vol. 52,1981.
15. Advances in Fluid-Structure Interaction - 1984, edited by G. C. Everstine andM. K Au-Yang, ASME PVP-Vol. 78, 1984.
16. Advances in Fluid Structure Interaction Dynamics, edited by F. J. Moody andY. W. Shin, ASME PVP-Vol. 75, 1983.
17. Dynamics of Fluid-Structure Systems in the Energy Industry, edited by M. K.Au-Yang, S. J. Brown, and J. Ray McDermott, ASME PVP-39,1979.
25

18. Volume 1: Excitation and Vibration of Bluff Bodies in Cross Flow, Symposium onFlow-Induced Vibrations, edited by M. P. Paidoussis, 0. M. Griffin, andM. Sevik, papers presented'at The' ASME Winter Annual Meeting, New Orleans,Louisiana, December 1984.
19. Volume 2: Vibration of Arrays of Cylinders in Cross Flow, Symposium on Flow-Induced Vibrations,' edited by M. P. Paidoussis, M. K Au-Yang,'and S. S. Chen,papers presented at The ASME Winter Annual Meeting, New Orleans,Louisiana, December 1984.
20. Volume 3:Vibration in Heat Exchangers, Symposium on Flow-InducedVibratio'ns, edited by M. P. Paidoussis, J. M. Chenoweth, and M. D. Bernstein,papers presented at The ASME Winter Annual Meeting, New Orleans,Louisiana, December 1984.
21. Volume 5: Turbulence-Induced Noise and Vibration of Rigid and CompliantSurfaces, Symposium on FIlow-Induced Vibrations, edited by M. P. Paidoussisand A; J. Kalinowski, papers presented at The ASME Winter Annual Meeting,New Orleans, Louisiana, December 1984. :
22. Volumee 6- Computational Aspects of Flow-Induced Vibration, Symposium onFlow-Induced Vibrations, edited by M. P. Paidoussis and S.' S. Chen,' paperspresented at The ASME Winter Annual Meeting, New Orleans, Louisiana,December 1984.
23. Chiu, C.. and M. S. Kalsi. Plant Availability improvement by Eliminating DiscVibrations in Swing Che'ck Valves, ASME Paper No. 86-JPGC-NE-6, October1986.
24. Rahmeyer, W. J. The* Effect of Upstream Piping on Swing-Check Values,Journal of Authority of Water Work Association, pp. 553-555, November 1983.
25. Statton, J. A. 'Modification Based on Stability and Wear Studies. Presented atINPO Check Valve Workshop, October 1986.
26. Kalsi, M.S. Analysis of the 4-Inch Tilting Disc Check Valve Problems andProposed Modifications, Kalsi Engineering, Inc. proprietary report to SouthernCalifornia Edison dated 8/11/86.

-HINGE ARM
OC SEAT. PLANE TILT WITH RESPECT TO VERTICAL
DISC ANGLE WITH RESPECT. TO HOR ZONTAL
G: (+ ,$ ) TOTAL IMPINGEMENT ANGLEd>r DISC OPENING ANGLE
CHECK VALVE CONFIGURATION
FIGURE 1
27

L, Wuml %t "-j I. I. -
CHECK VALVE TEST SETUP
FIGURE 2
28

KALSI ENGINEERING, INC.MECHANICAL CIESKGN & ANALYSIS
>-1.. A
PRIMARYPC TI IOU Co fWBYPASS RETURN FLOW -
ADJUSTABLE
BYPASS VALVE aF
I& --
w-
V
1TlrT i-r~
I I
PIPING SECIION-
-- I ; *, 1,STRAIGHTENINO
UPSTREAM ELBOW'K=3[1 ¾) KU(VERTICAL UP)
SIRAIGHTENING VANES
StRAIGHTENINO VANEy
I,' / / / / / / / / / Z/ / / / / / / / / / / / / / - / / / / / / / / / - / / / / / / 'IKALSI ENGINEERING, INC. FLOW TEST FACILITY
FIGURE 3

ADJUSTABLE BACKSTOPWITH LOADCELL -
LVDT FOR MEASURINGDISC MOTION
INSTRUMENTED VALVE CROSS SECTION
FIGURE 4
30

DISK FLUCTUATION vs FLOW VELOCITYBaseline, 20d upstream (a Inch)
4.e
I,1amto0.
I
3.
2.8 -
2. -
2.4 -
22
1.6
1.6
1.4
12
1
0.6
o0.
0.4
02
00 4 6 12 I1 20 24
Flow Velocity. fps
COMPOSITE PLOT OF DISK FLUCTUATIONS FOR6" VALVE, BASELINE TESTS
FIGURE 5
31

D, IN. It Y. IN.', Y/ |3 1 0 I 0 .6 1 0.8 1.133
DISK PROJECTION COMPARISONCLEARWAY SWING CHECK TEST VALVE
FIGURE 6
32

3
2.5
2.6
10
I"Q
11
2.4
2.2
2
1.8
7.6
1.4
12
0.x
0.6
0.4
DISK FLUCTUATION vs FLOW VELOCITYBasellne (20d pipe upstream) (3 Inch)
I j T I [ II 1 '-1 111 X I
73 eg I
6S -i -
_ = 53 D -zg02
00 4 8 72 16 20
Flow Velocity. fps~: ~ , , . , . . I ' 'J~~~~~~~, .- , ."- .' -" , :- - I e . - -- , <s
COMPOSITE PLOT OF DISK FLUCTUATIONS FOR3" VALVE, -BASELINE TESTS
FIGURE 7
33

ELBOW UP
DEFINITION OF ELBOW ORIENTATION
FIGURE 8
34

DISK FLUCTUAT ION vs FLOW VELOCITY. Elbow Up C Od I
a
a
4J1
a
+
7
a
4
31
2
1
0f0 4 8 72 la 20 24
Flow Velocty, tps
COMPOSITE PLOT- OF DISK FLUCTUATIONS FOR3" VALVE AT VARIOUS DISK STOP ANGLES
FIGURE 9A
35

DISK FLUCTUATION vs FLOW VELOCITYElbow Up 0 Od (d Inch)
a
El
'a
U
:4.
051.2
*-0
I4
3
2
I
00 4 . 8 12 1a 20 24
Flow Velocity. t
COMPOSITE PLOT OF DISK FLUCTUATIONS FOR6" ,VALVE AT VARIOUS DISK STOP ANGLES
FIGURE 9B
36

!' !
DISK FLUCTUATION vs FLOW- . I Elbow Down e Od
VELOCITY
I-
4. J
'a
e
C.,
*-Z
* - . '~Flow Velocfty. fps
COMPOSITE PLOTOF DISK FLUCTUATION FOR3" VALVE AT-VARIOUS DISK"STOP ANGLES
FIGURE 1OA
' 37

DISK FLUCTUATION vs FLOWElbow Down 0 Od (6 Inch)
VELOCITY4
3.5
0
4.d
z11
Q
*1
3
2.5
2
1.5
1
0.5
a0 4 8 12 16 20 24
Flow VelocIty. fps
COMPOSITE PLOT OF DISK FLUCTUATIONS FOR6" VALVE AT VARIOUS- DISK STOP ANGLES
FIGURE 10B
38

cf,w
0
0
2-
-
U,
en
xm:
1.513-,. 0
. LID, 6 INCH (DARK SYMBOLS)
2 .4' . -. 6, 8 10 12 : 14
16
14-
12-
. . . . . . . . . . I................................ . .
: ,;: . . - -A -ELBOW UP
v v ELBOW DOWN
S O REDUCER
lo+ :
8-f
6-
4.
2
. BASELINEFLUCTUATIONS
_ p _~c~ _ 0…__ _ _ _ _
. Iu . l l l
.
o ' '1
I .; ., I i-
i,2D .
MAXIMUM
2 . 4 . . . .- .- 6 .8 -10 - *- 12 . 14.. . , r
L/D, 3 INCH (OPEN SYMBOLS)I I ~ I ., * - I , *' - a - .I
. - !- : . , ' ., - 1 ' ,. , * : ._ . .,
DISK FLUCTUATION VS. DISTANCE TOUPSTREAM; DISTURBANCE '
FIGURE 11
39

£LU<25 -
C ELBOW UP = _=0
c. \ ' v ELBOW DOWN
20- - REDUCER -z
-A BASELINE: 17.4 FPS, 73°0a.0 15--
in
,10-_U.
U. c 2 BASELINE: 7.2 FPS, 630
F 5- . ~~~~BASELINE: 5.1 FPS, 530
O0
-J
C] O-. I : i | | § § I I. i I I _U ° 1 2 3 .4 5 6 7 8 9 10 11 12 13
L/D, DISTANCE TO UPSTREAM DISTURBANCEaU .. .- t .
ELBOW AND REDUCER TEST RESULTS3 INCH SWING.CHECK VALVE.
FIGURE 12
40

cc:
w
F2-c 25 - * ,
in :&ELBOW UP =
&20- - ,( \ ELBOW DOWN
Z - 0 REDUCER
LU
° 15-BASEUNE: 13.8 FPS, 700
10
0m
BASELINE: 6.3 FPS, 600 -
o - BASELINE: 4.7-FPS, 500
Lu
-0 t01 -2 3 4 5- 6_7. 8 9 10 11 12 13
LID, DISTANCE TO, UPSTREAM.:DISTURBANCEai -
ELBOW AND REDUCER TEST RESULTS'- 6 INCH SWING CHECK- VALVE
'FIGURE 13
^~~~ ~~ /. - *. 1'
41

DISK FLUCTUATION vs FLOW VELOCITY-t Reducer 0 Od (a Inch)
C.I
Q
C!,
*.2
3-
2.61
2.0
2.4
2.2
21.8
1.4
1.2
1
0.6
0.6
0.4
0.2
00 4 8 12 i1 20 24
Flow Velocity, fps
COMPOSITE PLOT OF DISK FLUCTUATIONS FOR6" VALVE WITH 8" x 6" REDUCER AT OD
FIGURE 14
42

3 & 6 INCH PERFORATEDPLATE HOLDERS
FIGURE 15
.. - . . . I
d . ..
43

2 16- 0=36 x 3/
w ca 14 A- ° \ . 0~~~~~~~~0 61 x 3/1
012- - - / 7e X v = 4 x 7/8'0103
<8 A
u. 4- /°vven 2-
0 2 4 6 8 10 12 14 11FLOW VELOCITY, FPS
DISK MOTION OF 3 INCH VALVEDUE TO TURBULENCE
PERFORATED PLATES AT 1.5 DIAMETERS UPSTREAMSTOP ANGLE AT 73 DEGREES
FIGURE 16
6 18
44

1 8 -
I16 0 = 36 x 3/16" DIAc 0 = 61 x 3/16"'DIA
14 = 3 x 7/8" DIA
Q 12 i _ V = 4 x 7/8" DIA
0 6 o,-j-
in 2
. , , ~~~; .1 . .. I .1 . . . .. I . . ...o 2 4 6 8 10 12 14 16 18
FLOW VELOCITY, FPS
'DISK. MOTION OF 3AINCH VALVEPRRT DUE-TO TURBULENCE
PERFORATED;.PLATES AT 2.5 DIAMETERS UPSTREAMSTOP 'ANGLE AT 73 DEGREES
FIGURE 17
45

I
18 -
UJ 16- 0 = 36 x 3116" DIA0 = 61 x 3/16" DIAen14--
cJ 1 = 3 x 7/8" DIA12 V = 4 x 7/8" DIA
o 10--
sol06-
-J~~~~~~1
0
0 2 4 6 8 10 12 14 16 18FLOW VELOCITY, FPS
DISK MOTION OF 3 INCH VALVEDUE TO TURBULENCE
PERFORATED PLATES AT. 4.5 DIAMETERS UPSTREAMSTOP ANGLE AT 73 DEGREES
FIGURE 18
46

18 , , , , , I , .
U16 0 = 36 x 3/16" DIAus 0 = 61 x 3/16" DIAa 14 - -,3 x 7/8" DIAwD12- V=4x7/8" DIA
0lol
6--
06
0 2 4 '6 ;8 10* 12 14 16 18
FLOW VELOCITY, FPS -
DISK MOTION OF'3 INCH VALVEDUE TO TURBULENCE
PERFORATED PLATES AT 10.5 DIAMETERS UPSTREAMSTOP ANGLE AT 73 DEGREES
FIGURE 19
47

20- .
U,w
w 1.5D
0~10
us 0~~.5D*_D -
4.51)
IL 5
00- I , I , I I I§ I , , I , _
0 1 2 3 4 5 6 7 8 9 10 11 12 13FLOW VELOCITY, FPS
MAXIMUM DISK MOTION OF 3 INCH VALVEDUE TO TURBULENCE
PERFORATED PLATES AT 1.5 TO 10.5 DIAM.UPSTREAMSTOP ANGLE AT 73 DEGREES
FIGURE 20
48

wiLu
i.21
C-,
IL
C'd
2 4 6 8 10- 12 14 IFLOW VELOCITY, FPS
DISK MOTION OF 3 INCH VALVEDUE TO TURBULENCE
PERFORATED PLATES AT 2.5'DIAMETERS UPSTREAMSTOP -ANGLE AT 53 DEGREES
FIGURE 21
49

u1616.LU1
014 .
D 12 .
:10 2 4 6 8 10FLOW VELOCITY, F
DISK MOTION OF 3 -NCDUE TO TURBULE
PERFORATED PLATES AT 2.5 DIAMSTOP ANGLE AT 63 DE
FIGURE 22
12 14 1?Ps
CH VALVEENCEIETERS UPSTREAMGREES
50

18 t-
CDLu
0
-jLL
U,05
8 . ' . I OFLOW VELOCITY, FPS
DISK:MOTION OF,6 INCH VALVE' DUE TO TURBULENCE
PERFORATED PLATES AT 1.5 DIAMETERS UPS'STOP ANGLE AT 70 DEGREES
TREAM
FIGURE 23
51

16 0 = 36 x 3I1w 0 =67 x 3/i
w 14 =3 x1-3,° 12 \V4 x 1-3
i~~~~~~10-
0 6 i Ba
A=4 OA a 111I <
<8-
y-
n0
0 2 4 6 8 10 12 14 11FLOW VELOCITY, FPS
DISK, MOTION, OF 6 INCH VALVEDUE TO TURBULENCE
PERFORATED PLATES AT 2.5 DIAMETERS UPSTREAMSTOP ANGLE AT 70 DEGREES
FIGURE 24
52

1 8 .
cu 1 = 36 x 3/8" DIA..w16m 0 = 67 x 3/8" DIA
014 = 3 x 1-3/4" DIA
12 to|V = 4 x 1-3/4" DIA
<8-
6-
LL 4 0
0
0 2 4 6 8 10 12 14 16 18
FLOW VELOCITY, FPS
DISK MOTION-OF 6 INCH VALVEDUE TO TURBULENCE
PERFORATED PLATES AT- 45, DIAMETERS -UPSTREAM"'STOP ANGLE AT 70 DEGREES
FIGURE 25
53

u 16 0=36 x,3/8" DIA14 0 = 67 x 3/8" DIA
ws = 3 x 1-3/4" DIAcl 12- V= 4 x 1-3/4" DIA
"~8
C.)6
u. 4-cl_21 o a l0
0 2 4 6 8 10 12 14 16 18FLOW VELOCITY, FPS
DISK MOTION OF 6 INCH VALVE-DUE TO TURBULENCE
PERFORATED PLATES AT 10.5 DIAMETERS UPSTREAMSTOP ANGLE AT 70 DEGREES
FIGURE 26
54

20- . . . . . .
ww
CID 1 25 1.55-
.0~~~~.1
o 2~~~.51D
10
- ~FLOW VELOCITY,, FOS
MAXIMUM DISK MOTION, OF 6 INCH VALVEDUE',TO TURBULENCE
PERFORATED,.PLATES'AT 1.5 TOJ10.5 DIAM .UPSTREAMSTOP ANGLE ,AT-,70,DEGREES'-C.,, : Fa E..2.
U,~~~~-, ;,; iGR 2, -D.
-55

us
w
cr.w0
2F0
I-
.pC.)
-J-
Ca5
18
16-
14-
12-
- - - - - - - - - - - - - - - - - - -. . . . . . . . . . . . . . . . . . .0 = 36 x 3/8" DIA
o = 67 x 3/8" DIA
a = 3x1-3/4" DIA
v=4 x 1-3/4" DIA10+
6+ a
0 0 -lapo~~~etA.
/0 . . mp
.4
2-
0 U WA Up .1,& 'VP \Ai.
0 2 4 .6 8, 10 12 14 16 18FLOW VELOCITY, FPS
DISK MOTION -OF 6: INCH -VALVEDUE TO TURBULENCE
PERFORATED PLATES AT- 2.5 DIAMETERS UPSTREAMSTOP ANGLE AT 50 DEGREES
FIGURE 28
56

18 4 . . . . . . . . . . . . . . .
I . . . . . . r U
c,,www0
2F0
C.)
-JIL
U)
16t
14-
12-
10-
8-
o = 36 x 318" DIA-
o = 67 x 3/8"DA D
a = 3 x 1-3/4" DIA
v= 4 x 1-3/4" DIA
0 0
0-
AMA' an'-
A --
0A 3 .
. 0£1 ,Q &Z
4+
~~ jr .v~~', V., x
0. .
. . . . os. VAv %XV - I .. . s . _ . _
0 2 4 6 8 10 12 1411. 8
16 is*. us FLOW. VELOCITY, FPS
- DISK.MOTION OF 6 INCH VALVEDUE TO TURBULENCE
PERFORATED PLATES-AT 2.5 DIAMETERS UPSTREAMSTOP ANGLE AT 60 DEGREES
FIGURE 29
57

fl)ww0en
a:
zT2F0
I--C.)m-UU-
3x)
18 ' C1.51
i8, I is
L/D, 6 INCH (DARK SYMBOLS)
2 4 6 8 10 12 14. . . . . . . . . . . . I
I I a I a a ~~~~~~~~~~~~~f I
16 +
12
10
*A ELBOW UPci }vv ELBOW DOWN 1m
I 0 0 REDUCER
* OTURBULENCE
at ~~~BASELINE tFLUCTUATIONS L
-_- … _=-
8-4
64
41
2-
0 i i0
I- -1 2D '
I I * I I I I I I
-* 4 a & I I I & I2 4 6 8 10
L/D, 3 INCH (OPEN SYMBOLS)
12 14
MAXIMUM DISK FLUCTUATION VS. DISTANCE TOUPSTREAM DISTURBANCE
FIGURE 30
58

I I I I-t I I I A I I I .I I I I I ** I -I i *-r I I I* I I II
.i::
11'd in UI I
.. ..A. . . . . . . .
.. ... ... ... 1 1. ...... 1.
. ... . . . . . . . . . . .. .. . . . . . .
.... .... .. . ... .... .... .
1.
*I I I I
IT
* II i*.
ii Ii
B.
.., ::'1 ';[email protected] @@*w w*s.!: ., . ::
i' ''' ....... .j;.. _ i :::: :'?,. ri.. .: ::::
.. ?.' *:-- I... .:: :.:. .... :.:. ;:;.
*',0- .'-, I'.e. *- ..': - ;;..
,. '.. :;.: _'i.':;
I . I . .l_ _I .. I
..- .:. . ". ..- .'. ,; ;:. ;'. .-. .... .... .
.:. rlos ; ~~~~~. .,.. .s'... ... a}. ....
/.. * ... . .... .... ... ... .... .... .... .... ....
:' - .. : :': ... .. ... l I. .._. .......
I ~. .' , .:.. '.A\/ '-;...:.
I I I I I I I - I I
. ....... .::: .... ...:.1 :..:1...: .. . .: .. . . ... ..:: ..
... ... .... --
. . ... '- .. ... ....-1.... .. ... ....
'/ . 1: : :'....::....:.. 1
....
....
...
I1::,.
I'
i
I ~. I I I I I I I I I I II I I I III I I I . I- l-~ I
I: i
.;!i
I:::
:.1.
:T
:1!
: V:� i,:. i.
.r.,
...': 7;::I:
L:;!,:I;
.::: I
a .1II
'!Ill
....
::.I
.7
..i.
j I!:
U' I I~~~~~~~~~~~~~~~~ Nw
.. .... .... .... . .. .. ... ... ... . .. .. . .... .... .... .... ... ~ ~ ~ ~ ~ ~ ~ ~ ~ ~ ~ ~ ~ ~ ~ ~ ~ ~ ~ ~ ~ ~ ~ ~ I..
... .... . .... ... . .... .... .... ....~~~~
--I -I - I -1 L"..i.I:~~~~~~~~~~~~~~~~~~~~~~~~~~~~~~~~~~~~~~~~~~~~~~~~~~~~
D I S R E S P O N S E T L I L _S T _R B _ _A, 6 " V A I J A - L-L.-I .... L . -I- I .1_;.1__AJL.
DISK RESPONSE TO DISTURBANCE, 6" VALVENATURAL FREQUENCY TESTS
FIGURE 31

N 4
Z: 1:
z
1u0 3INC
v 4 INC0 6 INC
0
0 2 4 6 8 10FLOW VELOCITY, FPS
: FROM REF 10
DISK NATURAL FREQUENCY
FIGURE 32
60

Topping, Stop @ 73 deg, 17.5 fps4000 Sanples/Second (3LUT7D004 sec. set)
30
28
26
24
22
20
-J.0
18
16
14
12
10 ---
8~1--
41-
0 40.03200 0.04000 0.04800 0.05000 0.400 0.07200 OD.80
Time, seconds
DISK-TO-STOP CONTACT LOADS, 3" VALVE
FIGURE 33
61

I
APPENDX AFORMULATION OF SWING DISC CHECK VALVE
DISC NATURAL FREQUENCY

-APPENDIX AFORMULATION OF SWING DISC CHECK VALVE
DISC NATURAL FREQUENCY
The natural frequency of a single degree of freedom spring-mass system is given by:
_ 1 '/ K-tifffn 2 e
where fn = natural frequency in hertz
Kjtiff = system spring rate, force/displacement
M = system mass
For the check valve, effective spring rate can be expressed as the force required to openthe disc to some equilibrium angle, 0. An-expression for this force as developed irReference 5 is:
F = kApV2 sinO sin0/2 -
where F = fluid force acting on the disc
k = an empirical constant dependent on valve geometry
A = disc area
V = fluid mean velocity
0 = fluid impingement angle (see Figure 1)
K~tiU = 1 d.F where R = radius from hinge pin to disc I
R dOd
Ktiff= 1 kApV2 d (sin nsine)
R dO 2 iG
K~tifr= kR (ose sin2 +-2 c sing)
Finally,
1 .:/kApV2 Z= R~Mf =[ n s
where Z = cosO sin 0 + 2cos 2sinG]
63

From the results of baseline tests reported earlier in this document, the relationshipbetween velocity and 0 can be measured. These values are tabulated below for bothvalves, along with the resulting natural frequencies. Pertinent valve data are:
A (ft2)
p ('b/ft3)
R (ft)
M (lbs)
k
3'
0.067
62.4
0.23
2.3
2.0
6"
0.26
62.4
0.42
9.5
2.0
(water, 70'F)
(1/2Mhinge arm + Mdjsc)
3" VALVE
Velocityfp S
0d e
z fnhertz
I -c I.
4
6
8
10
12
48
30
25
22
20
0.61
0.47
0.40
0.36
0.33
1.98
2.60
3.20
3.80
4.36
6" VALVE
Velocityfps
0d e L
z fnhertz
I J. I
4
6
8
10
12
53
34
27
24
22
0.63
0.51
0.43
0.39
0.36
1.44
1.94
2.38
2.83
3.27
64

APPENDIX BM-AETHOD FOR ESTIMATING IMPACT FORCE
FROMTESTRESULTS
65

APPENDIX BMETHOD FOR ESTIMATING IMPACT FORCE
FROM TEST RESULTS
Check valve testing uses a plexiglass bonnet for test observation of disc motions. Thestiffness of this plexiglass bonnet is different from the actual steel bonnet stiffness;therefore, the time history of impact force measurements from the tests will be differentfrom the actual disc impact in service for the same amount of disc energy beforeimpact. However, this difference can be adjusted based on the following estimations:
ACTUAL VALVE ASSEMBLY
I DI~SC
TEST ASSEMBLY
/1M7PA67~ 1WrFAS41RCM,;AJ7-
PL PX6,LA&S
The assemblies can be described in the following math models:
ACTUAL VALVE ASSEMBLY TEST ASSEMBLY
.EK,COA818/JED480/u,4cF7 AC.S..S ri FAIZ;S~'AI A I
-
KM D/5SC,
I KE "/uFT/C4PNsfls Y,
or 04rC
5
KIrCOAIN/MED0K, oMN~ver ASJ.
0p1E-X16CA34 00,-Al)
/<2 D IsCr
M4 -DIC MAlS,
'-1A(e A'I.V;n7C 19AG'6 YC.C DISC
The stiffnesses can be estimated from the design dimensions and material properties.Then from the test results we can estimate the impact in the actual valve assembly as:
66

Let IKE = Kinetic energy before impact
KA = Combined stiffness for actual valve assembly
1 1.K, K2
KT = Combined stiffness for test assembly
11 1
At peak of impact force, the KE is completely converted to the potential energy, PE,(assuming no permanent deformation as:
PE =KE K 2=2 K( P ) I 12 2 'K/ 2 K
where P = Peak force
K = Combined stiffness
If PA is the actual impact force and PT is test measured peaX force, then we have
-~~~ 2 ~2PE = KE 1 PA 1 PT
2 KA 2 KT
PA= PTASJ 1 F
KT ,
I.~~ ~ ~ U
67

Bonnet Stiffness Calculations
3" Test Valve Assembly
z 2EA 30 x 106 x X(3/8)
K, = LC = - 7L ~~~7
= 473,343 lb/in +-
30xl1x -(3/16)2EA 4
=i L - 0.5
= 1,656,699 lbrin -
K3 = 200= 200,000lb/n 4-.001
6 EA 30x10xK4 =L-
L1
= 70,685,835 lb/in 4-
30 x106 x(3/4 3/82)< K-7 K =EA 4
L 2.5
= 3,976,078 lb/in
I
IF _EA _
L
30 x 106 x - (2 1/4 _ 13/16)4
1.5
= 69,151,854 Wb/in
68

K7: vCentral Load Assumed
C i, E --0 1I7.25^+~~125
CastAcryicE = 0.4 x IOC psi
-W a2
Ymx= 16xD a radians
I -_____
i ( -' 2 1)
100(7.25 )2
16 xc 30 x 10 1~12(1 -0.3 2)
= 0.00004872 in
.: K7 = 20,524,968 Wlmin
KT = 1
K 2 K 2 K7
110-' (2.1126 + 0.6036 + 5 +0.014 +0.252 + 0.0145 + 0.049)
= 10-6x8.0457
KT = 124,2901Min -
AE 4-(0.6875) x 30 x 10KDisZ = 1.5 = 7,424,467 lbin
>> KT
If KDisc is close to the actual total stiffness of the disc and bonnet assembly (i.e.KBonnet >> KDisc) then
Formual - F~easured is e
7,424,467 0lb3124,290
69

NAC FORM 234 U S. NUCLEAR REGULATORY COMMISSION I REPORT NUMBER IA.s+.d v nIoC Ja" vo N0* R*YINACM 1102. N~~~~~~~~~~~~~~IUREG/CR-5 159
0RCM 1302 BIBLIOGRAPHIC DATA SHEET KEI No. 1559
SEE INSTRUCTiCNS ON THE REVERSE
2 TITLE ^ND SUBTITLE 3 LEAVE BLANK
Prediction of Check Valve Performance andDegradation in Nuclear Power Plant Systems .OATEREPORTCOMPLETED
5 AUTORMSI April 19884 DATE REPORT ISSUED
M. S. Kalsi, C. L. Horst, J. K. Wang MONTH YEAR
May 1988? P(RPORMiNG ORGANIZATION NAME AND MAILING ADORESS Cc W FZ I PROJECTITASKAVORK UNIT NUMBER
Kalsi Engineering, Inc. SPIN OR GRANT NUMBER
745 Park Two DriveSugar Land, Texas 77478 FIN D2042
1 SPONSORING ORCGAN1ATION NAME ANODMAILINGADODRESS $ft.d.Zd oCJI 1 I TYPE OF REPORT
Division of EngineeringOffice of Nuclear Regulatory Research Technical/FinalU.S. Nuclear Regulatory Commission b PERIOD COVEREO (tIIu- /
Washington, DC 20555 9/87 - 4/88
12 SUPPLEMENTARY NOTES
I} ABSTRACT (2OOWEI.l .hj
Degradation and failure of swing check valves and resulting damage to plant equipmenthas led to a need to develop a method to predict performance and degradation ofthese valves in nuclear power plant systems. This Phase I investigation developedmethods which can be used to predict the stability of the check valve disk whenpiping disturbances such as elbows, reducers, and generalized turbulence sourcesare present upstream of the valve within 10 pipe diameters. Major findings includethe flow velocity required to achieve a full open, stable disk position, the magnitudeof disk motion developed with these upstream disturbances with flow velocities belowfull open conditions, as well as disk natural frequency data which can be used topredict wear and fatigue damage. Reducers were found to cause little or no performancedegradation. Elbow effects must be considered when located within 5 diameters ofthe check valve, while severe turbulence sources have significant effect at distancesto 10 diameters.
Clearway swing check designs were found to be particularly sensitive to manufacturingtolerances and installation variables making them likely candidates for prematurefailure. Reducing the disk full opening angle on these clearway designs resultsin significant performance improvement.
14 DOCUMENT ANALYSIS -* KEYWOROSIDESCRIPTORS I5 AVAILABILITY
Swing check valves, check valve degradation, disk fluctuations, upstream STATEMENT
disturbance effects Unlimited
S6 SECURITY CLASSIFICATO%
IT... pf.
B IOENTIPIERS OPEN ENDED TERMS Unclassified
Unclassified1 NUMBER O, PAGES
iB *0RCE
*U.S.GOVERNMCNiT PRINiTINGC OVICE.¶9a8-202.292MO0SS

-
UNITED STATESNUCLEAR REGULATORY COMMISSION
WASHINGTON, D.C. 20555
OFFICIAL BUSINESSPENALTY FOR PRIVATE USE, $300
POSAGEEr EESPAID
USNRC 1
PERMT No.G-6 J
zamC)0
01
m
0'100m07;
.m
0m
z00
mC)0
0z
zc:0m
0
m
-1
mC')
-coa'Q*