i-know presentation: code - commerically empowered linked open data ecosystems in research
TRANSCRIPT

Commercially empowered Linked Open Data
Ecosystems in Research
Towards unfolding todays and tomorrows
scientific treasures
Michael Granitzer
University of Passau
1FP 7 Strep No. 296150
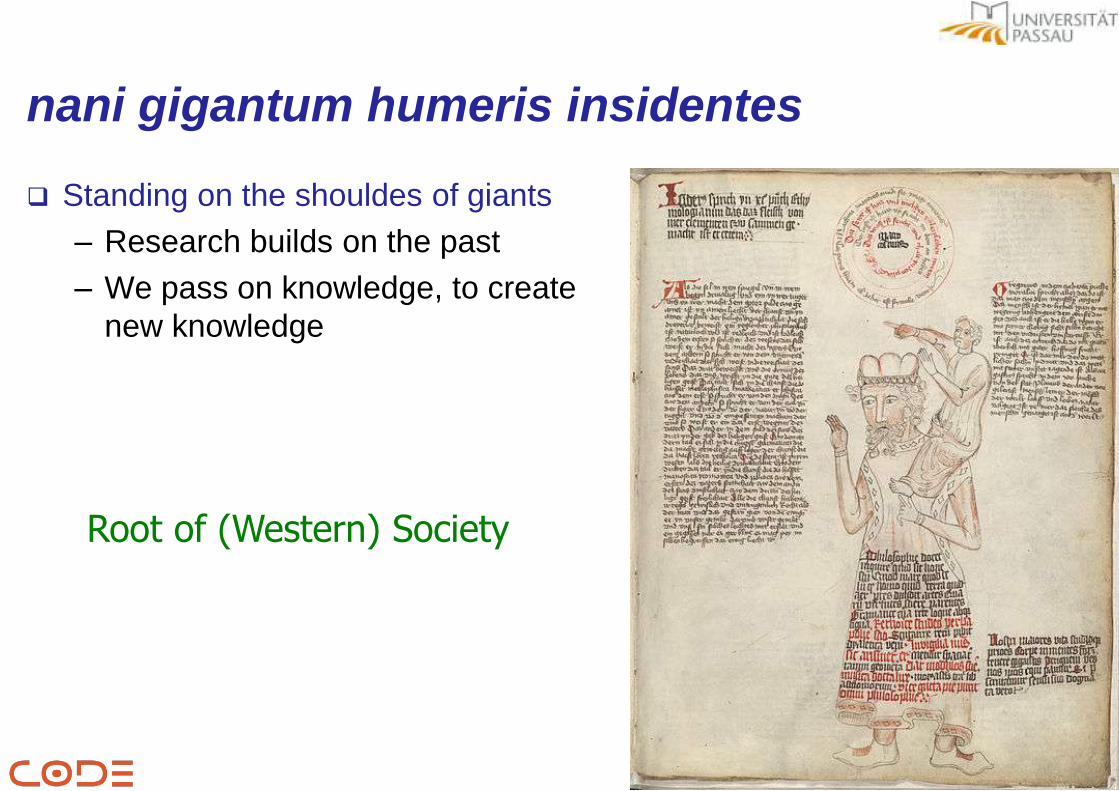
nani gigantum humeris insidentes
Standing on the shouldes of giants
– Research builds on the past
– We pass on knowledge, to create
new knowledge
2
Root of (Western) Society

Lying under a pile of text documents
.. with varying quality
.. with contradicting facts
.. with missing data
.. labour intensive to compare results
Some examples
– “Improvements that don’t add up”Armstrong et. al. 2009
– “Why most research results are false”Ioannidis, 2005
3
Can we do better?
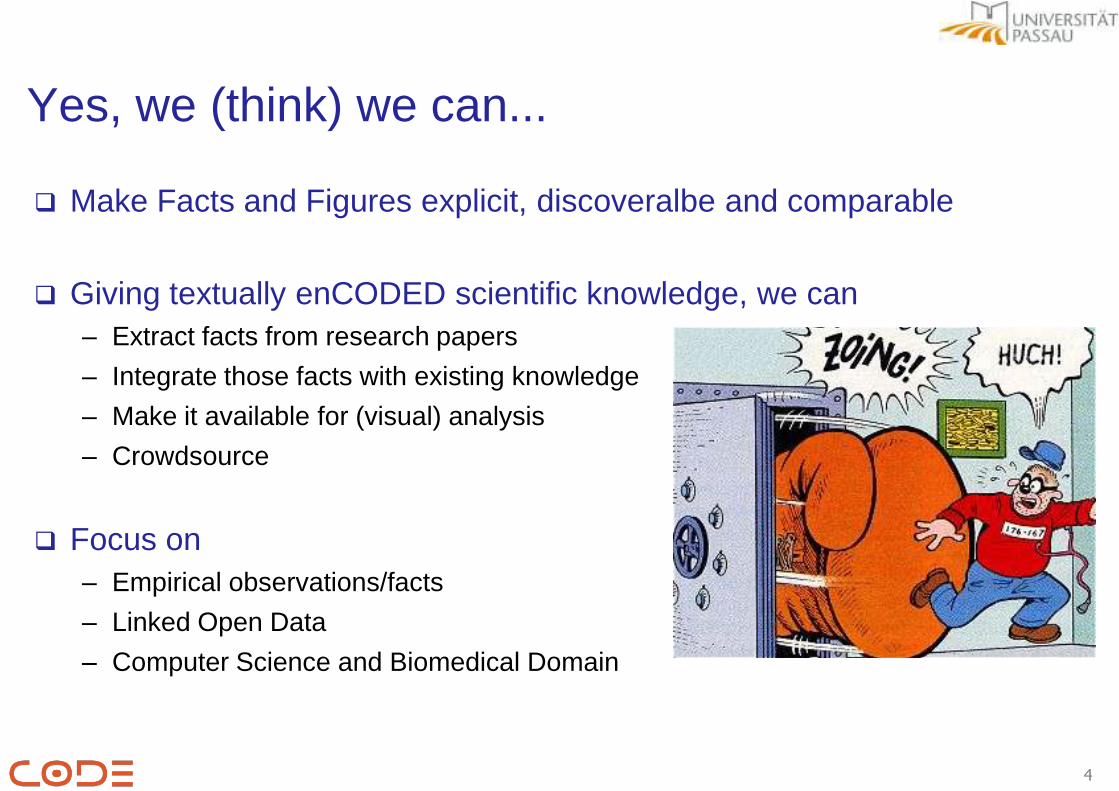
Yes, we (think) we can...
Make Facts and Figures explicit, discoveralbe and comparable
Giving textually enCODED scientific knowledge, we can
– Extract facts from research papers
– Integrate those facts with existing knowledge
– Make it available for (visual) analysis
– Crowdsource
Focus on
– Empirical observations/facts
– Linked Open Data
– Computer Science and Biomedical Domain
4

That‘s nice, but how?
5
Linked Scientific Fact Data Warehouse
Extract& Integrate
AggregateAnalyse & Organise
Share & Commercialise
Visual Analytics &Collaborative mind-mapping
Text, Linked DataExperiments
Crowdsourcing &Marketplace
Dependency and Frequency Analysis
Machine Learning
Algorithm
CRF SVM
BiomedicalData Set 1
Graph Depencies
0" 5" 10" 15" 20"
Biomedical"
CRF"
DataSet1"
DataSet2"
SVM"
(Leer)"
Gesamtergebnis"Algorithms"
Domain"
Experiment"
(Leer)"
Gesamtergebnis"

Extract & Integrate: Approach and Challenges
Extracting Structural Elements
– Tables
– Figures
– Sections and sub-sections
Extracting Facts from Structural Elements
– Entity extraction (e.g. algorithms, data sets, genes, significance levels etc.)
– Fact extraction – <Entity, Relation, Measure>
– Table Triplification
Crowdsourcing Extraction
– Extraction quality and domain knowledge remains a key issue
Empower users to maintain their own extraction model
Allow to semantically annotate research papers (e.g. entities, facts)
Result: Semantically annotated scientific data as LOD Endpoint
6
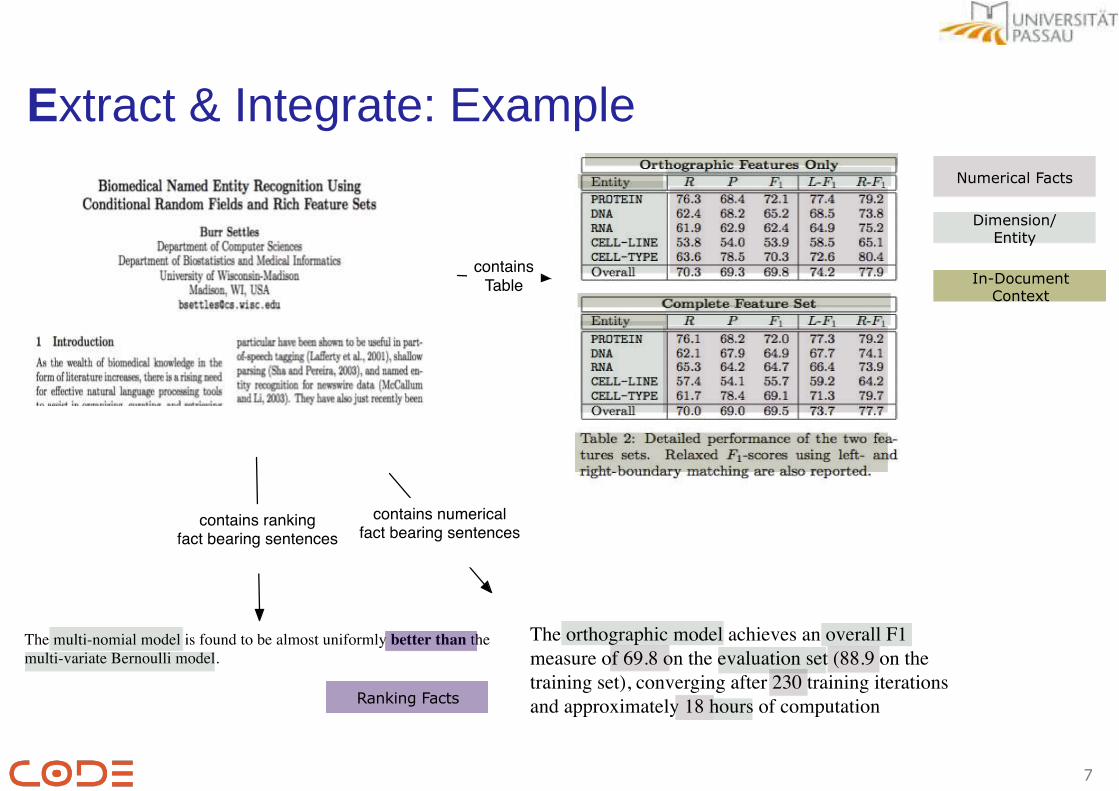
Extract & Integrate: Example
7
Numerical Facts
Dimension/Entity
In-Document Context
Ranking Facts

Extract & Integrate: Current Status
8
TeamBeam — Meta-Data Extraction from Scientific LiteratureBy Roman Kern, Graz University of Technology; Kris Jack and Maya Hristakeva, Mendeley Ltd.; Michael Granitzer, University of Passau
TeamBeam -PDF
Structure Extraction
– Structural elements
– Focusing now on
tables
Entity Extraction in work
First Prototypes for
Table2RDFDataCube

Aggregate: Approach and Challenges
Representation and Storage
– Representation using the RDF Data Cube Vocabulary
• Dimensions (e.g. Algorithms, Genes)
• Measures (e.g. 0.3, 37) and Attributes (e.g. %, °)
– Challenge 1: Ensure independency of dimensions
– Challenge 2: Decentralized querying and aggregation
SPARQL Data Warehousing Wizard
– Provide simple and intuitive Wizard for creating aggregation queries
• Google-like starting point
• Pivot table creation similar like in Spreadsheets
– Store using RDF Data Cube Vocabulary
Linked Scientific Fact Data Warehouse for non-IT Experts
9
http://www.w3.org/TR/vocab-data-cube/#ref_qb_measureType

Aggregate: Current Status
Representation and Storage
– Data Model implemented
– Triplification of Benchmarking Data (e.g. CLEF, TPC-H etc.)
We are looking for data
SPARQL Data Warehousing Wizard
10

Analyse: Approach and Challenges
Visual Analytics for Linked Scientific Facts
– RDF based description of visualisations
• Glue between data and single visualisations
• Make visualisation state explicit
• Share visualisation state
– HTML 5 based visualisations and visualisation wizard
11

Provenance
– Who published data?
– Who modified data?
Share aggregated data sets and annotation models
– Build on insights created by others
– Re-use text annotation models
Share visual analytics applications
– Simple visualisations might be misleading
– Sharing whole states of a visual analysis will reveal
more details on certain decisions
Share: Approach and Challenges
12
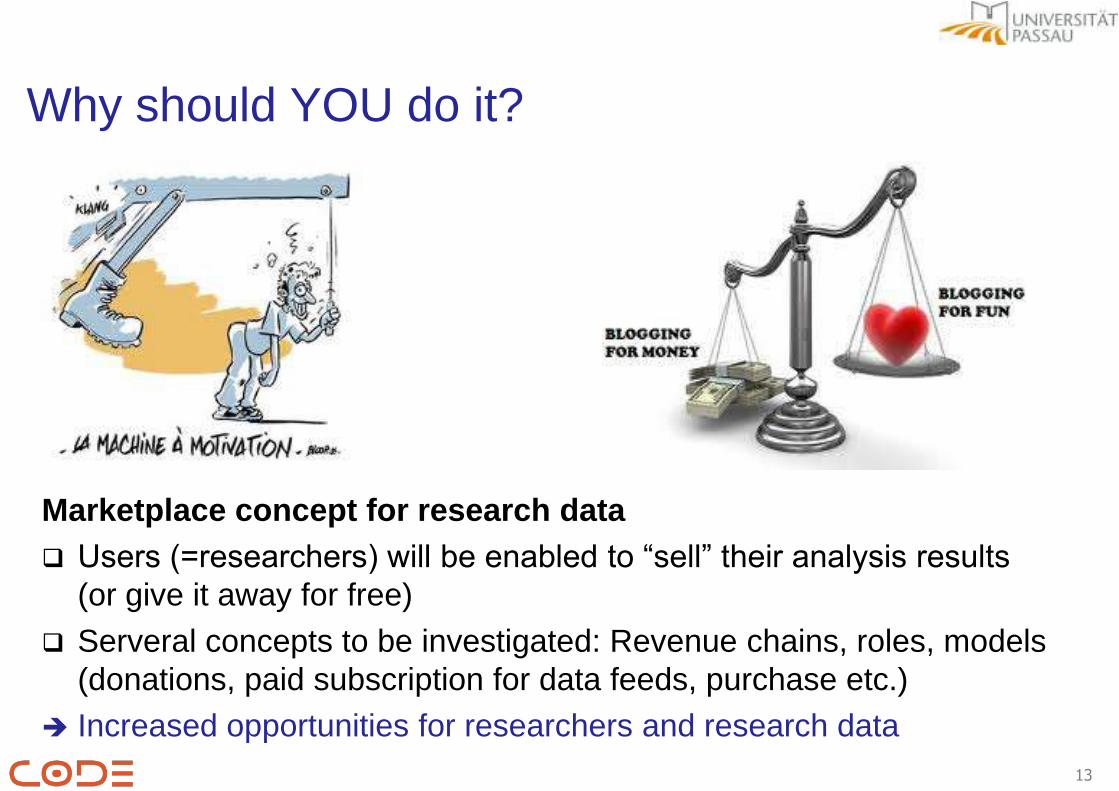
Why should YOU do it?
Marketplace concept for research data
Users (=researchers) will be enabled to “sell” their analysis results
(or give it away for free)
Serveral concepts to be investigated: Revenue chains, roles, models
(donations, paid subscription for data feeds, purchase etc.)
Increased opportunities for researchers and research data
13

Find us, join us, ask us, help us
http://code-research.eu/http://www.facebook.com/CODEresearchEU
#CODEresearchEU
integrate
extract & visualise
organise
crowdsource