i nasa technical note nasa tn d-6839 l · i nasa technical note nasa tn d-6839 l 0- cr ... was a...
TRANSCRIPT

I I
N A S A TECHNICAL NOTE NASA TN D-6839 l
0- Cr) 00 9 d z c 4 r/r 4 z
C
EXPERIMENTAL EVALUATION OF A TF3O-P-3 TURBOFAN ENGINE IN A N ALTITUDE FACILITY: AFTERBURNER PERFORMANCE AND ENGINE-AFTERBURNER OPERATING LIMITS
by John E , McAulay and Muhmood Abdelwuhub
Lewis Reseurch Center Clecelmd, Ohio 44135
N A T I O N A L AERONAUTICS A N D SPACE A D M I N I S T R A T I O N W A S H I N G T O N , D. C. JULY 1972
https://ntrs.nasa.gov/search.jsp?R=19720019364 2018-05-29T01:14:09+00:00Z

EXPERIMENTAL EVALUATION OF A TF30-P-3 TURBOFAN ENGINE IN AN
t
ALTITUDE FACILITY: AFTERBURNER PERFORMANCE AND
EN GI NE-AFTER BURNER 0 PER AT1 NG LIMITS
by John E. McAulay and Mahmood Abdelwahab
Lewis Research Center
SUMMARY
An investigation was conducted to determine the afterburning steady- state perform- ance and operational l imits of a TF30-P-3 turbofan engine. Steady-state performance of the afterburner was obtained over a range of engine-inlet pressures with distortion- free inlet flow. Engine-afterburner altitude operational l imits were obtained over a range of engine-inlet distortions during fixed and transient throttle operation. In addi- tion, a limited amount of data was obtained to determine the engine-afterburner l imits during time-variant engine-inlet pressure oscillations.
At the Maximum throttle position (full afterburning) the afterburner combustion efficiency and total-pressure-loss ratio were 0.91 and 0.11, respectively, at an engine- inlet Reynolds number index of 0.80. The combustion efficiency decreased to 0.68 at Maximum throttle position and a Reynolds number index of 0.25. During throttle bursts and chops between Military and Maximum throttle position, fan-compressor s ta l ls were encountered. Time histories of pressures in the fan-compressor showed development of rotating stall in the fan hub which quickly propagated and produced complete stali in the high-pressure compressor. The altitude stall l imits were substantially reduced as distortion level w a s increased during either fixed o r transient throttle operation. F o r fixed throttle operation, changing the throttle position from Military to Maximum and closing the compressor bleeds also reduced the altitude stall limits. When time-variant engine-inlet p ressure oscillations were imposed, full-face oscillations required the highest amplitude to produce stall. For the other modes of engine-inlet p ressure oscil- lation, the co-rotating distortion caused stall with the lewest arr.plitude and the lowest instantaneous distort ion.
INTRODUCTION
With the progressive development of supersonic aircraft , the demands on the engine and its inlet have increased. These demands o r requirements are brought about by the des i re for greater maneuverability and fo r operation at higher flight altitudes and Mach numbers. Greater maneuverability and higher flight numbers impose increasing levels of steady-state and time-variant inlet flow distortions. Higher altitudes produce lower engine-inlet Reynolds numbers. Both the increased level of flow distortions and the de- creased Reynolds numbers result in lower fan- compressor stability margins. Further- more, the lower operating pressures brought about by increased altitude can produce substantial degradation in afterburner combustion efficiency and stability.
’ In an effort to quantitatively show the effects of engine-inlet p ressure level (i. e. , altitude) and flow distortions on a modern operational afterburning turbofan engine, a co&prehensive program w a s conducted at NASA Lewis Research Center on the TF30-P-1 and P-3 engines. Results of previously reported nonafterburning tests are given in references 1 to 6. A s a part of this overall program, further tests were conducted with the TF30-P-3 engine operating in the afterburning regime. These tests were planned to measure the effect of pressure level, o r altitude, on the afterburning steady-state performance and to determine the effect of steady-state and time-variant inlet flow dis- tortions on the engine-afterburner operational limits.
afterburner steady-state performance is presented as a function of operating pressure level and fuel-air ratio. Engine afterburner operational l imits are shown on coordinates of altitude and distortion level for fixed and transient throttle operation. A limited amount of data is presented at fixed throttle settings to show the effect of several kinds of time-variant engine-inlet flow distortions on engine-afterburner operating limits.
This report presents the resul ts of these tests in the afterburning regime. The
APPARATUS
Engine
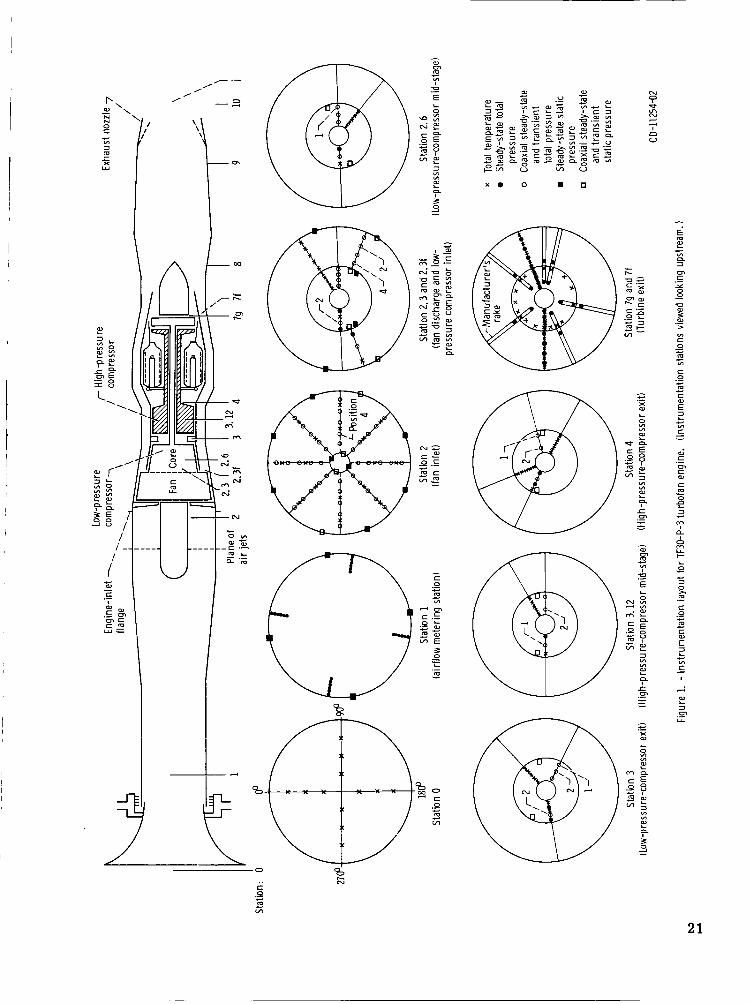
The engine used for this investigation w a s a production TF30-P-3 twin-spool turbo- fan engine equipped with an afterburner. The engine, shown schematically in figure 1, includes a three-stage axial-flow fan mounted on the same shaft with a six-stage axial- flow low-pressure compressor. This unit is driven by a three-stage low-pressure turbine. A seven-stage, axial-flow compressor driven by a single-stage, air-cooled turbine makes up the high-pressure spool. The overall p ressure ratio of the fan-
2

compressor system is 17, the fan pressure ratio is 2.1, and the bypass ratio is 1.0 at sea-level static Military operating condition.
(high compressor) bleeds. The seventh-stage bleeds are manually operated and are normally opened at flight Mach numbers above 1.5. The 12th-stage bleeds are normally operated automatically so that they are open at low engine speeds and pressure ratios and closed at the higher speeds and pressure ratios. For this investigation, the 12th- stage bleeds were also manually controlled.
a par t of the normal engine-afterburner assembly. For this investigation, the blow-in doors and exit leaves were removed.
The compressor is equipped with seventh- stage (low compressor) and 12th- stage
An ejector nozzle having aerodynamically operated blow-in doors and exit leaves is
Afterburner
The afterburner consists of a diffuser duct, a combustion chamber, a flameholder, and seven fuel spray rings. A cross-sectional schematic of the afterburner showing the location of instrumentation is presented in figure 2. The flameholder and spray ring assembly is shown pictorially in figure 3. The diffuser duct consists of two diffuser sections separated by a spli t ter cone. Fan air and gas generator gases flow through the outer and inner diffuser ducts, respectively. The combustion section is made up of an outer shell and an inner l iner which is perforated at its front and louvered at its aft end. The distance from the forward end of the diffuser section to the aft end of the l iner is 257 centimeters. The flameholder is a three-ring V-gutter type. Two of these rings are attached directly to the aft end of the diffuser cone, while the third ring is attached further upstream to the diffuser cone by a rod assembly. The projected blockage of the flameholder is approximately 33 percent of the maximum combustion section area. This blockage is not concentrated at a single axial location.
by an integrated afterburner - exhaust nozzle control. This control operates in con- junction with the main engine conditions. The afterburner fuel is introduced into the . combustion chamber through the spray rings, which are arranged into five separate zones. Zones 2, 3, and 4 each consist of a fuel line, a manifold, feed tubes, and one spray ring. Fuel fed through these zones mixes with the fan airflow. Zone 5 is s imilar except that it contains two spray rings. Zone 1 fuel system consists of a fuel flow di- vider mounted directly on the afterburner fuel control, two fuel l ines leading from the flow divider, two fuel manifolds, three feed tubes, and two spray rings. These two paths of zone 1 fuel flow are designated as zone 1 primary and zone 1 secondary. Zone 1 primary is always used when afterburner fuel is flowing. Fuel is introduced
Scheduling of the afterburner fuel flow and the exhaust nozzle area is accomplished
3

through the zone 1 secondary system only at a main burner pressure level above 124 N/cm abs. Fuel introduced through zones 1 and 5 mixes with the gas generator flow. As afterburner fuel flow is increased, fuel is introduced into gas generator and fan flow successively through zones 1 to 5. Each successive zone fuel flow is additive to the preceding zone flows.
burner combustion chamber aft end. These nozzle segments are actuated by six hy- draulic cylinders which use fuel as the working fluid. The movement of these segments produces a c>ange in nozzle area.
2
The afterburner nozzle consists of 12 equally spaced segments hinged to the after-
Distort ion Devices
* Engine-inlet spatial total-pressure distortions were produced either by the air jet system or by screens located upstream of the engine inlet. The air jet system was also used to obtain time-variant pressure osciallations at the engine inlet. The screen con- figurations used during this investigation are shown in figure 4(a). Configurations 1 and 2, which produce the same distortion pattern but are slightly different in magnitude, were designed to reproduce a distortion encountered with the F-111 airplane. The air jet system, which is described in detail in reference 2, is illustrated schematically in figure 4(b). Its primary components are a torus manifold and associated piping, six servo-operated air jet valves of special design (one for each 60' segment) and 54 lines. Each valve supplies high-pressure air to nine l ines and in turn to nine jet nozzles located in the engine-inlet duct. The jet nozzles direct the high-pressure air counter to the primary flow from the bellmouth. The high-response servo-operated air jet valves were capable of operating over a range of amplitudes to frequencies of 200 hertz.
Ins tal I at ion
,-The engine with afterburner and the air jet system are shown installed in the alti- tude test chamber in figure 5. The air jet system w a s not installed during the steady- state afterburner performance tests. The installation w a s a conventional direct- connect type. The engine w a s mounted on a thrust-measuring stand which consisted of a test bed suspended from facility supports by four flexure plates. The altitude chamber in- cludes a forward bulkhead which separates the inlet plenum from the test chamber. Conditioned air was supplied to the plenum at the desired pressure and temperature and flowed from the plenum through the bellmouth and duct to the engine inlet. When used, the air jet system supplied high-pressure air counter to the primary air approximately
4

93 centimeters upstream of the engine face (engine-inlet flange). The distortion screens when installed were located 30.5 centimeters upstream of the engine face. F o r all tests, engine-inlet instrumentation was located 12.5 centimeters upstream of the engine face.
The exhaust gases f rom the engine were captured by a collector, which extended through the rear bulkhead, to minimize recirculation of these gases into the tes t chamber. The exhaust pressure is normally controlled by an automatic control valve; but
1 f o r these tests, this valve w a s set to its open position. This produced the minimum ex- haust pressure f o r the flow conditions and exhaust equipment used. At an engine-inlet
2 2 pressure of 5.17 N/cm abs, the exhaust pressure was about 1.9 N/cm abs.
I
I
Instrumentation . The station identification and probe locations are shown in figures 1 and 2. Steady-state instrumentation. - Low pressure levels (0 to 24 N/cm ) were recorded 2
on a digital, automatic, multiple-pressure recorder. High-pressure levels (above 2 24 N/cm ) were measured by means of Scanivalve pressure-measuring devices which
used transducers. These devices were capable of measuring 48 pressures with each transducer during one cycle of data recording. The operation of the Scanivalves and the recording of their output w a s accomplished through use of the central automatic digital data encoder and the automatic voltage digitizer. Chromel-Alumel thermo- couples were used to measure temperatures, and the outputs were recorded by means of the automatic voltage digitizer. These recording systems are described in detail in reference 7. A water-cooled load cell w a s used to measure thrust.
and recording systems were used to measure instantaneous distortion levels and rapid pressure variations, particularly those associated with stall. In addition, this type of instrumentation system made it possible to properly define the sequence of events in tbe engine when these events occurred within milliseconds of each other. The number and location of the transient probes are shown in figure 1. This instrumentation was de- . signed to have a frequency response to at least 300 hertz with a maximum amplitude e r r o r no greater than rt5 percent. The design, cooling, method of calibration, and re- cording of this instrumentation are described in reference 3.
High- response transient instrumentation. - High-response transient instrumentation
PROCEDURE I
F o r all tests the exhaust pressure was maintained at a value low enough to ensure choked flow at the exhaust nozzle exit.
5

Steady-State Performance
The steady- state performance of the afterburner was obtained with uniform engine- inlet flow (i. e . , air jet system o r distortion screens not installed in engine-inlet duct). The seventh- and 12th- stage compressor bleeds were closed. The engine-inlet condi- tions were stabilized at engine-inlet total pressures corresponding to Reynolds number indices of 0.80, 0.50, 0.35 , and 0.25 and an engine-inlet temperature of near 16' C. At each engine-inlet Reynolds number index, data were taken with the throttle set at Military (i. e., the highest nonafterburning throttle position) and at approximately 10 dif- ferent afterburning throttle settings between the lowest afterburning throttle setting and Maximum (i. e., the highest afterburning throttle position).
Engine A f te rbu rne r Operatibnal L imi ts
The engine afterburner operational l imits were obtained for three different opera- tional modes: transient throttle at fixed levels of engine-inlet pressure and distortion, fixed throttle while slowly (quasi-steady-state) changing engine-inlet pressure and/or distortion, and fixed throttle while imposing time-variant engine-inlet p ressure oscil- lations. The methods and conditions at which these data were obtained are summarized in the following discussion and in table I .
system o r screens were used to produce the distortion. The engine-inlet pressure and distortion were set at the desired levels with the engine throttle set at Military. (When screens were used, the distortion level produced by the particular screen configuration used was accepted. ) Steady-state data were taken and the transient data systems were activated. The engine throttle was then rapidly moved from Military to Maximum in about 1 second (throttle burst). If stall o r blowout did not occur, the engine and after- burper were allowed to stabilize for about 10 seconds and then the throttle w a s rapidly moved to Military (throttle chop). Depending on whether an engine-afterburner limit wqs reached (i. e., stall o r blowout), the engine-inlet pressure w a s either raised o r lowered and the preceding procedure repeated. This w a s continued until the engine- afterburner limit was narrowly bracketed.
Fixed throttle. - The engine throttle and compressor bleeds were set at their de- s i red positions with uniform flow at the engine inlet. When an inlet distortion was de- sired, the air jet system was used to slowly impose a predetermined distortion level. Steady-state data were then taken and the transient data systems activated. The engine- inlet pressure was then gradually lowered until an engine-afterburner limit w a s reached.
Transient throttle. - These tests were essentially the same whether the air jet
6

Time-variant pressure oscillation tests were also conducted at fixed throttle. After the engine throttle and the compressor bleeds were set, steady-state data were taken and the transient data systems were activated. An analog computer w a s used to control the air jet valves so that the engine-inlet pressure phasing and amplitude were programmed. The inlet p ressure amplitude was gradually increased until an engine- afterburner limit o r a valve amplitude limit was reached. F o r the tests conducted and reported herein the input frequency of the pressure oscillations was 20 hertz. This frequency was selected because the air jet system was capable of producing high engine- inlet pressure amplitudes to frequencies near 20 hertz.
RESULTS AND DISCUSS ION
Steady -State Pe rfo rm a nce
The steady-state performance of the afterburner is presented in figure 6 to 8 for a range of engine-afterburner pressure levels and afterburner fuel-&; ratios. Fo r all data shown, the average afterburner-inlet velocity (station 8) and temperature varied from 91 to 96 meters per second and 111' to 118' C in the fan airs t ream and from 207 to 222 meters per second and 571' to 625' C in the gas generator stream. The temperature range for the fan and gas generator flows is associated with engine-inlet Reynolds number index, with the higher values corresponding to the lower indices. The methods of calculation for the various parameters a re given in appendix A. Symbols are defined in appendix B.
Combustion efficiency. - The variation of afterburner combustion efficiency with fuel-air ratio for engine-inlet Reynolds number indices of 0.80, 0.50, 0.35, and 0.25 is presented in figure 6. Zones 1 and 5, which are the zones where fuel is injected into the primary o r core flow, have significantly greater fuel-air ratio ranges than zones 2 to 4. Fuel introduced through these la t ter zones is directed into the bypass o r fan flow.
The change in combustion efficiency with fuel-air ratio is generally la rger within the zone 1 range of fuel-air ratios than in any of the other four zones. If the very low fuel-air ratios of zone 1 at indices of 0.35 and 0.25 are excluded, there are only small variations in efficiency with fuel-air ratio at a given Reynolds number index.
At all fuel-air ratios there is a significant effect of pressure level on combustion efficiency. At full afterburning in zone 5 (i. e., Maximum throttle position) the effi- ciency declined from 0.91 to 0.68 as engine-inlet Reynolds number index was lowered from 0.80 to 0.25. F o r all zones, a decrease in index from 0.80 to 0.25 produced a
7

reduction in efficiency of between 0.14 and 0.34. This decrease in index corresponds to an afterburner-inlet pressure decline from 1.62 atmospheres to 0.51 atmosphere. Most of the loss in efficiency occurred as the Reynolds number index was reduced below a value of 0.50.
rise and total-pressure-loss ratios are presented in figure 7 as a function of fuel-air ratio for engine-inlet Reynolds number indices of 0.80, 0. 50, 0.35, and 0.25. These data show that the afterburner temperature-rise ratio (fig. "(a)) increases with fuel-air ratio at a given pressure level (i. e. , Reynolds number index) and with pressure level at a given fuel-air ratio. The increased temperature ratios produce higher afterburner momentum pressure losses and, consequently, higher total-pressure losses , as shown in figure 7(b). At the full-afterburner condition, the pressure-loss ratio was about 0.11 at an engine-inlet Reynolds number index of 0.80,
Specific fuel consumption and augmented thrust ratios. - The afterburner specific fuel consumption and augmented thrust ratios are presented in figure 8 for a range of fuel-air ratios at engine-inlet Reynolds number indices of 0.80, 0.50, 0.35, and 0.25. (These data, as previously mentioned, were obtained with the blow-in doors and exit leaves removed. ) For bc,h ordinates, the ratios a r e determined by using the values at Military throttle position as a base level. The results of these data reflect the trends shown in figure 6. At the Maximum throttle position and at an index of 0.80, the specific fuel consumption ratio w a s 2.06 and the augmented thrust ratio was 1.56.
Pressure-loss and temperature- rise ratios. - The afterburner total-temperature-
Operational Limits
Engine-afterburner operational l imits are presented in figures 9 to 17. Operational l imits during this investigation were manifested by fan- compressor stall o r afterburner blow out.
Transient throttle limits. - Typical t ime histories of a number of engine-afterburner parameters during a stall-free throttle burst and chop between Military and Maximum throttle positions are shown in figure 9. The afterburner ignition, as evidenced by the first rapid increase in engine and afterburner pressures , occurred about 1.6 seconds after initiation of the throttle burst . Subsequent ignition of each of the afterburner zones is shown by a rise in pressures and a stepwise increase in exhaust nozzle area. The particularly large rise in afterburner fuel flow between 2.4 and 2.9 seconds is re- lated to the main afterburner fuel pump being activated. At the lower afterburner fuel flows, the afterburner hydraulic fuel pump supplied fuel to the afterburner. The throttle chop occurred much more rapidly than the throttle burst (i. e. , in less than 2 sec compared with about 82 sec). During the throttle chop, the fuel flow and nozzle 1
8

area were not staged through each afterburner zone, as w a s observed during the throttle burst.
data system than that used f o r the data presented in figure 9 are shown in figure 10. The data of figure 10 display the results of a number of engine pressures during a throttle burst (fig. lO(a)) and a throttle chop (fig. 10(b)) during which stall occurred. For both the burst and chop the stall sequences were quite similar, so that the following discussion will be directed specifically toward the throttle burst data. The total t ime for which data are shown is 150 milliseconds (fig. 10(a)). During this time, afterburner ignition, stall initiation, and a complete flow breakdown with accompanying hammer- shock occurred. (The comparable t ime of events in figure 9 w a s between about 1.55 and 1.70 sec. ) The stall shown by the data of figure lO(a) occurred following after- burner ignition and its associated pressure rise.
The first significant event exhibited in figure lO(a) is afterburner ignition, which is denoted by a rise in the exhaust nozzle inlet pressure about 1650 milliseconds after the start of the throttle movement. This event is quickly followed by a rise in the level of the fan exit pressures. Soon after ignition and coincident with the rising fan exit pressure levels, there is an increase in the activity o r amplitude of these pressures. High-response data taken with the engine during steady- state nonafterburning and after- burning conditions exhibited similar trends in fan exit pressure amplitude, indicating that the higher amplitudes are due to the afterburning process. Of the pressures shown in figure lO(a), the fan hub exit pressure near the flow splitter (Pt, 2. 3-880-1) showed the largest increase in amplitude as the afterburner regime w a s entered.
At 1745 milliseconds from the initiation of the throttle burst there is a substantial pressure drop followed by recovery of the fan exit pressure nearest the flow splitter
). This is followed 7 milliseconds later by a pressure drop and recovery ('t, 2.3-88'-1 at locations (Pt, 2.3-269O-2, Pt, 3-261-29 and 't, 3.12-269O-1 ) in the gas generator flow on the other side of the engine (i. e., about 1800 circumferentially from
). The 7-millisecond time interval is compatible with past experience, 't, 2.3-88'-1 which has demonstrated that rotating stall zones move at about one-half rotor speed. Three to 4 milliseconds later, the high-pressure compressor stalls completely, as in-
and exit P pressures and the dicated by the rapid decline of its mid-stage Pt, 3. 12 subsequent hammershock at fan and compressor axial locations upstream of the high- pressure compressor. Although these time histories show the apparent development of a rotating stall in the fan hub which quickly propagated and produced complete stall in the high-pressure compressor, it should be kept in mind that a more detailed analysis of the flow is required before the exact mechanism can be determined. A similar chain of events leading to complete stall during a throttle chop is illustrated by the data of figure 10(b).
Time histories of engine-afterburner pressures acquired from a higher- response
t, 4
9

Another perspective of the events exhibited by the data of figure 10 is shown in fig- u r e 11. fined by corrected speed and pressure ratio during a stall-free throttle burst and chop between Military and Maximum throttle positions. Also shown in this figure are stall l imits as a function of corrected speed. These stall l imits are based on results obtained f rom the engine manufacturer's unpublished component rig data and Arnold Engineering
instrumentation, and test hardware, the stall l imits are not necessarily compatible with the transient variation of fan-compressor operating points. However, these l imits are useful in providing a relative picture of the stall margin available for the various fan- compressor components. The data of figure 11 show that for the stall-free throttle transient data presented, the fan hub is the component which would probably initiate stall. This conclusion agrees with the data presented in figure 10.
the fan-compressor system during typical throttle bursts and chops between the Military and Maximum throttle positions. The overall resul ts of a series of these throttle bursts and chops over a range of altitudes and 180' steady-state distortions is shown in fig- u r e 1 2 for a simulated flight Mach number of 1 . 4 (see PROCEDURE for a description of how the data were obtained). The inlet air temperature (-34' C) established the simu- lated Mach number for altitudes above the tropopause. The altitude w a s defined by the distortion-free inlet pressure adjusted by an appropriate inlet p ressure recovery (i. e. , 0.978 for Mach 1.4). The distortion level, which was produced by using the air jet sys- tem, was a function of the average and the minimum engine-inlet pressures and is pre- sented in the form of differential pressure divided by average pressure. All the engine afterburner l imits displayed were obtained with the seventh- and 12th- stage compressor bleeds closed and were a result of fan-compressor stall. For the throttle burst mode of operation the altitude l imit w a s about 18 900 meters with no inlet distortion. At a dis- tortion level of 5 percent the altitude throttle burst l imit w a s reduced to 1 2 800 meters. During throttle chops the altitude l imits were substantially lower than for throttle bursts. At distortion levels of zero and 5 percent the throttle chop altitude l imits were 15 850 and 12 040 meters, respectively.
Throttle bursts and chops were also tr ied at a simulated flight Mach number of 2.5. The data are presented in figure 13 on coordinates of altitude and engine-inlet distortion (i. e., the same as for fig. 12). For this simulated Mach number, the inlet p ressure recovery w a s assumed to be 0.871, and the inlet distortions were produced by screens. The seventh-stage compressor bleeds were open and the 12-stage bleeds were closed. The only stalls encountered occurred with screen configuration 3 and the engine control trimmed above its normal level (i. e., higher than normal engine speed for Military throttle position). Even in this instance, stall w a s obtained only above an altitude of
This figure shows the movement of the fan-compressor operating points as de- 1
I
Development Center (AEDC) data (ref. 8). Because of differences in testing methods, I
I
The results displayed in figures 9 to 11 give some insight into what is happening in
10

18 600 meters with a distortion level of about 5.4 percent and the 12th-stage bleeds manually closed. When the 12th-stage bleeds were allowed to operate in their automatic mode, they would open above an altitude of about 17 070 meters, thus preventing stall. No instances occurred, such as had a t Mach 1.4, where a successful throttle burst was made followed by an unsuccessful (i. e., stall) throttle chop.
creased at several fixed throttle positions and inlet distortion levels. The change in in- let pressure, which is related to altitude f o r a given Mach number, w a s slow enough so that engine conditions were quasi steady-state. Typical t ime histories of several engine- afterburner pressures at fixed afterburner throttle position are shown in figure 14 at the time an operational limit was reached. W o test points are presented - one which re- sulted in stall, the other in afterburner blowout. Stall is a result of the effect of engine- inlet Reynolds number on the engine operating and stall lines. Blowout is a result of reaching a pressure level which is unable to support combustion.
are summarized in figure 15 on coordinates of altitude and distortion for a simulated flight Mach number of 1.4. Data are shown for several combinations of seventh- and 12th-stage bleed positions and three throttle positions - Military, partial afterburning, and Maximum (i. e., full afterburning). During afterburning operation with minimum facility inlet distortion, both afterburner blowout and fan- compressor stall were limiting at an altitude of about 19 800 meters. The data also show that the altitude stall l imits were substantially reduced (1) as distortion level was increased (2) as throttle position was changed from Military to Maximum, and (3) as the compressor bleeds were closed.
The more important results of figures 12 and 15 were combined and are presented in figure 16 for the same coordinate system, altitude and distortion. A s might be ex- pected, the transient throttle l imits occur at lower altitudes and distortion levels than the fixed throttle limits.
Time-variant distortion at fixed throttle. - The effect of engine-inlet p ressure os- cillations at fixed throttle position on engine-afterburner operation is described by the ba r chart presented in figure 17. These oscillations were imposed at only one frequency fo r these tests, 20 hertz. (A detailed discussion on the characterist ics of a nonafter- burning turbofan engine during time-variant engine-inlet p ressures is given in ref. 5. ) The length of the bars represents the imposed normalized amplitude of the engine-inlet
pressure (Pt, 2, max - Pt, 2, m i n p t , 2, av jet system. To the right of each bar a maximum instantaneous distortion (Pt, 2, av
is given. F o r the 180' out-of-phase, the contra-rotating, and the pt, 2, min)/Pt, 2, av co- rotating pressure oscillations, the instantaneous distortion v a h e is sirr,p!y one-half of the normalized amplitude. For the full-face pressure oscillations, the distortion is essentially the minimum facility distortion (i. e. , about 1. 5 percent) and is consistent
Fixed throttle limits. - F o r these tests, the engine-inlet p ressure w a s slowly de-
The results of a series of fixed throttle tests similar to those presented in figure 14
which produced stall o r w a s limited by the air -
11

with experimental levels previously determined (ref. 5).
normalized amplitudes of two to three t imes that required for the other types of oscila- tions in order to produce stall. Of the other three modes of inlet p ressure oscillation, the co-rotating distortion caused stall with the lowest amplitude and the lowest instan- taneous distortion. F o r all the types of inlet p ressure oscillation investigated, the ef- fect of increased throttle position and closing of the seventh-stage bleeds w a s to reduce the amplitude and/or distortion required to produce stall.
The data of figure 17 show that the full-face inlet pressure oscillations required
SUMMARY OF RESULTS
An investigation w a s conducted to determine the performance and operational char- acteristics of a TF30-P-3 turbofan engine in its afterburning regime. The principal results of this investigation were as follows:
1. At the Maximum throttle position (full afterburning) the afterburner combustion efficiency declined from 0.91 to 0.68 as the engine-inlet Reynolds number index was lowered from 0.80 to 0.25. If the very low fuel-air ratios of zone 1 at indices of 0.35 and 0.25 are excluded, there are only small variations in efficiency with fuel-air ratio at a given Reynolds number index.
burner total-pressure-loss ratio w a s about 0.11.
fan-compressor stalls were encountered. Time histories of pressures in the fan- compressor show the development of rotating stall in the fan hub which quickly propagated and produced complete stall in the high-pressure compressor.
4. The altitude stall l imits were substantially reduced as distortion level w a s in- creased during either fixed o r transient throttle operation. Fo r fixed throttle operation, changing the throttle position from Military to Maximum and closing the compressor bleeds also reduced the altitude stall limits.
5. When time-variant engine-inlet pressure oscillations were imposed, full-face oscillations required the highest amplitude to produce stall. F o r the other modes of engine-inlet pressure oscillation, the co- rotating distortion caused stall with the lowest amplitude and the lowest instantaneous distortion.
2. At the Maximum throttle position at a Reynolds number index of 0.80, the after-
3. During throttle bursts and chops between Military and Maximum throttle position,
Lewis Research Center, National Aeronautics and Space Administration,
Cleveland, Ohio, April 7, 1972, 764-74.
12

APPENDIX A
METHOD OF CALCULATION
Airflow I
Pr imary airflow at the engine inlet was calculated from an enthalpy average of
Gas Flow I
I The afterburner gas flow is the sum of the measured air and fuel flow.
I Afterburner Fuel -Air Ratio
The afterburner fuel-air ratio was defined as the ratio of the afterburner fuel flow to the unburned air entering the afterburner. Engine combustion efficiency was as- sumed to be 100 percent. ~
Wfu, t - wfu, e
wfu, e W a , 1 - 0.06746
(f/a)A/B =
I 1 I
where 0.06746 is the stoichiometric fuel-air ratio of the fuel used.
I Afterbu r n e r -In1 et Total Pressu r e
The afterburner-inlet total pressure, station 8, was calculated from the following I equation:
13

Pt, 7g A 7f
’t,8 = Pt, 7f + *7f +A7g A7f +A7g
Af te rbu rne r In le t Total Temperature
The afterburner inlet total temperature was calculated from an enthalpy average of I
the fan and core s t reams at the afterburner inlet.
Total Pressure at Exhaust Nozzle In le t
The total pressure at the exhaust nozzle inlet (station 9) was calculated by assuming a constant momentum between stations 8 and 9 (ignoring body force due to area change).
lY\
Af te rbu rne r Combustion Temperature
I The afterburner combustion temperature w a s calculated by using the measured
gross thrust and the gas weight flow. The exhaust nozzle was assumed to be choked.
- Tt, j -
FG
2
I where the asterisk denotes conditions at Mach 1.0. The effective velocity coefficient Cv, e was obtained from nonafterburner data (assuming Tt . = T ).
9 1 t ,8
14

Afterbu rner Combustion Efficiency
The combustion efficiency is defined as the ratio of the actual temperature rise to the ideal temperature rise.
~ A / B Tt, j - Tt, 8
Tt, j , id - Tt, 8
where Tt tion procek; (dissociation effects included).
id was calculated from an enthalpy balance based on an adiabatic combus-
Engine Net and Gross Thrust
The engine afterburner net thrust is defined as
F n = F G - Fram
where
Fn
FG
net thrust
g ross thrust
Fram ram thrust, (W/gV),
The gross thrust is defined as
F + F + F z F ~ = m p
where
Fm
FP
F Z
load- cell measurement
total momentum at station 1
labyrinth seal A A P
Calibration factor for the labyrinth seal A A P was obtained from previous calibrations.
15

Specific Fuel Consumption
The combined engine and afterburner specific fuel consumption was defined as I Wfu, t SFC =
Augmented T h r u s t Ratio
The augmented thrust ratio F d F G , mil w a s defined as the augmented gross thrust to the thrust at Military conditions (maximum nonafterburning throttle position).
Specific Fuel Consumption Ratio
The specific fuel consumption ratio SFC/SFCmil w a s defined as the augmented specific fuel consumption to the specific fuel consumption at Military conditions (maxi- mum nonafterburning throttle position).
16

APPENDIX B
A
‘v, e
f/a
F
g
M
N1
N2
Pt
Rg
P
Re1
SFC
T
Tt V
W
Y
6
77
e
CL Q
SY M B OLS 2 flow area, m
effective velocity coefficient
thrust , kgf
fuel-air ratio acceleration due to gravity, 9.8066 m/sec 2
Mach number
low rotor speed, rpm
high rotor speed, rpm
static pressure, N/cm 2 total pressure, N/cm
2
Reynolds number index, 62. ()/PSI) ii& gas constant, J/(kg)(K)
specific fuel consumption, (kgf)(hr)/(kgf thrust)
static temperature, OC
total temperature, OC
velocity, m/sec
weight flow rate, kgf/sec
ratio of specific heats
ratio of total p ressure to standard sea-level static pressure
combustion efficiency
ratio of total temperature to standard sea-level static temperature
absolute viscosity, N-sec/m
free-stream conditions
2
Subscripts:
A/B afterburner
a air
av average
17

e
f
fu
G
g
id
j
mil
min
max
sl
t
0
1
2
2 .3
2.3f
2.6
3
3.12
4
7g
7f
8
9
10
18
engine
fan duct
fuel
gross
gas
ideal
within jet at exhaust nozzle exit plane
Military
minimum
maximum
sea level
total conditions
bellmouth inlet
airflow metering station
fan o r engine inlet
fan hub exit
fan tip exit
low-pressure- compressor mid-stage (sixth- stage stator)
low-pressure-compressor exit, high-pressure-compressor inlet
high-pressure- compressor mid- stage (twelfth-stage stator)
high-pressure- compressor exit
turbine exit
fan duct exit
averaged flow at afterburner inlet
exhaust nozzle inlet
external environment at exhaust nozzle exit plane

REFERENCES
I
1. Braithwaite, Willis M. ; and Volmar, William R. : Performance and Stall Limits of a YTR30-P-1 Turbofan Engine with Uniform Inlet Flow. NASA TMX-1803, 1969.
Inducing Controlled Steady-State and Dynamic Inlet Pressure Disturbances for Jet Engine Tests. NASA TM X-1946, 1970.
2. Meyer, Carl L. ; McAulay, John E. ; and Biesiadny, Thomas J, : Technique for
3. Braithwaite, Willis M. ; Dicus, John H. ; and Moss, John E . , Jr. : Evaluation with a Turbofan Engine of Air Jets as a Steady-State Inlet Flow Distortion Device. NASA TMX-1955, 1970.
4. Werner, Roger A. ; Abdelwahab, Mahmood; and Braithwaite, Willis M. : Perform- ance and Stall Limits of an Afterburner-Equipped Turbofan Engine with and without Inlet Flow Distortion. NASA TM X-1947, 1970.
5. McAulay, John E. : Effect of Dynamic Variations in Engine-Inlet Pressure on the Compressor System of a Twin-Spool Turbofan Engine. NASA TM X-2081, 1970.
6. Wenzel, Leon M. : Experimental Investigation of the Effects of Pulse Pressure Distortions Imposed on the Inlet of a Turbofan Engine. NASA TM X- 1928, 1969.
7. Staff of Lewis Laboratory: Central Automatic Data Processing System. NACA TN 4212, 1958.
8. Palmer, J. D. ; Parker, J. R. ; and Schwall, J. R. : Effect of Steady Inlet Distortion on the Stability and Performance Characteristics of an Augmented Turbofan Engine. Rep. ARO-ETF-TR-70-322, ARO, Inc. AEDC-TR-71-50, AD-882311L, Apr. 1971.
19

TABLE I. - SUMMARY OF OPERATIONAL LIMITS TEST$
2 . 5
1 . 4
Engine throt t le
-216
-34
Opera t ion
T r a n s i e n t ( b u r s t s and chops )
F ixed
Posi t ion
(b)
Mili tary to Maximum; Maximum tc Mili tary
Mil i tary
Maxi mum A / B 3
I Mil i tary A i B 3 Maximum Maximum
Mil i tary Maximum Maximum
Seventh-stap b l eeds
Closed
Open
Closed
I Open Open
Closed Closed Closed Open
Closed Closed Open
rwelfth- s t a g e b l eeds
Closed
Closed
Closed Closed Closed Open Closed Open
Closed
1 Closed Closed Closed
Engine- inlet environment
Steady s t a t e ( r a n g e of inlet d i s to r t ions including d i s to r t ion - f r ee flow)c. Range of a l t i t udes .
S e v e r a l l e v e l s of c i r cumfe ren t i a l d i s to r t ion ( s c r e e n s ) . Range of a l t i tudes.
Slow (quasi s t eady- s t a t e ) d e c r e a s e in engine- inlet p r e s s u r e with d i s to r t ion - f r ee inlet flowc. Range of a l t i t udes .
Slow (quasi s t eady- s t a t e ) d e c r e a s e in engine- inlet p r e s s u r e with sev - eral l e v e l s of 180' c i r cumfe ren - tial d i s to r t ion . Range of a l t i - t udes .
Ful l - f a c e cycl ic ; 180'- out- of- p h a s e cycl ic d i s to r t ion ; co- and contra- rotat ing d i s to r t ion . Alti tude, 1 5 250 m .
j imulated fl ight Engine- inlet Mach n u m b e r t e m p e r a t u r e
I OC
1 . 4 I -34
aAll d i s to r t ions w e r e obtained by using the a i r j e t s y s t e m a t Mach 1 . 4 and s c r e e n s a t Mach 2 . 5. 'Mili tary - highest nonafterhurning th ro t t l e posit ion. A / B 3 - t h ro t t l e posit ion f o r af terburning in zone 3.
'Dis tor t ion-free inlet flow i s min imum faci l i ty dis tor t ion and is about 1. 5 pe rcen t . Maximum - highest af terburning th ro t t l e posit ion (zone 5) .
20
8
t
I
c E VI I U .- E
m a
a Y + L e
2 1

Variable
nozzle
\ \ L c o o l i n g l i n e r
--- Diffuser cone
-T L ine r perforated r L i n e r louvered
CD-11255-02
I Station 8 Station 9
0 Coaxial steady-state and t rans ien t static pressure
Figure 2. - Cross-sectional schematic of a f te rbu rne r w i th i ns t rumen ta t i on locations. (A l l dimensions in centimeters. )
22

Figure 3. - Afterburner flameholder and spray rings assembly. View looking upst ream.
23

B + C + D
Screen Width of W i re Percent opening, diameter, blockage
mm m m A 11-10 1.60 23.6 B 4.75 1 6 0 44.0 C 4.75 1.60 44.0 D 4.75 1.60 44.0 E 1.764 1.83 59.0
18d) Conf igurat ion 1
C i rcumfe ren t ia l extent,
de9 360
28 to 283 43 to 218 68 to 128
8 to 188
Conf igurat ion 2
- Primary flow -& ! ! !? I -
CD-11256-02 (b) Schematic drawing of jet array.
Figure 4. - Schematic of d istort ion devices.
24

Figure 5. - Afterburning turbofan with air jet system installed in altitude test chamber.
n
0 0 E
1.00
I- 4~~ ,4, I - 5 +
Engine-inlet Reynolds Afterburner-inlet total
Re1 atm number index, pressure,
0 0.80 0 .50 0 .35 0 .25 -
1.62 1.01 .12 .51
25

1 7 8
W
26
1

Throttle burst Throttle chop * ~ ~ ~~~~~
90x103 r-
80
70
60
rExhaust nozzle inlet pressure, P9 -
-
I
600 I 1.4 ,r H igh-pressu re-camp ressQr exit pressure, P -
14 WO t
E e d 13 000 I I I I I I I I I n I
\ LHigh-pressure-mtor speed, N q
- w 0 ,
,=rotor speed, N1
Afterburner fuel flow L 1400
1 800 I I I I I 1,'l L-4
Exhaust nozzle area, , Open zone4 2ne Close I I I " I I
Maximum r /
I I I I I In I I I O 1 2 3 4 5 6 7 8 9 ' 2 0 21 22
Military
Time from startof throttle burst, Sec
Figure 9. - Typical stall-free time history of engine-aflerburning parameters during throttle burst and chop between military and maximum throttle posltlons with distortion-free engine-inlet flow.
27

1 6 0 ~ 1 0 ~
120
a- 80
o’- m E
60xlJ3 Afterburner igni t ion ,r ‘9
j 7 I 1 6
a-
5 w m 3 l a - l l Exhaust nozzle inlet.
I I I I 1 2 5 0 ~ 1 0 ~ (a-2) High-pressure-compressor ex i t - - 2 5 0 ~ 1 0 ~ y 200-
m’ m’
100 20
1 6 0 ~ 1 0 ~
EO
200~103 la-3) High-pressure-compressor mid-stage.
< 1 6 0 k 7 T 3 , 3;; j 22 18 s I 1” 18 2 N
14 A- a- m- ‘t, 3-1170-2 14
80 10 a- lo=-
‘t, 3-117’-1 14 n-
m rn
A CL
E 1 ~ ~ ~ g 3 (a-41 Low-pressure-compressor exit. .-
z B-
N
2-
I n
3 12 “7 “7
L
rn 0) rn L
1
N + 80- ‘1,2.6-88-1
a a- 60 (a-51 Low-pressure-compressor mid-stage.
m
6 N’
N’
72x103 (a-61 Fan t ip exit.
42x103 la-71 Fan h u b euit.
P % 2 32- ,‘- ‘t. 2-900-4
n- 22 1620 1640 1660 1680 1700 1720 1740 1760 178b
Time from start of throttle movement, msec
(a-81 Engine inlet.
la1 Throttle bu rs t from Mi l i tary to Maximum throt t le position.
Figure 10. -Typical variation of engine af terburning pressures du r ing throt t le movement, from Mi l i tary to Maximum and Maximum to Mi l i tary, dur ing which stall occurred. Distortion-free engine-inlet flow. (Pressure probe locations are defined by axial station, c i r cumferential angle and radial position, e.g., Pt, 2.900-4. See fig. 1 for details. I
28

a” /r p9
70-
3 2 0 ~ 1 0 ~ (b-2) High-p ressu re compressor exit . 7 r 320x103 7 4 5 7
200x103
5 160 M = o’- - 120 E a- ;.
240xg3 (b-3) High-pressure-compressor mid-stage.
200~103
160 E 120
#
s #
m a-
I
I
m VI .- a 120x103 (b-4) Low-pressure-compressor exit.
‘t 2.6-89-1 100
%. “p
N’
a-
\o
F 60
n (b-5) Low-pressure-compressor m id-stage. 7 N
N’ N’ 9 --
IL -- a
I N’
a-
9Ox1O3 , r (b-6) Fan t i o exit.
,r ‘t, 2.3-269-2 A N‘ -- 70 n
60
6Ox1O3 (b-7) Fan hub exit.
P 0
8 N
J5 30
700 720 740 760 780 800 820 E40 860 I ime f rom s i a r i of in ro i i i e movement, msec
(b-8) Engine inlet.
(bl Throttle chop from M a x i m u m to M i l i t a r y t h r o t t l e posit ion.
F igure 10. -Concluded.
_.
29

Throttle burst Throttle chop - I t - 4
8Mo
Stall limit (based on data from ref. 8) / --
- - /
J
.- 0-
I E - 3 m- 2 '- E - = N' .a .--
- N
-a C m Y
I//'. . - ,"J\ / / \-_,------
Stall limit (unpublished manufacturer's data) \ / \ /
2.4
\ 1 \ / - /
0 1 2 3 4 5 6 7 8 9 "20 21 22 23 Time from throttle burst, sec
Figure 11. -Typical variation of operating points of fan tip and hub and low- and high-pressure compressors during stall-free throttle burst and chop between Military and Maximum throttle positions. Distortion-free engine-inlet flow.
30

0
0 0
0 -
A A
25 in
/ /
31

5 0 ~ 1 0 ~
30
20
UXlXld
2mE 100
6Ox1O3
4 o E 20
%E 20
40x1O3
Stall A f te rbu rne r blowout
40~103 r- r l6 30-
20 --*2--*--
10
,- Afterburner blowout -2-C.--.- - - -CL.
l a ) Exhaust nozzle inlet. 3 M l x l d 40
20 100
0 (b) High-pressure compressor exit. 120~103
- - EO -
. - 0 I I I -
2 VI (c) Low-pressure-compressor exit. YI
6Ox1O3 z
20 21-- --- -- - - - / - - A - 0
Id) Fan h u b exit.
,-Rotating stall
( e ) Fan t ip exit. l6
30$ 4 4
10 0 20 40 60 80 100 120 140 160 180
Time, msec
( f ) Engine in let .
Figure 14. - Typical t ime h i s to ry o f engine a f te rbu rn ing parameters d u r i n g stall and a f te rbu rn ing blowout wi th fixed th ro t t l e position. Distort ion-free engine- in let flow.
6
4
2
50
30
10
16
1
'1 1
1, .: 2 3 tA YI u L a
10 5 B 0 m -
6
2
10
6
2
7
5
3
1
I
32

I
I
33

0 istort i on : Full face
188 out of phase
Co-rotating
Contra-rotat ing
Full face
188 o u t of phase
Co-rotating
Contra-rotat ing
Full face
188 out of phase
Co-rotating
Contra- rotating
0 M i l i t a r y th ro t t l e position: seventh-stage bleed closed; 12th-stage bleed closed
E Z I Max imum th ro t t l e position: seventh-stage bleed open; 12th-stage bleed closed Max imum th ro t t l e position: seventh-stage bleed closed; 12th-stage bleed closed
Instantaneous, maximum engine- in let d istort ion,
Pt. 2, av
.06
.ox
.02 .................. .................. ............... .................. ..................... ................ ............... B ,.:.:.>:.:.:.: ...............
.06
.05 Fj ......................... ........................ .ox
b b .07 (No stall; valve l imi ted) . 10
.ox
0 10 20 40 50 60 Normalized engine- in let pressure - Pt, 2,,,in)/Pt, 2,av]X100,
Figure 17. - Stal l to lerance to dynamic engine- in let pressure variations. I n p u t frequency, 20 hertz; simulated f l i gh t M a c h number, 1.4; altitude, 15 250 meters.
NASA-Langley, 1972 - 2 E-6833

I 1. Report No. I 2. Government Accession No. I 3. Recipient's Catalog No.
TURBOFAN ENGINE IN AN ALTITUDE FACILITY: AFTER-
OPERATING LIMITS BURNER PERFORMANCE AND ENGINE-AFTERBURNER
7. Author(s1
John E. McAulay and Mahmood Abdelwahab
9. Performing Organization Name and Address
Lewis Research Center National Aeronautics and Space Administration
July 1972 6. Performing Organization Code
8. Performing Organization Report No.
E-6833 10. Work Unit No.
764- 74 11. Contract or Grant No.
Cleveland, Ohio 44135
National Aeronautics and Space Administration Washington, D.C. 20546
12. Sponsoring Agency Name and Address 13. Type of Report and Period Covered
Technical Note 14. Sponsoring Agency Code .
16. Abstract
F o r distortion-free steady-state operation at the Maximum (full afterburning) throttle position, the afterburner combustion efficiency decreased from 0.91 to 0.68 as engine-inlet Reynolds number index was reduced from 0.80 to 0.25. Engine-afterburner operational l imits were ob- tained for transient and fixed throttle operation over a range of engine-inlet distortions. At limiting conditions, t ime histories of pressures in the fan- compressor during throttle transients between Military and Maximum showed the development of rotating stall in the fan hub which quickly propagated and produced complete stall in the high-pressure compressor.
19. Security Classif. (of this report)
Unclassified
17. Key Words (Suggested by Author(s)) 18. Distribution Statement
20. Security Classif. (of this page) 21. No. of Pages 22. Price'
Unclassified 35 $3.00
Turbofan Afterburner
Unclassified - unlimited
* For sa le by the Nat ional T e c h n i c a l Information Service, Spr ing f ie ld , V i rg in ia 22151