i university of nebraska lincoln impact of ethanol releases: long-term monitoring results roy f....
TRANSCRIPT

I
University of NebraskaLincoln
Impact of Ethanol Releases: Long-Term Monitoring Results
Roy F. Spalding
Nebraska Ethanol Safety and Environmental Coalition Meeting
Aurora, NEFebruary 4, 2010

Collaborators
Kansas Dept of Health & EnvironmentGreg Hattan
Minnesota Pollution Control AgencyMark Toso
Tom HigginsAdam Sekely
University of Nebraska-LincolnMary Exner, co-PI
Dave Fitzpatrick, graduate student

Ethanol Properties Influencing Fate and Transport
Cosolvency
Surface tension
Specific gravity
Interfacial tension
Phase separation
Bioremediation

Vapor Pressure (mm Hg)
If vapor pressure > 100 mm HgVolatilization from free phase (NAPL)Vaporization of residual
product from dry soilLaw of Partial PressurePtotal = PMTBE + Pother constituents
PMTBE = XMTBE PoMTBE
Pi (mm
Hg)
27–280.8–0.9
2.80.2
0.7–0.8
GasolineConstituent
MTBEBenzeneToluene
Ethylbenzene
Xylenes
% by Volume
11%1%
10%2%
10%
(NSTC, OSTP Report, June 1997)Arulanantham et al., 1999
Iso-octane (49)

Benzene Toluene Ethylbenzene Xylene
BTEX

Wat
er S
olu
bil
ity
(mg
L-1
)
ET
BE
E-B
enze
ne
60,000
0
10, 000
20,000
40,000
30,000
Met
ha
no
l
Eth
ano
l
MT
BE
TA
ME
DIP
E
TB
A
Ben
zen
e
Xyl
ene
50,000
To
luen
e
Infinite
Important when considering unsaturated zone and groundwater plume transport
159 161 535 1,780
9,000
20,000
26,000
50,000
SolubilityW
ater
So
lub
ilit
y (m
g L
-1)
ET
BE
E-B
enze
ne
60,000
0
10, 000
20,000
40,000
30,000
Met
ha
no
l
Eth
ano
l
MT
BE
TA
ME
DIP
E
TB
A
Ben
zen
e
Xyl
ene
50,000
To
luen
e
Infinite
Important when considering unsaturated zone and groundwater plume transport
159 161 535 1,780
9,000
20,000
26,000
50,000
Solubility

0.80.70.60.50.40.30.20.1
10
100
1,000
10,000
100,000BenzeneTolueneXylenes
COSOLVENCY
Volume Fraction of Ethanol in the Aqueous Phase
Aq
ueou
s P
hase C
on
cen
trati
on
(m
g/L
)
Powers (2001)

Surface Tension
70 10 20 30 40 50 60
80
70
60
50
40
30
20
10
Su
rface /
In
terf
acia
l Ten
sio
n
(dyn
e/c
m)
Percent Ethanol in Aqueous Phase
Interfacial Tension
Properties Impacting Ethanol & Gasoline in Capillary Fringe
Powers (2001)
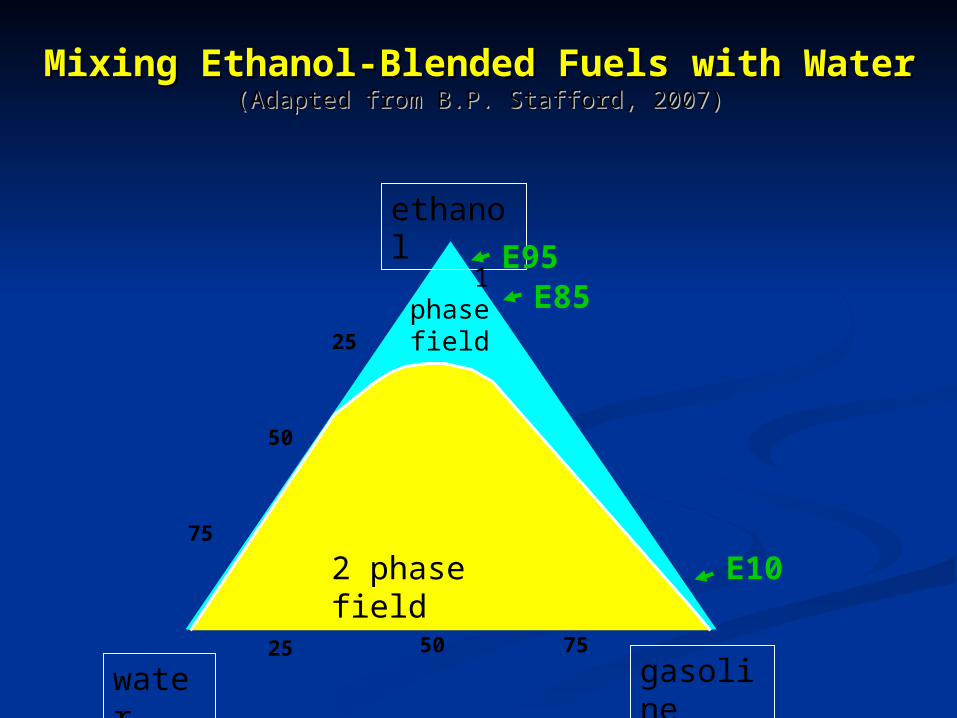
Mixing Ethanol-Blended Fuels with WaterMixing Ethanol-Blended Fuels with Water(Adapted from B.P. Stafford, 2007)(Adapted from B.P. Stafford, 2007)
50 50
50
25
25
75 75
75
ethanol
water gasoline
2 phase field
1phasefield
E10
E95E85

Water Table
gasoline and/or ethanol
water
groundwater
Contaminant spreading in thin layer in collapsed capillary fringe due to decreased interfacial tension.
Predominately anaerobic microbial degradation within the capillary fringe and conversion to methane.
Attenuation in the Capillary Fringe

CH3CH2OH + 1.5 SO4-2 = 2 CO2 + 3 H2O + 1.5 S-2
144 mg SO4-2 /liter consumes 46 mg ethanol /liter
CH3CH2OH + H2O → CH3COOH + 2 H2
CH3COOH → CO2 + CH4
Ethanol Attenuation Mechanisms
Degradation by sulfate reduction:
Fermentation:


~10,000 Gs residual ethanol after product
removal and soil excavation
Balaton, Minnesota
July 28, 2004
~90,000 Gs of d-ethanol released

Balaton, Minnesota

D. Oxygen: 4.3 Years After Derailment

Methane: 2.8 Years After Derailment

Methane: 4.3 Years After Derailment

Benzene: 4.3 Years After Derailment
SOURCE ZONE
C2H5OH: never detected by us
CH3CO2H: 5-100 mg/L
NO3-N: ND in most wells
SO42-: 2 – 3 mg/L
Fe2+: >10 mg/L
Mn2+: ND
H2S: ND

November 22, 2006
~24,877 Gs of d-ethanol released
12,500 Gs recovered
No soil excavation
Cambria, Minnesota

Methane: 0.5 Years After Derailment

Methane: 2 Years After Derailment
SOURCE ZONE
C2H5OH : 120 µg/L – 0.16%
CH3CO2H : <3,090 mg/L
C6H6: ~50 – 900 µg/L
D.O.: < 2 mg/L
SO42-: generally < 5 mg/L
Fe2+: > 10 mg/L
H2S: ND
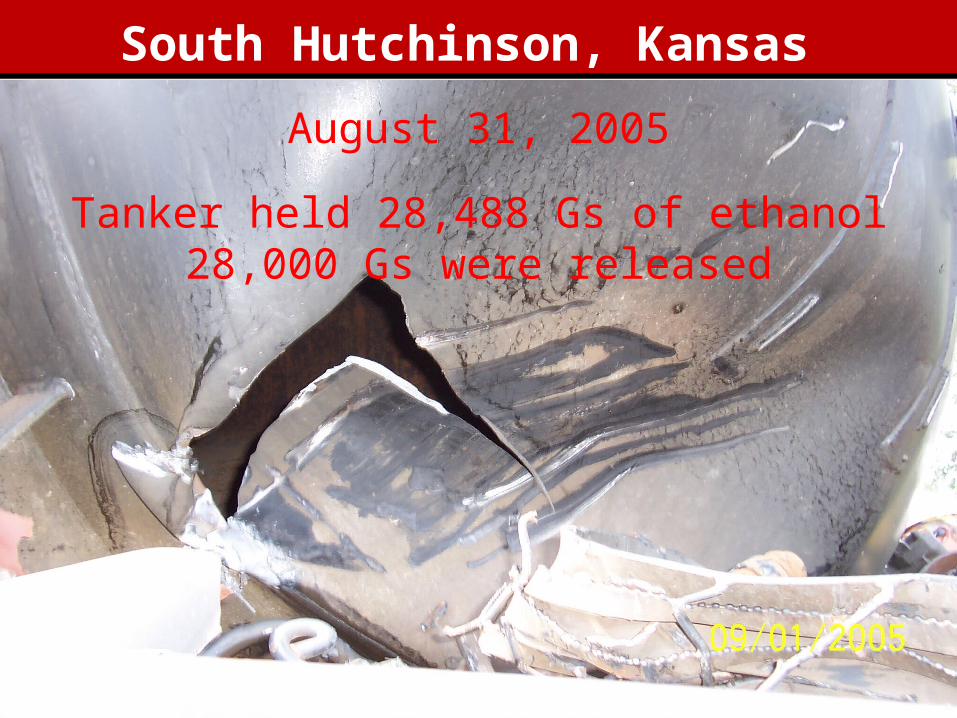
Tanker held 28,488 Gs of ethanol28,000 Gs were released
South Hutchinson, Kansas
August 31, 2005

South Hutchinson, Kansas

D. Oxygen: 1 Year After Derailment
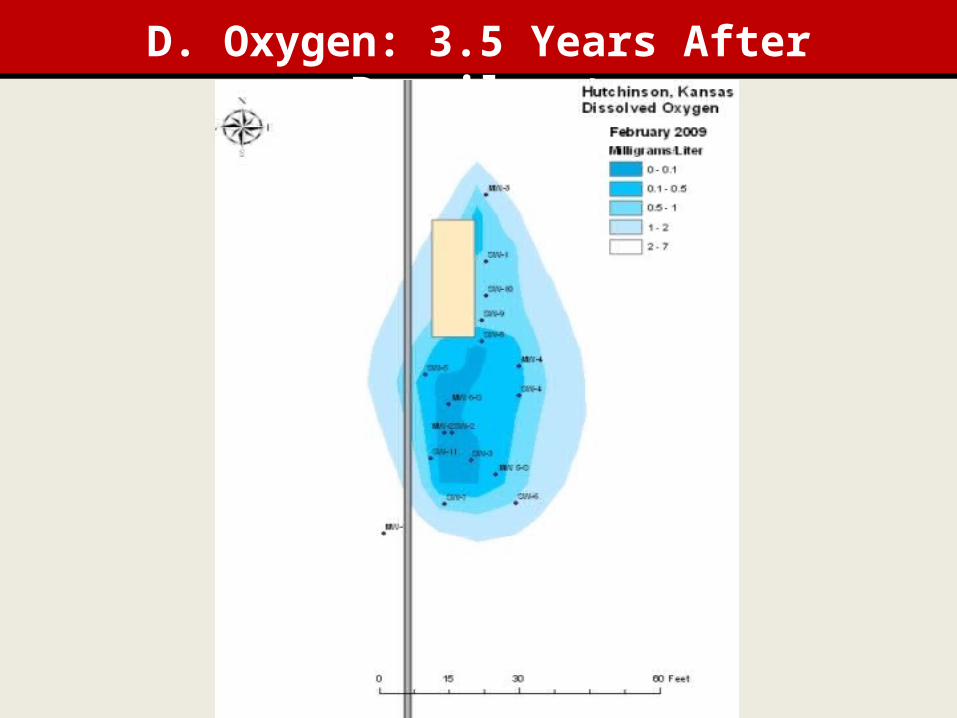
D. Oxygen: 3.5 Years After Derailment

Methane: 1 Year After Derailment

Methane: 1.3 Years After Derailment

Methane: 2 Years After Derailment

Methane: 2.8 Years After Derailment

Methane: 3.5 Years After Derailment
SOURCE ZONE
C2H5OH : <5 - 240,000 µg/L
C6H6: 100 – 560 µg/L

Acetate: 3.5 Years After Derailment
SOURCE ZONE
H2: 3 – 50 nmoles
Fe2+: >10 mg/L
Mn2+: ND
H2S: usually ND
NO3-N: <1.5 mg/L
SO42-: ~45 – 100 mg/L

Ethanol accumulates & persists in the collapsed capillary fringe (CF) and some may be released to gw after 2 years.
Buoyant ethanol (sg = 0.79 g/cc) floats above the water table.
A protective biofilm coating develops around the ethanol delaying anaerobic degradation and production of methane.
Ethanol concentrations may remain toxic to microbial attenuators within the envelope.
Methane continues to be produced years after the release.
Observations of and Explanations for Ethanol’s Unconventional Behavior

Hypothesis for Ethanol’s Persistence in the Source Zone

A controlled ethanol release test site with about 10 feet to groundwater is needed.
The site should be fully instrumented with volatile traps, gas probes, lysimeters, neutron probe tubes, down-hole camera tubes, and multilevel samplers.
The study will focus on reactions in the CF.
Concentrations of ethanol, methane & hydrogen will be measured routinely by students.
Geoprobe™ cores and biotraps will be used to monitor changes in the microbial community as indicated by chemical indicator changes.
The site will allow improved quantification of the ethanol leached to the CF and its persistence in the CF.
Future Research

AcknowledgementsAcknowledgements
Bruce Bauman, API
John Landwehr, Pinnacle Engineering
Shane Jensen, UNL
Nebraska Ethanol Board
