iahr 2015 - validation of swan under extreme conditions in the wadden sea, camarena, deltares,...
TRANSCRIPT

IAHR World Congress 2015
Den Haag, 30th June 2015
Validation of SWAN under extreme
conditions in the Wadden Sea
Amaury Camarena
Caroline Gautier
Joana van Nieuwkoop

Introduction
30 June 2015

Introduction
• Hydraulic Boundary
Conditions partly derived by
the SWAN model.
• Assess the performance of
SWAN when simulating
extreme conditions.
30 June 2015

Study area
Ameland Eastern Wadden Sea
• Stationary SWAN computations: Storm 5th and 6th December 2013
• Several wave measuring devices available for comparison and validation
30 June 2015

Available data and case selection
Eight different times are selected to undertake stationary SWAN
computations (pre, during, post storm).
• Tidal phase
• No large offshore temporal variation
• Availability of data in buoys
(buoys are shown by the different colors)
30 June 2015
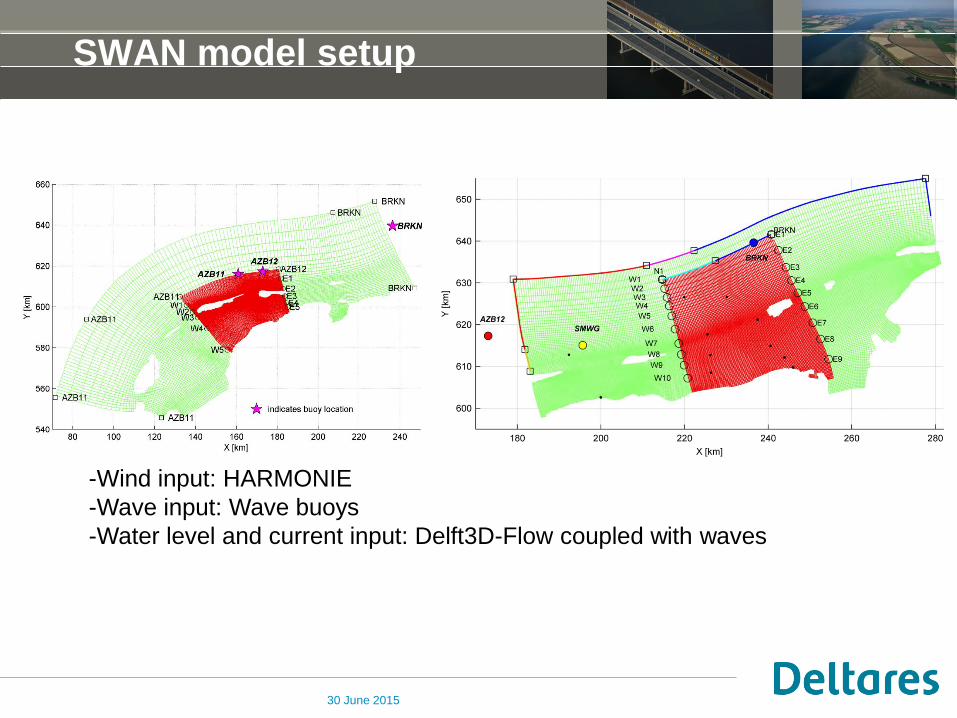
SWAN model setup
-Wind input: HARMONIE
-Wave input: Wave buoys
-Water level and current input: Delft3D-Flow coupled with waves
30 June 2015

SWAN settings
A-series: Reference settings, including currents (based on the
research carried out for the so-called ‘Wettelijk
toetsinstrumentarium’ (WTI) project).
B-series: Reference settings, deactivating currents.
C-series: Komen wind growth and whitecapping with delta=1. These
are the SWAN default settings in version 40.91.A.
D-series: Komen wind growth and whitecapping with delta=0.
Represent the previous default SWAN settings before version
40.91.A.
E-series: Reference settings, without enhanced whitecapping due to
currents (Cds3=0).
30 June 2015

Results - Ameland
• * represent the measured value at the time of the event
• + shows 1 hour after
• □ 1 hour before
30 June 2015

Results - Eastern Wadden Sea
• * represent the measured value at the time of the event
• + shows 1 hour after
• □ 1 hour before
30 June 2015

Statistical performance of SWAN - Ameland
ID SETTINGS BIAS STANDARD DEVIATION
ROOT
MEAN SQUARE
RELATIVE
BIAS
RELATIVE
STANDARD DEVIATION
NUMBER
OF SAMPLES
HM0 A Westh Cds3=0.8 -0.02 m 0.26 m 0.26 m -1.9 % 20.6 % 72
HM0 B Westh (no currents) -0.01 m 0.24 m 0.24 m -0.9 % 18.9 % 72
HM0 C Komen, δ=1 0.13 m 0.37 m 0.39 m 10.0 % 29.0 % 72
HM0 D Komen, δ=0 0.10 m 0.40 m 0.41 m 8.1 % 31.5 % 72
HM0 E Westh Cds3=0.0 0.04 m 0.29 m 0.29 m 3.5 % 23.1 % 72
TM-1,0 A Westh Cds3=0.8 -0.25 s 0.50 s 0.56 s -4.8 % 9.5 % 72
TM-1,0 B Westh (no currents) -0.41 s 0.65 s 0.77 s -7.9 % 12.4 % 72
TM-1,0 C Komen, δ=1 -0.43 s 0.71 s 0.83 s -8.3 % 13.6 % 72
TM-1,0 D Komen, δ=0 -0.86 s 0.77 s 1.15 s -16.5 % 14.7 % 72
TM-1,0 E Westh Cds3=0.0 -0.31 s 0.55 s 0.63 s -5.9 % 10.6 % 72
30 June 2015

Statistical performance of SWAN - Eastern Wadden Sea
ID SETTINGS BIAS STANDARD DEVIATION
ROOT
MEAN SQUARE
RELATIVE
BIAS
RELATIVE
STANDARD DEVIATION
NUMBER
OF SAMPLES
HM0 A Westh Cds3=0.8 0.20 m 0.28 m 0.34 m 10.4 % 14.6 % 48
HM0 B Westh (no currents) 0.23 m 0.28 m 0.36 m 11.8 % 14.7 % 48
HM0 C Komen, δ=1 0.35 m 0.40 m 0.53 m 18.6 % 21.1 % 48
HM0 D Komen, δ=0 0.55 m 0.55 m 0.77 m 29.0 % 28.7 % 48
HM0 E Westh Cds3=0.0 0.27 m 0.30 m 0.40 m 14.3 % 15.9 % 48
TM-1,0 A Westh Cds3=0.8 -0.3 s 0.6 s 0.7 s -5.2 % 9.7 % 48
TM-1,0 B Westh (no currents) -0.5 s 0.8 s 0.9 s -7.4 % 11.6 % 48
TM-1,0 C Komen, δ=1 -0.9 s 0.8 s 1.2 s -14.1 % 11.9 % 48
TM-1,0 D Komen, δ=0 -1.5 s 1.1 s 1.9 s -22.7 % 16.6 % 48
TM-1,0 E Westh Cds3=0.0 -0.6 s 0.6 s 0.8 s -8.3 % 9.5 % 48
30 June 2015

Conclusions
• The reference settings (Series-A) perform significantly better than the
standard SWAN settings especially in areas with mixed swell and wind-
sea conditions.
• The present default SWAN settings (version 40.91.A), which includes
Komen wind growth and whitecapping with delta=1 (C-series), give a
better approximation of wave conditions than previous settings (Komen
with delta=0, D-series) during extreme events on areas dominated by wind
sea and swell like the Wadden Sea.
• Whitecapping formulation and associated calibration parameters strongly
influence the results of the SWAN model.
• Although the effect of currents on wave growth is limited, it cannot be
omitted.
• Overall it is concluded that SWAN is a high quality tool to compute
nearshore waves during storms in the Wadden Sea when the adequate
combination of settings is used.
30 June 2015

Questions?
30 June 2015
Amaury Camarena Calderon Consultant / Researcher
T +31(0)88335 8029
www.deltares.com
P.O.Box 177 2600 MH Delft The Netherlands

Results - SWAN (series A) vs measurements
AZB11 AZB 31 AZB 41 AZB 51 AZB 61 AZB 12
(G1A) AZB 12
(G2A) AZB 22 AZB 32 AZB 42 AZB 52 AZB 62
T1A 0.13 -0.07 0.06 0.06 0.27 0.06 -0.01 -0.17 0.07 0.18 -0.26 -0.20 T2A 0.14 -0.07 -0.05 -0.08 0.09 0.10 0.00 -0.22 0.19 0.14 0.11 0.03 T3A 0.04 0.10 -0.01 -0.01 0.33 0.16 0.00 -0.25 0.14 0.06 0.03 0.06 T4A 0.16 -0.09 -0.02 -0.15 0.06 0.11 0.00 -0.31 -0.14 0.28 -0.17 -0.21 T5A -0.01 -0.02 0.33 0.27 0.39 -0.04 0.10 0.04 0.06 0.04 0.17 0.47 T6A -0.01 -0.16 -0.17 -0.15 0.08 -0.06 0.00 -0.37 -0.21 0.16 0.03 -0.09 T7A -0.05 0.20 0.10 0.06 0.35 0.02 0.00 -0.27 0.07 0.34 0.07 0.11 T8A 0.05 0.18 0.50 0.50 0.91 0.02 0.00 -0.38 -0.01 0.29 0.42 0.04
BRKN
(G1E)
BRKN
(G2E) WEW WEO RZGN OWEN OWEZ UHW2 LAUOT BOSZ PBW
T1E 0.00 -0.01 -0.04 0.14 0.36 0.69 0.36 0.58 0.30 0.20 0.25
T2E 0.02 0.00 -0.05 0.01 0.39 0.51 0.73 0.14 0.27 0.10 0.15
T3E -0.02 0.00 0.13 -0.05 0.39 0.21 0.23 0.27 0.15 0.00 0.08
T4E 0.02 0.00 -0.05 0.12 0.15 0.12 0.59 -0.22 0.11 -0.13 -0.12
T5E 0.01 0.00 -0.24 0.06 0.18 0.86 0.89 -0.07 0.02 0.03 0.23
T6E -0.02 0.00 -0.15 -0.04 0.02 -0.04 0.36 0.03 0.16 0.04 0.21
T7E -0.01 0.00 0.07 0.03 0.09 0.44 0.56 -0.15 0.16 -0.11 -0.06
T8E 0.01 0.00 -0.07 0.14 0.37 0.71 1.04 -0.19 0.25 0.09 0.11
30 June 2015