ibm i navigator performance tasks 2015 neugc - semiug · introduction to the ibm i navigator...
TRANSCRIPT

3/6/2015
1
An Introduction to the IBM i Navigator Performance Tasks
Dawn May – [email protected]@DawnMayiCan
Introduction to the IBM i Navigator Performance Tasks
Navigator for i has an extensive set of performance tasks and this session review the basics of these performance tasks and how to use them.
This presentation will review the Performance Data Investigator, aka "Investigate Data", which allows you to graphically view and analyze IBM i performance data, including some helpful tips on how you can "Investigate Data" to better understand your system's performance and how you can use the Performance Data Investigator for day-to-day management of your IBM i partition. This session will also review the newest performance tasks, including database performance graphs, health indicators, performance reports, system monitors, and how to use batch model for sizing exercises.
© 2015 International Business Machines Corporation 2

3/6/2015
2
IBM Navigator for i
• IBM Navigator for i is the Web console for managing IBM i– Has much of the function as System i Navigator
but with a browser user interface
– Simply point your browser to http://systemname:2001
© 2015 International Business Machines Corporation 3
Updates to Navigator and the Performance Tasks
Major enhancements have been made to Navigator for i and the Performance Tasks
IBM i 7.2 HTTP Server group - SF99713
Java group - SF99716
Database group - SF99702
Performance Tools group - SF99714
IBM i 7.1 HTTP Server group - SF99368
Java group - SF99572
Database group - SF99701
Performance Tools group - SF99145
IBM i 6.1 HTTP Server group - SF99115
Java group - SF99562
Database group - SF99601
Performance Tools group - SF991144
Navigator Enhancementswere taken back to 6.1 and 7.1 in December 2014
© 2015 International Business Machines Corporation

3/6/2015
3
Browser Support
• Supported Browsers for the latest Navigator enhancements:
– Internet Explorer 9
– FireFox 20 or newer
– Google Chrome 25 or higher
• Unexpected results could be browser related. Example problems are….
– Hung charts– Empty tables
• Clear your browser cache after installing the PTFs• Review your browser security settings
• For details see browser tips
5© 2015 International Business Machines Corporation
Tips for Best Performance for Navigator (and the Performance tasks)
• Good system tuning practices are essential– CPU– Memory– Disk
• PDI makes extensive use of SQL to gather data for charts and tables• Navigator tasks run in the ADMIN2 job in the QHTTPSVR subsystem
• Ensure no bad DNS entries on the system
• Use Application Runtime Expert to validate your environment
– Network health checker can be run from QShell:
/QIBM/ProdData/OS/OSGi/templates/bin/areVerify.sh –network
• Use the Web Performance Advisor to validate your Web Performance
6© 2015 International Business Machines Corporation

3/6/2015
4
Navigator Search
Search for Navigator tasks by things you knowYou can find tasks without having to know how to navigate to them
© 2015 International Business Machines Corporation 7
Navigator - Favorites
• Throughout Navigator, can save favorites– Including favorite Performance Data Investigator perspectives
© 2015 International Business Machines Corporation 8

3/6/2015
5
Favorites
© 2015 International Business Machines Corporation 9
Saved by user
Favorites
• Action drop-down or a “Save as Favorite” button
© 2015 International Business Machines Corporation 10
3/6/2015
6
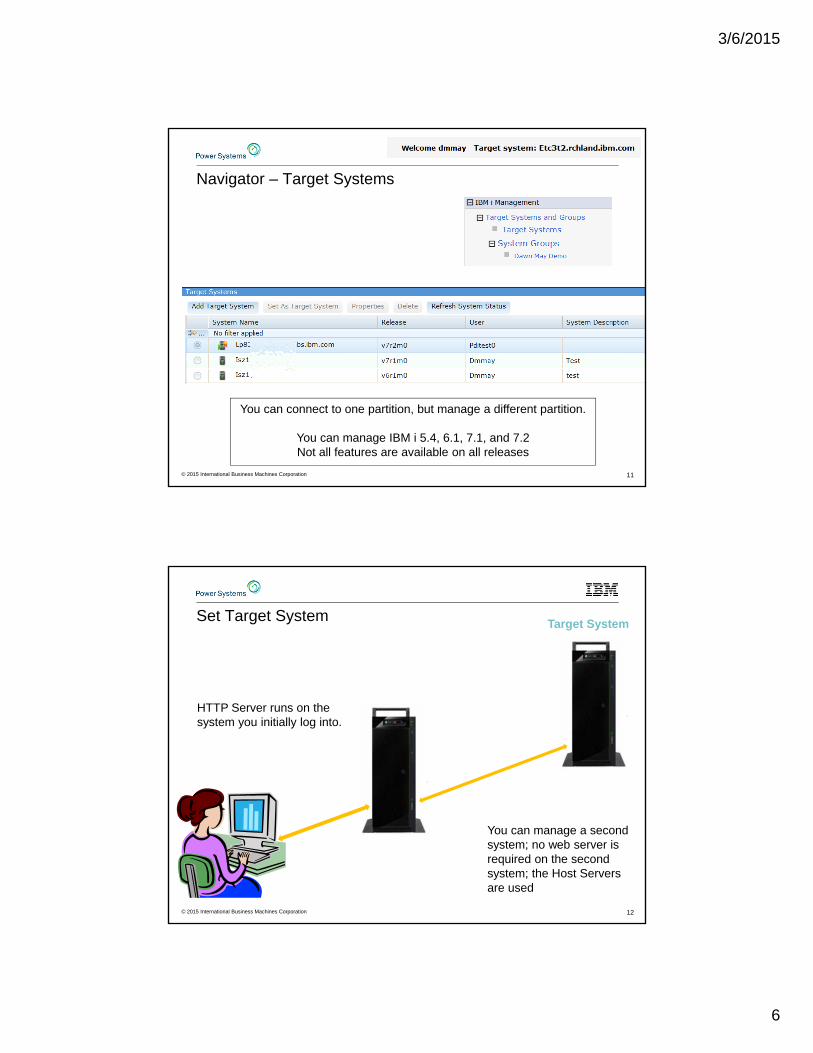
Navigator – Target Systems
© 2015 International Business Machines Corporation 11
You can connect to one partition, but manage a different partition.
You can manage IBM i 5.4, 6.1, 7.1, and 7.2Not all features are available on all releases
Set Target System
12
HTTP Server runs on the system you initially log into.
You can manage a second system; no web server is required on the second system; the Host Servers are used
Target System
© 2015 International Business Machines Corporation

3/6/2015
7
IBM Navigator for iPerformance Tasks
13© 2015 International Business Machines Corporation
© 2015 International Business Machines Corporation 14
Investigate Data

3/6/2015
8
Navigator Performance Tasks
© 2015 International Business Machines Corporation 15
Major enhancements only on 7.2 Database content package enhancements
Monitors
Sizing Batch Model
Most functions are now available on all releases …. with some exceptions
PackagingPerformance Tools Licensed Program Product
16
• IBM i for Collection Services, Health Indicators, Monitors
• Performance Tools Licensed Program Product– 5761PT1 for 6.1
– 5770PT1 for 7.1 and 7.2
• Performance Tools LPP - Options– Performance Tools - Manager Feature Disk Watcher, Performance Explorer, Database, Batch Model
– Performance Tools - Agent Feature
– Performance Tools - Job Watcher
7.27.2
7.27.2
© 2015 International Business Machines Corporation

3/6/2015
9
PackagingPerformance Tools Licensed Program Product
17
IBM Performance Tools –Manager feature
IBM Performance Tools –Job Watcher feature
Included with the base operating system
IBM Performance Tools –Manager featureand latest PTFs
6.1 and 7.16.1 and 7.1
© 2015 International Business Machines Corporation
PackagingPerformance Tools Licensed Program Product
18
IBM Performance Tools –Job Watcher feature
Included with the base operating system
IBM Performance Tools –Manager feature
7.27.2
7.27.2
7.27.2
© 2015 International Business Machines Corporation

3/6/2015
10
Content Packages
• 6.1 and 7.1:
– Health Indicators
– Database
– Job Watcher
– Disk Watcher
– Performance Explorer
• New in 7.2:
– Monitor
– Batch Model
19© 2015 International Business Machines Corporation
PrerequisitesAuthorizing Users to the Performance Tasks
Users need to be authorized to use the investigate data and collection manager performance tasks
Include users on the QPMCCDATA and QPMCCFCN authorization lists
Can be done via GUI or green screen
© 2015 International Business Machines Corporation 20
3/6/2015
11
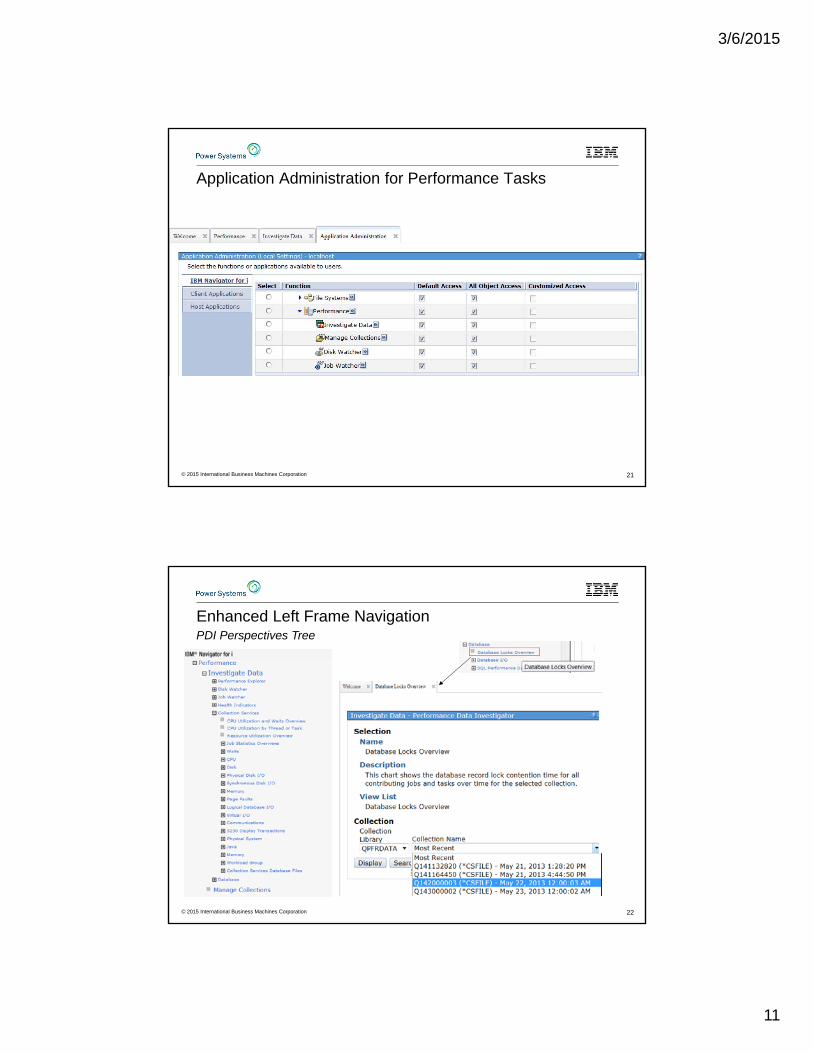
Application Administration for Performance Tasks
© 2015 International Business Machines Corporation 21
Enhanced Left Frame NavigationPDI Perspectives Tree
© 2015 International Business Machines Corporation 22

3/6/2015
12
23
Investigate Data
© 2015 International Business Machines Corporation
Resource Utilization Overview
24
Summary for general overall health: CPU Utilization Disk Utilization Disk Busy 5250 Transactions I/Os per Second Page Faults
© 2015 International Business Machines Corporation

3/6/2015
13
25
CPU Utilization and Waits Overview
© 2015 International Business Machines Corporation
Graphing Multiple Collections
• If your collection library has 5 or fewer collections, an All option is available to display all the collections in one graph
• It will take longer to display the graph
– Multiple collections means larger queries!
• Hint: when the graph appears, you need to use the “full zoom out” tool to display all the data.
© 2015 International Business Machines Corporation 26

3/6/2015
14
An Interesting Example4 days of performance data.
Observe the pattern…
© 2015 International Business Machines Corporation 27
Display Charts in Separate Window
It’s useful to compare two graphs side-by-side
28© 2015 International Business Machines Corporation

3/6/2015
15
Two Different Charts from Two Different Days
29© 2015 International Business Machines Corporation
Size Next UpgradeSend data directly to the IBM Workload Estimator
30
Takes the measured data from Collection Services and inputs it to the IBM Workload Estimator (WLE)
Intended for a one-time sizing activity
© 2015 International Business Machines Corporation

3/6/2015
16
Investigate Data Search
• New “Investigate Data Search”– Replaces the old search (aka “metric finder”)
• Searches in the:– Content package and perspective names
– View
– Description
– Metrics
– SQL
– Search without metrics and SQL for faster results
– Add metrics and SQL for more detail searches
© 2015 International Business Machines Corporation 31
New with 7.2 (and now on earlier releases)
Investigate Data Search
32© 2015 International Business Machines Corporation

3/6/2015
17
Metric Finder
33© 2015 International Business Machines Corporation
© 2015 International Business Machines Corporation 34
Health Indicators

3/6/2015
18
Health Indicators
35
System Resource Health Indicators
Database Health Indicators are new in 7.2
© 2015 International Business Machines Corporation
Define Health Indicators
36
7.2 screen captures7.2 screen captures
© 2015 International Business Machines Corporation

3/6/2015
19
Define Health Indicators
37
7.2 screen captures7.2 screen captures
7.27.2© 2015 International Business Machines Corporation
© 2015 International Business Machines Corporation 38
Reports

3/6/2015
20
Performance Data Reports
39
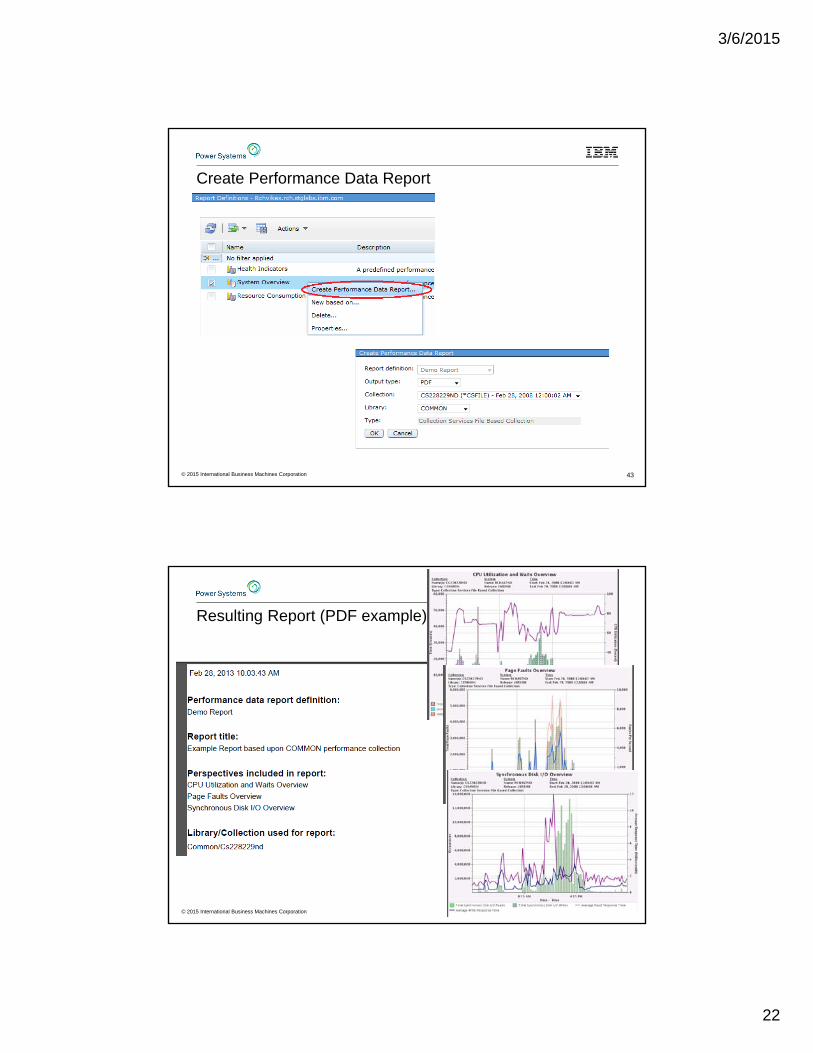
Create a group of printed or online graphs of performance perspectives
Generate a PDF or zip file containing the requested graphs for the collection
Use for weekly reports
“Executive” Reports
Start with Report Definitions
© 2015 International Business Machines Corporation
Enhanced Left Frame NavigationPerformance Data Report actions
Click on the action to start a new tab.Get to the action you want more quickly.
© 2015 International Business Machines Corporation 40

3/6/2015
21
Report Definitions
41© 2015 International Business Machines Corporation
Create your own Report Definition
42
1
2
3
4
© 2015 International Business Machines Corporation
3/6/2015
22
Create Performance Data Report
43© 2015 International Business Machines Corporation
Resulting Report (PDF example)
44© 2015 International Business Machines Corporation

3/6/2015
23
© 2015 International Business Machines Corporation 45
7.2System Monitors
7.2 System Monitors
• System Monitors are new with Navigator in 7.2– Similar to Management Central System Monitors
• System Monitor data comes from Collection Services
• You view System Monitor data with the Performance Data Investigator
© 2015 International Business Machines Corporation 46

3/6/2015
24
Monitors with IBM Navigator for i
List of system monitors on the system
Select what you want to monitor
Set monitoring intervals
Set thresholds
Define actions taken when a threshold is reached
Manage event logs
© 2015 International Business Machines Corporation 47
Create New System Monitor
© 2015 International Business Machines Corporation 48

3/6/2015
25
Metrics to MonitorLink to configure thresholds and actions
© 2015 International Business Machines Corporation 49
Navigator - System Monitor Metrics
• CPU Utilization (Average)• CPU Utilization (Interactive Jobs)• CPU Utilization(Uncapped)• CPU Utilization(SQL) • Interactive Response Time (Average and Maximum) • Transaction Rate (Interactive) • Batch Logical Database I/O• Disk Arm Utilization (Average and Maximum)• Disk Arm Utilization for User/System/Independent ASP (Average and Maximum)• Disk Storage Utilization (Average and Maximum) • Disk Storage Utilization for User/System/Independent ASP (Average and Maximum) • Communications Line Utilization (Average and Maximum) • LAN Utilization (Maximum and Average) • Machine Pool Faults • User Pool Faults (Maximum and Average) • Spool File Creation Rate • Shared Processor Pool Utilization (Virtual and Physical)• Temporary Storage Utilization
Red are new with 7.2 Navigator Monitors
© 2015 International Business Machines Corporation 50

3/6/2015
26
Configure Metric
Metric name
Collection Interval
Threshold 1 & 2
© 2015 International Business Machines Corporation 51
Investigate Data - Monitor
• Investigate Monitor Data starting from the monitor
© 2015 International Business Machines Corporation 52

3/6/2015
27
Investigate Data - Monitor
• Investigate Monitor Data via the Performance Data Investigator– This interface allows you to view monitor data without having set
up a system monitor
© 2015 International Business Machines Corporation 53
System Monitor Graphs in PDI
New Perspective Package
© 2015 International Business Machines Corporation 54
Investigate Monitor DataLaunch from System Monitor GUI
Display Graphs in PDI

3/6/2015
28
System Monitor Graphs in PDI
© 2015 International Business Machines Corporation 55
Table data behind the chart
© 2015 International Business Machines Corporation 56
7.2Batch Model

3/6/2015
29
Batch Model
• Batch performance is important for many customers
• "What can I do to my system in order to meet my overnight batch run-time requirements?”
– (also known as the Batch Window )
• A sizing tool – based on Collection Services performance data
– predicts batch workload run times, resources used, and duration of the “batch window”
© 2015 International Business Machines Corporation 57
Batch Model
© 2015 International Business Machines Corporation 58

3/6/2015
30
Batch Model
• What does it do? Helps you optimize workloads by locating times during the batch window
when more efficient job scheduling can improve total system throughput
Models workload increases
Predicts the changes in throughput that will result from hardware upgrades (processor or disk)
Predicts run times for individual workloads and the overall batch window
Models batch workloads that are CPU or disk intensive
• How does it work? Links individual workloads together to create an ordered series of
workloads
Powered by an iterative analytic model that attempts to converge on a solution
Predicts utilization, throughput and response time for each workload
© 2015 International Business Machines Corporation 59
Batch ModelCreate Batch Model
Create a new Batch Model from an existing Collection Services File Based Collection
© 2015 International Business Machines Corporation 60

3/6/2015
31
Batch ModelChange Batch Model – Processor
© 2015 International Business Machines Corporation 61
Batch ModelChange Batch Model – Storage
Add, Change, or Delete Disk Configurations
© 2015 International Business Machines Corporation 62

3/6/2015
32
Batch Model Workload Timeline Overview
Compare Measured vs Modeled Workload Timelines
Exceptional Wait Time
Queuing
Service
Service
Exceptional Wait Time
Queuing
Service
Service
© 2015 International Business Machines Corporation 63
Batch ModelExceptional Wait Detailed Overview
Investigate the waits that make up the “exceptional wait” time
Time (Seconds)Exceptional Wait Detailed Overview
© 2015 International Business Machines Corporation 64

3/6/2015
33
Batch Model Resource Utilization Overview
Compare the Measured vs Modeled Resource Utilization
© 2015 International Business Machines Corporation 65
Batch Model with Prior Release Collections
• You can restore Collection Services data from 6.1 or 7.1 onto a 7.2 partition
– … and use batch model with that prior release data
© 2015 International Business Machines Corporation 66

3/6/2015
34
© 2015 International Business Machines Corporation 67
Performance Tasks and
Work Management
Investigate Data for an Active Job
68
Active jobs – what’s happening right now
Job wait dataCollection Services job data
How did I get here?© 2015 International Business Machines Corporation
3/6/2015
35
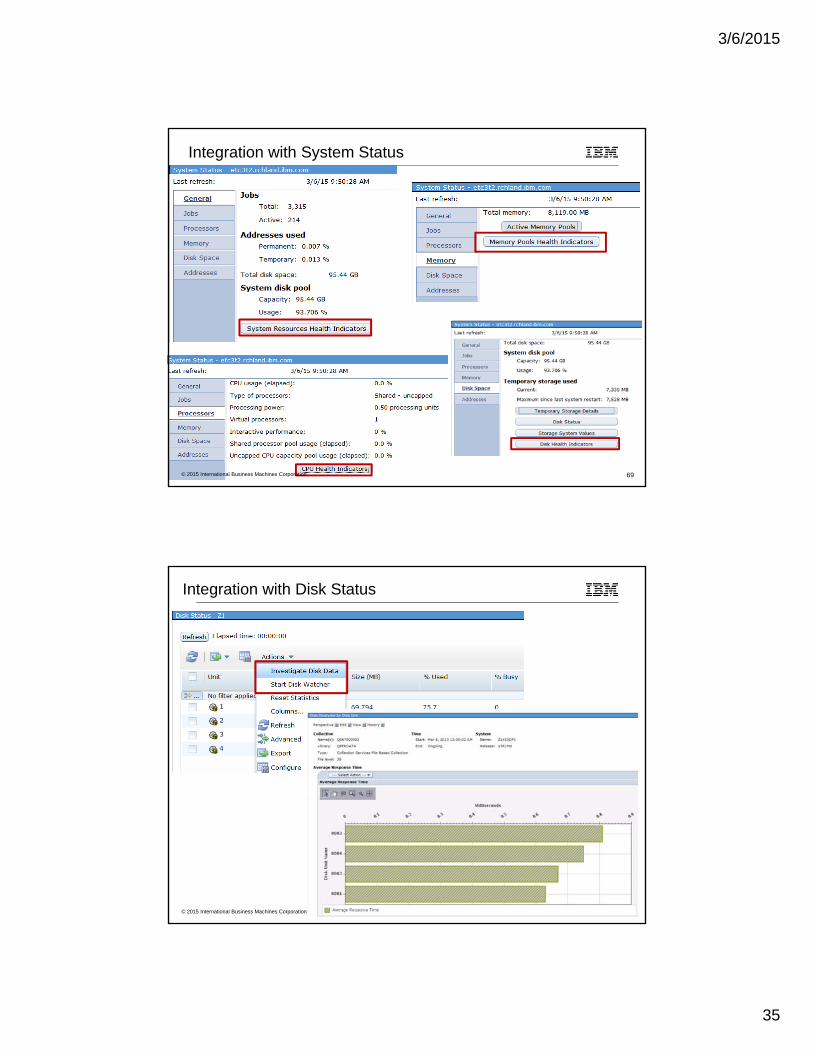
Integration with System Status
69© 2015 International Business Machines Corporation
70
Integration with Disk Status
© 2015 International Business Machines Corporation

3/6/2015
36
Investigate Data
Database
71
Need latest PTF groups, including the database group
Must have the Performance Tools LPP, Manager feature, Installed
Available on both IBM i 6.1 and 7.1
Additional enhancements with 7.2
© 2015 International Business Machines Corporation
Integration with Database
• Leverage the capabilities of PDI with valuable data gathered from database
• Collection Services collection of job-level SQL metrics
• Performance Data Investigator charting of
– SQL Plan Cache Snapshots and Event Monitors
– SQL Performance Monitor files
– Collection services job-level SQL metrics
• Visual charts and/or tables in PDI that are focused on database related metrics
• Navigation between database and performance tasks
72© 2015 International Business Machines Corporation

3/6/2015
37
Database Perspectives
73© 2015 International Business Machines Corporation
Database tasks…
© 2015 International Business Machines Corporation 74
3/6/2015
38
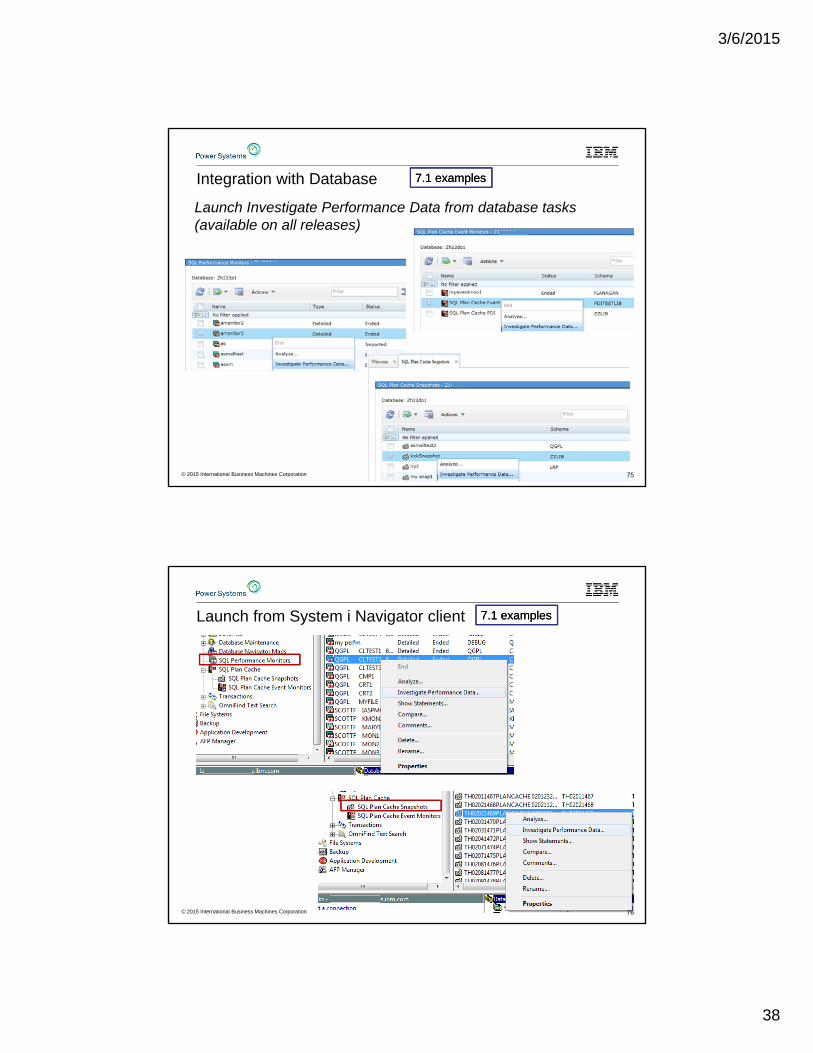
Integration with Database
Launch Investigate Performance Data from database tasks(available on all releases)
© 2015 International Business Machines Corporation 75
7.1 examples7.1 examples
Launch from System i Navigator client
© 2015 International Business Machines Corporation 76
7.1 examples7.1 examples

3/6/2015
39
Integration with Database – package overview
• What you see in PDI will depend upon the currency of your HTTP Server Group PTF
• December 2014 update resulted in single source for all releases
– You will see the same navigation for all releases
– However, not all function is available on 6.1 and 7.1
– The following slides will sort this out for you….
© 2015 International Business Machines Corporation 77
Database Perspectives
© 2015 International Business Machines Corporation 78

3/6/2015
40
I/O Reads and Writes
© 2015 International Business Machines Corporation 79
6.1 or later6.1 or later
SQL CPU Utilization
• Shows you the SQL CPU Utilization sorted by thread• A starting point to determine if your CPU utilization is due to SQL or other work
© 2015 International Business Machines Corporation 80
7.1 or later7.1 or later
3/6/2015
41
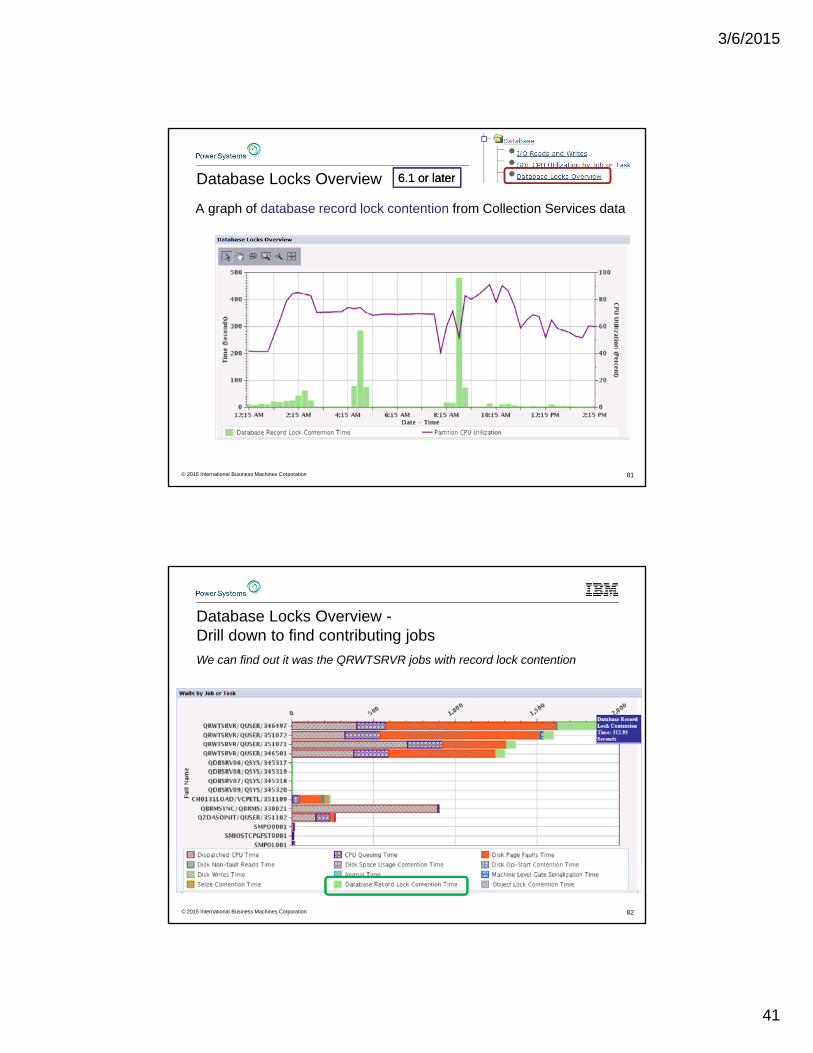
Database Locks Overview
A graph of database record lock contention from Collection Services data
© 2015 International Business Machines Corporation 81
6.1 or later6.1 or later
Database Locks Overview -Drill down to find contributing jobs
© 2015 International Business Machines Corporation 82
We can find out it was the QRWTSRVR jobs with record lock contention

3/6/2015
42
Database Perspectives Database Package
• I/O Reads and Writes
• Physical Database I/O - Detailed
• Logical Database I/O – Detailed
• SQL Performance Data –Collection Services
Health Indicators Package
• Database Health Indicators
© 2015 International Business Machines Corporation 83
7.27.2
7.27.2
7.1 and later7.1 and later
7.1 and later7.1 and later
© 2015 International Business Machines Corporation
Physical Database I/O - Basic and Detailed
Basic – Provide more overview data, not broken down
Two metrics charted:• Physical Database I/O Reads
per second• Physical Database I/O Writes
per second
Detailed – Includes breakdown by Sync/Async, SQL & Non-SQL
84
7.1 and later7.1 and later

3/6/2015
43
© 2015 International Business Machines Corporation
Physical Database I/O – Basic
drilldowns
85
Physical Database I/O – DetailedRequires Job-Level Database Statistics
The following metrics have been added to the job performance data *JOBMI category of Collection Services in 7.1
– SQL clock time (total time in SQ and below) per thread (microseconds)
– SQL unscaled CPU per thread (microseconds)
– SQL scaled CPU per thread (microseconds)
– SQL synchronous database reads per thread
– SQL synchronous nondatabase reads per thread
– SQL synchronous database writes per thread
– SQL synchronous nondatabase writes per thread
– SQL asynchronous database reads per thread
– SQL asynchronous nondatabase reads per thread
– SQL asynchronous database writes per thread
– SQL asynchronous nondatabase writes per thread
– Number of high level SQL statements per thread
– Special instructions to activate the support– Error if you try to display one of these charts but have not activated the support:
© 2015 International Business Machines Corporation 86
7.17.1

3/6/2015
44
Job-Level Database Statistics• Ten perspectives (8 on perspective list plus 2 drilldowns)
– Physical Database I/O for Jobs or Tasks - Detailed– Physical Database I/O for One Job or Task - Detailed
7.17.1
© 2015 International Business Machines Corporation 87
© 2015 International Business Machines Corporation
Logical Database I/O - Basic and Detailed
Basic are the same as under Collection Services, Logical Database I/O
Detailed – Provide more breakdown of the data added in QAPMJOBOS
Logical database I/O read, write and all other I/O requests by SQL related and non-SQL related
88
7.1 and later7.1 and later
3/6/2015
45
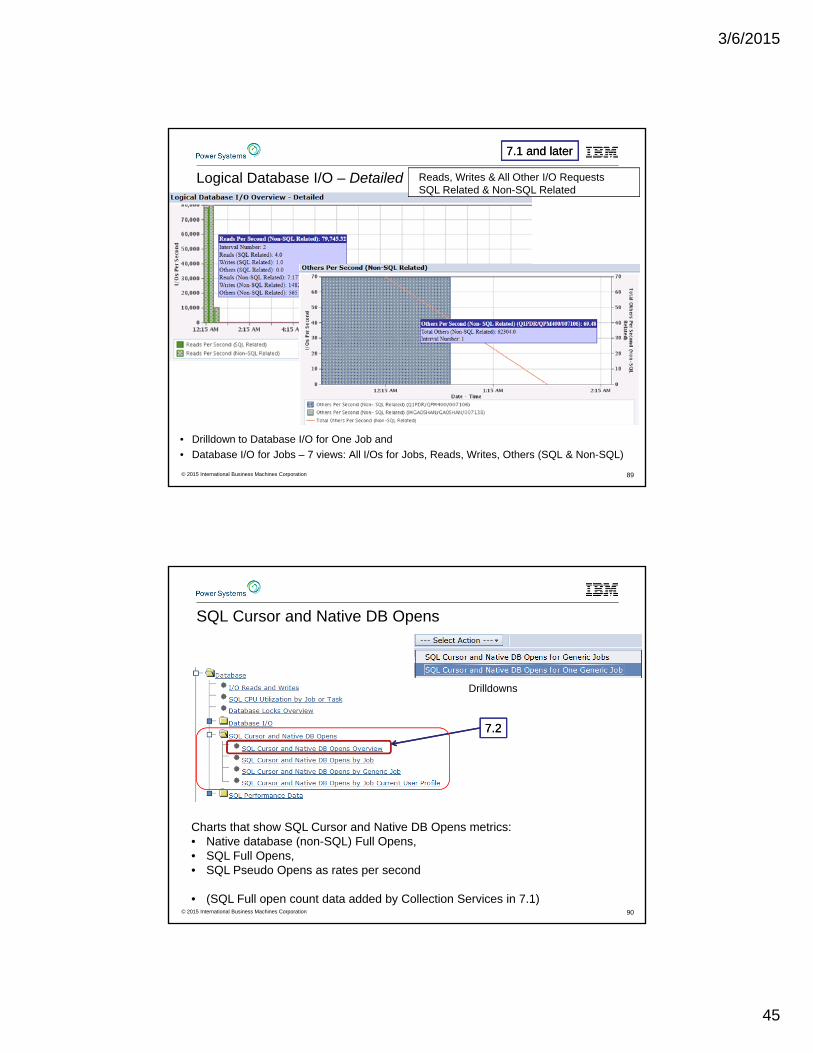
© 2015 International Business Machines Corporation
Logical Database I/O – Detailed
• Drilldown to Database I/O for One Job and
• Database I/O for Jobs – 7 views: All I/Os for Jobs, Reads, Writes, Others (SQL & Non-SQL)
Reads, Writes & All Other I/O RequestsSQL Related & Non-SQL Related
89
7.1 and later7.1 and later
© 2015 International Business Machines Corporation
SQL Cursor and Native DB Opens
Charts that show SQL Cursor and Native DB Opens metrics:• Native database (non-SQL) Full Opens, • SQL Full Opens, • SQL Pseudo Opens as rates per second
• (SQL Full open count data added by Collection Services in 7.1)90
7.27.2
Drilldowns
3/6/2015
46
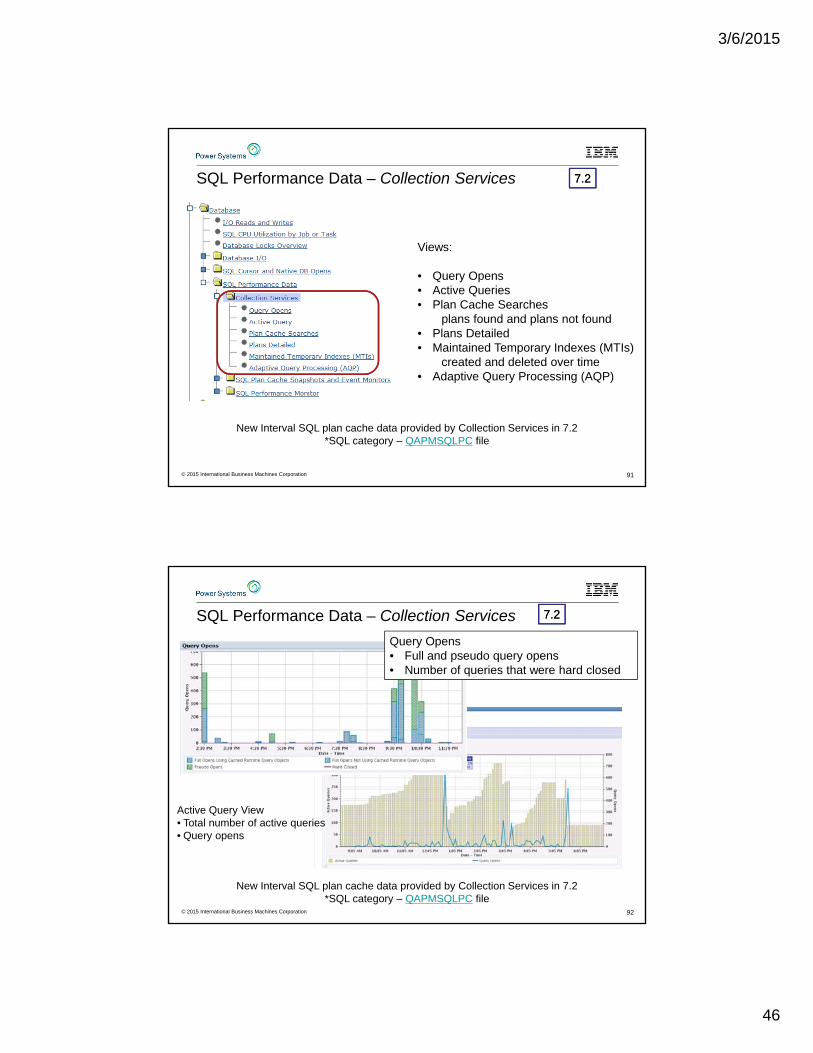
SQL Performance Data – Collection Services
© 2015 International Business Machines Corporation 91
New Interval SQL plan cache data provided by Collection Services in 7.2*SQL category – QAPMSQLPC file
Views:
• Query Opens• Active Queries• Plan Cache Searches
plans found and plans not found• Plans Detailed• Maintained Temporary Indexes (MTIs)
created and deleted over time• Adaptive Query Processing (AQP)
7.27.2
SQL Performance Data – Collection Services
© 2015 International Business Machines Corporation 92
Query Opens• Full and pseudo query opens• Number of queries that were hard closed
Active Query View• Total number of active queries • Query opens
7.27.2
New Interval SQL plan cache data provided by Collection Services in 7.2*SQL category – QAPMSQLPC file
3/6/2015
47
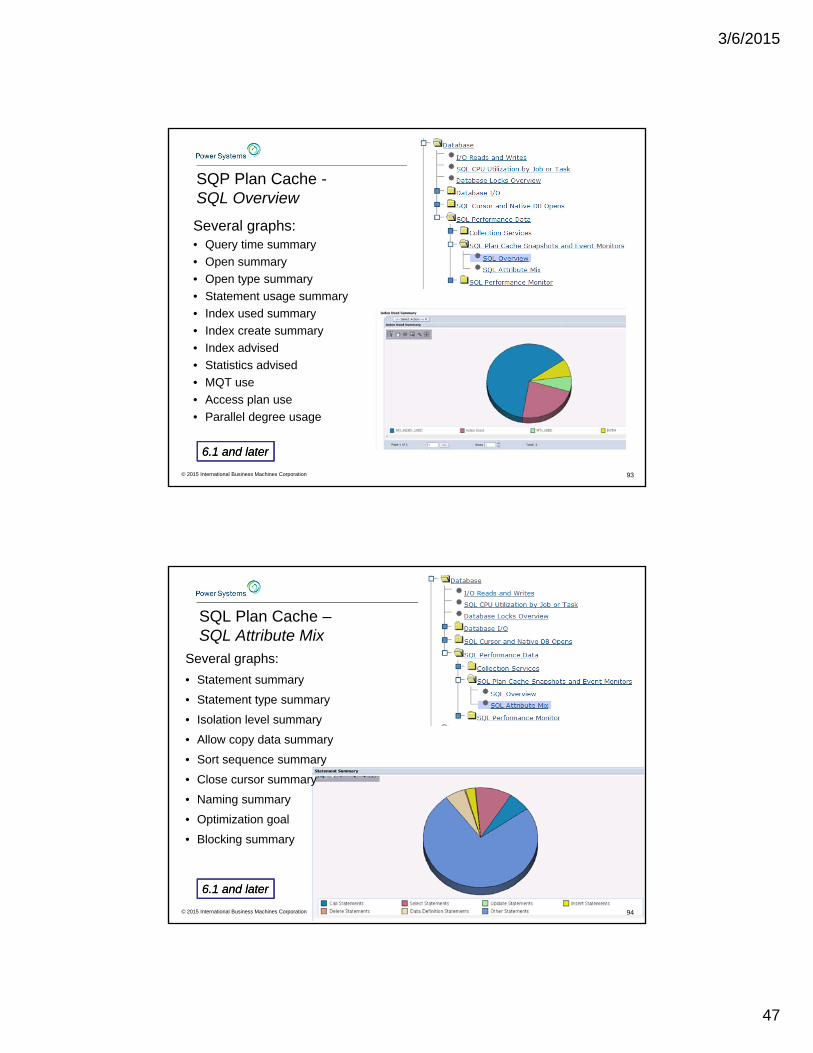
SQP Plan Cache -SQL Overview
Several graphs:• Query time summary
• Open summary
• Open type summary
• Statement usage summary
• Index used summary
• Index create summary
• Index advised
• Statistics advised
• MQT use
• Access plan use
• Parallel degree usage
© 2015 International Business Machines Corporation 93
6.1 and later6.1 and later
SQL Plan Cache –SQL Attribute Mix
Several graphs:
• Statement summary
• Statement type summary
• Isolation level summary
• Allow copy data summary
• Sort sequence summary
• Close cursor summary
• Naming summary
• Optimization goal
• Blocking summary
© 2015 International Business Machines Corporation 94
6.1 and later6.1 and later

3/6/2015
48
SQL Performance Monitor
Similar to the SQL Plan Cache perspectives, SQL Performance Monitor perspectives use PDI to graphically display SQL Performance Monitor information
© 2015 International Business Machines Corporation 95
6.1 and later6.1 and later
Database Health Indicators
© 2015 International Business Machines Corporation 96
Analyzes all collection time intervals according to the defined thresholds for database. Shows the proportion of intervals where Database health indicators exceeded the defined thresholds.
Drilldowns
7.27.2

3/6/2015
49
Investigate Data Examples
Dawn’s Favorite Collection Services Perspectives
(PDI is for more than Performance)
New Perspectives
97© 2015 International Business Machines Corporation
Physical System Charts – Frame view of Utilization!
98
Collection Services has the ability to collect certain high-level cross-partition processor performance metrics for all logical partitions on the same single physical server regardless of operating system. This is available on Power 6 and above servers, with a minimum firmware level xx340_061. When this data is available, it can be viewed via several perspectives found under "Physical System".
HMC option – “Allow performance information collection” must be turned on for the IBM i partition to collect the data
© 2015 International Business Machines Corporation

3/6/2015
50
Logical Partitions OverviewRequires Power 6 and IBM i 6.1 or later
99© 2015 International Business Machines Corporation
12X Bus Utilization
• Collection Services collects utilization data for 12X buses in the QAPMBUSINT file
– Graphs shipped with PDI with Spring 2014 update! Previously you had to extend PDI with a custom content package to
view this data
– Enable Performance information collection on the HMC
© 2015 International Business Machines Corporation 100
3/6/2015
51
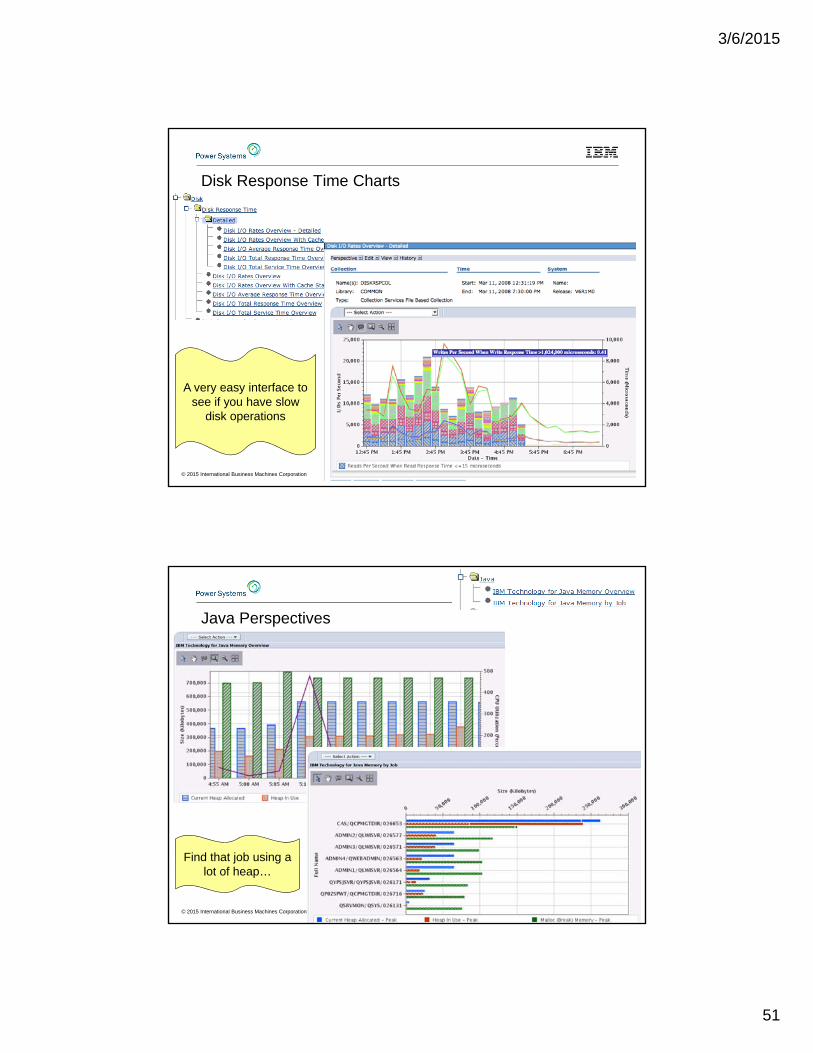
Disk Response Time Charts
101
A very easy interface to see if you have slow
disk operations
© 2015 International Business Machines Corporation
Java Perspectives
102
Find that job using a lot of heap…
© 2015 International Business Machines Corporation

3/6/2015
52
Java Perspectives
Drilldown for one job - Look at the heap and memory usage over time for one selected job.
IBM Technology for Java Memory for One Job© 2015 International Business Machines Corporation 103
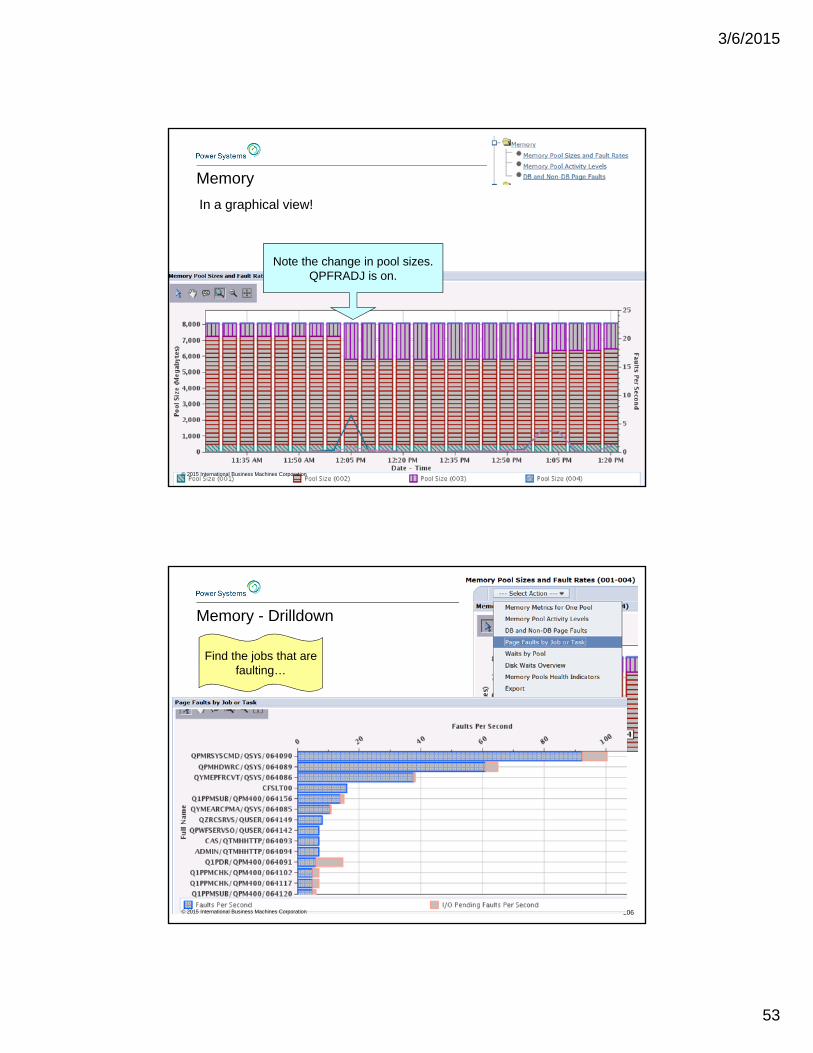
Memory
• Memory perspectives are now available
• Similar information from what you get on WRKSYSSTS….
104© 2015 International Business Machines Corporation
3/6/2015
53
Memory
105
In a graphical view!
Note the change in pool sizes.QPFRADJ is on.
© 2015 International Business Machines Corporation
Memory - Drilldown
106
Find the jobs that are faulting…
© 2015 International Business Machines Corporation

3/6/2015
54
Performance Data InvestigatorStorage Allocation Perspectives
© 2015 International Business Machines Corporation 107
7.2 7.2
Expand Collection Services
Temporary Storage Allocation / Deallocation Overview
© 2015 International Business Machines Corporation 108
Generally, allocations and deallocations following a similar pattern

3/6/2015
55
Temporary Storage Allocation by Job or Task
© 2015 International Business Machines Corporation 109
Generally, allocations and deallocations following a similar pattern
110
Storage Allocation Perspectives
7.2 and earlier 7.2 and earlier
© 2015 International Business Machines Corporation

3/6/2015
56
111
Storage Allocation by Thread or Task
7.2 and earlier 7.2 and earlier
© 2015 International Business Machines Corporation
112
Timeline Perspective
The timeline bars on the chart represent the elapsed time of threads or tasks– Dispatched CPU Time– CPU Queuing Time– Other Waits Time
© 2015 International Business Machines Corporation

3/6/2015
57
Select a job for drilldown …
© 2015 International Business Machines Corporation 113
You can see when the threads for that job ranTip: you can select more than one job for your drilldown selection
114
Performance Data - Analysis
Performance Diagnostics with the Performance Data Investigator
© 2015 International Business Machines Corporation

3/6/2015
58
Analyzing Performance Data Using PDI
115
• Now that you know all that PDI can do….
– How do you really use it to analyze performance data?
– There are no specific steps it depends upon what you see in the performance data
– If you look at your performance data on a regular basis, you will learn your “normal” pattern which makes it easier to identify something unusual
– Experience is the best teacher
© 2015 International Business Machines Corporation
Analyzing Performance Data Using PDI• Start by asking questions:
– What was the symptom of the problem?
– Who reported the problem?
– What time did it occur?
– How long did it last?
– Have there been any recent changes?
New or changed workload?
Any application changes?
Any recent hardware configuration changes?
– What was the scope?
Did it impact the entire system?
Did it impact some subset of work?– Specific users?
– Specific applications?116© 2015 International Business Machines Corporation

3/6/2015
59
CPU Utilization and Waits Overview
117
I generally start with CPU Utilization and Waits Overview and look for interesting points
Next steps will depend upon the answer to the prior questions, along with what you see.
© 2015 International Business Machines Corporation
Using PDI, you can learn how to navigate through your data
Collection Services data may not be able to resolve your problem, but it may very well help to identify areas where more detailed analysis is needed.
118© 2015 International Business Machines Corporation

3/6/2015
60
Drill-down based upon what you see
• While no one job was causing the spike in contention, we can find out many jobs were affected during that interval.
• This is an example where Collection Services can show us something is going on, but Job Watcher data is necessary to identify the root cause.
119© 2015 International Business Machines Corporation
© 2015 International Business Machines Corporation 120
Some questions and examples

3/6/2015
61
What has the performance adjuster been doing to my pools?
• Collection Services allows you to look backward in time
© 2015 International Business Machines Corporation 121
What does the faulting look like when I was testing?
© 2015 International Business Machines Corporation 122

3/6/2015
62
Who was the guilty party in that faulting??
• You can drill down into job statistics from the prior charts
• Or you can start directly with page faulting perspectives
© 2015 International Business Machines Corporation 123
I had a System Slowdown at 4:00 PM yesterday. Why?
• Start with a system-wide view –– CPU Utilization and waits overview
• Select the starting and ending times
• Drill-down into the desired metric– For example, CPU Utilization by Thread or Task
• Does one particular job stand out?
© 2015 International Business Machines Corporation 124
3/6/2015
63
© 2015 International Business Machines Corporation 125
End of questions and examples
Documentation …
How do I learn about all the new stuff??
– Technology Refreshes
– Add function PTFs
– New release
and there’s all that old stuff too…
© 2015 International Business Machines Corporation 126

3/6/2015
64
Knowledge Center
IBM i documentation is found under IBM Operating Systems
© 2015 International Business Machines Corporation 127
IBM i 7.2 Documentation
Knowledge Center for IBM i 7.2
Performance is now a major topic - no longer under Systems Management
Navigator is under Connecting to your system
© 2015 International Business Machines Corporation 128

3/6/2015
65
7.1
© 2015 International Business Machines Corporation 129
IBM i developerWorks
• IBM i developerWorks is the web site to go to find out about
– Latest function delivered via Technology Refreshes
– Enhancements delivered via PTFs
– http://www.ibm.com/developerworks/ibmi/
130© 2015 International Business Machines Corporation
3/6/2015
66
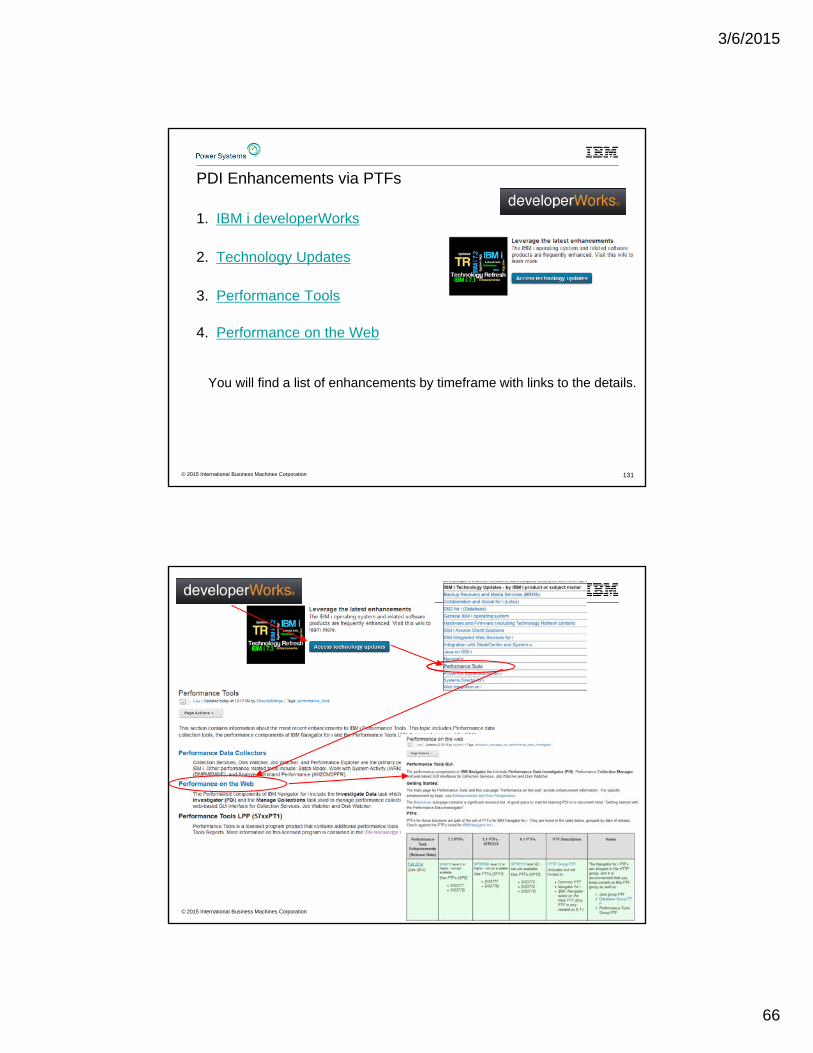
PDI Enhancements via PTFs
1. IBM i developerWorks
2. Technology Updates
3. Performance Tools
4. Performance on the Web
You will find a list of enhancements by timeframe with links to the details.
131© 2015 International Business Machines Corporation
132© 2015 International Business Machines Corporation

3/6/2015
67
www.ibm.com/power/i
133© 2015 International Business Machines Corporation
134
References
© 2015 International Business Machines Corporation

3/6/2015
68
IBM i Performance on developerWorks
developerWorks
Performance Tools Additional performance tools resources
Performance on the Web
Performance Data Collectors
Forum
IBM i Performance Data Investigator
IBM i Performance Data Investigator – Edit Perspectives
IBM i Wait Accounting
How to use the Batch Model performance tool
© 2015 International Business Machines Corporation 135
iDoctor versus Performance Data Investigator
Feature iDoctor PDI
Interface Windows client Browser
Wait Analysis Yes Yes
Collection Services Yes Yes
Job Watcher Yes Yes
Disk Watcher Yes Yes
Performance Explorer Yes Profile collections only
Database Yes Yes
Job Watcher Monitors Yes No
Customizable Yes Yes
User Defined graphs and queries
Yes Yes
Update Frequency MonthlyExperimental features
Twice Yearly
Support Defect only Standard SWMA
Chargeable Yearly license •Collection Services at no additional charge with i•Disk Watcher, Database, and Performance Explorer included with base PT1 product•Job Watcher is an additional option of PT1 and has an additional charge
Experimental Features Yes (e.g., VIOS Investigator) No
Multinational language support
No Yes
136
There are two graphical interfaces for performance data analysis…which should you use?
© 2015 International Business Machines Corporation

3/6/2015
69
IBM i Performance FAQa MUST read!
http://www.ibm.com/common/ssi/cgi-bin/ssialias?subtype=WH&infotype=SA&appname=STGE_PO_PO_USEN&htmlfid=POW03102USEN&attachment=POW03102USEN.PDF
© 2015 International Business Machines Corporation 137
IBM i Web Sites with Performance Information
• IBM Knowledge Center– 7.1– 7.2
IBM i Performance ManagementThis web site has a lot of GREAT references and papers – see the resources tab
Performance Management for Power Systems
IBM Workload Estimator
iDoctor
Job Waits Whitepaper
© 2015 International Business Machines Corporation 138

3/6/2015
70
You and ihttp://www.ibmsystemsmag.com/Blogs/You-and-i/
i Canhttp://www.ibmsystemsmag.com/Blogs/i-Can/
Mr. Modern-i-zation Rowehttps://www.systemideveloper.com/blogs/?q=blog/6
DB2 for ihttp://db2fori.blogspot.com/© 2015 International Business Machines Corporation 139
© 2015 International Business Machines Corporation 140
New Monitor Metrics in 7.2
IBM i Disk Watcher Dan Do More
IBM i 7.2 Improved Temporary Storage Tracking (Part 4)
IBM i 7.2 - Navigator Monitors
IBM i 7.2 - Batch Model
Health Indicators in the Performance Data Investigator
IBM i Storage Allocation Perspectives
IBM i Performance Analysis
IBM Power Virtualization Performance (PowerVP)
View Memory Pools and Faulting with the Performance Data Investigator
IBM i Wait Accounting
Viewing Job Level SQL Metrics with the Performance Data Investigator
Anticipating the Future
Job Level SQL Metrics in Collection Services
Performance Reports With the Performance Data Investigator
IBM i Performance Frequently Asked Questions
Commands to Manage Performance Collections
Performance Data Investigator
Performance Data Collectors in IBM i
Performance Data Investigator - Better Than Ever
Job Performance Information
CPF1240 and CPF1241 Messages Contain Summary Performance Information
i Can… Find All my Performance Collections in One Place
Lesser-Known Features of Work With System Activity
Customizing a Perspective in PDI
New Systems Director Navigator Service Packs Bring New Enhancements to 6..1
IBM Navigator for i - Work Management Integration with Performance Tasks
i Can ... Collect More Performance Data in 7.1
i Can ... Measure Disk Response Times
i Can ... Understand Scaled CPU Time
i Can ... Use POWER7 Features with IBM i 6.1.1
i Can ... Analyze Command Performance
i Can ... Tell You Why You're Waiting
i Can ... Display CPU Utilization for all Partitions
i Can ... Investigate Performance Data
i Can
For a simple list of all blogs on one page -“i Can” Blog of Blogs

3/6/2015
71
http://www-03.ibm.com/systems/power/software/i/management/performance/index.htmlPerformance Management on IBM i Web Site
141© 2015 International Business Machines Corporation
What Happened to the PCRM?
• Performance Capabilities Reference Manual – “PCRM”
• Was THE reference manual for all things related to IBM iperformance considerations
– Content was carried forward but not always updated
• Beginning in 2014, the PCRM only covers CPW information– Updates for new hardware models and CPW ratings
– Older versions are still available for download
• Use other sources for IBM i performance information:– The IBM i Performance FAQ
– Papers under the resources section on the Performance Management site
– Knowledge Center
d l W k
© 2015 International Business Machines Corporation 142

3/6/2015
72
http://www.ibm.com/systems/i/advantages/perfmgmt/resource.html
See Performance Management Resource Library at …
Refer to these
© 2015 International Business Machines Corporation 143
A Redbooks publication!
144
http://www.redbooks.ibm.com/redbooks/pdfs/sg247808.pdf
© 2015 International Business Machines Corporation

3/6/2015
73
IBM i 7.1 Technical Overview with Technology RefreshUpdates
Covers the 7.1 content through Technology Refresh 7
Chapter 6 – Performance Tools
Chapter 17, Section 6 –Performance in Navigator for i
145© 2015 International Business Machines Corporation
IBM i 7.2 Technical Overview with Technology Refresh Updates
© 2015 International Business Machines Corporation 146
Covers the 7.2 content through Technology Refresh 1
Section 2.8 – Performance
Section 8.6.7 – Job level SQL stats in Collection Services

3/6/2015
74
Redbooks and Redpapers on IBM i Performance Tools
IBM i 7.1 Technical Overview with Technology Refresh Updates
IBM i 7.2 Technical Overview with Technology Refresh Updates
Application and Program Performance Analysis Using PEX Statistics
Best Practices for Managing IBM i Jobs and Output (and a few other special tips)
i5/OS Diagnostic Tools for System Administrators: An A to Z Reference for Problem Determination
The following redbooks are a bit dated but still have some useful information.
IBM Systems Director Navigator for IBM i (Chapter 9)
IBM eServer iSeries Performance Management Tools
A Systems Management Guide to Performance Management for System i and System p servers
Sizing IBM i5/OS Work on IBM System i5 Partitions
Managing OS/400 with Operations Navigator V5R1 Volume 5: Performance Management
IBM iDoctor iSeries Job Watcher: Advanced Performance Tool
IBM eServer iSeries Systems Management Handbook
147© 2015 International Business Machines Corporation
Articles• IBM Systems Magazine, IBM i – “Power Systems Monitoring With PowerVP“, January 2014
• IBM Systems Magazine, IBM i – “Customizing a Perspective in Performance Data Investigator”, August 2011
• IBM Systems Magazine, IBM i – “Investigating the Investigator”, May 2010
• IBM Systems Magazine, IBM i - “Sky High Performance “, Aug 2009
• SystemiNetwork - “Performance Data Investigator Consolidates Functions in One Place”, June 2009
• SystemiNetwork - “IBM Systems Director Navigator for i: Performance Tasks Overview”, June 2009
• IBM Systems Magazine, IBM i – “A Command Performance”, Nov 2008
• IBM Systems Magazine, IBM i - “Introducing IBM Systems Director Navigator for i5/OS”, Aug 2008
• IBM Systems Magazine, IBM i – “A Collective Effort”, Nov 2006
• IBM Systems Magazine, IBM i - “Mission: Performance Management”, Nov 2006
© 2015 International Business Machines Corporation 148

3/6/2015
75
Articles on Job Watcher
“Web Power”
http://www.ibmsystemsmag.com/i5/november08/administrator/22431p1.aspx
Introduction to Job Watcher Green Screen Commands
http://www.ibmsystemsmag.com/i5/november08/tipstechniques/22521p1.aspx
Top 10 Hidden iDoctor Gems
http://www.ibmsystemsmag.com/ibmi/enewsletterexclusive/23868p1.aspx
Using iDoctor for iSeries Job Watcher to Determine Why Jobs Wait
http://www.ibmsystemsmag.com/ibmi/october05/technicalcorner/8896p1.aspx
149© 2015 International Business Machines Corporation
Articles on Disk Performance
150
A New Way to Look at Disk Performance http://www.ibmsystemsmag.com/ibmi/administrator/performance/A-New-Way-to-Look-at-Disk-Performance/
• Analyzing Disk Watcher Datahttp://www.ibmsystemsmag.com/ibmi/tipstechniques/systemsmanagement/Analyzing-Disk-Watcher-Data/
• Using Wait State Accounting to Determine Disk Performancehttp://iprodeveloper.com/systems-management/using-wait-state-accounting-determine-disk-performance
• Understanding Disk Performance, Part 2: Disk Operation on i5/OShttp://iprodeveloper.com/systems-management/understanding-disk-performance-part-2-disk-operation-i5os
• Understanding Disk Performance Metricshttp://iprodeveloper.com/systems-management/understanding-disk-performance-metrics
• Planning for Solid State Driveshttp://ibmsystemsmag.blogs.com/i_can/2012/01/planning-for-solid-state-drives.html
Moving Data to Solid State Driveshttp://ibmsystemsmag.blogs.com/i_can/2013/03/moving-data-to-solid-state-drives.htmlhttp://www.ibmsystemsmag.com/ibmi/storage/disk/data_ssd/
Customer use of SSDshttp://www-912.ibm.com/s_dir/slkbase.NSF/DocNumber/592252201
A Look at System i Integrated DASD Configuration and Performance under i5/OS• Redpaper REDP-3919-00
http://www.redbooks.ibm.com/abstracts/redp3919.html© 2015 International Business Machines Corporation

3/6/2015
76
Systems Management References
151
• Navigator for i on developerWorkshttps://www.ibm.com/developerworks/mydeveloperworks/wikis/home?lang=en#/wiki/IBM%20i%20Technology%20Updates/page/IBM%20Navigator%20for%20i
• IBM Application Runtime Experthttp://www-03.ibm.com/systems/power/software/i/are/index.htmlhttp://www.ibm.com/developerworks/ibmi/library/i-applicationruntime/index.html
• Uncovering Application Runtime Expert – IBM i 7.1http://www.redbooks.ibm.com/abstracts/redp4805.html?Open
• Web Performance Advisorhttp://www.ibmsystemsmag.com/ibmi/administrator/performance/Web-Performance-Advisor-Helps-Solve-Mysteries/
• IBM Systems Directorhttp://www-03.ibm.com/systems/software/director/http://pic.dhe.ibm.com/infocenter/director/pubs/index.jsp
• IBM Tivoli Monitoringhttp://www-01.ibm.com/support/knowledgecenter/SSTFXA_6.3.0.2/com.ibm.itm.doc_6.3fp2/welcome.htm?lang=en
• IBM Tivoli Monitoring Agent for IBM iIBM Tivoli Monitoring IBM i OS Agent Reference Version 6.3 Fix Pack 2.pdf© 2015 International Business Machines Corporation
IBM Systems Lab Services
Leverage the skills and expertise of IBM's technical consultants to implement projects that achieve faster business value
152
How to contact us
email us at [email protected]
Follow us at @IBMSLST
Learn more ibm.com/systems/services/labservices
Ensure a smooth upgrade
Improve your availability
Design for efficient virtualization
Reduce management complexity
Assess your system security
Optimize database performance
Modernize applications for iPad
Deliver customized workshops
Leverage training & events
© 2015 International Business Machines Corporation

3/6/2015
77
IBM i Performance and Optimization Services
153153
www.ibm.com/systems/services/labservices
The IBM i Performance and Optimization team specializes in resolving a wide variety of performance problems. Our team of experts can help you tune your partition and applications, including:
Reducing batch processing times
Resolving SQL query and native IO performance problems
Tuning RPG, COBOL, C, and Java (including WebSphere Application Server) programs
Removing bottlenecks, resolving intermittent issues
Resolving memory leaks, temporary storage growth problems, etc.
Tuning memory pools, disk subsystems, system values, and LPAR settings for best performance
Optimizing Solid State Drive (SSD) performance
Tuning client interfaces such as ODBC, JDBC, .Net and more
Skills transfer and training for performance tools and analysis also available!
Contact Eric Barsness at [email protected] for more details.
© 2015 International Business Machines Corporation
154
IBM i Performance Analysis Workshop
Managing and analyzing the data can be quite complex. During this workshop, the IBM Systems Lab Services IBM i team will share useful techniques for analyzing performance data on key IBM i resources, and will cover strategies for solving performance problems. It will aid in building a future foundation of performance methodology you can apply in your environment.
Overview:–Topics covered include:
Key performance analysis concepts Performance tools Performance data collectors (Job Watcher, Disk Watcher, etc.) Wait accounting
–Core methodology and analysis of: Locks Memory I/O subsystem CPU
–Concept reinforcement through case studies and lab exercises–May include discussions on theory, problem solving, prevention and best practices
Workshop details:– Intermediate IBM i skill level
– 3 day workshop, public or private (on-site)
For public workshop availability and enrollment:http://www-03.ibm.com/systems/power/software/i/support/workshops/performance-analysis.html
For additional information regarding private workshops, please contact Mike Gordon, STG Lab Services, at [email protected]
Learn the science and art of performance analysis, methodology and problem solving
IBM Systems Lab Services - ibm.com/systems/services/labservices - [email protected]© 2015 International Business Machines Corporation

3/6/2015
78
Performance and Scalability Services
155
The IBM i Performance and Scalability Services Center can provide facilities and hardware IN ROCHESTER to assist you in testing hardware or software changes
“Traditional” benchmarks Release-to-release upgrades Assess and tune application and database performance Stress test your system Determine impact of application changes Proofs of Concept (e.g. HA alternatives; SSD analysis, external storage, etc.) Evaluate application scalability Capacity planning
… all with the availability of Lab Services IBM i experts and development personnel
To request any of these services, submit at: http://www-03.ibm.com/systems/services/labservices/psscontact.html
© 2015 International Business Machines Corporation
IBM i Solid State Drive Performance ServicesEvaluate the benefits of SSD technologies with IBM i based applications
156
Features Three options to best meet client needs:
1. Data collection on the client system with analytical services to determine the benefit SSDs will provide. The analysis also identifies which specific objects should be stored on SSDs to optimize benefits.
2. Remote access to a fixed Power IBM i configuration to load and test client workloads on both SSDs and traditional disk drives (HDDs). Assessment is made of the delta between workload performance on SSDs and HDDs.
3. Hardware configured to client specifications with client workloads run on a system in the Performance and Scalability Services Center in Rochester, MN. Client has onsite access to state of the art test center. Optimal SSD configuration for current and future workload requirements is determined from analysis of workload runs.
Typical Benefits “Real data” available to assess if SSDs are for you.
Multiple offerings provide flexibility in the scope and depth of the analysis you choose to perform.
With the assistance of our Lab Services experts, clients will learn how to optimize the use of SSDs to meet their processing and business requirements.
Contact To initiate these services, submit a request form at url:
http://www.ibm.com/systems/services/labservices/psscontact.html
www.ibm.com/systems/services/labservices - [email protected]
Why IBM® Rochester?
Deep skills in IBM i implementation and integration
Experience in system, database, and application performance gleaned from hundreds of engagements with clients across most industries
Ability to deliver skills transfer as part of your service engagement
IBM, the IBM logo, and ibm.com are trademarks of IBM Corp., registered in many jurisdictions worldwide. Other product and service names might be trademarks
of IBM or other companies. A current list of IBM trademarks is available on the Web at “Copyright and trademark information” at www.ibm.com/legal/copytrade.shtml.
© 2015 International Business Machines Corporation
3/6/2015
79
Special notices
157
This document was developed for IBM offerings in the United States as of the date of publication. IBM may not make these offerings available in other countries, and the information is subject to change without notice. Consult your local IBM business contact for information on the IBM offerings available in your area.
Information in this document concerning non-IBM products was obtained from the suppliers of these products or other public sources. Questions on the capabilities of non-IBM products should be addressed to the suppliers of those products.
IBM may have patents or pending patent applications covering subject matter in this document. The furnishing of this document does not give you any license to these patents. Send license inquires, in writing, to IBM Director of Licensing, IBM Corporation, New Castle Drive, Armonk, NY 10504-1785 USA.
All statements regarding IBM future direction and intent are subject to change or withdrawal without notice, and represent goals and objectives only.
The information contained in this document has not been submitted to any formal IBM test and is provided "AS IS" with no warranties or guarantees either expressed or implied.
All examples cited or described in this document are presented as illustrations of the manner in which some IBM products can be used and the results that may be achieved. Actual environmental costs and performance characteristics will vary depending on individual client configurations and conditions.
IBM Global Financing offerings are provided through IBM Credit Corporation in the United States and other IBM subsidiaries and divisions worldwide to qualified commercial and government clients. Rates are based on a client's credit rating, financing terms, offering type, equipment type and options, and may vary by country. Other restrictions may apply. Rates and offerings are subject to change, extension or withdrawal without notice.
IBM is not responsible for printing errors in this document that result in pricing or information inaccuracies.
All prices shown are IBM's United States suggested list prices and are subject to change without notice; reseller prices may vary.
IBM hardware products are manufactured from new parts, or new and serviceable used parts. Regardless, our warranty terms apply.
Any performance data contained in this document was determined in a controlled environment. Actual results may vary significantly and are dependent on many factors including system hardware configuration and software design and configuration. Some measurements quoted in this document may have been made on development-level systems. There is no guarantee these measurements will be the same on generally-available systems. Some measurements quoted in this document may have been estimated through extrapolation. Users of this document should verify the applicable data for their specific environment.
Revised September 26, 2006
© 2015 International Business Machines Corporation
Special notices (cont.)
158
IBM, the IBM logo, ibm.com AIX, AIX (logo), AIX 6 (logo), AS/400, Active Memory, BladeCenter, Blue Gene, CacheFlow, ClusterProven, DB2, ESCON, i5/OS, i5/OS (logo), IBM Business Partner (logo), IntelliStation, LoadLeveler, Lotus, Lotus Notes, Notes, Operating System/400, OS/400, PartnerLink, PartnerWorld, PowerPC, pSeries, Rational, RISC System/6000, RS/6000, THINK, Tivoli, Tivoli (logo), Tivoli Management Environment, WebSphere, xSeries, z/OS, zSeries, AIX 5L, Chiphopper, Chipkill, Cloudscape, DB2 Universal Database, DS4000, DS6000, DS8000, EnergyScale, Enterprise Workload Manager, General Purpose File System, , GPFS, HACMP, HACMP/6000, HASM, IBM Systems Director Active Energy Manager, iSeries, Micro-Partitioning, POWER, PowerExecutive, PowerVM, PowerVM (logo), PowerHA, Power Architecture, Power Everywhere, Power Family, POWER Hypervisor, Power Systems, Power Systems (logo), Power Systems Software, Power Systems Software (logo), POWER2, POWER3, POWER4, POWER4+, POWER5, POWER5+, POWER6, POWER7, pureScale, System i, System p, System p5, System Storage, System z, Tivoli Enterprise, TME 10, TurboCore, Workload Partitions Manager and X-Architecture are trademarks or registered trademarks of International Business Machines Corporation in the United States, other countries, or both. If these and other IBM trademarked terms are marked on their first occurrence in this information with a trademark symbol (® or ™), these symbols indicate U.S. registered or common law trademarks owned by IBM at the time this information was published. Such trademarks may also be registered or common law trademarks in other countries. A current list of IBM trademarks is available on the Web at "Copyright and trademark information" at www.ibm.com/legal/copytrade.shtml
The Power Architecture and Power.org wordmarks and the Power and Power.org logos and related marks are trademarks and service marks licensed by Power.org.UNIX is a registered trademark of The Open Group in the United States, other countries or both. Linux is a registered trademark of Linus Torvalds in the United States, other countries or both.Microsoft, Windows and the Windows logo are registered trademarks of Microsoft Corporation in the United States, other countries or both.Intel, Itanium, Pentium are registered trademarks and Xeon is a trademark of Intel Corporation or its subsidiaries in the United States, other countries or both.AMD Opteron is a trademark of Advanced Micro Devices, Inc.Java and all Java-based trademarks and logos are trademarks of Sun Microsystems, Inc. in the United States, other countries or both. TPC-C and TPC-H are trademarks of the Transaction Performance Processing Council (TPPC).SPECint, SPECfp, SPECjbb, SPECweb, SPECjAppServer, SPEC OMP, SPECviewperf, SPECapc, SPEChpc, SPECjvm, SPECmail, SPECimap and SPECsfs are trademarks of the Standard Performance Evaluation Corp (SPEC).NetBench is a registered trademark of Ziff Davis Media in the United States, other countries or both.AltiVec is a trademark of Freescale Semiconductor, Inc.Cell Broadband Engine is a trademark of Sony Computer Entertainment Inc.InfiniBand, InfiniBand Trade Association and the InfiniBand design marks are trademarks and/or service marks of the InfiniBand Trade Association. Other company, product and service names may be trademarks or service marks of others.
Revised February 9, 2010
© 2015 International Business Machines Corporation