ibo-sample questions theory test - wordpress.com · ibo sample questions 1 ibo sample questions...
TRANSCRIPT

IBO sample questions 1
IBO sample questions theory test I Cell Biology (20%)
1 (IBO 2001 – B4)
Match each item in column A with one in column B to which it is most closely associated.
Column A Column B
A. leucoplasts 1. Krebs cycle
B. rough ER 2. bacterial DNA anchorage
C. genome 3. microtubule-organizing center
D. mitochondria 4. protein modification and targeting
E. centriole 5. complete set of genetic instructions
F. mesosome 6. starch storage
G. lysosome 7. immunoglobulin
H. microfilament 8. lipid synthesis
I. smooth ER 9. digestive enzymes
J. Golgi apparatus 10. cytoskeleton
2 (IBO 2001 – B6
The diagram represents a function of the nucleic acid, DNA. Based on the diagram, what is the most likely nucleotide sequence of the messenger RNA. Put an X in the appropriate box.
IBO sample questions 2
3 (IBO 2002 – B2)
For an exponentially growing culture of micro organisms the specific growth rate (µ) is a
parameter, that gives the cell biomass (g) synthesized per gram of existing cell biomass per
unit of time (usually, per hour). This rate (µµµµ) is inversely related to the doubling time of the
culture, td: µµµµ = ln2/td ≈≈≈≈ 0.7/td. Hence, the shorter the doubling time of cells, the higher is the
specific growth rate of the culture.
Two micro organisms, A and B, were inoculated each in a fresh growth medium with an initial
optical density (OD) of 0.1. A lag phase of 1 hr duration was observed for both cultures.
Three hours after inoculation, the OD of culture A was 0.4, while that of the culture B was
1.6.
1. Estimate the specific growth rate for culture A
2. Estimate the specific growth rate for culture B
4 (IBO 2002 – B3)
Calculate the intracellular millimolar (mM) concentration of potassium in Escherichia coli, if
the measured potassium content is 7.8 micrograms per milligram of dry cell mass. Assume
all potassium ions are free in the cytosol (not bound to macromolecules), and that the
intracellular volume is 2 microlitres per milligram of dry cell mass. The atomic weight of
potassium is 39 Daltons.
5 (IBO 2002 – B4)
A species of fungus can dissimilate glucose and produce ATP in two ways.
Aerobically: C6H12O6 + 6O2 → 6 CO2 + 6 H2O,
Anaerobically: C6H12O6 → 2 C2H5OH + 2 CO2
This fungus is cultivated in a glucose-containing medium. Half of the total ATP production is
anaerobic.
1. What is the ratio between the rates of aerobic and anaerobic catabolism of
glucose?
2. What is the expected oxygen consumption (moles per mole of consumed glucose)?
3. What is the expected CO2 evolution (moles per mole of consumed glucose)?
For calculations, assume that glucose is fermented via the usual Embden-Meyerhof-Parnas
glycolytic pathway, and that oxidative phosphorylation proceeds with maximum efficiency.
6 (IBO2002 – B7)
The growth of bacteria is studied. For a period of exactly one duplication, the sample is
moved from an environment with a light nitrogen isotope (14N) to an environment with heavy
nitrogen isotope (15N). After this the sample is again transferred to the environment with light
nitrogen for a period of two duplications.
1. What is the composition of double-stranded DNA (in %) of light and heavy
nitrogen isotopes after the experiment?
A. Only light B. In between C. Only heavy
IBO sample questions 3
From these cells two types of mRNA {mRNA (A) and mRNA (B), respectively, expressed
from two different genes} were isolated. Both mRNAs were found to contain an identical
number of nucleotides. The nucleotide composition of each mRNA was estimated as (see
the table).
mRNA A % C % G % T % U %
A 17 28 32 0 23
B 27 13 27 0 33
2. What is the nucleotide composition of double-stranded genomic DNA in the
coding part of the genes A and B, respectively.
dsDNA A % C % G % T % U %
A
B
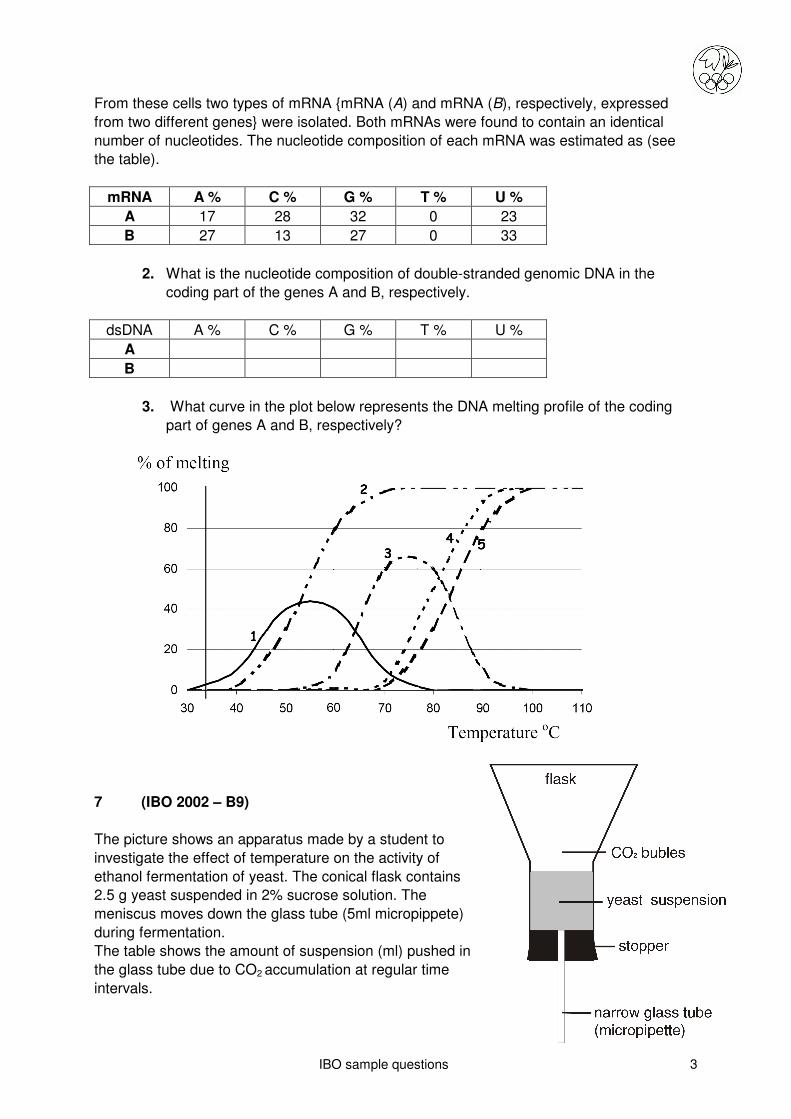
3. What curve in the plot below represents the DNA melting profile of the coding
part of genes A and B, respectively?
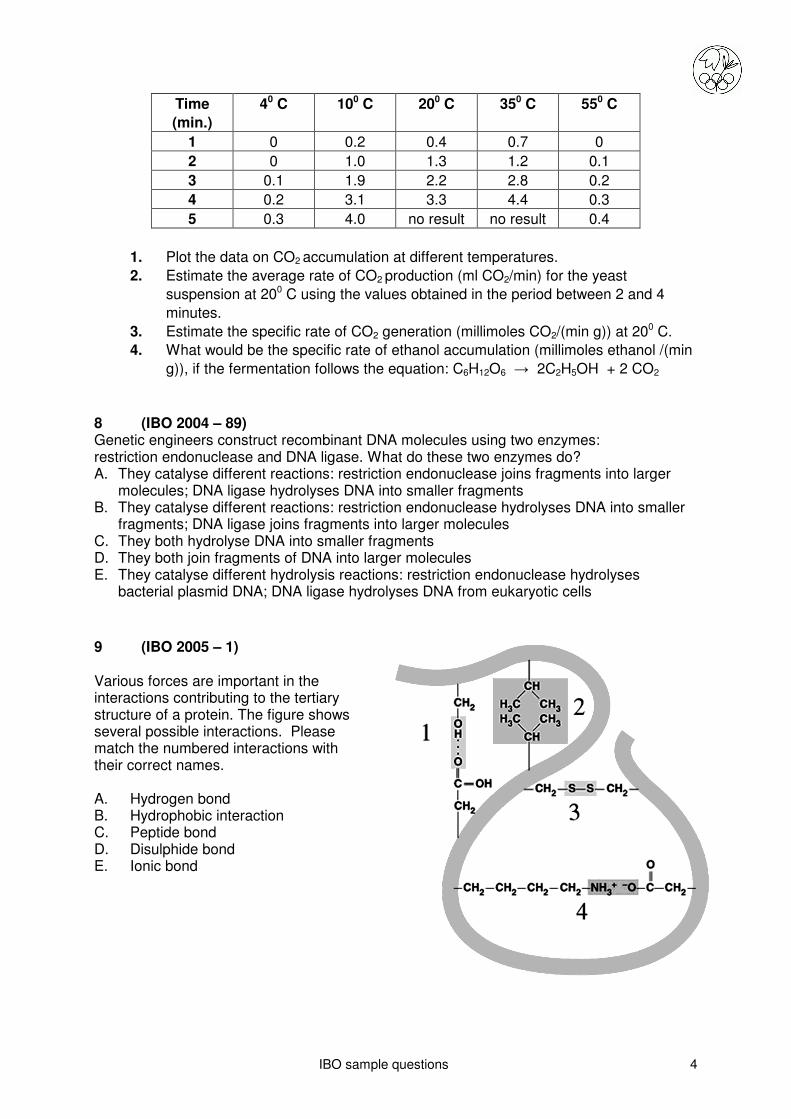
7 (IBO 2002 – B9)
The picture shows an apparatus made by a student to
investigate the effect of temperature on the activity of
ethanol fermentation of yeast. The conical flask contains
2.5 g yeast suspended in 2% sucrose solution. The
meniscus moves down the glass tube (5ml micropippete)
during fermentation.
The table shows the amount of suspension (ml) pushed in
the glass tube due to CO2 accumulation at regular time
intervals.
IBO sample questions 4
Time
(min.)
40 C 100 C 200 C 350 C 550 C
1 0 0.2 0.4 0.7 0
2 0 1.0 1.3 1.2 0.1
3 0.1 1.9 2.2 2.8 0.2
4 0.2 3.1 3.3 4.4 0.3
5 0.3 4.0 no result no result 0.4
1. Plot the data on CO2 accumulation at different temperatures.
2. Estimate the average rate of CO2 production (ml CO2/min) for the yeast
suspension at 200 C using the values obtained in the period between 2 and 4
minutes.
3. Estimate the specific rate of CO2 generation (millimoles CO2/(min g)) at 200 C.
4. What would be the specific rate of ethanol accumulation (millimoles ethanol /(min
g)), if the fermentation follows the equation: C6H12O6 → 2C2H5OH + 2 CO2
8 (IBO 2004 – 89) Genetic engineers construct recombinant DNA molecules using two enzymes: restriction endonuclease and DNA ligase. What do these two enzymes do? A. They catalyse different reactions: restriction endonuclease joins fragments into larger
molecules; DNA ligase hydrolyses DNA into smaller fragments B. They catalyse different reactions: restriction endonuclease hydrolyses DNA into smaller
fragments; DNA ligase joins fragments into larger molecules C. They both hydrolyse DNA into smaller fragments D. They both join fragments of DNA into larger molecules E. They catalyse different hydrolysis reactions: restriction endonuclease hydrolyses
bacterial plasmid DNA; DNA ligase hydrolyses DNA from eukaryotic cells
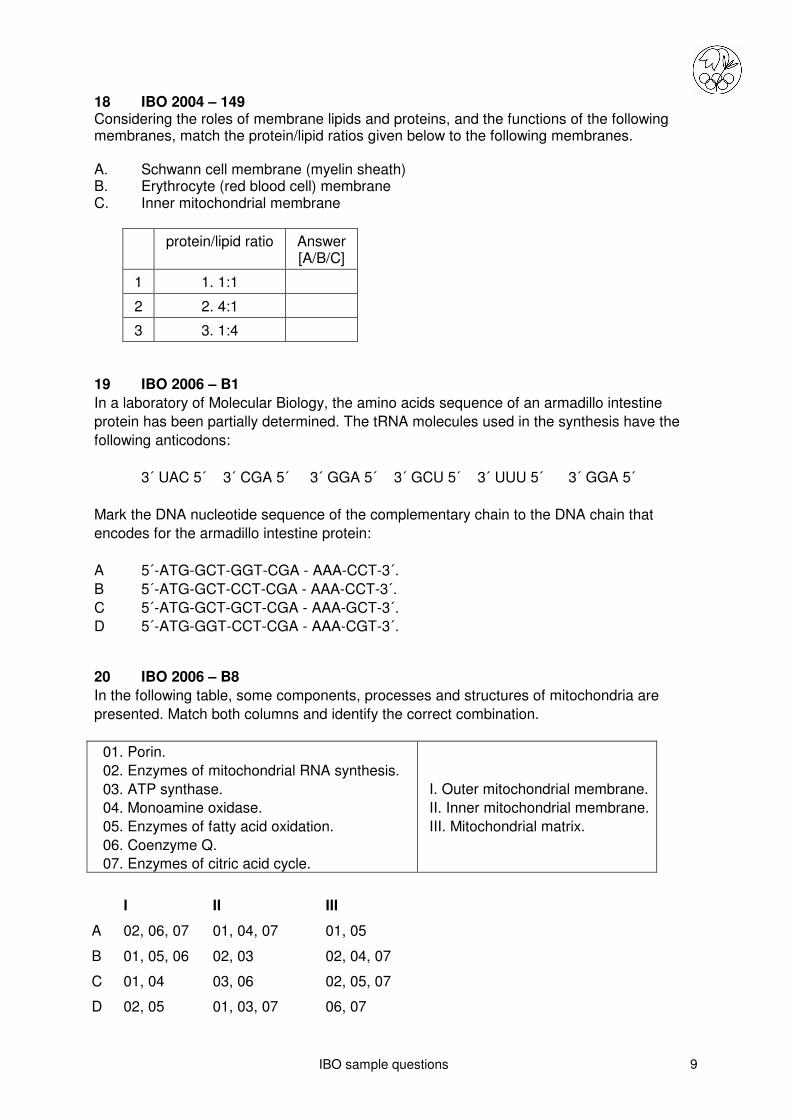
9 (IBO 2005 – 1)
Various forces are important in the interactions contributing to the tertiary structure of a protein. The figure shows several possible interactions. Please match the numbered interactions with their correct names.
A. Hydrogen bond B. Hydrophobic interaction C. Peptide bond D. Disulphide bond E. Ionic bond

IBO sample questions 5
10 IBO 2004 – 85)
Treatment with antibiotic drugs helps overcome many bacterial infections. Why is penicillin toxic to many bacteria? A. It interferes with DNA replication B. It inhibits transcription C. It disrupts translation D. It blocks protein synthesis E. It inhibits cell wall formation
11 (IBO 2007 – A9) A yeast extract contains all the enzymes required for alcohol production. The extract is incubated under anaerobic conditions in 1 liter of medium containing: 200 mM glucose, 20 mM ADP, 40 mM ATP, 2 mM NADH, 2 mM NAD+ and 20 mM Pi (inorganic phosphates). Ethanol production can be summarized by the following equation: C6H12O6 2 C2H5OH + 2 CO2 + 2ATP What is the maximum amount of ethanol that can be produced under these conditions?
A. 2 mM B. 20 mM C. 40 mM D. 200 mM E. 400 mM
12 (IBO 2004 – 99) The following graph presents the pressure (systolic and diastolic) of a volume of blood moving through the circulation system via different blood vessels labelled A-E. Which vessels match the letters A-E?

IBO sample questions 6
Vessel Letter
1. Venules
2. Capillaries
3. Arterioles
4. Veins
5. Arteries
13 (IBO 2007 – A32) For blood under each of the conditions described below, select the letter of the oxy-hemoglobin dissociation curve with which it is most likely to be associated.
1. Normal adult arterial blood
2. Anaemic blood
3 Foetal blood
4. Blood from a person with hypothermia
5. Blood with PaCO2 above normal
6. Blood with an increased pH

IBO sample questions 7
14 IBO 2004 – 110 The diagram represents an eukaryotic cell cycle divided into 5 phases. Match phases A-E of the diagram with the cell cycle stages shown in the Table and match the processes F-J with the appropriate cell cycle stage shown in the Table.
F. Cytokinesis
G. Main growth period of the cell
H. Duplication of DNA
I. Quiescent cells
J. Last stage of interphase
15 IBO 2004 - 108 The amount of DNA in a cell can be determined by measuring the fluorescence of a dye that binds in direct proportion to the amount of DNA. The histogram below represents the fluorescence of a eukaryotic germ cell during different stages of cell division (I, II, III, IV and V).
Cell cycle stage Phase
[A,B,C,D,E]
Function
[F,G,H,I,J]
1 G2
2 M
3 G1
4 S
5 Go

IBO sample questions 8
Which of the following sequences represents the correct match of stages I-V with the division stages numbered 1-5? 1. Anaphase I of meiosis 2. Anaphase II of meiosis 3. Cytokinesis following Telophase II 4. Prophase II of meiosis 5. Prophase I of meiosis
1 2 3 4 5
A II IV V III I
B I II III IV V
C V IV III II I
D I II IV III V
E IV I II III V
16 IBO 2004 – 116 The diagram shows a single-celled green microalga from the ocean. Its single chloroplast and several other cellular components are labelled. Which components contain the following:
Answer [A/B/C/D/E/F]
1. orange and yellow carotenoids that harvest light energy for photosynthesis
2. starch
3. macromolecular polymers that prevent the cell from bursting if it is placed in fresh water
4 mitochondria
17 IBO 2004 - 137 A widely-held theory is that mitochondria evolved from endosymbiotic bacteria. Indicate which statements support this theory by answering Yes (Y) or No (N).
Y / N
1. Mitochondria have their own DNA
2. Mitochondria have their own ribosomes
3. Mitochondria are derived from pre-existing mitochondria by division
4. Human mitochondrial genes lack introns
5. Some mitochondrial gene DNA sequences are similar to those of certain aerobic bacteria
IBO sample questions 9
18 IBO 2004 – 149 Considering the roles of membrane lipids and proteins, and the functions of the following membranes, match the protein/lipid ratios given below to the following membranes. A. Schwann cell membrane (myelin sheath) B. Erythrocyte (red blood cell) membrane C. Inner mitochondrial membrane
protein/lipid ratio Answer [A/B/C]
1 1. 1:1
2 2. 4:1
3 3. 1:4
19 IBO 2006 – B1
In a laboratory of Molecular Biology, the amino acids sequence of an armadillo intestine
protein has been partially determined. The tRNA molecules used in the synthesis have the
following anticodons:
3´ UAC 5´ 3´ CGA 5´ 3´ GGA 5´ 3´ GCU 5´ 3´ UUU 5´ 3´ GGA 5´
Mark the DNA nucleotide sequence of the complementary chain to the DNA chain that
encodes for the armadillo intestine protein:
A 5´-ATG-GCT-GGT-CGA - AAA-CCT-3´.
B 5´-ATG-GCT-CCT-CGA - AAA-CCT-3´.
C 5´-ATG-GCT-GCT-CGA - AAA-GCT-3´.
D 5´-ATG-GGT-CCT-CGA - AAA-CGT-3´. 20 IBO 2006 – B8
In the following table, some components, processes and structures of mitochondria are
presented. Match both columns and identify the correct combination.
01. Porin.
02. Enzymes of mitochondrial RNA synthesis.
03. ATP synthase.
04. Monoamine oxidase.
05. Enzymes of fatty acid oxidation.
06. Coenzyme Q.
07. Enzymes of citric acid cycle.
I. Outer mitochondrial membrane.
II. Inner mitochondrial membrane.
III. Mitochondrial matrix.
I II III
A 02, 06, 07 01, 04, 07 01, 05
B 01, 05, 06 02, 03 02, 04, 07
C 01, 04 03, 06 02, 05, 07
D 02, 05 01, 03, 07 06, 07

IBO sample questions 10
II Plant Anatomy and Physiology (15%)
21 (IBO 2002 – B14) The diurnal curve indicates the stomatal opening for a typical C3 plant. Stomatal conductance is an indication of the capacity for diffusion through stomata and an indirect measurement of stomatal opening. A stomatal conductance of zero indicates that stomata are closed (i.e., there is no transpiration). 1 Indicate the times of day in the diagram and mark
them using the codes: 1. Midnight 2. Noon 3. 6:00 a.m. 4. 6:00 p.m
A
B
C
D
Stomatal opening vs. closure is regulated through several internal and external factors. 2. Indicate which of the following corresponds to the factors depicted in the picture. Use the given code: 1. CO2 2. Light 3. Ca2+ 4. Abscisic acid 5. K+ 6. H2O
A and B
C
D
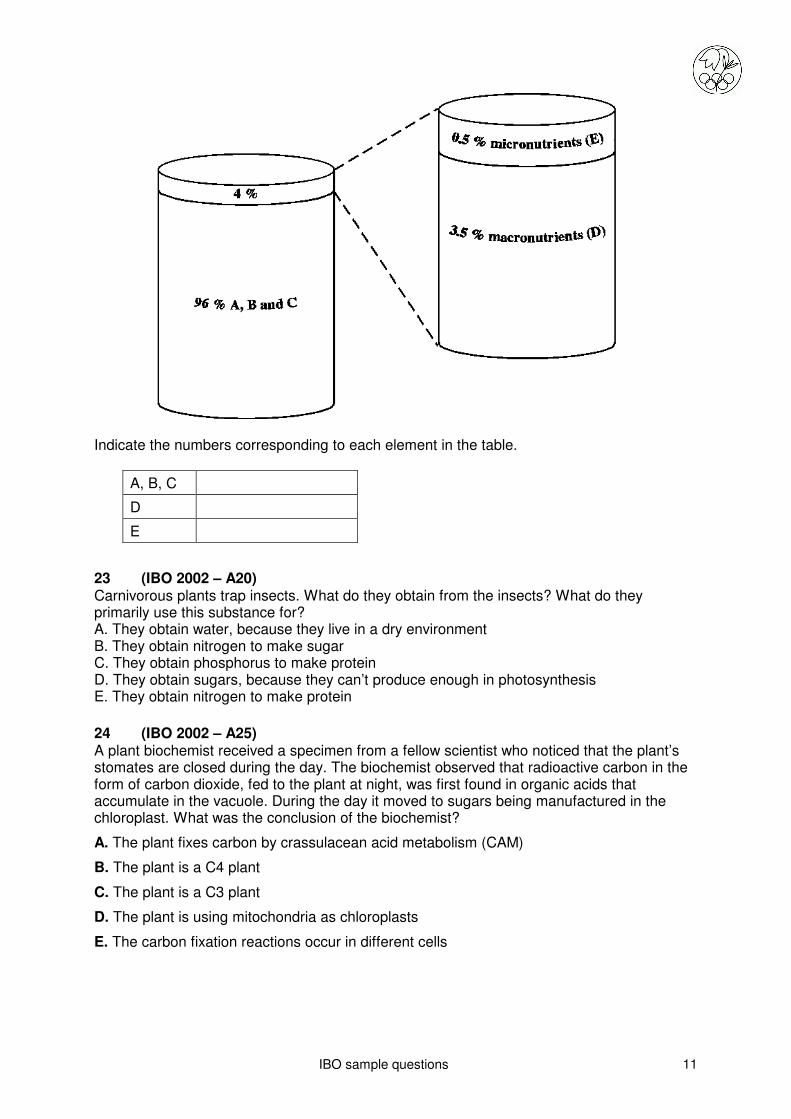
22 (IBO 2002 – B15) Plants require 16 essential elements: boron (1) calcium (2) carbon (3) chlorine (4)
copper (5) hydrogen (6) iron (7) magnesium (8)
manganese (9) molybdenum (10) nitrogen (11) oxygen (12)
phosphorus (13) potassium (14) sulfur (15) zinc (16).
The proportional masses of various elements in plants are shown.
IBO sample questions 11
Indicate the numbers corresponding to each element in the table.
A, B, C
D
E
23 (IBO 2002 – A20) Carnivorous plants trap insects. What do they obtain from the insects? What do they primarily use this substance for? A. They obtain water, because they live in a dry environment B. They obtain nitrogen to make sugar C. They obtain phosphorus to make protein D. They obtain sugars, because they can’t produce enough in photosynthesis E. They obtain nitrogen to make protein
24 (IBO 2002 – A25) A plant biochemist received a specimen from a fellow scientist who noticed that the plant’s stomates are closed during the day. The biochemist observed that radioactive carbon in the form of carbon dioxide, fed to the plant at night, was first found in organic acids that accumulate in the vacuole. During the day it moved to sugars being manufactured in the chloroplast. What was the conclusion of the biochemist?
A. The plant fixes carbon by crassulacean acid metabolism (CAM)
B. The plant is a C4 plant
C. The plant is a C3 plant
D. The plant is using mitochondria as chloroplasts
E. The carbon fixation reactions occur in different cells

IBO sample questions 12
25 (IBO 2003 – A16) A transverse microscopic section of a spruce needle leaf is shown in the diagram below. Which roman numerals indicates the upper surface of the leaf?
A. I and II. B. II and IV. C. I and III. D. III and IV. E. II and III.
26 (IBO 2003 – A22) Photosynthesis in plants is dependent on temperature (T) and light intensity(L). The following graphs show the results of measurements of CO2 consumption for three plants of the same species under different light intensities. Which combination of statements concerning limiting factors in the temperature ranges (I) –5 °C to 0°C and (II) +20 °C to + 30°C is correct under the light intensity used?
Phloem
Xylem
I II
III IV

IBO sample questions 13
Temperature range from
– 5 to 0°C (I)
Temperature range from + 20 to + 30°C
(II) A. T and
L limiting factor.
T and L not limiting factor.
B. T limiting, L not limiting.
T not limiting, L limiting.
C. T limiting, L not limiting.
T limiting, L not limiting.
D. T not limiting, L limiting.
T limiting, L not limiting.
E. None of the above combinations is correct
27 (IBO 2003 – A23) The result of an experiment which uses guard cell protoplasts of Vicia faba is given below. Protoplasts were incubated in a suspension medium with isotonic osmotic pressure. After 30 min under saturating red light they were irradiated with blue light for 30 sec. During the experiment in which the protoplasts were cultured the pH of the medium was monitored.
What would be the most plausible conclusion based on the above results?
A. Blue light may help guard cells to take up protons from outside into the cell. B. Blue light may enhance the ability of guard cells to pump protons out of the cell.
C. Blue light may be a very effective wavelength of light for the respiration of the guard cells.
D. Blue light may activate all of the protoplasts to give away their energy.
E. Not only blue light but also other wavelengths of light may help guard cells to transfer protons.
IBO sample questions 14
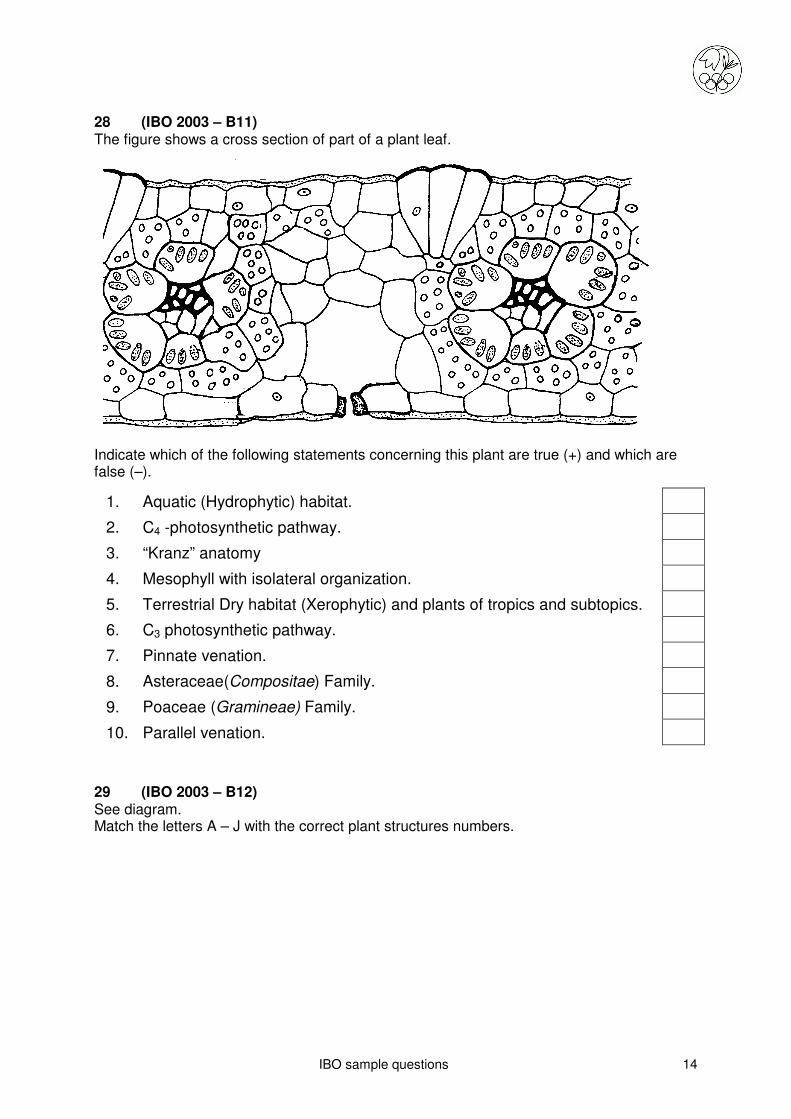
28 (IBO 2003 – B11) The figure shows a cross section of part of a plant leaf.
Indicate which of the following statements concerning this plant are true (+) and which are false (–).
1. Aquatic (Hydrophytic) habitat.
2. C4 -photosynthetic pathway.
3. “Kranz” anatomy
4. Mesophyll with isolateral organization.
5. Terrestrial Dry habitat (Xerophytic) and plants of tropics and subtopics.
6. C3 photosynthetic pathway.
7. Pinnate venation.
8. Asteraceae(Compositae) Family.
9. Poaceae (Gramineae) Family.
10. Parallel venation.
29 (IBO 2003 – B12) See diagram. Match the letters A – J with the correct plant structures numbers.

IBO sample questions 15
1. Phloem.
2. Xylem.
3. Endodermis.
4. Fascicular cambium.
5. Epidermis.
6. Parenchyma.
7. Cortex parenchyma.
8. Sclerenchyma.
9. Interfascicular cambium.
10. Collenchyma
30 (IBO 2003 – B15) Diffusion and osmosis are important for the passive transport of molecules in the cell. 01 The figure shows an experiment with a dialysis (visking) membrane filled with
sugar and starch (colorless) suspended in a beaker with diluted iodine solution (orange – brown). Use ‘+’ to indicate which colour you would expect in the beaker and in the tube after several hours of dialysis.
Solution in
the beaker. Solution in the dialysis tube.
Colorless
Orange-brown
Pink-red
Greenish-yellow
Blue-black
02. In a similar experiment, dialysis membranes are filled with solutions with different
concentrations of molecules and left in beakers with solutions with different molecule concentrations. The dialysis tubes all have the same mass at the beginning of the experiment. The size of the molecules is bigger than the pore size of the membrane. Mark with “+” the experimental settings in which the beaker contains a hypotonic solution compared to the dialysis tube, and mark with “–” the ones which do not.

IBO sample questions 16
Experiment
A B C D E
Concentration in the dialysis tube (M).
0.1 0.8 0.4 0.2 0.4
Concentration in the beaker (M).
0.8 0.1 0.2 0.4 0.4
Hypotonic solution.
03. The tubes are weighed after several hours of dialysis. Their mass is compared to that
before the dialysis. Write the letters of the experiments in the order of the final mass of the dialysis tube, beginning with the tube having the lowest mass.
31 (IBO 2005 – 109)
Algae were supplied with a radioactive isotope of Carbon, 14C, and allowed to photosynthesise. After a period of time, the light was switched off and the algae were left in the dark. The graph shows the relative amount of some radioactive labelled compounds over the period of the experiment.
Which line represents the amount of glycerate 3-phosphate (3GP), ribulose biphosphate (RuBP) and sucrose formed? (1 point) Fill out the correct letter of the line in the correct box.
Compound
(1) 3GP
(2) RuBP
(3) Sucrose

IBO sample questions 17
32 (IBO 2006 – A24)
In a laboratory, stems and roots of different plants were cut. When putting them into a box
the slides mixed. Which of the following cross sections corresponds to a primary root of
Magnoliopsida?
A) Epidermis Cortex Bicollateral bundles Pith
B) Epidermis
Cortex Pericycle 4 xylem strands alternate
with 4 phloem strands
C) Periderm Secondary Phloem Cambium Secondary Xylem
D) Epidermis Cortex Pericycle 20 xylem strands alternate
with phloem
E) Epidermis Sclerenchyma Scattered vascular
bundles
Hollow pith
33 (IBO 2006 – A27)
The following figures correspond to cross sections of leaves. Which one/s correspond/s to a hydrophytic habitat?
A) I, II and III.
B) II.
C) I, III, IV and V.
D) I, II and V.
E) I, III and IV.
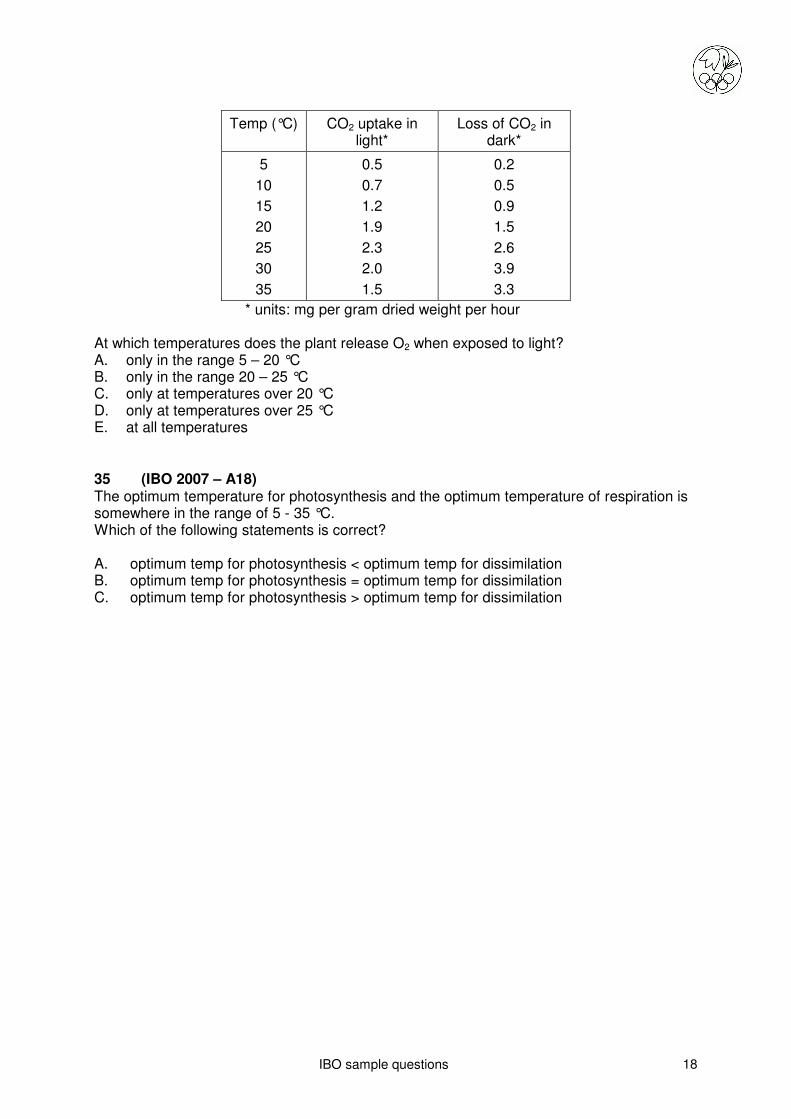
34 (IBO 2007 – A17) A student studied the influence of temperature and light intensity upon CO2 exchange of plants in a greenhouse. During the experiment cellular respiration is not influenced by light intensity and cellular respiration of glucose is completely aerobic. At each temperature CO2 uptake was measured during light exposure and loss of CO2 was measured during the dark period. The light intensity was constant during the light period and was not a limiting factor for photosynthesis. The data collected are presented in the following table.
IBO sample questions 18
Temp (°C) CO2 uptake in light*
Loss of CO2 in dark*
5
10
15
20
25
30
35
0.5
0.7
1.2
1.9
2.3
2.0
1.5
0.2
0.5
0.9
1.5
2.6
3.9
3.3
* units: mg per gram dried weight per hour
At which temperatures does the plant release O2 when exposed to light? A. only in the range 5 – 20 °C B. only in the range 20 – 25 °C C. only at temperatures over 20 °C D. only at temperatures over 25 °C E. at all temperatures
35 (IBO 2007 – A18) The optimum temperature for photosynthesis and the optimum temperature of respiration is somewhere in the range of 5 - 35 °C. Which of the following statements is correct? A. optimum temp for photosynthesis < optimum temp for dissimilation B. optimum temp for photosynthesis = optimum temp for dissimilation C. optimum temp for photosynthesis > optimum temp for dissimilation
IBO sample questions 19
III Animal Anatomy and Physiology (25%)
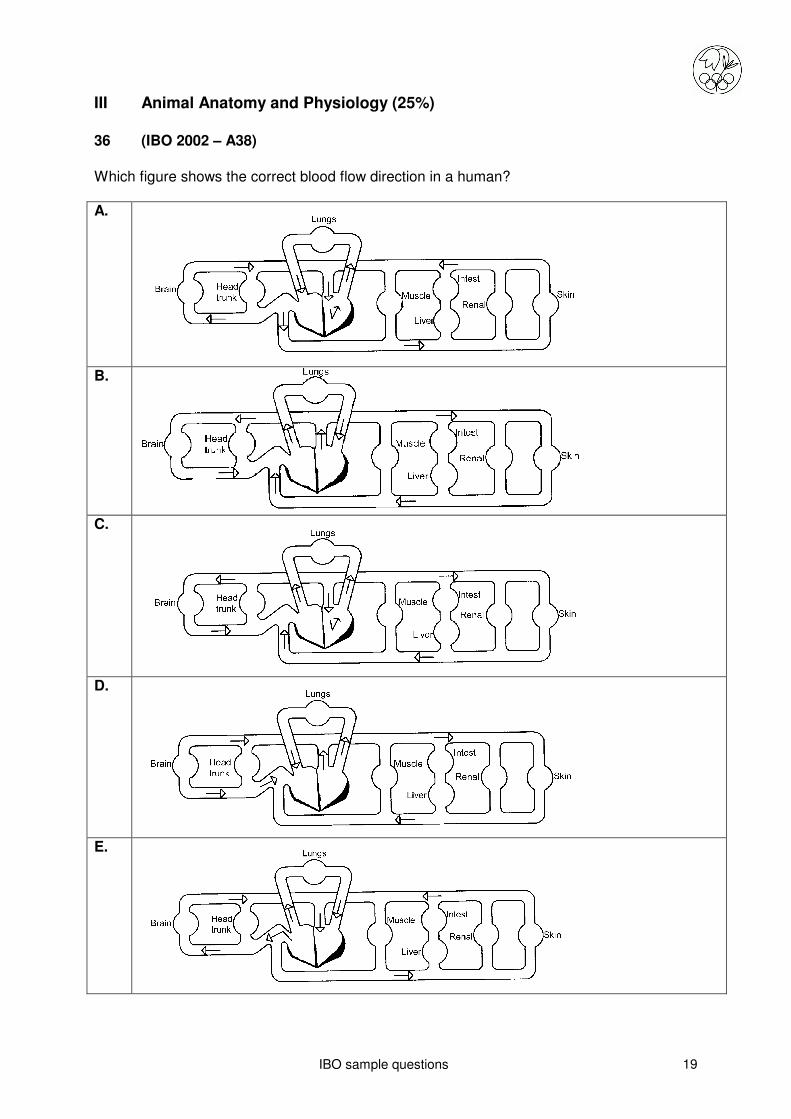
36 (IBO 2002 – A38)
Which figure shows the correct blood flow direction in a human? A.
B.
C.
D.
E.
IBO sample questions 20
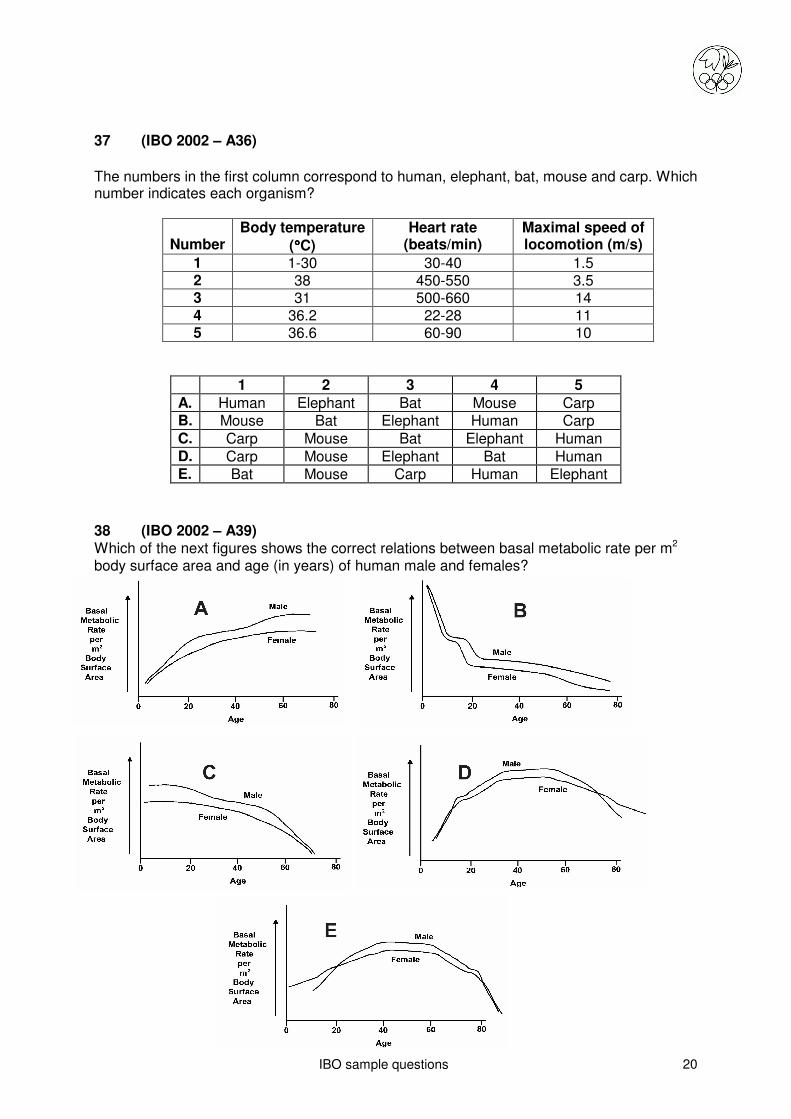
37 (IBO 2002 – A36)
The numbers in the first column correspond to human, elephant, bat, mouse and carp. Which number indicates each organism?
Number
Body temperature
(°°°°C)
Heart rate (beats/min)
Maximal speed of locomotion (m/s)
1 1-30 30-40 1.5 2 38 450-550 3.5 3 31 500-660 14 4 36.2 22-28 11 5 36.6 60-90 10
1 2 3 4 5 A. Human Elephant Bat Mouse Carp B. Mouse Bat Elephant Human Carp
C. Carp Mouse Bat Elephant Human
D. Carp Mouse Elephant Bat Human E. Bat Mouse Carp Human Elephant
38 (IBO 2002 – A39) Which of the next figures shows the correct relations between basal metabolic rate per m2 body surface area and age (in years) of human male and females?

IBO sample questions 21
39 (IBO 2008 – A29)
The glycoside “Phloridzin” present in apple peel can block the normal reabsorption of glucose from kidney tubules. As a result, sugar is almost completely excreted through the urine. A mouse fed with Phloridzin along with sodium succinate will develop: a. hypoglycemia and no sugar will be detected in the urine sample. b. hyperglycemia and urine test for sugar will be positive. c. hyperglycemia and no sugar will be detected in the urine sample. d. hypoglycemia and urine test for sugar will be positive.
40 (IBO 2002 – B22) What is the correct sequence of arrows (choose from 1-8) that characterize the sequence of events in stimulation and contraction of muscle. The black arrows indicate propagation of excitation (action potential) in the membranes; the white arrows – depolarization - induced Ca2+ propagation in the sarcoplasma.
41 (IBO 2008 – A25) Breathing in air has an advantage over breathing in water, because: I. air is less dense than water, so less energy is required to move air over respiratory
surfaces. II. oxygen diffuses faster through air than it does through water. III. the oxygen content of air is greater than that of an equal volume of water. Check I op to III on correctness.

IBO sample questions 22
42 (IBO 2003 – A26)
During the blood flow from the ventricle to atrium in fishes, how does the pressure change? See diagram. A = Atrium. V = Ventricle.
P = Pressure.
A picture A
B picture B
C picture C
D picture D
E picture E
43 (IBO 2003 – A27) A branched axon is stimulated at the site ‘1’ (see figure below). The excitation is transferred from site ‘1’ to ‘2’ and then to ‘3’ and ‘4’. The excitation is measured at these sites. Which statement of impulse frequencies (I) measured at these sites is correct?
A. I(1) > I(2) > I(3), I(3) = I(4), I(3) + I(4) = I(2). B. I(1) > I(2) > I(3), I(3) = I(4), I(3) x I(4) = I(2). С. I(1) < I(2) < I(3), I(3) = I(4). D. I(1) = I(2) > I(3), I(3) = I(4), I(3) + I(4) = I(2). E. I(1) = I(2) = I(3) = I(4).
44 (IBO 2003 – A28) Drosophila flies homozygous for the shake mutation are extremely sensitive to diethyl ether that causes convulsions in homozygous individuals. Convulsions are caused by abnormalities in nerve impulse conduction. (see graph below). The function of which structures is impaired in the shake mutations?
↓1 ↓2
↓3
↓4

IBO sample questions 23
Time
А. Na+ -channels. B. K+ -channels C. Ca2+ -channels. D. K+/Na+ -ATPase. E. Н+ -pump.
45 (IBO 2003 – A29) Daily changes in the concentration of which hormone are represented by the graph.
= arrow indicating the time of food consumption.
A. Thyroxine B. Glucagon. C. Insulin. D. Cortisol. E. Parathormone.
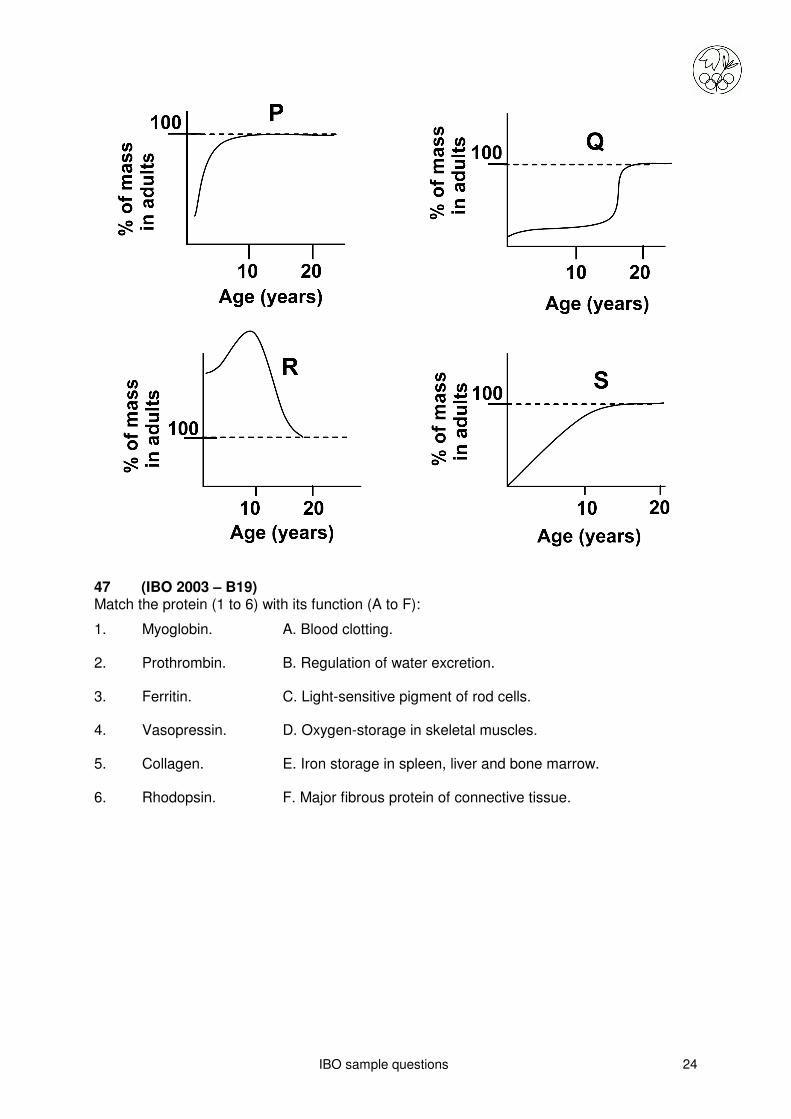
46 IBO 2008 – B15 The relative growth rates of four organs of the human body are shown in the graphs on the next page. Match the graphs with the organs by putting a tick mark (√) in the appropriate box of the table.
P Q R S
Liver
Brain
Thymus
Gonads
shake
wild type
mV
IBO sample questions 24
47 (IBO 2003 – B19) Match the protein (1 to 6) with its function (A to F):
1. Myoglobin. A. Blood clotting. 2. Prothrombin. B. Regulation of water excretion. 3. Ferritin. C. Light-sensitive pigment of rod cells. 4. Vasopressin. D. Oxygen-storage in skeletal muscles. 5. Collagen. E. Iron storage in spleen, liver and bone marrow. 6. Rhodopsin. F. Major fibrous protein of connective tissue.

IBO sample questions 25
48 (IBO 2003 – B22) A mutation in the haemoglobin gene (HbS) causes sickle cell disease that produces a cascade of symptoms such as:
1. Anaemia.
2. Sickle shaped red blood cells.
3. Breakdown of red blood cells.
4. Clumping of cells and clogging of small blood vessels.
5. Heart failure.
6. Kidney failure.
7. Brain damage.
8. Damage to other organ.
9. Paralysis.
In the following diagram, the symptom in the box on top of the arrow causes the symptom in the box below the arrow.
Match A, B, C and D with the correct number.
Sickle cell (abnormal) haemoglobin
2
A 4
B 5 7 C
D 6

IBO sample questions 26
49 (IBO 2005 – 11) Which of the following graphs correctly displays the relationship of blood flow velocity in humans as the blood flows: from the aorta � arteries � arterioles � capillaries � venules � veins � venae cavae
50 (IBO 2005 – 117) Which of the following diagram shows the correct representation of the urea content in the urine of a person on hunger strike, who then died.
51 2001 - B 19 Several parts of the body are involved in the transmission of a stimulus. Which of the following represents the correct sequence as a stimulus is carried along the reflex pathway? A sense organ; efferent neuron; spinal cord; afferent neuron; muscle/gland B muscle/gland; efferent neuron; spinal cord; afferent neuron; sense organ C sense organ; afferent neuron; spinal cord; efferent neuron; muscle/gland D sense organ; afferent neuron; efferent neuron; spinal cord; muscle/gland
A
B
C
D
E
IBO sample questions 27
52 IBO 2004 – 114 Digestion of food is facilitated by enzymes produced by various organs. Indicate the sites of production of the listed enzymes and which substrates they act on.
Organs Food substrates Enzymes Organ (A/B/C/D/E)
Substrate (F/G/H)
A intestines F polysaccharides 1. trypsin
B stomach G proteins 2. lipase
C pancreas H fat 3. aminopeptidase
D salivary gland 4. chymotrypsin
E liver 5. amylase
6. pepsin
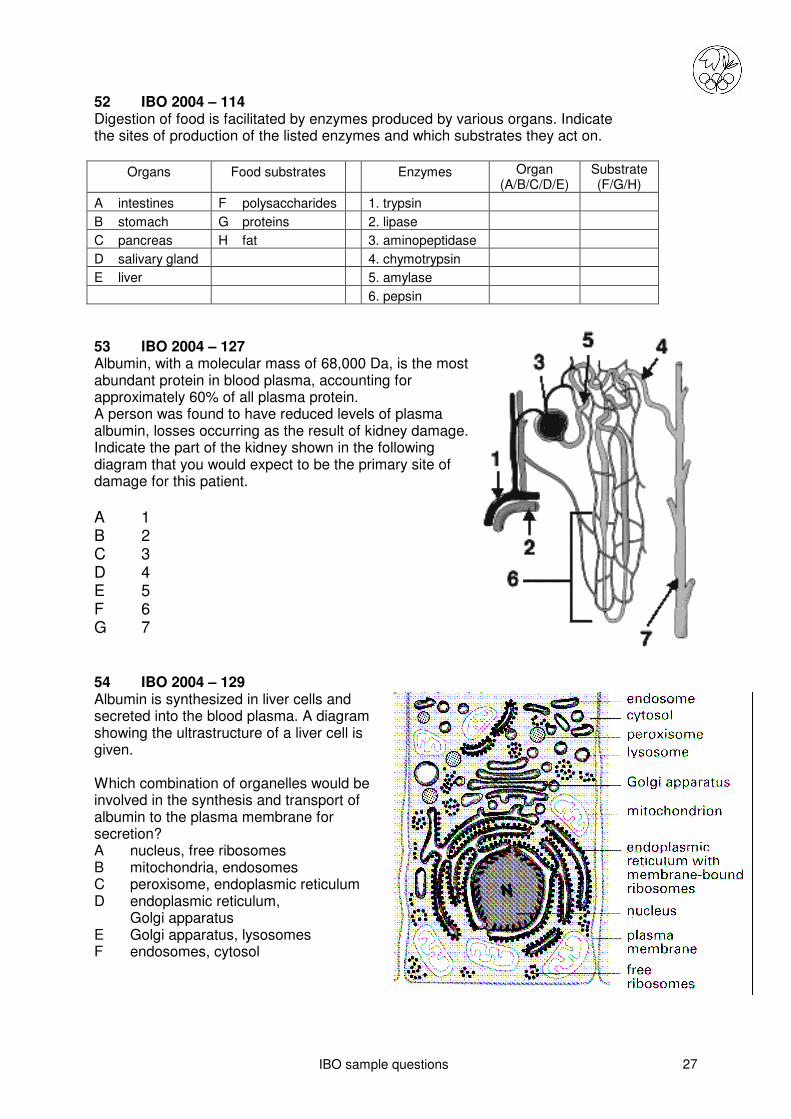
53 IBO 2004 – 127 Albumin, with a molecular mass of 68,000 Da, is the most abundant protein in blood plasma, accounting for approximately 60% of all plasma protein. A person was found to have reduced levels of plasma albumin, losses occurring as the result of kidney damage. Indicate the part of the kidney shown in the following diagram that you would expect to be the primary site of damage for this patient.
A 1 B 2 C 3 D 4 E 5 F 6 G 7
54 IBO 2004 – 129 Albumin is synthesized in liver cells and secreted into the blood plasma. A diagram showing the ultrastructure of a liver cell is given. Which combination of organelles would be involved in the synthesis and transport of albumin to the plasma membrane for secretion? A nucleus, free ribosomes B mitochondria, endosomes C peroxisome, endoplasmic reticulum D endoplasmic reticulum,
Golgi apparatus E Golgi apparatus, lysosomes F endosomes, cytosol

IBO sample questions 28
55 IBO 2006 - B22 Diagrams I and II correspond to the mechanisms of hormonal action.
Match the letters A up to G with the answer codes 01 up to 07 Answer code: 01. chemical reaction. 02. steroid hormone. 03. inactive enzyme. 04. protein. 05. receptor 06 peptide hormone 07 cyclical AMP
56 IBO 2008 – B19 In order to find out the nature of factors involved in humoral immunity, three groups of mice were immunized according to the scheme below:
Immunization scheme
1. Mice � Isolate serum (S1) after 2 weeks
2. Mice � Immunized with pathogen P � Isolate serum (S2) after 2 weeks
3. Mice � Immunized with pathogen Q � Isolate serum (S3) after 2 weeks

IBO sample questions 29
Using sera from the above immunization schemes, the following experiments were conducted to test the response of these sera towards pathogens P or Q:
Number Experiment
I Serum S1 � Add pathogen P or Q � No lysis of pathogen P or Q
II Serum S2 � Add pathogen P � Lysis of pathogen P
III Serum S3 � Add pathogen Q � Lysis of pathogen Q
IV Serum S2 � Add pathogen Q � No lysis of pathogen Q
V Serum S3 � Add pathogen P � No lysis of pathogen P
VI Serum S2 � Heat at 55°C for 30 min � Add pathogen P � No lysis of pathogen P
VII Serum S3 � Heat at 55°C for 30 min � Add pathogen Q � No lysis of pathogen Q
VIII Serum S2 � Heat at 55°C for 30 min � Add serum S1 � Add pathogen P � Lysis of pathogen P
IX Serum S2 � Heat at 55°C for 30 min � Add serum S1 heated at 55°C for 30 min � Add pathogen P � No lysis of pathogen P
X Serum S2 � Heat at 55°C for 30 min � Add serum S3 � Add pathogen P � Lysis of pathogen P
Answer the following questions:
(A)
If serum S3 is heated at 55°C for 30 min, and mixed with serum S1, which of the following pathogen would it lyse?
a. Only P
b. Only Q
c. P and Q both
d. Neither P nor Q
Put a tick mark (√) in the appropriate box.
(B)
If serum S2 is heated at 55°C for 30 min, and mixed with serum S3, which of the following pathogen would it lyse?
a. Only P
b. Only Q
c. P and Q both
d. Neither P nor Q
a. b. c. d.

IBO sample questions 30
Put a tick mark (√) in the appropriate box.
(C)
Which of the following statements are TRUE or FALSE for the above experiment?
a. The lysis of pathogen requires only one component, which is heat-labile.
b. The lysis of pathogens requires at least two components. One component is induced by the pathogen, while the other is non-inducible and is pathogen non-specific.
c. The pathogen-induced component is heat-labile whereas the non-specific component is heat-stable.
d. The pathogen-induced component is heat-stable whereas the non-specific component is heat-labile.
e. The pathogen-specific components cannot function if present together.
f. The non-specific component has to be derived from the same mice in which the pathogen-specific component would be induced.
Put a tick mark (√) in the appropriate boxes.
Options True False
a.
b.
c.
d.
e.
f.
a. b. c. d.

IBO sample questions 31
57 IBO 2006 - B24 The following figure shows the interactions between the hypothalamus, the anterior hypophysis and the male gonades. The full arrows ( → ) indicate excitatory effects and the dotted arrows ( � ) indicate inhibiting effects.
Match the letters A up to E with the following aspects. 01. Sertoli cell. 02. Testosterone. 03. FSH - Follicle-stimulating hormone. 04. Leydig Cells. 05. Inhibin.
IBO sample questions 32
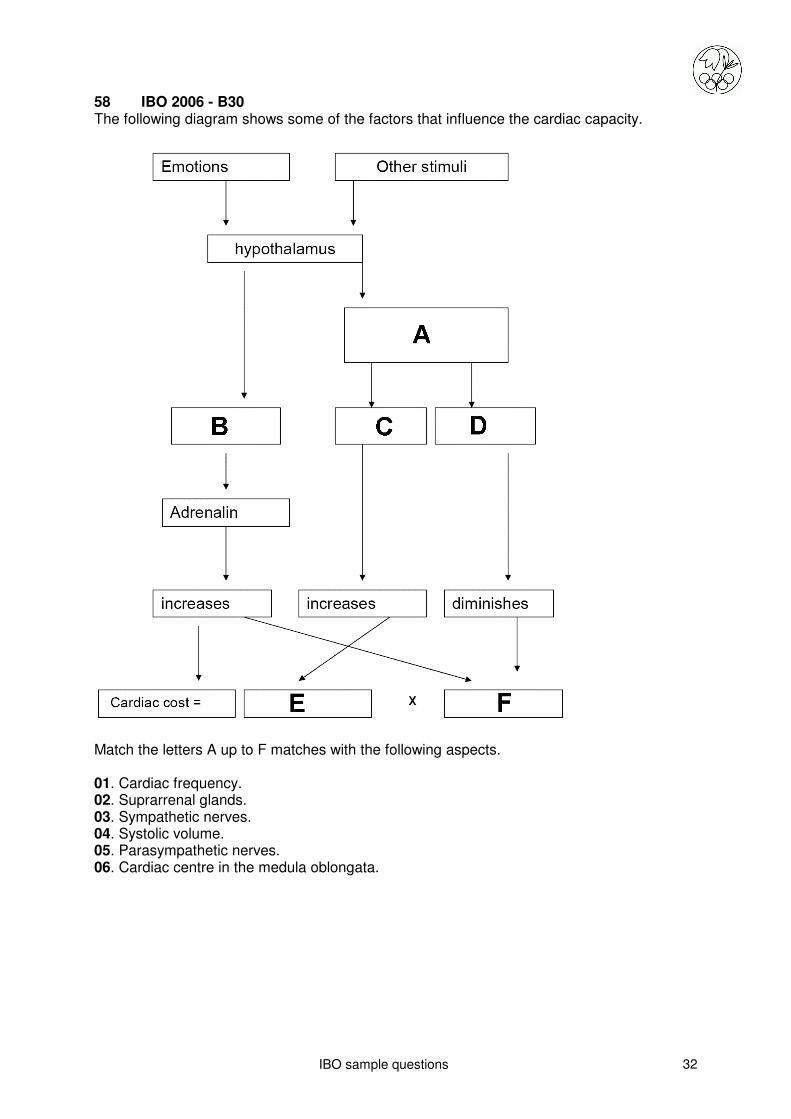
58 IBO 2006 - B30 The following diagram shows some of the factors that influence the cardiac capacity.
Match the letters A up to F matches with the following aspects. 01. Cardiac frequency. 02. Suprarrenal glands. 03. Sympathetic nerves. 04. Systolic volume. 05. Parasympathetic nerves. 06. Cardiac centre in the medula oblongata.

IBO sample questions 33
59 IBO 2008 – B18 Given below are the data on breathing rate, heart rate and body temperature of four different mammals A, B, C, and D.
Study the data and rank these animals in descending order of surface area per unit volume as well as the total volume of blood by filling in the boxes with appropriate letters (A to D). Surface area per unit volume of the body
Total volume of blood in the body
60 IBO 2001 – A66 The amount of dissolved oxygen in water changes when its temperature increases. The amount of haemoglobin in body liquids of aquatic vertebrates depends therefore also on the temperature of water in which animals live. Which of the curves of the graph below describes these changes best? A curve a. B curve b. C curve c. D curve d.
Animals Breathing rate
(inhalations/min) Heart rate
(beats/min) Body temperature
(°C)
A 160 500 36,5
B 15 40 37,2
C 28 190 38,2
D 8 28 35,9

IBO sample questions 34
IV Ethology (5%)
61 (IBO 2003 – B24) Two young men (Hans and Hugo), behaviour researchers of more or less the same age and appearance, are going to do some investigations about sexual preferences of human females. For this purpose they select six nice outdoor cafés popular with young women and hire two similar bikes of which one is provided with an extra child saddle (see diagram).
Hans and Hugo expect that a man having a bike with a child’s saddle is more attractive to young women. This is checked on a sunny afternoon in July. Hans and Hugo make a tour along the six outdoor cafés, indicated A to F. At every café they halt for 15 minutes. While standing in front of the café with their bikes and pretending they are having a talk together, they both try individually to make eye contact with as many as possible of the females sitting outside. The numbers are recorded and after each café Hans and Hugo change bikes. The results of this experiment are shown in the table.
Number of hits (eye contacts) at café A to F
A B C D E F Total
Hans 12 10 14 7 17 12 72
Hugo 9 17 10 10 12 20 78
Total 21 27 24 17 29 32 150
Remark: underlined are the hits obtained by man (Hans or Hugo)+bike with child saddle.
Hans and Hugo expect that the man with a bike having an extra child saddle will be more attractive to females than the man with the bike without a child saddle. Possible arguments supporting this idea are based on the hypothesis that female organisms often show behaviour focusing on objects related to survival of species. 1 Which of the following statements is a correct Null Hypothesis for the experiment of
Hans and Hugo?
A. Hans and Hugo do have the same attractiveness for females. B. The attractiveness of a man + bike with child’s saddle is the same as man + bike
without child’s saddle. C. The six cafés do not differ in the character of the visiting females. D. Having eye contact between a male and a female is not an indicator of attraction. E. The attractiveness of a man+bike with child’s saddle is greater than that of a man+bike
without child’s saddle.

IBO sample questions 35
)}/n(s )/n(s { B
2
BA
2
A +=s
2. Hans and Hugo do some calculations with their results.
Number of hits per café
Mean (average) Standard deviation
Hans 12 3.4
Hugo 13 4.5
Hans+Hugo 25 5.5
Situation A:
Man + bike with child’s saddle
15 (nA) 3.7 (SA)
Situation B:
Man + bike without child’s saddle
10 (nB) 1.9 (SB)
You have to check the significance of the differences between situation A and B using the t-test. The following table should be used.
Level of significance Critical t-value
10.0 % 2.02
5.0 % 2.57
2.5 % 3.37
1.0 % 4.03
0.5 % 6.86
Calculate the standard deviation of the difference between the means of the two situations A and B in using the formula: 3. Calculate t, using the formula: t = d/s
d = difference between means (situation A and situation B). 4. How sure can we be about rejecting the Null hypothesis (i.e. the difference between
situation A and B is significant)
1. Less than 75.0 % 2. In between 75.0 % and 90.0 % 3. In between 90.0 % and 95.0 % 4. In between 95.0 % and 97.5 % 5. In between 97.5 % and 99.0 % 6. In between 99.0 % and 99.5 % 7. Over 99.5 %
5. Hans and Hugo show their results to Paula, their boss. Paula claims that Hans and
Hugo made a big mistake looking at the total number of hits per café since the six cafés differ too much as a spread of 17 up to 32 is too much. Hans and Hugo do
not agree with Paula and want to prove their point of view using the χ² test.
Determine the χ² using the following formula:

IBO sample questions 36
6 Indicate the degree of freedom (df) for this test:
7. Determine the probability (P) for this χ² test, using the following table. Estimate the answer in %.
Probability of random deviation (P) (df)
0.995 0.975 0.9 0.5 0.3 0.25 0.1 0.05 0.025 0.01
1 0.00 0.00 0.02 0.46 1.07 1.32 2.71 3.84 5.02 6.64
2 0.01 0.05 0.21 1.39 2.41 2.77 4.61 5.99 7.38 9.214
3 0.07 0.22 0.58 2.37 3.67 4.11 6.25 7.82 9.35 11.35
4 0.21 0.48 1.06 3.36 4.88 5.39 7.78 9.49 11.14 13.28
5 0.41 0.83 1.61 4.35 6.06 6.63 9.24 11.07 12.83 15.09
6 0.68 1.24 2.20 5.35 7.23 7.84 10.65 12.59 14.45 16.81
7 0.99 1.69 2.83 6.35 8.383 9.04 12.02 14.07 16.0 18.48
8 Which of the following conclusions based upon this χ² test is correct? Look at the total number of hits per cafe
1. The café’s are different, but the differences are not significant 2. The differences between the cafés are significant 3. The results are dubious or questionable, something must be wrong in the
design of this experiment 4. The cafés are not different, but this is not significant 5. The cafés are not different and this is significant
62 (IBO 2005 – 17) In animal behavior a sign stimulus could trigger a fixed action pattern (FAP). Which of the following is NOT an example of sign stimulus-FAP? A. Some moths fold their wings and drop to the ground when they detect an ultrasonic
signal from bats. B. A wasp finds its nest according to the surrounding objects. C. A newly hatched bird cheeping loudly in begging for food when its parent returns to
nest. D. Breeding mayflies lay eggs when they detect water.
63 (IBO 2005 – 118) Some birds (e.g. Gulls) feed on molluscs. The birds grasp the prey and fly upwards to a certain height before they drop the prey onto a rock to break the shells. If the shell was not broken by the first drop, the birds will pick it up and drop it again until it is broken. In one experiment, researchers found the following relationship between the drop heights and the number of times it was dropped before the shell broke. (1 point)
Height of drop (m)
Number of drops required to break shell
Height of drop (m)
Number of drops required to break shell
1 67 5 5
2 46 6 4
3 18 12 3
4 6

IBO sample questions 37
According to the optimal foraging theory, which of the following is the most likely height that the birds would fly to drop the shells?
A. 6,5 m
B. 4,5 m
C. 2,5 m
D. 3,5 m
E. 12,5 m
64 (IBO 2005 – 119)
A snail crawling across a board will withdraw into its shell when you drop a marble on the
board. Repetition of dropping marble will lead to a weaker withdraw action and in the end the
snail will ignore the marble dropping. Which of the following terms do apply for the
disappearance of the withdraw action?
(1) adaptation
(2) conditioning
(3) habituation
(4) imprinting
(5) insight
(6) learned behaviour
A. 1, 3
B. 2, 4
C. 3, 6
D. 4, 5
E. 5, 6
65 (IBO 2005 – 123)
The behavior of eight Humboldt penguins (Spheniscus humboldti) is investigated in a larger
group of penguins in a zoo enclosure. The animals can be distinguished by the marks or their
individual pattern of black dots on their white thorax. To document the relationship between
penguins, their nearest neighbor (closest animal in the enclosure) was recorded in short time
intervals during day time in a period of several weeks. The table shows the relatively stable
mean values for the frequency of neighbors for the four male (M1 – M4) and four female (F1
– F4) penguins.
M1 M2 M3 M4 F1 F2 F3 F4 Σ
M1 2 5 1 0 3 7 77 95
M2 2 0 9 9 75 1 2 98
M3 5 0 0 0 0 78 6 89
M4 1 9 0 80 8 0 0 98
F1 0 9 0 80 7 0 0 96
F2 3 75 0 8 7 0 0 93
F3 7 1 78 0 0 0 7 93
F4 77 2 6 0 0 0 7 92
Σ 95 98 89 98 96 93 93 92

IBO sample questions 38
Several months later the same animals were observed again yielding the following values.
M1 M2 M3 M4 F1 F2 F3 F4 Σ
M1 4 8 2 1 4 11 60 90
M2 4 0 12 12 65 1 5 99
M3 8 0 0 0 1 62 9 80
M4 2 12 0 70 14 0 1 99
F1 1 12 0 70 10 0 1 94
F2 4 65 1 14 10 0 3 97
F3 11 1 62 0 0 0 10 84
F4 60 5 9 1 1 3 10 89
Σ 90 99 80 99 94 97 84 89
During the following years these values tended to remain the same.
Analyze the tables and determine the mating system of the Humboldt penguins.
A. promiscuity
B. polyandry
C. polygyny
D. monogamy

IBO sample questions 39
V Genetics and Evolution (20%)
66 (IBO 2002 – A45) What is the probability for exactly three children to have a dominant phenotype in a family with four children of heterozygous parents (Aa x Aa)? A. 2% B. 56% C. 36% D. 44% E. 60% 67 (IBO 2002 – A46) Mouse hair colour is determined by two unlinked loci – C and B. Mice with genotype CC or Cc are agouti, and with genotype cc-albino because pigment production in hair is blocked. At the second locus, the B allele is dominant to the b, and the B allele determines black agouti coat colour, but b - brown agouti coat colour. A mouse with a black agouti coat is mated with an albino mouse of genotype bbcc. Half of the offspring were albino, one quarter - black agouti, and one quarter were brown agouti. What was the genotype of the black parent? A. BBCC B. BbCc C. BbCC D. Bbcc E. BBcc 68 (IBO 2002 – A47) After graduation, you and 19 friends (sex ratio close 1:1) build a raft, sail to a deserted island, and start a new population, totally isolated from the world. Two of your friends carry (that is, are heterozygous for) the recessive c allele, which in homozygotes causes cystic fibrosis. What will be the incidence of cystic fibrosis on your island, if you assume that the frequency of this allele does not change during the growth of population? A. 0.05 % B. 0.0025 % C. 0.25 % D. 0.5 % E. 0.10 % 69 (IBO 2002 – A54) In crossing true-bred yellow and grey fruit flies Drosophila, the following results were obtained:
Parents Progeny
Grey female x yellow male All grey
Yellow female x grey male All males – yellow, All females - grey
Which statement is correct? A. Alleles for grey and yellow body colour are codominant B. The allele for grey body colour is X-linked recessive C. The allele for yellow body colour is X-linked dominant D. The allele for grey body colour is X-linked dominant E. The allele for yellow body colour is autosomal recessive
IBO sample questions 40
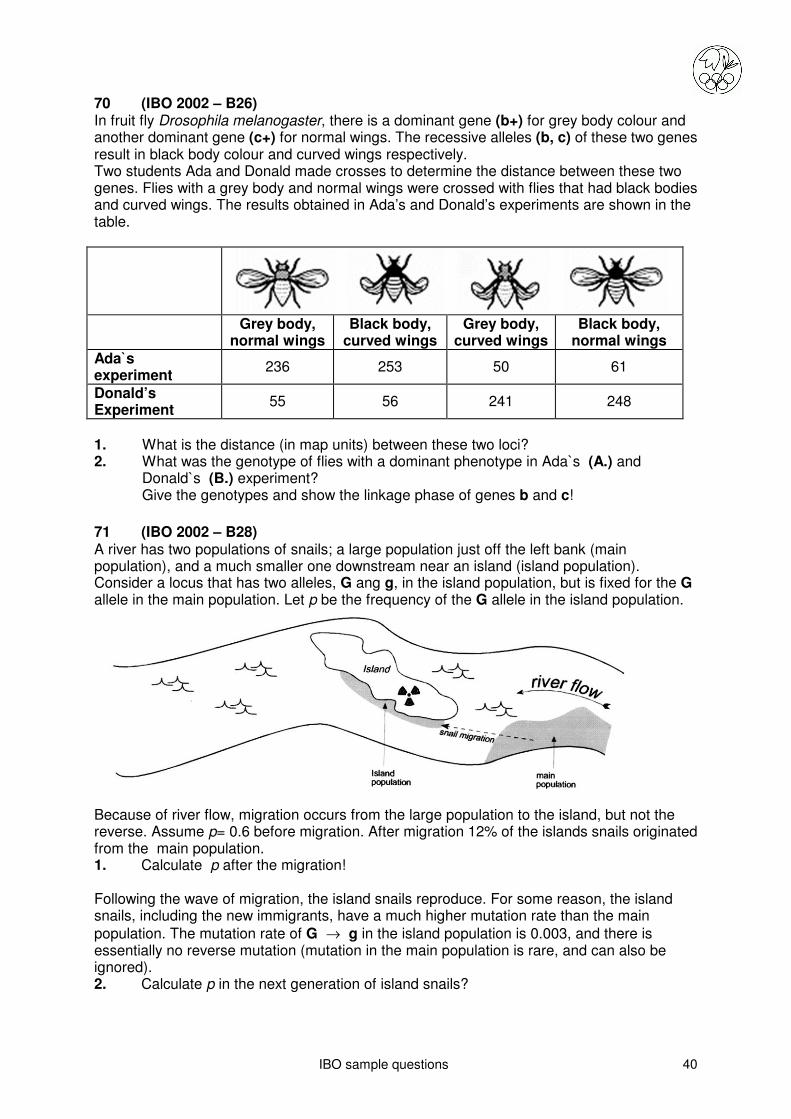
70 (IBO 2002 – B26) In fruit fly Drosophila melanogaster, there is a dominant gene (b+) for grey body colour and another dominant gene (c+) for normal wings. The recessive alleles (b, c) of these two genes result in black body colour and curved wings respectively. Two students Ada and Donald made crosses to determine the distance between these two genes. Flies with a grey body and normal wings were crossed with flies that had black bodies and curved wings. The results obtained in Ada’s and Donald’s experiments are shown in the table.
Grey body,
normal wings Black body,
curved wings Grey body,
curved wings Black body,
normal wings Ada`s experiment
236 253 50 61
Donald’s Experiment
55 56 241 248
1. What is the distance (in map units) between these two loci? 2. What was the genotype of flies with a dominant phenotype in Ada`s (A.) and
Donald`s (B.) experiment? Give the genotypes and show the linkage phase of genes b and c!
71 (IBO 2002 – B28) A river has two populations of snails; a large population just off the left bank (main population), and a much smaller one downstream near an island (island population). Consider a locus that has two alleles, G ang g, in the island population, but is fixed for the G allele in the main population. Let p be the frequency of the G allele in the island population.
Because of river flow, migration occurs from the large population to the island, but not the reverse. Assume p= 0.6 before migration. After migration 12% of the islands snails originated from the main population. 1. Calculate p after the migration! Following the wave of migration, the island snails reproduce. For some reason, the island snails, including the new immigrants, have a much higher mutation rate than the main
population. The mutation rate of G → g in the island population is 0.003, and there is essentially no reverse mutation (mutation in the main population is rare, and can also be ignored). 2. Calculate p in the next generation of island snails?

IBO sample questions 41
72 (IBO 2002 – B29) In a specific population, genotype frequencies have been estimated before and after selection.
a1a1 a1a2 a2a2
Frequency before
selection (generation F0)
0.25
0.50
0.25
Frequency after
selection (generation F1)
0.35
0.48
0.17
1. Calculate the selection coefficient of each genotype (a1a1, a1a2, a2a2) 2. Against which genotype is selection the strongest? 73 (IBO 2002 – B30) Expression of some autosomal genes depends on whether that gene came from male or female parent. These are so called imprinted genes (imprinted genes are expressed in a parent - specific manner). Imprinting of these genes happens during spermatogenesis or oogenesis, and may silence the allele coming from one parent. Problem 1. Imprinted genes can account for many cases of incomplete penetrance. The pedigree shows the incomplete penetrance of an autosomal dominant gene resulting from imprinting during oogenesis. A woman II1 is heterozygote for this gene. Analysis of DNA reveals that III2 and III5 have received the mutant gene from their mother.
1 What is the probability of II1 and II2 having an affected child? 2 What is the probability of III1 and III2 having an affected child? 3 What is the probability of III4 and III5 having an affected child?

IBO sample questions 42
Problem 2. Parental imprinting gives a deviation from Mendelian patterns of inheritance, because the same allele may be differently expressed depending on whether it is inherited from the mother or the father. Determine which pedigree show maternal (1) and which paternal (2) imprinting. Choose from pedigrees A,B,C,D).
74 (IBO 2002 – B32) Alkaptonuria is a rare genetic disease. The gene for alkaptonuria (alk) is recessive and has been located on chromosome 9. Gene alk is linked to the gene I encoding the ABO blood types. The distance between the alk gene and gene I is 11 map units. A pedigree of a family with the alkaptonuria is shown below. Affected individuals are indicated by shaded symbols. In addition, the blood type of family members is given.

IBO sample questions 43
1. What are the genotypes of individuals 3 and 4? 2. If individuals 3 and 4 are expecting their fifth child, what is the probability that the child
will have alkaptonuria (a physician has determined that foetus has blood type B)?
75 (IBO 2003 – A37) In birds, for instance chickens, sex is determined by a combination of sex chromosomes Z and W. At an early age it is difficult to determine their sex. However, it is commercially very important to distinguish males and females at this age. Using a genetic marker, it is possible to conduct such crosses so that sex will be determined by phenotypic expression of the marker gene. On which chromosome must the marker gene (I) be located and which crossing allows discrimination of the males from females (II)?
Marker gene localization (I) Crossing (II)
A. On Z chromosome. Female with recessive phenotype is crossed with a male homozygous for dominant allele.
B. On W chromosome.
Female with recessive phenotype is crossed with a male homozygous for dominant allele.
C. On Z chromosome.
Female with dominant phenotype is crossed with a male homozygous for recessive allele.
D. On an autosome.
Female with recessive phenotype is crossed with a male heterozygote.
E. On Y chromosome.
Female with dominant phenotype is crossed with a male heterozygote.
76 (IBO 2003 – A38) abcde genes are closely linked on the E. coli chromosome. Short deletions within this region lead to the loss of some genes. For example: deletion 1 – bde genes deletion 2 – ac genes deletion 3 – abd genes What is the gene order on the genetic map of the E. coli chromosome? A. b, c, d, e, a B. e, a, c, b, d C. a, b, с, d, e D. c, a, b, d, e E. a, b, c, d, e

IBO sample questions 44
77 (IBO 2003 – A41) In humans PKU (phenylketonuria) is a disease caused by an enzyme dysfunction at step A in the following simplified reaction sequence, and AKU (alkaptonuria) is due to an enzyme inefficiency in one of the steps summarized as step B.
A person with PKU marries a person with AKU. What are the expected phenotypes for their children? Note: both diseases (PKU and AKU) are not sex linked. Both parents are not heterozygous. A. All children will be ill. B. All children will be normal C. Half of their children will have PKU, but the other half will be normal. D. Half of their children will have AKU, but the other half will be normal.
78 (IBO 2003 – A43) The long corolla of tobacco is inherited as a recessive monogenic characteristic. If in a natural population 49% of plants have a long corolla, what is the probability that the result of test crossing plants with a short corolla from this population in F1 will have uniformity of progeny? A. 2,4 %. B. 51 %. C. 30 %. D. 17,7 %. E. 42 %.
79 (IBO 2003 – B26) The birth records for 4 children were lost at a hospital. The ABO blood groups of the four babies are known to be A, B, AB, and O. To determine parentage all of their parents were tested for blood group. (The father of third child wasn’t found). The results are shown in the following table. 1 Match the babies with their parents by marking the right blood types in the table .
Families Blood group of each parent Blood group of a baby
Father AB Parents 1
Mother O
Father A Parents 2
Mother O
Father Unknown Parents 3
Mother A
Father O Parents 4
Mother O
2 What is/are the possible blood group(s) the unknown father could have?

IBO sample questions 45
80 (IBO 2003 – B28) In an isolated human population of 8400 persons, the frequency of allele IA is 30% and allele IB is 10%. What is the number and % of people with each blood group?
Group People number %
O
A
B
AB
81 (IBO 2003 – B29) Suppose that the difference between 10 cm high maize and 26 cm high maize is due to four pairs of additive genes. The individuals with 10 cm have the aabbccdd genotype and the 26 cm - AABBCCDD. 1 Determine the phenotype of F1 if it is known that the parental plants are 10 cm and
26 cm of high. 2 How many phenotypes classes would be in F2? 3 Determine the phenotypes of F2 if it is known, that the parental plants are 10 cm and
26 cm high. 4 What fraction of the total number of plants in F2 will be 18 cm high ?
82 (IBO 2006 – A46)
In an electrophoretic study of enzyme variation in one species of Dasypus you find 31
individuals A1A1, 24 A1A2 and 5 A2A2, in a sample of 60. Which are the frequencies of alleles
A1 and A2?
A p(A1)= 0.72; q (A2) = 0.28.
B p(A1)= 0.52; q (A2) = 0.48.
C p(A1)= 0.92; q (A2) = 0.028.
D p(A1)= 0.28; q (A2) = 0.72.
E p(A1)= 0.48; q (A2) = 0.52.
83 (IBO 2006 – A48)
If in another population the frequency of the A1A1 genotype is 0.25 and the frequency of the
A1A2 genotype is 0.45, in Hardy-Weinberg equilibrium, the frequency of matings between the
A2A2 and A2A2 genotypes would be:
A 0.063.
B 0.300.
C 0.090.
D 0.112.
E 0.075.

IBO sample questions 46
84 (IBO 2006 – A54)
You carry out a cross between homozygous purple-eyed flies with vestigial wings, and wild-
type flies. The resulting F1 flies are all phenotypically wild-type. In the progeny of the
testcross of F1 females you observe the following phenotypes:
Phenotype Progeny
Purple-eyed, vestigial wings 1193
Purple-eyed, normal wings 159
Red-eyed, vestigial wings 161
Red-eyed, normal wings 1129
What is the map distance between these two loci?
A 12.2 map units.
B 48.2 map units.
C 6.2 map units.
D 24.4 map units.
E none of the above.
85 (IBO 2006 – A55)
In order to study a viral polymerase, a scientist decided to express the encoding gene in
Escherichia coli using the recombinant DNA technology. Choose the correct option about
steps mentioned below, in the right order.
a. cloning into an expression vector.
b. disruption of cells and isolation of cytoplasmic fraction.
c. induction of protein expression.
d. isolation of viral genomic RNA from purified virions.
e. PCR (polymerase chain reaction).
f. reverse transcription.
g. selection of the desired clone.
h. transformation into Escherichia coli cells.
A d, f, e, a, h, g, c, b.
B d, b, c, a, h, e, f, g.
C h, g, a, b, d, f, c, e.
D d, f, e, h, g, b, c, a.

IBO sample questions 47
VI Ecology (10%)
86 (IBO 2002 – B35) The diagram shows a 10m x 10m plot located in a forest with two main tree species: Species X which is shaded grey, and Species Y which is shaded black. The plot is divided into a grid with step 1m.
1. What are the percentage frequencies of Species X and Species Y using a quadrate size of 2 m x 2m?
2. What are the percentage frequencies of Species X and Species Y using a quadrate size of 5m x 5m.
87 (IBO 2002 – B36) The Baltic Sea is brackish, receiving salt water from the North Sea, and fresh water from rivers. Turnover of water in deep layers is much slower than at surface layers. Stratification of the water column is common in summer. The following figure shows a depth profile (in July) for oxygen concentration (mg/l), hydrogen sulphide concentration (mg/l), salinity (PSU) and
temperature (°C) in the water column. Match in the table the labels A, B, C, and D with oxygen concentration, hydrogen sulphide concentration, salinity and temperature, and the labels E, F and G with parts of the curves – halocline, redoxycline and thermocline.
1 Oxygen concentration
2 Hydrogen sulphide concentration
3 Salinity
4 Temperature
5 Halocline
6 Redoxycline
7 Thermocline

IBO sample questions 48
88 (IBO 2002 – B42) Most birds start to incubate when their clutch is full. There are species which start incubation after the first egg is laid. Their chicks hatch asynchronously, which is characteristic to birds of prey and owls (Falconiformes, Strigiformes). Mark all the correct statements in the table.
A. Food resources for birds of prey, and therefore the number of chicks they can feed, differ between years significantly
B. Younger nestlings are fed more often and they catch up with older ones in the progress of their growth
C. Birds of prey feed as many chicks of the brood as the food resources allow in the given year
D. During years with scarce food resources, food is given mainly to the oldest nestlings, while the youngest ones starve to death
E. Older nestlings help to feed younger ones
F. Room in the nest is not sufficient for several big chicks simultaneously, therefore they grow up and fly out of the nest one at a time
G. One fledgling that can reach reproduction age is more important for species survival then several but not well developed fledglings
H. The number of fledglings and not their fitness is the most important for the species survival
89 (IBO 2003 – A51) In ecological pyramids, normally each higher trophic level is smaller. Possible exceptions leading to inverted pyramids are: I. A pyramid of numbers with one big producer. II. A pyramid of mass when producers have a very short life cycle. III. A pyramid of energy in extremely hot ecosystems. Which combination is correct? A Only I and II. B Only II and III. C Only I and III. D I, II and III. E None of these.
90 (IBO 2003 – A47) The shell of the land snail shows variation in both colour and banding pattern. In order to construct a 5-figure banding formula, bands are numbered from the top of the largest whorl, as shown in the diagram. ‘0’ is used to represent the absence of a band and square brackets indicate the fusion of two bands.

IBO sample questions 49
1 Using the appropriate letter, indicate the banding formula of shell S. А 030[45]. B 03045. C 02045. D 003[45].
2 Thrushes (which have good colour vision) smash the shells of land snails against
stones (anvils) in order to feed on the soft inner body. If snail types P, Q, R and S began in equal numbers in a habitat of grassland, which would be the most popular among birds?
A P. B Q. C R. D S.

IBO sample questions 50
3 A survey of broken shells collected from thrush anvils amongst dead beech leaves in a woodland area was carried out. Predict which of the following sets of results was obtained.
Broken shells of each type (%) Options
P Q R S
A. 13 33 1 5
B. 11 1 34 6
C. 5 1 14 32
D. 6 21 20 5
91 (IBO 2003 – B36) The graph shows the productivity of an aquatic ecosystem measured in terms of dissolved oxygen produced and consumed by green plants and photosynthetic algae where PS = photosynthesis and R = respiration.
-20
-10
0
10
20
30
PS R PS+R
Dis
solv
ed O
xygen (
mg/L
)
Study the graph and answer the following questions. 1 Which bar represents net primary productivity? 2 An algal bloom occurs until nutrient levels are exhausted. Then the algae die off and
microbial decomposition begins. What will happen during the algal bloom?
1. PS will be increased, R will be decreased. 2. PS will be decreased, R will be increased. 3. PS and R will not change. 4. PS + R will increase. 5. PS + R will decrease. 6. PS + R will remain unchanged.

IBO sample questions 51
92 (IBO 2005 – 33) The figure below shows the nitrogen cycle. Complete the table below according to the information provided.
Bacteria: Answer: A through E. *)
(1) Able to form nodules with plants
(2) Able to denitrify
(3) Able to nitrify
(4) Able to use ammonium as energy source
(5) Able to fix nitrogen from air
*) Note: there could be more than one correct answer
93 (IBO 2005 – 96) If N represents population size, r represents the difference in per capita birth rates and death rates, K represents the carrying capacity, t represents time, which of the following equations best describes logarithmic growth of the population?

IBO sample questions 52
94 (IBO 2006 – A59)
The graph represents the hypothetical results of an experiment designed to recognize which
nutrients can act as limitants of productivity in a salinized water lake. According to the areas
of limitation, determine the lines in the graphic which correspond to each of these nutrients:
phosphorus, nitrogen, iron and copper.
References
Solid black line: primary production
a) Iron limitation area
b) Nitrogen limitation area
c) Phosphorus limitation area
I II III IV
A Iron Nitrogen Phosphorus Copper
B Copper Phosphorus Nitrogen Iron
C Nitrogen Phosphorus Iron Copper
D Copper Nitrogen Iron Phosphorus
E Iron Copper Phosphorus Nitrogen
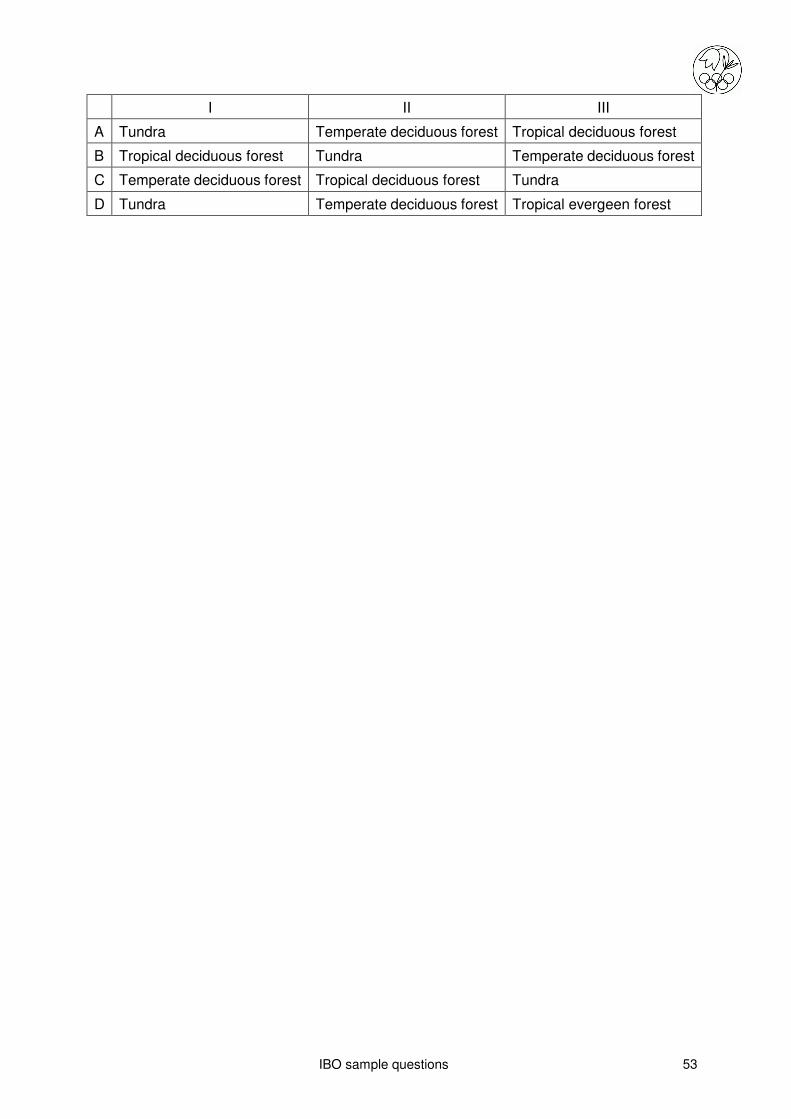
95 (IBO 2006 – A67)
Organic matter decomposition depends in part on climatic factors such as temperature and
precipitation. In the following schemes, the distribution of nitrogen in mulch, root, and soil for
six different biomes is shown. Which biome is represented in each of the following figures: I,
II, and III?
IBO sample questions 53
I II III
A Tundra Temperate deciduous forest Tropical deciduous forest
B Tropical deciduous forest Tundra Temperate deciduous forest
C Temperate deciduous forest Tropical deciduous forest Tundra
D Tundra Temperate deciduous forest Tropical evergeen forest

IBO sample questions 54
VII Biosystematics (5%)
96 IBO 2002 – A36 The numbers in the first column correspond to human, elephant, bat, mouse and carp. Which number indicates each organism?
Number Body temperature
(°C)
Heart rate (beats/min)
Maximal speed of locomotion
(m/s)
1 1-30 30-40 1.5
2 38 450-550 3.5
3 31 500-660 14
4 36.2 22-28 11
5 36.6 60-90 10
1 2 3 4 5
A Human Elephant Bat Mouse Carp
B Mouse Bat Elephant Human Carp
C Carp Mouse Bat Elephant Human
D Carp Mouse Elephant Bat Human
E Bat Mouse Carp Human Elephant
97 IBO 2003 – A60 There are five species (K, L, M, N, O) in a single family. They belong to the same genus. The table lists data concerning the presence or absence of six features in these species:
Species Features
1 2 3 4 5 6
K + – + + + –
L – – – – + –
M + – – – – –
N – + – – – –
O + – + + – –
Based on the assumption that the most probable scheme of phylogenetic development is that which required the least number of evolutionary changes, indicate the species that is the most probable ancestor of species O. A K B L C M D N

IBO sample questions 55
98 IBO 2001 - B39 Taxonomical classification of organisms can be realised in different ways. One method is to take in consideration selected characteristics of a number of organisms and construct a grid (data matrix) showing the percentage of similarity between these characteristics. An example of such a similarity matrix of 10 organisms 1 up to 10 is:
1 100 Similarity matrix
2 54 100
3 80 55 100
4 63 57 62 100
5 62 57 64 74 100
6 81 55 85 63 64 100
7 50 86 51 56 56 54 100
8 83 56 86 65 67 87 54 100
9 50 87 50 56 56 52 85 54 100
10 61 56 62 90 72 65 55 67 55 100
1 2 3 4 5 6 7 8 9 10
Based on this matrix it is possible to produce a tree like diagram showing one group of four related organism (group I), one group of three (two + one) related organisms (group II) and another group of three organisms (group III) in the following way:
Indicate which organisms belong to group I, II and III:

IBO sample questions 56
99 IBO 2005 – 103 The figure shown below is a diagram of an evolutionary tree. Which of the following statements about evolution are true and deducible from the figure?
(1) All eucaryotic cells contain mitochondria.
(2) Symbiosis of the eucaryotic ancestor with autotrophic cells preceded the symbiosis with the cell taking advantage of the oxidative metabolism.
(3) There is a common ancestor of eubacteria and eukaryota, archaebacteria are a group with unique and independent origin.
(4) The ancestral eukaryote was anaerobic.
(5) None of the recent photosynthetic bacteria are related to the chloroplasts.
(6) Mitochondria and chloroplasts have similar genomes.
(7) Mitochondria are present in the cells of the plants, animals and fungi.
(8) Fungi lost chloroplasts during evolution.
(9) Bacteria are a highly homogenous group of organisms which showed rapid diversification of their genomes and metabolisms during the last billion years.
(10) Chloroplasts and mitochondria are results of independent endosymbiotic events. A 1, 2, 5 B 3, 4, 7 C 4, 7, 10 D 6, 8, 10 E 4, 9, 10

IBO sample questions 57
100 IBO 2006 - A72
Observe the following diagrams of invertebrates embryos illustrating the characteristics of the
body plan.
References
Endoderm Mesoderm Ectoderm
Cross I II III IV V
Transversal
Longitudinal
Diploblastic Triploblastic
No coeloms pseudocoeloms true coeloms
Incomplete or blind gut Complete gut (Tube-within-a-tube)
Without segmentation With segmentation (metameric)
Select the correct sequence which corresponds to the Phyla represented
with I, II, III, IV and V.
A Cnidaria Plathyhelminta Annelida Nematoda Arthropoda
B Cnidaria Plathyhelminta Nematoda Arthropoda Annelida
C Nematoda Arthropoda Plathyhelminta Cnidaria Annelida
D Annelida Cnidaria Arthropoda Plathyhelminta Nematoda
E N D

Answer Key
Nr Year Question Answer
Cell Biology
1 2001 B4 A6-B7-C5-D1-E3-F2-G9-H10-I8-J4
2 2001 B6 UCGAUU
3 2002 B2 1 µ(A)= 0,7 g/gh 2 µ(B) = 1,4 g/gh
4 2002 B3 100 mM
5 2002 B4 1. 1,16 or 1,18, or 1,19 2. 0,30 or 0,32 0 0,353 3: 2,2 or 2,21 or 2,24
6 2002 B7 1: A=75%, B=25%, C=0%
2. gene A: A=20%, C=30%, G=30%, T=20%, U=0% gene B: A=30%, C=20%, G=20%, T=30%, U=0%
3. A=5, B=4
7 2002 B9 1.
2. 1 ml/min
3. 0,017 – 0,018 mmol CO2 /g min
4. 0,007 – 0,018 mmol ethanol/g min
8 2004 89 B
9 2005 1 1ª – 2B – 3D – 4E
10 2004 85 E
11 2007 A9 B
12 2004 99 1 – D, 2 – C, 3 – B, 4 – E, 5 – A
13 2007 A32 1 – B, 2 – E, 3 – A, 4 – A, 5 – C, 6 – A
14 2004 110 1 – CJ, 2 – DF, 3 – AG, 4 – BH, 5 - EI
15 2004 108 A
16 2004 116 1 – A, 2 – B, 3 – E, 4 – C
17 2004 137 1 – 5: Yes
18 2004 149 1 – B, 2 – C, 3 – A
19 2006 B1 B
20 2006 B8 C
Answer Key
Plant Anatomy and Physiology
21 2002 B14 1 A = 3, B = 2, C = 4, D = 1
2. A-B = 5, 6, C = 2, D = 2
22 2002 B15 A, B, C = 3, 6, 12
D = 2, 8, 11, 13, 14, 15
E = 1, 5, 4, 7, 9, 10, 16
23 2002 A20 E
24 2002 A25 A
25 2003 A16 C
26 2003 A22 B
27 2003 A23 B
28 2003 B11 True (+): 2, 3, 5, 9, 10
False (−): 1, 4, 6, 7, 8
29 2003 B12 A5 – B10 – C7 – D3 – E8 – F1 – G4 – H2 – I6 – J9
30 2003 B15 1. beaker: orange-brown – Membrane: blue-black
2.hypotonic (+): B – C , not hypotonic (-): A – D – E
31 2005 109 1A – 2C – 3B
32 2006 A24 B
33 2006 A27 E
34 2007 A17 E
35 2007 A18 B
Animal Anatomy and Physiology
36 2002 A36 B
37 2002 A36 C
38 2002 A39 B
39 2008 A29 D
40 2002 B22 1, 4, 6, 8
41 2008 A25 All are correct
42 2003 A26 D
43 2003 A27 E
44 2003 A28 B
45 2003 A29 C
46 2008 B15 S = liver, P = brain, R = thymus, Q = gonads
47 2003 B19 1D – 2A – 3E – 4B – 5F – 6C
48 2003 B22 A3 – B1 – C8 – D9
49 2005 11 B
50 2005 117 G
51 2001 B19 C
52 2004 114 1 – CG, 2 – B or C and H, 3 – AG, 4 – CG, 5 – DF, 6 - BG
53 2004 127 C
54 2004 129 D

Answer Key
55 2006 B22 A – 06, B – 07, C – 03, D – 01, E – 02, F – 05, G – 04
56 2008 B19 A b
B c
C true: b and d, false: a, c, e, andf
57 2006 B24 A – 03, B – 02, C – 05, D – 04, E – 01
58 2006 B30 A – 06, B – 02, C – 03, D – 05, E – 04, F – 01
59 2008 B18 Surface area/unit volume of the body: A > C > B > D
Total volume of blood in the bod: D > B > C > A
60 2001 A66 B
Ethology
61 2003 B24 1. 2
2. s = 1,7
3. t = 2,9
4. 4
5. chi-square = 6,0
6. df = 5
7. about 30%
8. 1
62 2005 17 B
63 2005 118 B
64 2005 119 C
65 2005 123 D
Genetics
66 2002 A45 A
67 2002 A46 B
68 2002 A47 C
69 2002 A54 D
70 2002 B26 1. 18,2 or 18,5 or 0,182 or 0,185 units
2. A. b+c/bc
B. b+c/bc+
71 2002 B28 1. p = 0,648
2. p = 0,646
72 2002 B29 1. a1a1 = 0, a1a2 = 0,3, a2a2 = 0,6
2. a2a2
73 2002 B30 problem 1. 1 = 0%, 2 = 50%, 3 = 0%
problem 2. maternel (1) = A, paternel (2) = D
74 2002 B32 1. 3 = JB alk/J
C alk
4 = JA alk /J
C alk
2. 11 %
75 2003 A37 C
76 2003 A38 D
77 2003 A41 B

Answer Key
78 2003 A43 D
79 2003 B26 P1: baby = B,
P2: baby = A,
P3: baby = AB,
P4: baby = O
80 2003 B28 O: 3024 – 36%,
A: 3780 – 45%,
B: 1092 – 13%,
AB: 504 – 6%
81 2003 B29 1. F1 = 18cm
2. F2: 9 phenotype classes
3. 10 + 12 + 14+ 16+ 18+ 20 + 22 + 24 + 26 cm
4. 70/256 or 27%
82 2006 A46 A
83 2006 A48 C
84 2006 A54 A
85 2006 A55 A
Ecology
86 2002 B35
1. 2x2 m: 100% X, 16% Y
2. 5x5 m: 100% X, 100% Y
87 2002 B36 1C – 2D – 3B – 4A – 5F – 6G – 7E
88 2002 B42 Correct: A – C – D – G, incorrect: B – E – F – H
89 2003 A51 A
90 2003 A47 1D – 2C – 3A
91 2003 B36 1. PS + R
2. option 4 (PS + R will increase).
92 2005 33 1A – 2E – 3C/D – 4C – 5A/B
93 2005 96 D
94 2006 A59 B
95 2006 A67 A
Biosystematics
96 2002 A36 C
97 2003 A60 A
98 2001 B39 I 1 – 3 – 6 - 8 II 10 – 4 - 5 III 7 – 9 - 2
99 2005 103 C
100 2006 A72 D