ic nlh 1 of 2 - newfoundland and labrador€nlh‐1 sunnyside ... ieee c57.106-2002 table 12...
TRANSCRIPT

IC‐NLH‐1 Sunnyside – Replace Equipment
Page 1 of 2
Q. As noted at page 1, lines 11‐13, of Hydro's Report on the Replacement of 1
Equipment Resulting from Sunnyside T1 Transformer Failure: 2
"On January 4, 2014 Sunnyside T1 transformer faulted, with the most probable 3
cause being a bushing failure that initiated inside the transformer. As a result of this 4
fault, a fire developed leading to the irreparable damage of the transformer and 5
associated equipment." 6
i) Has Hydro determined the cause of the "bushing failure"? If so, please provide 7
any reports, analysis or other documentation in which the cause of such "bushing 8
failure" is considered or analysed. 9
ii) If the cause or the "bushing failure" has not yet been determined, will Hydro 10
attempt to determine the cause of the "bushing failure" in the future? 11
iii) Are such bushings inspected/maintained regularly? If yes, please provide details 12
of the inspections/maintenance carried out on the subject bushing, including any 13
documentation/reports related to such inspection/maintenance. 14
iv) Is it possible that the cause of the "bushing failure" was lack of inspection and/or 15
maintenance of the bushing by Hydro? 16
17
18
A. i) Hydro has not determined the cause of the bushing failure. The transformer 19
Original Equipment Manufacturer (OEM), who investigated the cause of the failure 20
on behalf of Hydro, was unable to identify a cause with certainty and could only 21
indicate in its final report that: “Based on the internal inspection observations, all 22
the information available and the system analysis findings, it is concluded that most 23
probably the LV1 or LV2 bushing failed first which initiated the failure and resulting 24
fire.” See IC‐NLH‐1 Attachment 1 page 57. The explosion and/or fire resulting from 25
the failure destroyed the physical evidence that would have revealed the cause. 26
IC‐NLH‐1 Sunnyside – Replace Equipment
Page 2 of 2 ii) As indicated in part i) of this response, due to the physical evidence being 1
destroyed, Hydro will not be able to determine the cause of the bushing failure in 2
the future. 3
4
iii) Bushings are inspected/maintained regularly as a part of Hydro’s terminal 5
station visual inspections and Hydro’s transformer maintenance programs. The 6
latest visual inspection of the bushings for Sunnyside Transformer T1 was 7
completed in October 2013 (See IC‐NLH‐1 Attachment 2 for the completed form) 8
and no bushing concerns were noted. The data from the 2007 transformer 9
maintenance on Sunnyside Transformer T1, specifically the power factor testing of 10
the bushings, were reviewed during the Root Cause Investigation of System 11
Disturbances Analysis which was filed with the Board as a part of the March 24, 12
2014 Hydro Interim Report ‐ Review of Supply Disruptions and Rotating Outages ‐ 13
Volume II. These results are also contained in IC‐NLH‐1 Attachment 1, pages 33 and 14
34. The Root Cause Investigation of System Disturbances Analysis completed an 15
overall review of the events leading up to the January 2‐8, 2014 power system 16
disturbances, and included the fire at Sunnyside Transformer T1 with a review of 17
the maintenance data associated with this transformer and its bushings. 18
19
iv) The “Root Cause Investigation of System Disturbances on January 4 and 5, 2014” 20
(filed with the Board on March 24, 2014 as Schedule 8 of the Hydro Interim Report 21
under the Investigation and Hearing into Supply Issues and Power Outages on the 22
Island Interconnected System) did not identify the lack of inspection and/or 23
maintenance of the bushings as a cause of the failure, hence Hydro does not believe 24
that this is a cause of the failure. 25

560246 – NALCOR Design Study & Failure Investigation Rev 0 Page 1
DESIGN STUDY AND FAILURE INVESTIGATION FOR AUTO
TRANSFORMER
NALCOR
SERIAL # 289147
CANADIAN GENERAL ELECTRIC
PREPARED BY
ABB Inc. Transformer Remanufacturing &
Engineering Services (TRES) Brampton, ON Canada
ABB Project Number: 560246 Prepared by: Myra Mikhail, P.Eng
Senior Transformer Design Engineer James Li, P.Eng Senior Transformer Design Engineer Reviewed by: Mustafa Lahloub P.Eng Engineering Manager, TRES Brampton Approved by: Ed G. teNyenhuis, M.Eng, P.Eng. Technical Manager, TRES Canada
April 23, 2014; Rev0
Rev 0
IC-NLH-1, Attachment 1 Page 1 of 58, Sunnyside - Replace Equipment

560246 – NALCOR Design Study & Failure Investigation Rev 0 Page 2
Executive Summary A comprehensive short circuit and dielectric study of the design was performed for transformer SN 289147 that was manufactured in 1978 and failed in service in 2014. A review of maintenance data and DGA history was completed. A failure investigation and inspection was also performed.
The short circuit design study showed that the HV and LV windings are able to withstand short circuit forces while the TV winding end rings are not strong enough to withstand the short circuit forces.
The Dielectric study showed that all windings and cable clearances are within the acceptable design levels for the voltage stresses in this transformer.
The DGA, oil quality, transformer power factor and maintenance history of the four transformers were reviewed.
For SSD T1 – CGE 288147
The DGA results showed that: The concentration of Acetylene (C2H2) has been above IEEE C57.104-2008 guide condition
level 1 (2 ppm) since 1991, The level went up and down since then but was almost stable around the 10ppm. This could be oil leaking from the LTC diverter compartment.
The oil samples from this transformer have consistently shown high oxygen concentrations.
The oil physical results showed that: (Main tank) The interfacial tension values are around 28.0 dynes/cm2 which are below the 32 dynes/cm2
limit recommended by IEEE C57.106-2002 for ≥ 230kV transformers.
The oil physical results showed that: (LTC tank) The measured breakdown voltage (around 22.0 kV/mm for LTC-A,B,C) is below the minimum
requirement (28 kV/mm for 1 mm gap and 45 kV/mm for 2 mm gap) as outlined by IEEE C57.106-2002.
The oil samples taken from the LTC-A tank does show moisture content of more than 25 ppm.
The power factor measurements showed that: The winding power factor values (CH & CT) are below 0.5%. The C1 power factor and capacitance values for HV & LV bushings are all acceptable. The measured C2 capacitance for HV & LV bushings is higher than the nameplate values by
more than 10%. The hot collar tests for TV bushings and neutral bushing are below recommended limit. The Doble exciting current test are normal.
The maintenance history showed that: The winding resistance test for HV winding is consistent between phases, however the
measured resistance is much lower than the other sister units. The winding resistance tests for LV & TV windings are consistent between phases, and also
very close to the other sister units. The insulation resistance test was performed and results look normal in G-ohms, however the
polarization index is lower than the ABB suggested value of 2.0 for HV/LV to ground.
IC-NLH-1, Attachment 1 Page 2 of 58, Sunnyside - Replace Equipment

560246 – NALCOR Design Study & Failure Investigation Rev 0 Page 3
For SSD T4 – CGE 288838
The DGA results showed that: The concentration of Acetylene (C2H2) has been above IEEE C57.104-2008 guide condition
level 1 (2 ppm) since 1991, The level went up and down since then but was almost stable around the 5ppm. This could be oil leaking from the LTC diverter compartment.
The oil samples from this transformer have consistently shown high oxygen concentrations.
The oil physical results showed that: (Main tank) The latest measured breakdown voltage (52.0kV/mm) is above the minimum requirement
(30kV/mm) as outlined by Doble Engineering for 230kV transformers. The interfacial tension values are around 33.6 dynes/cm2 which is slightly above the 32
dynes/cm2 limit recommended by IEEE C57.106-2002 for 230kV transformers. Lower values may indicate oil soluble contaminants and oxidation products in oil.
The measured Acid Numbers for the oil samples are all below the recommended limits. The measured power factor values at 25/100°C are all below the suggested limits. The moisture in oil is within the acceptable limits.
The oil physical results showed that: (LTC tank) The measured breakdown voltage (between 20.0 kV/mm and 21.0 kV/mm for LTC-A,B,C) is
below the minimum requirement (28 kV/mm for 1 mm gap and 45 kV/mm for 2 mm gap). IEEE C57.106-2002 Table 12 recommends that the maximum limit of water content in oil for
LTC is not to exceed 25 ppm. The oil samples taken from the LTC tank show moisture content much less than 25 ppm.
The power factor measurements showed that: The winding power factor value CH is below the allowed limit, but CT is above 0.5%. The C1 power factor and capacitance values for HV & LV bushings are all acceptable. The measured C2 capacitance for HV & LV bushings is higher than the nameplate values. This
needs to be compared to initial benchmark test results. The hot collar tests for TV bushings and neutral bushing are below recommended limit. The Doble exciting current test are normal.
The maintenance history showed that: The winding resistance test for HV & LV & TV windings is consistent between phases. The ratio test was not performed. The core Megger test was performed and result looks normal. The insulation resistance test was performed and results look normal in G-ohms however the
polarization index is lower than the ABB suggested value of 2.0.
For STB T1 – CGE 288894
The DGA results showed that: The concentration of Acetylene (C2H2) has been below IEEE C57.104-2008 guide condition
level 1 (2 ppm) since 2009. However the DGA sample for the year 1979 shows high level of C2H2. This could be a bad oil sample.
The oil samples from this transformer have consistently shown high oxygen concentrations.
The oil physical results showed that: (Main tank) The latest measured breakdown voltage (62.0kV/mm) is above the minimum requirement
(50kV/mm) as outlined in IEEE C57.106-2002 for 230kV transformers with service aged insulating oil based on D1816-2mm method.
IC-NLH-1, Attachment 1 Page 3 of 58, Sunnyside - Replace Equipment

560246 – NALCOR Design Study & Failure Investigation Rev 0 Page 4
The interfacial tension values are around 30.4 dynes/cm2 which is below the suggested limits (32 dynes/cm2) recommended by IEEE C57.106-2002 for 230kV transformers. Lower values may indicate oil soluble contaminants and oxidation products in oil.
The measured Acid Numbers for the oil samples are all below the recommended limits. The measured power factor values at 25/100°C are all below the suggested limits. The moisture in oil is within the acceptable limits.
The oil physical results showed that: (LTC tank) The latest measured breakdown voltage is 30, 31 and 33 kV/mm for LTC-A,B,C. the suggested
limits is 28 kV/mm for 1 mm gap and 45 kV/mm for 2 mm gap as outlined by IEEE C57.106-2002.
IEEE C57.106-2002 Table 12 recommends that the maximum limit of water content in oil for LTC is not to exceed 25 ppm. The latest oil samples taken from the LTC tank show moisture content of less than 25 ppm.
The power factor measurements showed that: The winding power factor value CH & CT are below the allowed limit. The C1 power factor and capacitance values for HV & LV bushings are all acceptable. The measured C2 capacitance for HV & LV bushings is higher than the nameplate values. This
needs to be compared to initial benchmark test results. The hot collar tests for TV bushings and neutral bushing are below recommended limit The Doble exciting current test are normal.
The maintenance history showed that: The winding resistance test for HV & LV windings is consistent between phases. The deviation of the TV winding resistance between phases is 20%. The ratio test was not performed. The core Megger test was performed and result looks normal. The insulation resistance test was performed and results look normal in G-ohms however the
polarization index is lower than the ABB suggested value of 2.0 for HV to ground.
For STB T2 – CGE 288839
The DGA results showed that: The transformer has consistently shown very high concentrations (>20 ppm) of Acetylene
(C2H2) since 1986, which is far above the IEEE C57.104-2008 guide condition level 1 (2 ppm). The high concentration of C2H2 indicates that possible high energy arcing occurred somewhere inside the transformer. The other reason could be oil leaking from the LTC diverter compartment. The Acetylene levels are about 10ppm for few years now. This needs to be monitored closely. Any sudden increase of Acetylene needs to be investigated.
The oil samples from this transformer have consistently shown high oxygen concentrations
The oil physical results showed that: (Main tank) The latest measured breakdown voltage (68.0kV/mm) is above the minimum requirement
(50kV/mm) as outlined in IEEE C57.106-2002 for 230kV transformers with service aged insulating oil based on D1816-2mm method.
The interfacial tension values are around 28.7 dynes/cm2 which is below the suggested limits (32 dynes/cm2) recommended by IEEE C57.106-2002 for 230kV transformers.
The measured Acid Numbers for the oil samples are all below the recommended. The measured power factor values at 25/100°C are all below the suggested limits. The moisture in oil is within the acceptable limit.
IC-NLH-1, Attachment 1 Page 4 of 58, Sunnyside - Replace Equipment

560246 – NALCOR Design Study & Failure Investigation Rev 0 Page 5
The oil physical results showed that: (LTC tank) The latest measured breakdown voltage is 17, 21 and 23 kV/mm for LTC-A,B,C, which is below
the suggested minimum limits (28 kV/mm for 1 mm gap and 45 kV/mm for 2 mm gap). IEEE C57.106-2002 Table 12 recommends that the maximum limit of water content in oil for
LTC is not to exceed 25 ppm. The latest oil samples taken from the LTC tank show moisture content of more than 25 ppm for all three LTCs.
The power factor measurements showed that: The winding power factor value CH & CT are below the allowed limit. The C1 power factor and capacitance values for HV & LV bushings are all acceptable. The measured C2 capacitance for HV bushings is higher than the nameplate values by more
than 10%. This needs to be compared to initial benchmark test results and investigated. The measured C2 capacitance for LV bushings is higher than the nameplate values but within 10%.
The hot collar tests for TV bushings and neutral bushing are below recommended limit. The Doble exciting current test are normal.
The failure inspection of SSD T1 showed the following: All transformer bushings are damaged. The tap changer diverter cylinders of Phases 1 and 3 were separated from their aluminum
flanges at the cover. There was no indication that the fault originated in the tap changers compartment. No signs of flash over were seen in the cleats and leads including tap leads. All windings looked good with no signs of failure within the windings. It was not possible
however to see the internal windings. No sign of phase to phase failure in the windings was found during the inspection. The L1 & L3 bushing’s porcelain inside the transformer were shattered. Also marks of flashover
were seen on core clamp just opposite to Phase 1 LV bushing. For Phases 1 and 2 the leads connecting the LV bushings to the windings are disconnected. It
seems the two leads were mechanically pulled and cut at the crimp during the fault when the cover opened up. The insulation of the leads looks intact with no signs of failure.
Spitting and melting copper were seen on the LV windings conductor copper strands of phase one.
The system analysis during the fault showed that:
Between 9:03:21 and 9:04:49 something happened causing the MVAR difference between T1 & T4. Most probably T1 transformer was providing (compensating) the MVAR while there was a fault in T4.
There is no indication that a system disturbance caused the failure. There is no indication that the failure was initiated externally. There is no indication that there was a phase to phase failure.
Based on the internal inspection observations, all the information available and the system analysis findings, it is concluded that most probably the LV1 or LV2 bushing failed first which initiated the failure and resulting fire.
IC-NLH-1, Attachment 1 Page 5 of 58, Sunnyside - Replace Equipment
560246 – NALCOR Design Study & Failure Investigation Rev 0 Page 6
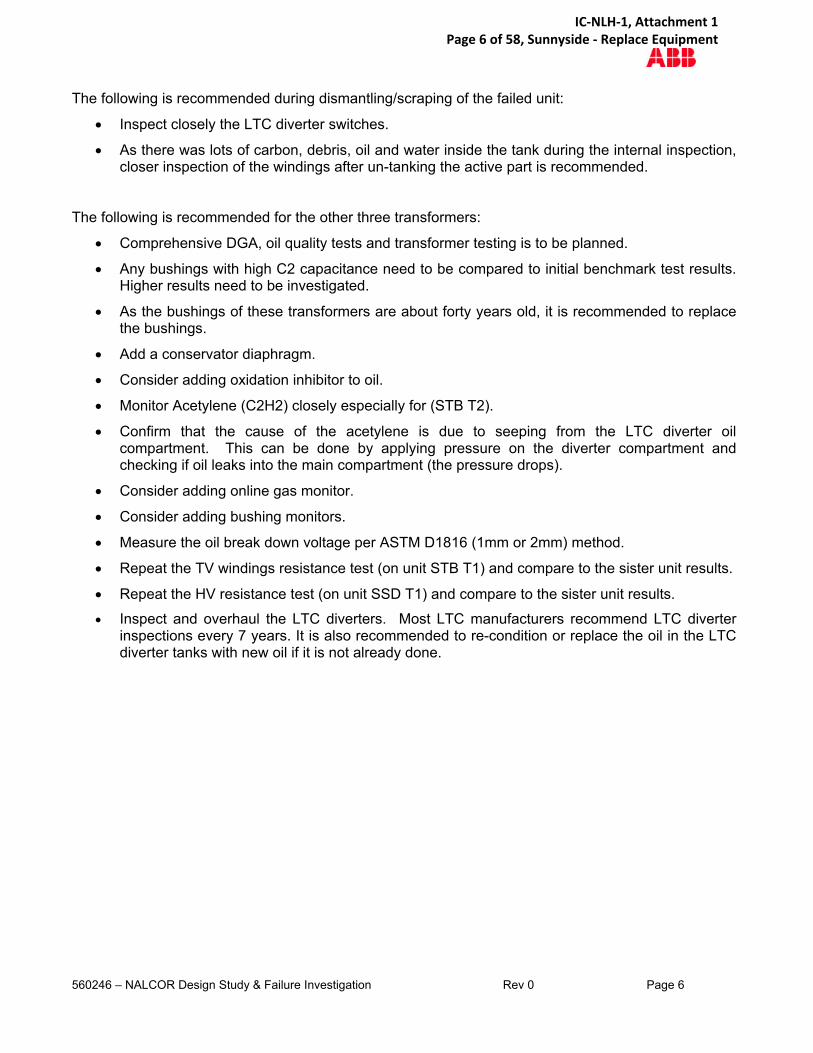
The following is recommended during dismantling/scraping of the failed unit:
Inspect closely the LTC diverter switches.
As there was lots of carbon, debris, oil and water inside the tank during the internal inspection, closer inspection of the windings after un-tanking the active part is recommended.
The following is recommended for the other three transformers:
Comprehensive DGA, oil quality tests and transformer testing is to be planned.
Any bushings with high C2 capacitance need to be compared to initial benchmark test results. Higher results need to be investigated.
As the bushings of these transformers are about forty years old, it is recommended to replace the bushings.
Add a conservator diaphragm.
Consider adding oxidation inhibitor to oil.
Monitor Acetylene (C2H2) closely especially for (STB T2).
Confirm that the cause of the acetylene is due to seeping from the LTC diverter oil compartment. This can be done by applying pressure on the diverter compartment and checking if oil leaks into the main compartment (the pressure drops).
Consider adding online gas monitor.
Consider adding bushing monitors.
Measure the oil break down voltage per ASTM D1816 (1mm or 2mm) method.
Repeat the TV windings resistance test (on unit STB T1) and compare to the sister unit results.
Repeat the HV resistance test (on unit SSD T1) and compare to the sister unit results.
Inspect and overhaul the LTC diverters. Most LTC manufacturers recommend LTC diverter inspections every 7 years. It is also recommended to re-condition or replace the oil in the LTC diverter tanks with new oil if it is not already done.
IC-NLH-1, Attachment 1 Page 6 of 58, Sunnyside - Replace Equipment

560246 – NALCOR Design Study & Failure Investigation Rev 0 Page 7
Table of Contents 1. INTRODUCTION................................................................................................................ 8 2. SHORT CIRCUIT STUDY ................................................................................................ 10 2.1. Procedure .................................................................................................................................................. 10 2.2. Windings Short Circuit Capability .......................................................................................................... 10 3. DIELECTRIC STUDY ...................................................................................................... 11 3.1. Procedure .................................................................................................................................................. 11 3.2. Major Winding insulation ......................................................................................................................... 12 4. DISSOLVED GAS IN OIL ANALYSIS (DGA) .................................................................. 12 4.1. SSD T1 - (CGE 289147) ............................................................................................................................. 12 4.2. SSD T4 – (CGE 288838) ............................................................................................................................ 16 4.3. STB T1 – (CGE 288894) ............................................................................................................................ 19 4.4. STB T2 – (CGE 288839) ............................................................................................................................ 22 5. GENERAL OIL QUALITY ................................................................................................ 25 5.1. SSD T1 – (CGE 289147) ............................................................................................................................ 25 2.1.1 Main Tank .................................................................................................................................................. 25 2.1.2 LTC Tank ................................................................................................................................................... 26 5.2. SSD T4 – (CGE 288838) ............................................................................................................................ 27 2.2.1 Main Tank .................................................................................................................................................. 27 2.2.2 LTC Tank ................................................................................................................................................... 28 5.3. STB T1 – (CGE 288894) ............................................................................................................................ 29 2.3.1 Main Tank .................................................................................................................................................. 29 2.3.2 LTC Tank ................................................................................................................................................... 30 5.4. STB T2 – (CGE 288839) ............................................................................................................................ 31 2.4.1 Main Tank .................................................................................................................................................. 31 2.4.2 LTC Tank ................................................................................................................................................... 32 6. TRANSFORMER POWER FACTOR MEASUREMENT .................................................. 33 6.1. SSD T1 – (CGE 289147) ............................................................................................................................ 33 6.2. SSD T4 – (CGE 288838) ............................................................................................................................ 35 6.3. STB T1 – (CGE 288894) ............................................................................................................................ 37 6.4. STB T2 – (CGE 288839) ............................................................................................................................ 39 7. MAINTENANCE HISTORY .............................................................................................. 41 7.1. SSD T1 – (CGE 289147) ............................................................................................................................ 41 7.2. SSD T4 – (CGE 288838) ............................................................................................................................ 43 7.3. STB T1 – (CGE 288894) ............................................................................................................................ 44 7.4. STB T2 – (CGE 288839) ............................................................................................................................ 45 8. INSPECTION (SSD T1) ................................................................................................... 46 8.1. Findings and Observations ..................................................................................................................... 46 9. SYSTEM ANALYSIS DURING FAULT ........................................................................... 53 10. CONCLUSIONS ........................................................................................................... 54 11. RECOMMENDATIONS ................................................................................................ 58
IC-NLH-1, Attachment 1 Page 7 of 58, Sunnyside - Replace Equipment
560246 – NALCOR Design Study & Failure Investigation Rev 0 Page 8
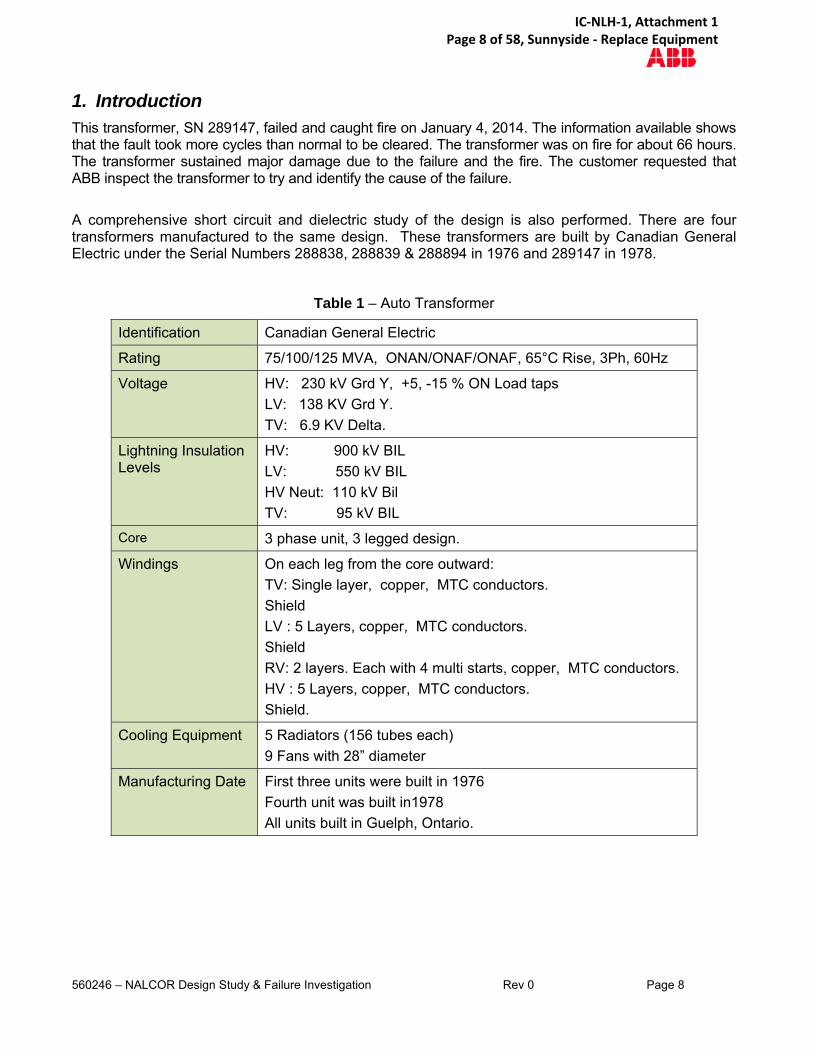
1. Introduction This transformer, SN 289147, failed and caught fire on January 4, 2014. The information available shows that the fault took more cycles than normal to be cleared. The transformer was on fire for about 66 hours. The transformer sustained major damage due to the failure and the fire. The customer requested that ABB inspect the transformer to try and identify the cause of the failure.
A comprehensive short circuit and dielectric study of the design is also performed. There are four transformers manufactured to the same design. These transformers are built by Canadian General Electric under the Serial Numbers 288838, 288839 & 288894 in 1976 and 289147 in 1978.
Table 1 – Auto Transformer
Identification Canadian General Electric
Rating 75/100/125 MVA, ONAN/ONAF/ONAF, 65°C Rise, 3Ph, 60Hz
Voltage HV: 230 kV Grd Y, +5, -15 % ON Load taps
LV: 138 KV Grd Y.
TV: 6.9 KV Delta.
Lightning Insulation Levels
HV: 900 kV BIL
LV: 550 kV BIL
HV Neut: 110 kV Bil
TV: 95 kV BIL
Core 3 phase unit, 3 legged design.
Windings On each leg from the core outward:
TV: Single layer, copper, MTC conductors.
Shield
LV : 5 Layers, copper, MTC conductors.
Shield
RV: 2 layers. Each with 4 multi starts, copper, MTC conductors.
HV : 5 Layers, copper, MTC conductors.
Shield.
Cooling Equipment 5 Radiators (156 tubes each)
9 Fans with 28” diameter
Manufacturing Date First three units were built in 1976
Fourth unit was built in1978
All units built in Guelph, Ontario.
IC-NLH-1, Attachment 1 Page 8 of 58, Sunnyside - Replace Equipment
560246 – NALCOR Design Study & Failure Investigation Rev 0 Page 9
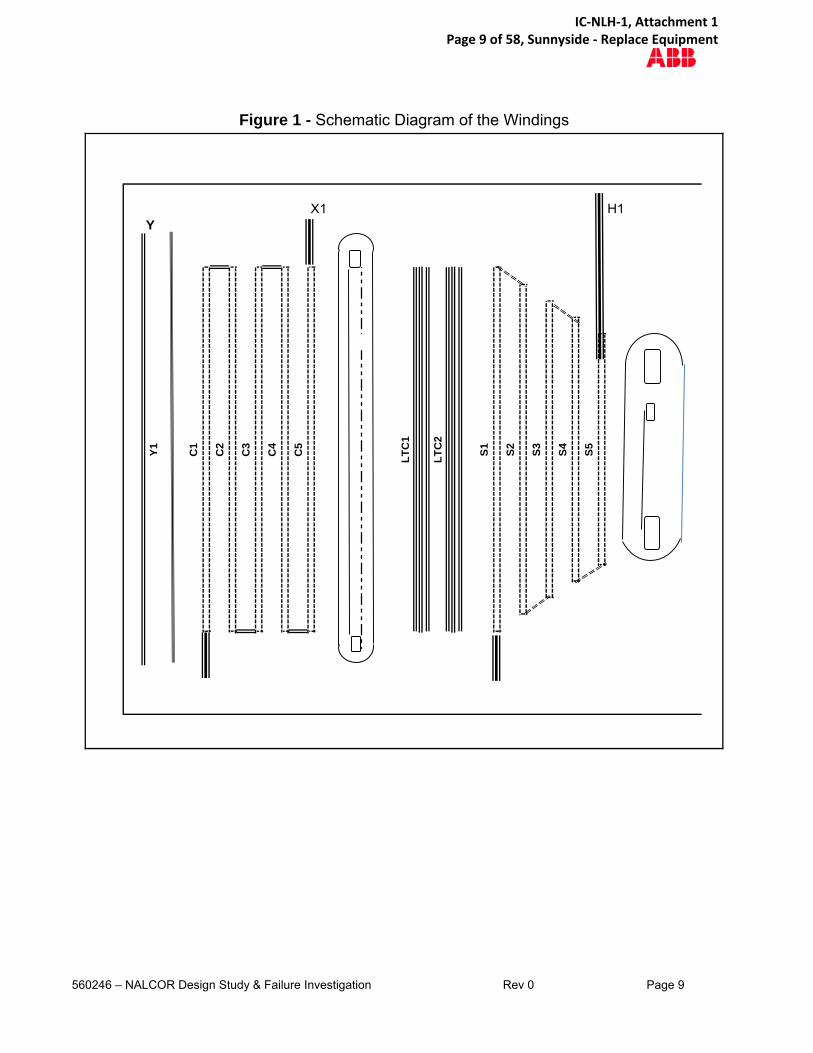
Figure 1 - Schematic Diagram of the Windings
X1 H1Y
Y1
C1
C2
C3
C4
C5
LT
C1
LT
C2
S1
S2
S3
S4
S5
IC-NLH-1, Attachment 1 Page 9 of 58, Sunnyside - Replace Equipment

560246 – NALCOR Design Study & Failure Investigation Rev 0 Page 10
2. Short Circuit Study A 3D FEM leakage flux program was used to model this design. This program calculates the flux pattern in the windings as well as the short circuit currents in each winding and the associated forces.
2.1. Procedure
System Impedance: From the original design, the system available MV is 3000 MVA on 230 KV side and 2000 MVA on the 138 kV side. This will translate into a 4.167% Impedance on the 230 kV side and 6.25% impedance on the 138 kV side on the 125 MVA base. These values are used in the analyses.
Short Circuit Calculation: The transformer short circuit forces were analyzed with the on load tap changer on rated, maximum and minimum tap positions.
The transformer core and windings were modeled on a computer program to enable the magnetic field and force calculations to be calculated. This program calculates the winding impedances between pairs of winding and uses the system impedances to calculate the short circuit currents in the transformer windings at the different tap positions. The program then calculates the axial and radial forces on each winding. In this case the forces are calculated on each layer of each winding with more than one layer.
These forces are than used in the design program. From the characteristics of the windings and the type of conductors used, the effect of the forces is derived and the allowable limits are calculated.
2.2. Windings Short Circuit Capability
From the program results, the forces were calculated and compared with the allowed limits.
Table 2 - Short Circuit Calculations for the TV Winding (single Layer)
TV Winding ( Single Layer) Calculated Allowed
Average radial inward stress Psi 19 278 39 347
Dynamic conductor tilting stress Psi 11249 12000
Axial pressure on end rings Psi 10500 6000
Note:
This winding is failing on axial forces. The winding pressboard end rings are not strong enough to sustain the axial force. The calculated force is higher than the strength of the end ring material. The other stresses on this winding are within the limits of the design.
IC-NLH-1, Attachment 1 Page 10 of 58, Sunnyside - Replace Equipment

560246 – NALCOR Design Study & Failure Investigation Rev 0 Page 11
Table 3 - Short Circuit Calculations for the Common Winding (Five Layers)
Common Winding ( Five Layers) Calculated Allowed
Average radial inward stress Psi 2899 24183
Dynamic conductor tilting stress Psi 3779 12000
Axial pressure on end rings Psi 5750 6000
Note:
This winding is adequately designed for the short forces for all the criteria that needed to be checked.
Table 4 - Short Circuit Calculations for the Tap Winding
Tap Winding ( Two Layers) Calculated Allowed
Average radial inward stress Psi 5805 22489
Dynamic conductor tilting stress Psi 1432 12000
Axial pressure on end rings Psi 3000 6000
Note:
This winding is adequately designed for the short forces for all the criteria that needed to be checked.
Table 5 - Short Circuit Calculations for the Series Winding (Five Layers)
Series Winding ( Five Layers) Calculated Allowed
Average radial outward stress Psi 11327 40000
Dynamic conductor tilting stress Psi 1763 2484
Axial pressure on end rings Psi 4000 6 000
Note:
This winding is adequately designed for the short forces for all the criteria that needed to be checked.
3. Dielectric Study The following is an insulation study of the transformer using ABB designs tools and standards.
3.1. Procedure
The design information was obtained from the archives and the transformer insulation clearances were checked against ABB standards.
For the purpose of the study, it was assumed that the quality of the transformer oil and insulation was acceptable for doing full level insulation testing as if the transformer was new.
IC-NLH-1, Attachment 1 Page 11 of 58, Sunnyside - Replace Equipment

560246 – NALCOR Design Study & Failure Investigation Rev 0 Page 12
3.2. Major Winding insulation
Below in Table 6 and Table 7 are shown actual and allowed calculated electrical clearance values for the major winding insulation. The calculation shows that the insulation arrangement is satisfactory.
Table 6 – Radial Clearances
Actual Minimum
Core Leg - TV Winding mm 9 9
TV Winding - Ground Shield mm 11 8
Ground Shield - Common Winding mm 10 10
Common Winding - Tap Winding mm 11 11
Tap Winding – Series Winding mm 28 17
Phase – Phase mm 189 88
Table 7 – Axial Clearances
Actual Minimum
TV Winding – Core Yokes mm 157 33
Common Winding - Core Yokes mm 152 121
Tap Winding – Core Yokes mm 152 121
Series Winding – Core Yokes mm 233 204
All Winding leads, including tap leads, clearances to each other and to ground are within the design allowed rules.
4. Dissolved Gas in Oil Analysis (DGA)
4.1. SSD T1 - (CGE 289147)
Below is the report of the DGA data for the period of 1991 to 2013. The gas signatures for this transformer are shown in Figure 2 to Figure 4.
The following is noted for the transformer DGA:
The concentration of Hydrogen (H2) has been well below IEEE C57.104-2008 guide condition level 1 since 1991, the highest level was 49 ppm.
The concentration of Methane (CH4) and Ethane (C2H6) have been steadily low for the period of the data provided. The Ethylene (C2H4) level is slightly above condition level one of the IEEE C57.104-2008 guide since 1991.
The concentration of Acetylene (C2H2) has been above IEEE C57.104-2008 guide condition level 2 since 1991. The level went up and down since then but was almost stable around the 10ppm. This could be oil leaking from LTC diverter compartment.
The carbon dioxide level has been below the IEEE C57.104-2008 guide condition level 2 for the time period provided. The carbon monoxide level is slightly above the IEEE C57.104-2008 guide condition level 1 since 1991. However the ratio of CO2/CO is between 4 and 9. The
IC-NLH-1, Attachment 1 Page 12 of 58, Sunnyside - Replace Equipment

560246 – NALCOR Design Study & Failure Investigation Rev 0 Page 13
normal CO2/CO ratios are typically in the range of 5-9. The ratio of the carbon oxides suggests that the concentrations are due to the normal aging process of the transformer.
Shown below in Figure 5 is a distribution plot of carbon oxide gas levels taken from a survey by the IEEE Transformer Committee using > 520,000 data records of units in service. This very large quantity of data is being used to revise the gas level limits in C57.104 (the famous Table 1 with condition 1 – 4 levels) – note that the levels will be increased. As can be seen, the 90th percentile levels are 700 ppm and 7500 for CO and CO2 respectively. Figure 6 shows the CO distribution by age categories and for 30 – 40 years category, the 90th percentile is about 700 ppm. The history gassing on this transformer was around 500 ppm and 3600 ppm for CO and CO2 respectively. Thus these levels are well below the 90th percentile of the IEEE data for the age of this unit.
The presence of large concentrations of oxygen in the oil can promote the formation of acids in the oil and cellulose and accelerate the aging rate of the cellulose insulation. It is recommended that the concentration of oxygen in the transformer be less than 2000 ppm (Refer to CIGRE report 323 – Aging of Cellulose in Mineral-Oil Insulated Transformers). The transformer maintenance record (09/21/2007) provided by the customer does not mention if the oil had ever been vacuum processed since 1991. The oil samples from this transformer have consistently shown very high oxygen concentrations (>20,000 ppm). The source of this high oxygen is the free-breathing oil conservator. To reduce the oxygen in the transformer oil and eliminate the uncertainty concerning the gas generation.
Figure 2 - Hydrocarbon Gas Concentrations
0
10
20
30
40
50
60
Co
nce
ntr
atio
n [
PP
M]
Hydrocarbon Gases (SSD T1)H2
CH4
C2H6
C2H4
C2H2
IC-NLH-1, Attachment 1 Page 13 of 58, Sunnyside - Replace Equipment
560246 – NALCOR Design Study & Failure Investigation Rev 0 Page 14
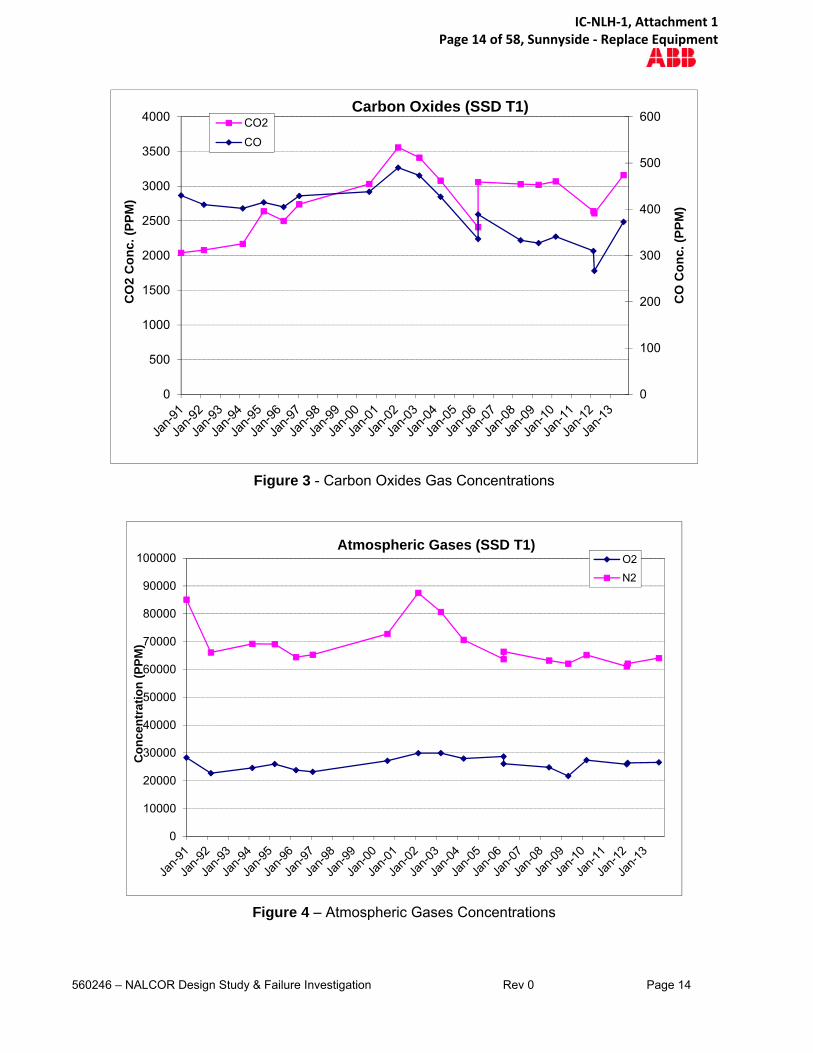
Figure 3 - Carbon Oxides Gas Concentrations
Figure 4 – Atmospheric Gases Concentrations
0
100
200
300
400
500
600
0
500
1000
1500
2000
2500
3000
3500
4000
CO
Co
nc.
(P
PM
)
CO
2 C
on
c. (
PP
M)
Carbon Oxides (SSD T1)CO2
CO
0
10000
20000
30000
40000
50000
60000
70000
80000
90000
100000
Co
nce
ntr
atio
n (
PP
M)
Atmospheric Gases (SSD T1)O2
N2
IC-NLH-1, Attachment 1 Page 14 of 58, Sunnyside - Replace Equipment

560246 – NALCOR Design Study & Failure Investigation Rev 0 Page 15
Figure 5 – IEEE Transformer Committee Carbon Oxide Survey Results
Figure 6 - IEEE Transformer Committee Carbon Oxide Survey Results (CO vs age)
IC-NLH-1, Attachment 1 Page 15 of 58, Sunnyside - Replace Equipment

560246 – NALCOR Design Study & Failure Investigation Rev 0 Page 16
4.2. SSD T4 – (CGE 288838)
Below is the report of the DGA data for the period of 1991 to 2013. The gas signatures for this transformer are shown in Figure 7 to Figure 9.
The following is noted for the transformer DGA:
The concentration of Hydrogen (H2) has been well below IEEE C57.104-2008 guide condition level 1 since 1991, the highest level is 30 ppm.
The concentration of Methane (CH4) and Ethane (C2H6) have been steadily low for the period of the data provided. The Ethylene (C2H4) level is slightly above condition level one of the IEEE C57.104-2008 guide since 1991.
The concentration of Acetylene (C2H2) has been above IEEE C57.104-2008 guide condition level 1 since 1991. The level went up and down since then but was almost stable around the 5ppm. This could be oil leaking from LTC diverter compartment.
The carbon dioxide level has been below the IEEE C57.104-2008 guide condition level 1 for the time period provided. The carbon monoxide level is slightly above the IEEE C57.104-2008 guide condition level 1 between 1996 and 2004, however the level became normal after 2004. The ratio of CO2/CO is between 5 and 10. The normal CO2/CO ratios are typically in the range of 5-9. The ratio of the carbon oxides suggests that the concentrations are due to the normal aging process of the transformer.
As can be seen from Figure 5 & 6, the 90th percentile levels are 700 ppm and 7500 for CO and CO2 respectively. The 90th percentile is about 700 ppm for the CO distribution by age categories and for 30 – 40 years category. The history gassing on this transformer was around 450 ppm and 3000 ppm for CO and CO2 respectively. Thus these levels are below the 90th percentile of the IEEE data for the age of this unit.
The presence of large concentrations of oxygen in the oil can promote the formation of acids in the oil and cellulose and accelerate the aging rate of the cellulose insulation. It is recommended that the concentration of oxygen in the transformer be less than 2000 ppm (Refer to CIGRE report 323 – Aging of Cellulose in Mineral-Oil Insulated Transformers). The transformer maintenance record (09/06/2012) provided by the customer does not mention if the oil had ever been vacuum processed since 1991. The oil samples from this transformer have consistently shown very high oxygen concentrations (>20,000 ppm) of oxygen. The source of this high oxygen is the free-breathing oil conservator. To reduce the oxygen in the transformer oil and eliminate the uncertainty concerning the gas generation, it is recommended to add a conservator diaphragm. The diaphragm prevents oil from coming in contact with the air. This will prevent moisture, excessive atmospheric gases from dissolving into the oil and it also helps to keep all gases generated by the transformer in oil for more accurate diagnostics.
IC-NLH-1, Attachment 1 Page 16 of 58, Sunnyside - Replace Equipment

560246 – NALCOR Design Study & Failure Investigation Rev 0 Page 17
Figure 7 - Hydrocarbon Gas Concentrations
Figure 8 - Carbon Oxides Gas Concentrations
0
5
10
15
20
25
30
35
40
45C
on
cen
trat
ion
[P
PM
]Hydrocarbon Gases (SSD T4)
H2
CH4
C2H6
C2H4
C2H2
0
50
100
150
200
250
300
350
400
450
500
0
500
1000
1500
2000
2500
3000
3500
CO
Co
nc.
(P
PM
)
CO
2 C
on
c. (
PP
M)
Carbon Oxides (SSD T4)CO2
CO
IC-NLH-1, Attachment 1 Page 17 of 58, Sunnyside - Replace Equipment

560246 – NALCOR Design Study & Failure Investigation Rev 0 Page 18
Figure 9 – Atmospheric Gases Concentrations
0
10000
20000
30000
40000
50000
60000
70000
80000
90000
100000C
on
cen
trat
ion
(P
PM
)
Atmospheric Gases (SSD T4)O2
N2
IC-NLH-1, Attachment 1 Page 18 of 58, Sunnyside - Replace Equipment

560246 – NALCOR Design Study & Failure Investigation Rev 0 Page 19
4.3. STB T1 – (CGE 288894)
Below is the report of the DGA data for the period of 1977 to 2013. The gas signatures for this transformer are shown in Figure 10 to Figure 12.
The following is noted for the transformer DGA:
The concentration of Hydrogen (H2) has been well below IEEE C57.104-2008 guide condition level 1 since 1977, the highest level is 75 ppm in 1979.
The concentration of Methane (CH4) and Ethane (C2H6) have been steadily low for the period of the data provided. The Ethylene (C2H4) level has been below condition level 1 of the IEEE C57.104-2008 guide since 1977, except one sample (67 ppm) in 2009.
The concentration of Acetylene (C2H2) has been below IEEE C57.104-2008 guide condition level 1 since 2009. However the DGA sample for the year 1979 shows high level of C2H2. This could be a bad oil sample.
The carbon dioxide level has been above the IEEE C57.104-2008 guide condition level 1 for the most of time period provided. The carbon monoxide level is above the IEEE C57.104-2008 guide condition level 1 for most of time as well. However the ratio of CO2/CO is between 4 and 9. The normal CO2/CO ratios are typically in the range of 5-9. The ratio of the carbon oxides suggests that the concentrations are due to the normal aging process of the transformer.
As can be seen from Figure 5 & 6, the 90th percentile levels are 700 ppm and 7500 for CO and CO2 respectively. The 90th percentile is about 700 ppm for the CO distribution by age categories and for 30 – 40 years category. The history gassing on this transformer was around 590 ppm and 4400 ppm for CO and CO2 respectively. Thus these levels are below the 90th percentile of the IEEE data for the age of this unit.
The presence of large concentrations of oxygen in the oil can promote the formation of acids in the oil and cellulose and accelerate the aging rate of the cellulose insulation. It is recommended that the concentration of oxygen in the transformer be less than 2000 ppm (Refer to CIGRE report 323 – Aging of Cellulose in Mineral-Oil Insulated Transformers). The transformer maintenance record (09/22/2011) provided by the customer does not mention if the oil had ever been vacuum processed since 1991. The oil samples from this transformer have consistently shown very high oxygen concentrations (>20,000 ppm) of oxygen. The source of this high oxygen is the free-breathing oil conservator. To reduce the oxygen in the transformer oil and eliminate the uncertainty concerning the gas generation, it is recommended to add a conservator diaphragm. The diaphragm prevents oil from coming in contact with the air. This will prevent moisture, excessive atmospheric gases from dissolving into the oil and it also helps to keep all gases generated by the transformer in oil for more accurate diagnostics
IC-NLH-1, Attachment 1 Page 19 of 58, Sunnyside - Replace Equipment

560246 – NALCOR Design Study & Failure Investigation Rev 0 Page 20
Figure 10 - Hydrocarbon Gas Concentrations
Figure 11 - Carbon Oxides Gas Concentrations
0
10
20
30
40
50
60
70
80C
on
cen
trat
ion
[P
PM
]Hydrocarbon Gases (STB T1)
H2
CH4
C2H6
C2H4
C2H2
0
100
200
300
400
500
600
700
0
500
1000
1500
2000
2500
3000
3500
4000
4500
5000
CO
Co
nc.
(P
PM
)
CO
2 C
on
c. (
PP
M)
Carbon Oxides (STB T1)
CO2
CO
IC-NLH-1, Attachment 1 Page 20 of 58, Sunnyside - Replace Equipment

560246 – NALCOR Design Study & Failure Investigation Rev 0 Page 21
Figure 12 – Atmospheric Gases Concentrations
0
10000
20000
30000
40000
50000
60000
70000
80000
90000C
on
cen
trat
ion
(P
PM
)
Atmospheric Gases (STB T1)O2
N2
IC-NLH-1, Attachment 1 Page 21 of 58, Sunnyside - Replace Equipment

560246 – NALCOR Design Study & Failure Investigation Rev 0 Page 22
4.4. STB T2 – (CGE 288839)
Below is the report of the DGA data for the period of 1977 to 2013. The gas signatures for this transformer are shown in Figure 13 to Figure 15.
The following is noted for the transformer DGA:
The concentration of Hydrogen (H2) has been well below IEEE C57.104-2008 guide condition level 1 since 1977, the highest level is 50 ppm in 1987.
The concentration of Methane (CH4) and Ethane (C2H6) have been steadily low for the period of the data provided. The Ethylene (C2H4) level has been in condition level 2 of the IEEE C57.104-2008 guide (50 ppm) since 2000.
The transformer has consistently shown high concentrations (>20 ppm) of Acetylene (C2H2) since 1986, which is far above the IEEE C57.104-2008 guide condition level 2. The high concentration of C2H2 indicates that possible high energy arcing occurred somewhere inside the transformer. The other reason could be oil leaking from LTC diverter compartment. The Acetylene levels are about 10ppm foe few years now. This needs to be monitored closely. Any sudden increase of Acetylene needs to be investigated.
The carbon dioxide level has been above the IEEE C57.104-2008 guide condition level 1 for the most of time period provided. The carbon monoxide level is above the IEEE C57.104-2008 guide condition level 1 for most of time as well. However the ratio of CO2/CO is between 5 and 10. The normal CO2/CO ratios are typically in the range of 5-9. The ratio of the carbon oxides suggests that the concentrations are due to the normal aging process of the transformer.
As can be seen from Figure 5 & 6, the 90th percentile levels are 700 ppm and 7500 for CO and CO2 respectively. The 90th percentile is about 700 ppm for the CO distribution by age categories and for 30 – 40 years category. The history gassing on this transformer was around 560 ppm and 5500 ppm for CO and CO2 respectively. Thus these levels are below the 90th percentile of the IEEE data for the age of this unit.
The presence of large concentrations of oxygen in the oil can promote the formation of acids in the oil and cellulose and accelerate the aging rate of the cellulose insulation. It is recommended that the concentration of oxygen in the transformer be less than 2000 ppm (Refer to CIGRE report 323 – Aging of Cellulose in Mineral-Oil Insulated Transformers). It is unknown if the oil had ever been vacuum processed since 1977. The oil samples from this transformer have consistently shown very high oxygen concentrations (>20,000 ppm) of oxygen. The source of this high oxygen is the free-breathing oil conservator. To reduce the oxygen in the transformer oil and eliminate the uncertainty concerning the gas generation, it is recommended to add a conservator diaphragm. The diaphragm prevents oil from coming in contact with the air. This will prevent moisture, excessive atmospheric gases from dissolving into the oil and it also helps to keep all gases generated by the transformer in oil for more accurate diagnostics
IC-NLH-1, Attachment 1 Page 22 of 58, Sunnyside - Replace Equipment

560246 – NALCOR Design Study & Failure Investigation Rev 0 Page 23
Figure 13 - Hydrocarbon Gas Concentrations
Figure 14 - Carbon Oxides Gas Concentrations
0
10
20
30
40
50
60
70
80
90C
on
cen
trat
ion
[P
PM
]Hydrocarbon Gases (STB T2)
H2
CH4
C2H6
C2H4
C2H2
0
100
200
300
400
500
600
0
1000
2000
3000
4000
5000
6000
CO
Co
nc.
(P
PM
)
CO
2 C
on
c. (
PP
M)
Carbon Oxides (STB T2
CO2
CO
IC-NLH-1, Attachment 1 Page 23 of 58, Sunnyside - Replace Equipment

560246 – NALCOR Design Study & Failure Investigation Rev 0 Page 24
Figure 15 – Atmospheric Gases Concentrations
0
10000
20000
30000
40000
50000
60000
70000
80000
90000
100000C
on
cen
trat
ion
(P
PM
)
Atmospheric Gases (STB T2)O2
N2
IC-NLH-1, Attachment 1 Page 24 of 58, Sunnyside - Replace Equipment

560246 – NALCOR Design Study & Failure Investigation Rev 0 Page 25
5. General Oil Quality
5.1. SSD T1 – (CGE 289147)
2.1.1 Main Tank
Below is the report of the oil quality data results from 2009 to 2013. The history of the oil quality data measured for this transformer is shown in Table 8.
The following can be observed:
The latest measured breakdown voltage (52.0 kV/mm on 09/11/2013) is above the minimum requirement (30kV/mm) as outlined by Doble Engineering for ≥ 230kV transformers with service aged insulating oil based on D877 method. However ASTM D1816-97 is recommended for testing fluid that is being processed into transformers and load tap changers. The gap distance standard settings are 1 mm and 2 mm.
The interfacial tension values are around 28.0 dynes/cm2 which are below the 32 dynes/cm2
limit recommended by IEEE C57.106-2002 for ≥ 230kV transformers. Lower values may indicate oil soluble contaminants and oxidation products in oil.
The oxidation inhibitor values were not measured since 2009. The acceptable range is between 0.08 and 0.30%. Oxygen inhibitors are helpful to minimize the effects of oxidation of oil. The first choice of attack by oxygen in the oil is the inhibitor molecules. This keeps the oil free from oxidation and its harmful by-products. As transformer ages, the oxidation inhibitor is used up and need to be replaced.
The measured Acid Numbers for the oil samples in the past years are all below the recommended limits (0.10 mg KOH/g) by IEEE C57.106-2002 for ≥ 230kV transformers.
The measured power factor values at 25/100°C are all below the suggested limits as outlined in IEEE C57.106-2002 for continue use of service-aged insulating oil.
IEEE C57.106-2002 Table 5 recommends that the maximum limit of water content in oil for
230kV transformers is not to exceed 10 ppm or 5% saturation at 50ºC. The oil samples taken from the main tank show moisture content of less than 10 ppm.
Table 8 - Oil Quality Data (Main Tank)
Sample Date Fluid Temp
(oC)
Dielectric Breakdown
D877
(kV)
Acid Number D974
(mg KOH/g)
Interfacial Tension
D971
(dynes/cm)
Visual Condition
D1524
Power Factor
D924 (%)
25°C / 100 C
Water
(ppm)
%
Satur.
Inhibitor
(%)
05/05/2009 30 55 0.03 28.6 Clear 0.062 1.38 2 2 -
03/22/2010 25 45 0.03 27.8 Clear 0.035 1.28 5 7 -
02/24/2012 20 59 0.03 26.9 Clear 0.123 2.62 2 4 -
03/13/2012 20 49 0.03 27.5 Clear 0.115 3.28 2 4 -
09/11/2013 35 52 0.03 28.1 Clear 0.166 2.94 3 3 -
IC-NLH-1, Attachment 1 Page 25 of 58, Sunnyside - Replace Equipment

560246 – NALCOR Design Study & Failure Investigation Rev 0 Page 26
2.1.2 LTC Tank
Below is the report of the LTC oil quality data results for 2007, 2008 and 2012. The oil quality test is not available for LTC-B,C in 2007. The history of the oil quality data measured for LTC-A,B,C is shown in Table 9 below.
The following can be observed:
The measured breakdown voltage (around 22.0 kV/mm for LTC-A,B,C) is below the minimum requirement (28 kV/mm for 1 mm gap and 45 kV/mm for 2 mm gap) as outlined by IEEE C57.106-2002 for LTC mounted at line end with ≥ 69 kV rating and for service aged insulating oil in LTC based on D1816 method. However the oil test reports do not mention gap distance. (1 mm or 2 mm). If the dielectric strength of the oil drops below the suggested values given in IEEE C57.106-2002, the oil should be reconditioned or changed.
The interfacial tension values are around 36.0 dynes/cm2. However IEEE C57.106-2002 does not specify any IFT limits for continued use of service aged insulating oil for load tap changers.
The measured Acid Numbers for the oil samples are all below 0.10 mg KOH/g. However IEEE C57.106-2002 does not specify any Acid number limits for load tap changers
IEEE C57.106-2002 Table 12 recommends that the maximum limit of water content in oil for LTC is not to exceed 25 ppm. The oil samples taken from the LTC-A tank does show moisture content of more than 25 ppm. If the water content exceeds the values given in IEEE C57.106-2002, the oil should be reconditioned or changed.
Table 9 - Oil Quality Data (LTC Tank)
Sample Date LTC ID Fluid Temp.
(oC)
Dielectric Breakdown D1816 (kV)
Acid Number D974
(mg KOH/g)
Interfacial Tension D971
(dynes/cm)
Color #
D1500 Water
(ppm)
06/27/2007
A 30 14 0.012 35.0 <3.0 43
B - - - - - -
C - - - - - -
04/29/2008
A 45 25 0.016 36.3 <2.0 14
B 35 22 0.014 35.5 <2.5 13
C 35 22 0.016 36.8 <2.5 9
10/02/2012
A 35 22 0.011 38.7 <4.0 26
B 35 22 0.015 38.1 <2.5 16
C 35 23 0.014 38.3 <4.0 18
IC-NLH-1, Attachment 1 Page 26 of 58, Sunnyside - Replace Equipment
560246 – NALCOR Design Study & Failure Investigation Rev 0 Page 27
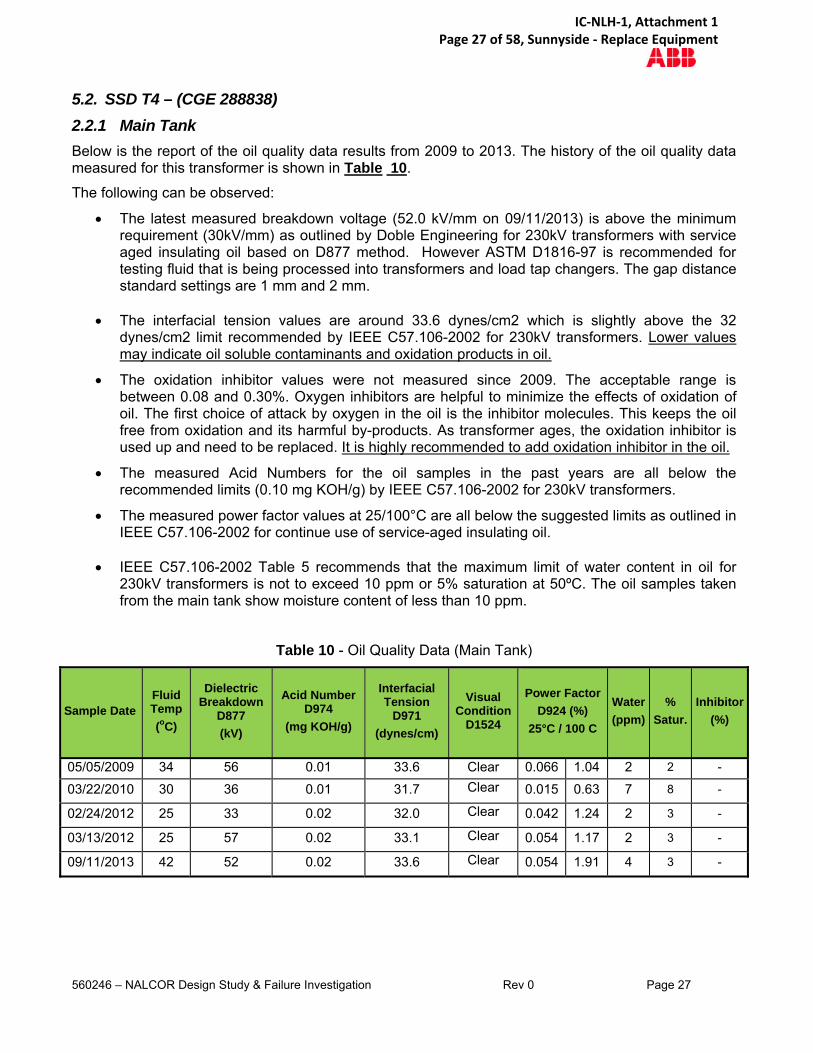
5.2. SSD T4 – (CGE 288838)
2.2.1 Main Tank
Below is the report of the oil quality data results from 2009 to 2013. The history of the oil quality data measured for this transformer is shown in Table 10.
The following can be observed:
The latest measured breakdown voltage (52.0 kV/mm on 09/11/2013) is above the minimum requirement (30kV/mm) as outlined by Doble Engineering for 230kV transformers with service aged insulating oil based on D877 method. However ASTM D1816-97 is recommended for testing fluid that is being processed into transformers and load tap changers. The gap distance standard settings are 1 mm and 2 mm.
The interfacial tension values are around 33.6 dynes/cm2 which is slightly above the 32
dynes/cm2 limit recommended by IEEE C57.106-2002 for 230kV transformers. Lower values may indicate oil soluble contaminants and oxidation products in oil.
The oxidation inhibitor values were not measured since 2009. The acceptable range is between 0.08 and 0.30%. Oxygen inhibitors are helpful to minimize the effects of oxidation of oil. The first choice of attack by oxygen in the oil is the inhibitor molecules. This keeps the oil free from oxidation and its harmful by-products. As transformer ages, the oxidation inhibitor is used up and need to be replaced. It is highly recommended to add oxidation inhibitor in the oil.
The measured Acid Numbers for the oil samples in the past years are all below the recommended limits (0.10 mg KOH/g) by IEEE C57.106-2002 for 230kV transformers.
The measured power factor values at 25/100°C are all below the suggested limits as outlined in IEEE C57.106-2002 for continue use of service-aged insulating oil.
IEEE C57.106-2002 Table 5 recommends that the maximum limit of water content in oil for
230kV transformers is not to exceed 10 ppm or 5% saturation at 50ºC. The oil samples taken from the main tank show moisture content of less than 10 ppm.
Table 10 - Oil Quality Data (Main Tank)
Sample Date Fluid Temp
(oC)
Dielectric Breakdown
D877
(kV)
Acid Number D974
(mg KOH/g)
Interfacial Tension
D971
(dynes/cm)
Visual Condition
D1524
Power Factor
D924 (%)
25°C / 100 C
Water
(ppm)
%
Satur.
Inhibitor
(%)
05/05/2009 34 56 0.01 33.6 Clear 0.066 1.04 2 2 -
03/22/2010 30 36 0.01 31.7 Clear 0.015 0.63 7 8 -
02/24/2012 25 33 0.02 32.0 Clear 0.042 1.24 2 3 -
03/13/2012 25 57 0.02 33.1 Clear 0.054 1.17 2 3 -
09/11/2013 42 52 0.02 33.6 Clear 0.054 1.91 4 3 -
IC-NLH-1, Attachment 1 Page 27 of 58, Sunnyside - Replace Equipment
560246 – NALCOR Design Study & Failure Investigation Rev 0 Page 28
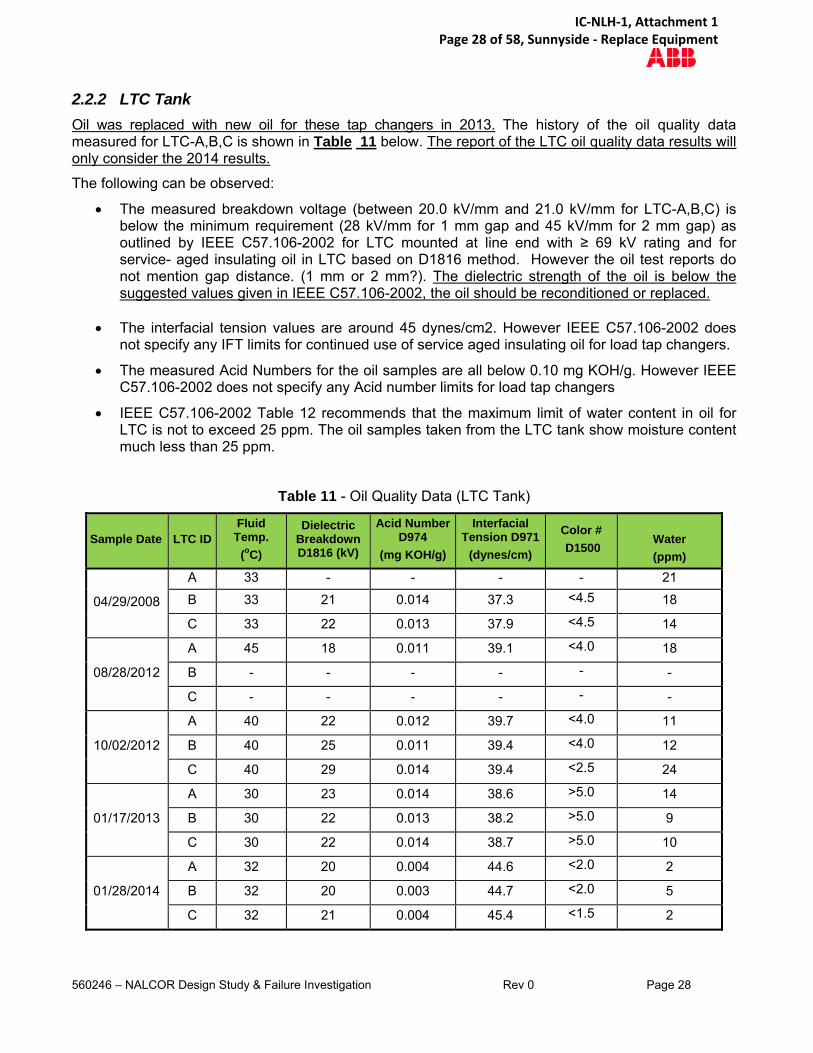
2.2.2 LTC Tank
Oil was replaced with new oil for these tap changers in 2013. The history of the oil quality data measured for LTC-A,B,C is shown in Table 11 below. The report of the LTC oil quality data results will only consider the 2014 results.
The following can be observed:
The measured breakdown voltage (between 20.0 kV/mm and 21.0 kV/mm for LTC-A,B,C) is below the minimum requirement (28 kV/mm for 1 mm gap and 45 kV/mm for 2 mm gap) as outlined by IEEE C57.106-2002 for LTC mounted at line end with ≥ 69 kV rating and for service- aged insulating oil in LTC based on D1816 method. However the oil test reports do not mention gap distance. (1 mm or 2 mm?). The dielectric strength of the oil is below the suggested values given in IEEE C57.106-2002, the oil should be reconditioned or replaced.
The interfacial tension values are around 45 dynes/cm2. However IEEE C57.106-2002 does not specify any IFT limits for continued use of service aged insulating oil for load tap changers.
The measured Acid Numbers for the oil samples are all below 0.10 mg KOH/g. However IEEE C57.106-2002 does not specify any Acid number limits for load tap changers
IEEE C57.106-2002 Table 12 recommends that the maximum limit of water content in oil for LTC is not to exceed 25 ppm. The oil samples taken from the LTC tank show moisture content much less than 25 ppm.
Table 11 - Oil Quality Data (LTC Tank)
Sample Date LTC ID Fluid Temp.
(oC)
Dielectric Breakdown D1816 (kV)
Acid Number D974
(mg KOH/g)
Interfacial Tension D971
(dynes/cm)
Color #
D1500 Water
(ppm)
04/29/2008
A 33 - - - - 21
B 33 21 0.014 37.3 <4.5 18
C 33 22 0.013 37.9 <4.5 14
08/28/2012
A 45 18 0.011 39.1 <4.0 18
B - - - - - -
C - - - - - -
10/02/2012
A 40 22 0.012 39.7 <4.0 11
B 40 25 0.011 39.4 <4.0 12
C 40 29 0.014 39.4 <2.5 24
01/17/2013
A 30 23 0.014 38.6 >5.0 14
B 30 22 0.013 38.2 >5.0 9
C 30 22 0.014 38.7 >5.0 10
01/28/2014
A 32 20 0.004 44.6 <2.0 2
B 32 20 0.003 44.7 <2.0 5
C 32 21 0.004 45.4 <1.5 2
IC-NLH-1, Attachment 1 Page 28 of 58, Sunnyside - Replace Equipment
560246 – NALCOR Design Study & Failure Investigation Rev 0 Page 29
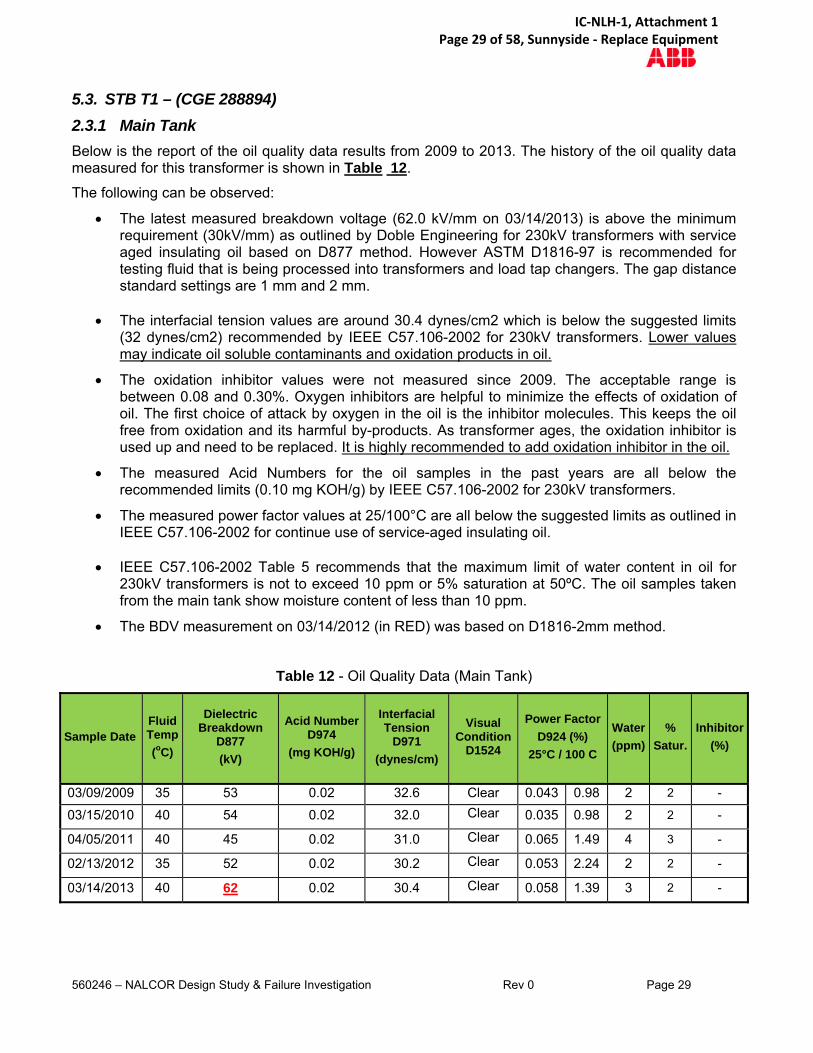
5.3. STB T1 – (CGE 288894)
2.3.1 Main Tank
Below is the report of the oil quality data results from 2009 to 2013. The history of the oil quality data measured for this transformer is shown in Table 12.
The following can be observed:
The latest measured breakdown voltage (62.0 kV/mm on 03/14/2013) is above the minimum requirement (30kV/mm) as outlined by Doble Engineering for 230kV transformers with service aged insulating oil based on D877 method. However ASTM D1816-97 is recommended for testing fluid that is being processed into transformers and load tap changers. The gap distance standard settings are 1 mm and 2 mm.
The interfacial tension values are around 30.4 dynes/cm2 which is below the suggested limits (32 dynes/cm2) recommended by IEEE C57.106-2002 for 230kV transformers. Lower values may indicate oil soluble contaminants and oxidation products in oil.
The oxidation inhibitor values were not measured since 2009. The acceptable range is between 0.08 and 0.30%. Oxygen inhibitors are helpful to minimize the effects of oxidation of oil. The first choice of attack by oxygen in the oil is the inhibitor molecules. This keeps the oil free from oxidation and its harmful by-products. As transformer ages, the oxidation inhibitor is used up and need to be replaced. It is highly recommended to add oxidation inhibitor in the oil.
The measured Acid Numbers for the oil samples in the past years are all below the recommended limits (0.10 mg KOH/g) by IEEE C57.106-2002 for 230kV transformers.
The measured power factor values at 25/100°C are all below the suggested limits as outlined in IEEE C57.106-2002 for continue use of service-aged insulating oil.
IEEE C57.106-2002 Table 5 recommends that the maximum limit of water content in oil for
230kV transformers is not to exceed 10 ppm or 5% saturation at 50ºC. The oil samples taken from the main tank show moisture content of less than 10 ppm.
The BDV measurement on 03/14/2012 (in RED) was based on D1816-2mm method.
Table 12 - Oil Quality Data (Main Tank)
Sample Date Fluid Temp
(oC)
Dielectric Breakdown
D877
(kV)
Acid Number D974
(mg KOH/g)
Interfacial Tension
D971
(dynes/cm)
Visual Condition
D1524
Power Factor
D924 (%)
25°C / 100 C
Water
(ppm)
%
Satur.
Inhibitor
(%)
03/09/2009 35 53 0.02 32.6 Clear 0.043 0.98 2 2 -
03/15/2010 40 54 0.02 32.0 Clear 0.035 0.98 2 2 -
04/05/2011 40 45 0.02 31.0 Clear 0.065 1.49 4 3 -
02/13/2012 35 52 0.02 30.2 Clear 0.053 2.24 2 2 -
03/14/2013 40 62 0.02 30.4 Clear 0.058 1.39 3 2 -
IC-NLH-1, Attachment 1 Page 29 of 58, Sunnyside - Replace Equipment

560246 – NALCOR Design Study & Failure Investigation Rev 0 Page 30
2.3.2 LTC Tank
Oil was replaced with new oil for these tap changers in 2011. No data is available with the new oil. Below is the report of the LTC oil quality data results from 2007 to 2010. The history of the oil quality data measured for LTC-A,B,C is shown in Table 13 below.
The following can be observed:
The latest measured breakdown voltage is 30, 31 and 33 kV/mm for LTC-A,B,C. the suggested limits is 28 kV/mm for 1 mm gap and 45 kV/mm for 2 mm gap as outlined by IEEE C57.106-2002 for LTC mounted at line end with ≥ 69 kV rating and for service- aged insulating oil in LTC based on D1816 method. However the oil test reports do not mention gap distance. (1 mm or 2 mm?). If the dielectric strength of the oil drops below the suggested values given in IEEE C57.106-2002, the oil should be reconditioned or changed.
The interfacial tension values are around 35.0 dynes/cm2. However IEEE C57.106-2002 does not specify any IFT limits for continued use of service aged insulating oil for load tap changers.
The measured Acid Numbers for the oil samples are all below 0.10 mg KOH/g. However IEEE C57.106-2002 does not specify any Acid number limits for load tap changers
IEEE C57.106-2002 Table 12 recommends that the maximum limit of water content in oil for LTC is not to exceed 25 ppm. The latest oil samples taken from the LTC tank show moisture content of less than 25 ppm. If the water content exceeds the values given in IEEE C57.106-2002, the oil should be reconditioned or changed.
Note: The recorded temperature 22°C is much lower than the other phases.
Table 13 - Oil Quality Data (LTC Tank)
Sample Date LTC ID Fluid Temp.
(oC)
Dielectric Breakdown D1816 (kV)
Acid Number D974
(mg KOH/g)
Interfacial Tension D971
(dynes/cm)
Color #
D1500 Water
(ppm)
08/06/2007
Left 45 22 0.027 35.6 <3.5 28
Center 45 18 0.026 35.0 <3.5 29
Right 45 24 0.026 33.9 <3.5 12
07/18/2008
Left 22 14 0.016 35.1 <2.0 42
Center 72 14 0.016 34.4 <3.0 40
Right 72 14 0.015 35.0 <2.5 41
05/27/2010
Left - 31 0.016 35.5 <3.0 22
Center - 30 0.016 35.4 <3.5 15
Right - 33 0.016 35.7 <3.0 24
IC-NLH-1, Attachment 1 Page 30 of 58, Sunnyside - Replace Equipment
560246 – NALCOR Design Study & Failure Investigation Rev 0 Page 31
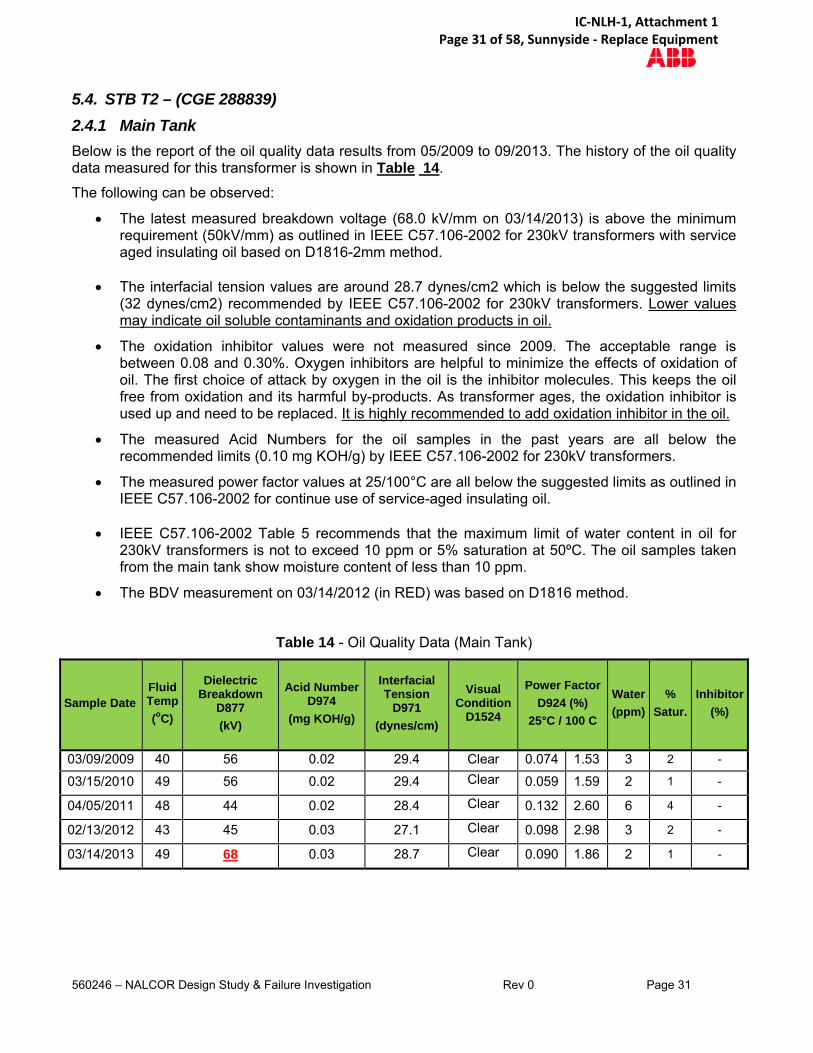
5.4. STB T2 – (CGE 288839)
2.4.1 Main Tank
Below is the report of the oil quality data results from 05/2009 to 09/2013. The history of the oil quality data measured for this transformer is shown in Table 14.
The following can be observed:
The latest measured breakdown voltage (68.0 kV/mm on 03/14/2013) is above the minimum requirement (50kV/mm) as outlined in IEEE C57.106-2002 for 230kV transformers with service aged insulating oil based on D1816-2mm method.
The interfacial tension values are around 28.7 dynes/cm2 which is below the suggested limits (32 dynes/cm2) recommended by IEEE C57.106-2002 for 230kV transformers. Lower values may indicate oil soluble contaminants and oxidation products in oil.
The oxidation inhibitor values were not measured since 2009. The acceptable range is between 0.08 and 0.30%. Oxygen inhibitors are helpful to minimize the effects of oxidation of oil. The first choice of attack by oxygen in the oil is the inhibitor molecules. This keeps the oil free from oxidation and its harmful by-products. As transformer ages, the oxidation inhibitor is used up and need to be replaced. It is highly recommended to add oxidation inhibitor in the oil.
The measured Acid Numbers for the oil samples in the past years are all below the recommended limits (0.10 mg KOH/g) by IEEE C57.106-2002 for 230kV transformers.
The measured power factor values at 25/100°C are all below the suggested limits as outlined in IEEE C57.106-2002 for continue use of service-aged insulating oil.
IEEE C57.106-2002 Table 5 recommends that the maximum limit of water content in oil for
230kV transformers is not to exceed 10 ppm or 5% saturation at 50ºC. The oil samples taken from the main tank show moisture content of less than 10 ppm.
The BDV measurement on 03/14/2012 (in RED) was based on D1816 method.
Table 14 - Oil Quality Data (Main Tank)
Sample Date Fluid Temp
(oC)
Dielectric Breakdown
D877
(kV)
Acid Number D974
(mg KOH/g)
Interfacial Tension
D971
(dynes/cm)
Visual Condition
D1524
Power Factor
D924 (%)
25°C / 100 C
Water
(ppm)
%
Satur.
Inhibitor
(%)
03/09/2009 40 56 0.02 29.4 Clear 0.074 1.53 3 2 -
03/15/2010 49 56 0.02 29.4 Clear 0.059 1.59 2 1 -
04/05/2011 48 44 0.02 28.4 Clear 0.132 2.60 6 4 -
02/13/2012 43 45 0.03 27.1 Clear 0.098 2.98 3 2 -
03/14/2013 49 68 0.03 28.7 Clear 0.090 1.86 2 1 -
IC-NLH-1, Attachment 1 Page 31 of 58, Sunnyside - Replace Equipment

560246 – NALCOR Design Study & Failure Investigation Rev 0 Page 32
2.4.2 LTC Tank
Below is the report of the LTC oil quality data results from 2007 to 2011. The history of the oil quality data measured for LTC-A,B,C is shown in Table 15 below.
The following can be observed:
The latest measured breakdown voltage is 17, 21 and 23 kV/mm for LTC-A,B,C. the suggested minimum limits is 28 kV/mm for 1 mm gap and 45 kV/mm for 2 mm gap as outlined by IEEE C57.106-2002 for LTC mounted at line end with ≥ 69 kV rating and for service- aged insulating oil in LTC based on D1816 method. However the oil test reports do not mention gap distance. (1 mm or 2 mm?). The dielectric strength of the oil is below the suggested values given in IEEE C57.106-2002, the oil should be reconditioned or replaced.
The interfacial tension values are around 34.0 dynes/cm2. However IEEE C57.106-2002 does not specify any IFT limits for continued use of service aged insulating oil for load tap changers.
The measured Acid Numbers for the oil samples are all below 0.10 mg KOH/g. However IEEE C57.106-2002 does not specify any Acid number limits for load tap changers
IEEE C57.106-2002 Table 12 recommends that the maximum limit of water content in oil for LTC is not to exceed 25 ppm. The latest oil samples taken from the LTC tank show moisture content of more than 25 ppm for all three LTCs. If the water content exceeds the values given in IEEE C57.106-2002, the oil should be reconditioned or changed.
Table 15 - Oil Quality Data (LTC Tank)
Sample Date LTC ID Fluid Temp.
(oC)
Dielectric Breakdown D1816 (kV)
Acid Number D974
(mg KOH/g)
Interfacial Tension D971
(dynes/cm)
Color #
D1500 Water
(ppm)
08/07/2007
Left 52 25 0.022 34.4 <3.5 16
Center 52 20 0.024 33.8 <3.5 12
Right 52 23 0.022 35.0 <3.5 19
07/16/2008
Left 42 17 0.015 35.5 <2.5 44
Center 42 22 0.015 34.5 <2.5 35
Right 42 25 0.018 32.6 <2.5 33
08/18/2011
Left 52 23 0.015 33.8 <2.5 34
Center 52 17 0.016 33.8 <2.5 32
Right 52 21 0.018 34.1 5.0 42
IC-NLH-1, Attachment 1 Page 32 of 58, Sunnyside - Replace Equipment

560246 – NALCOR Design Study & Failure Investigation Rev 0 Page 33
6. Transformer Power Factor Measurement
6.1. SSD T1 – (CGE 289147)
Doble test was available only for 2007. The overall test and bushings test results for this transformer are shown in Tables 16 below.
The following is observed:
The winding power factor values (CH & CT) are below 0.5%. The negative P.F for CHT is most likely because of the ground shield between the LV winding and the TV winding. Table 16-1
The C1 power factor and capacitance values for HV & LV bushings are all acceptable. IEEE Std C57.19.01-2000 specifies a limit of 0.5% for C1 power factor for oil impregnated paper insulated bushings. ABB recommends that the bushings be replaced whenever the power factor is double the nameplate value. Table 16-2
The measured C2 capacitance for HV & LV bushings is higher than the nameplate values by more than 10%. This needs to be compared to initial benchmark test results. Table 16-3
The hot collar tests for TV bushings and neutral bushing are below recommended limit (0.1 W at 10 kV). Table 16-4
The Doble exciting current test are normal. Table 16-5
Table 16-1 – Doble Overall Test Results (2007)
Table 16-2 – Doble Bushing Test Results (2007)
Bushing C1
IC-NLH-1, Attachment 1 Page 33 of 58, Sunnyside - Replace Equipment

560246 – NALCOR Design Study & Failure Investigation Rev 0 Page 34
Table 16-3 – Doble Bushing Test Results (2007)
Bushing C2
Table 16-4 – Bushing Test Results (2007)
Hot Collar Test
Table 16-5 – Exciting Current Test Results (2007)
Doble Exciting Current Test
IC-NLH-1, Attachment 1 Page 34 of 58, Sunnyside - Replace Equipment

560246 – NALCOR Design Study & Failure Investigation Rev 0 Page 35
6.2. SSD T4 – (CGE 288838)
Doble test was available only for 2012. The overall test and bushings test results for this transformer are shown in Tables 17 below.
The following is observed:
The winding power factor value CH is below the allowed limit, but CT is above 0.5%. Please compare to previous results. The negative P.F for CHT is most likely because of the ground shield between the LV winding and the TV winding. Table 17-1
The C1 power factor and capacitance values for HV & LV bushings are all acceptable. IEEE Std C57.19.01-2000 specifies a limit of 0.5% for C1 power factor for oil impregnated paper insulated bushings. ABB recommends that the bushings be replaced whenever the power factor is double the nameplate value. Table 17-2
The measured C2 capacitance for HV & LV bushings is higher than the nameplate values. This needs to be compared to initial benchmark test results. Table 17-3
The hot collar tests for TV bushings and neutral bushing are below recommended limit (0.1 W at 10 kV). Table 17-4
The Doble exciting current test are normal. Table 17-5
Table 17-1 – Doble Overall Test Results (2012)
Table 17-2 – Doble Bushing Test Results (2012)
Bushing C1
IC-NLH-1, Attachment 1 Page 35 of 58, Sunnyside - Replace Equipment

560246 – NALCOR Design Study & Failure Investigation Rev 0 Page 36
Table 17-3 – Doble Bushing Test Results (2012)
Bushing C2
Table 17-4 – Bushing Test Results (2012)
Hot Collar Test
Table 17-5 – Exciting Current Test Results (2012)
Doble Exciting Current Test
IC-NLH-1, Attachment 1 Page 36 of 58, Sunnyside - Replace Equipment
560246 – NALCOR Design Study & Failure Investigation Rev 0 Page 37
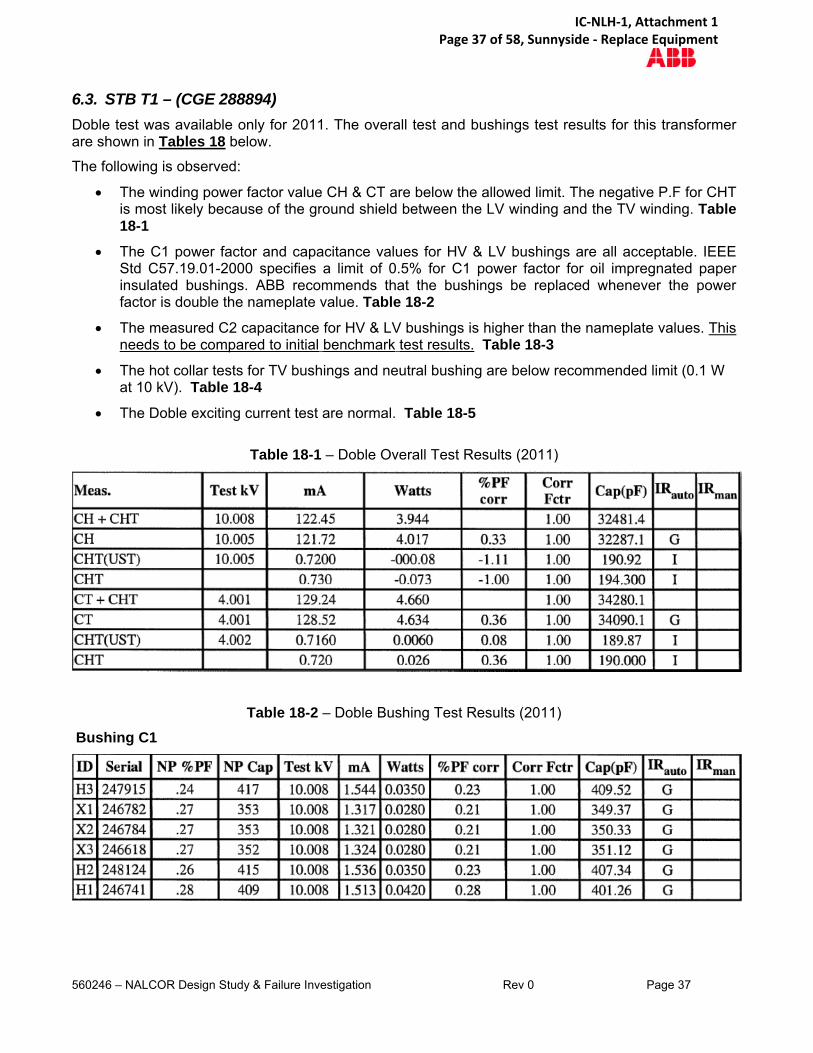
6.3. STB T1 – (CGE 288894)
Doble test was available only for 2011. The overall test and bushings test results for this transformer are shown in Tables 18 below.
The following is observed:
The winding power factor value CH & CT are below the allowed limit. The negative P.F for CHT is most likely because of the ground shield between the LV winding and the TV winding. Table 18-1
The C1 power factor and capacitance values for HV & LV bushings are all acceptable. IEEE Std C57.19.01-2000 specifies a limit of 0.5% for C1 power factor for oil impregnated paper insulated bushings. ABB recommends that the bushings be replaced whenever the power factor is double the nameplate value. Table 18-2
The measured C2 capacitance for HV & LV bushings is higher than the nameplate values. This needs to be compared to initial benchmark test results. Table 18-3
The hot collar tests for TV bushings and neutral bushing are below recommended limit (0.1 W at 10 kV). Table 18-4
The Doble exciting current test are normal. Table 18-5
Table 18-1 – Doble Overall Test Results (2011)
Table 18-2 – Doble Bushing Test Results (2011)
Bushing C1
IC-NLH-1, Attachment 1 Page 37 of 58, Sunnyside - Replace Equipment

560246 – NALCOR Design Study & Failure Investigation Rev 0 Page 38
Table 18-3 – Doble Bushing Test Results (2011)
Bushing C2
Table 18-4 – Bushing Test Results (2011)
Hot Collar Test
Table 18-5 – Exciting Current Test Results (2011)
Doble Exciting Current Test
IC-NLH-1, Attachment 1 Page 38 of 58, Sunnyside - Replace Equipment
560246 – NALCOR Design Study & Failure Investigation Rev 0 Page 39
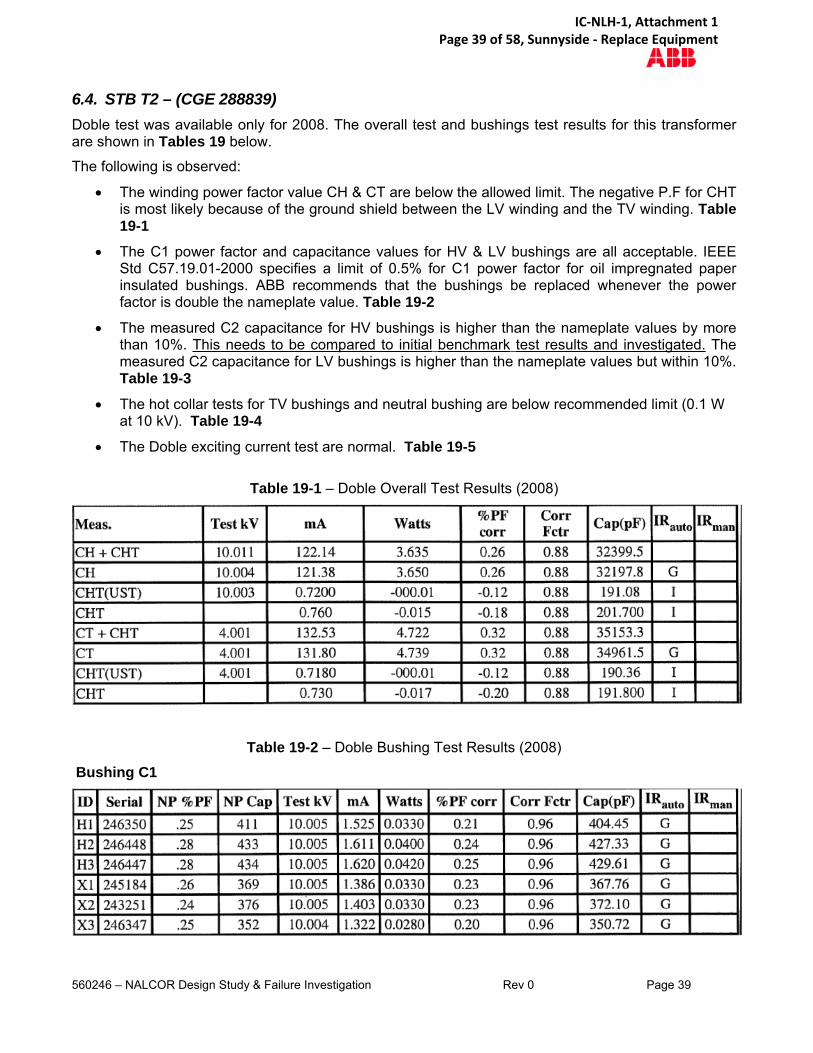
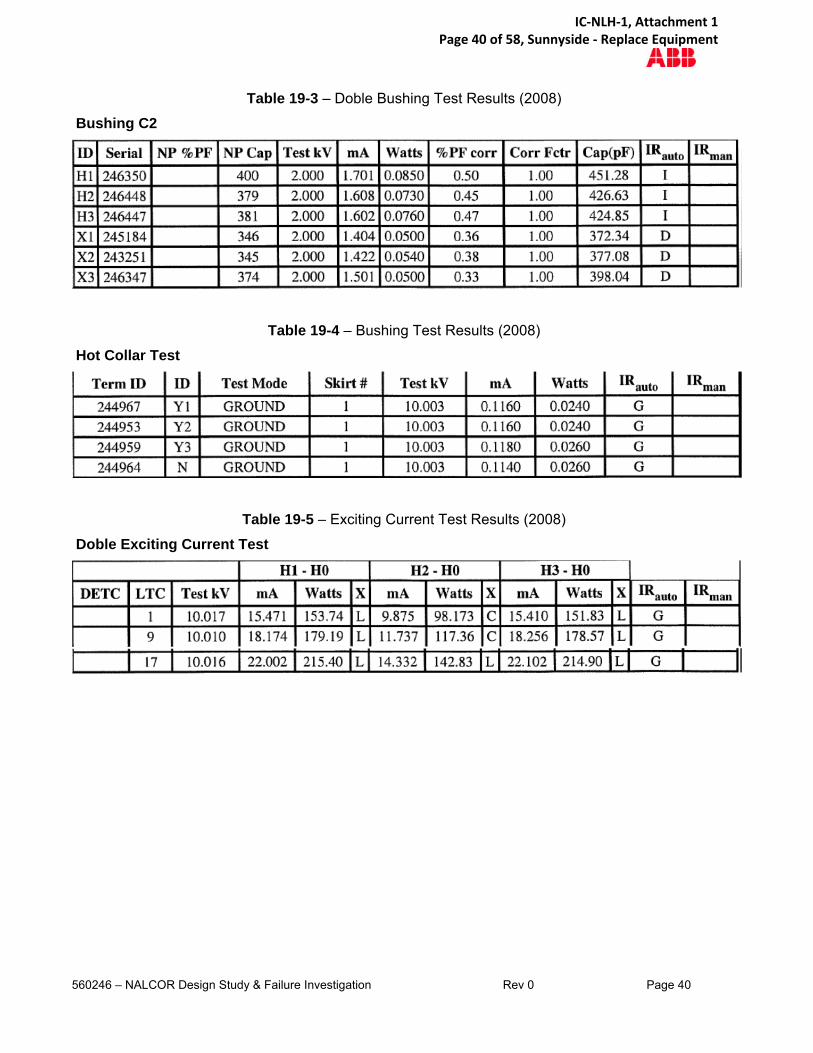
6.4. STB T2 – (CGE 288839)
Doble test was available only for 2008. The overall test and bushings test results for this transformer are shown in Tables 19 below.
The following is observed:
The winding power factor value CH & CT are below the allowed limit. The negative P.F for CHT is most likely because of the ground shield between the LV winding and the TV winding. Table 19-1
The C1 power factor and capacitance values for HV & LV bushings are all acceptable. IEEE Std C57.19.01-2000 specifies a limit of 0.5% for C1 power factor for oil impregnated paper insulated bushings. ABB recommends that the bushings be replaced whenever the power factor is double the nameplate value. Table 19-2
The measured C2 capacitance for HV bushings is higher than the nameplate values by more than 10%. This needs to be compared to initial benchmark test results and investigated. The measured C2 capacitance for LV bushings is higher than the nameplate values but within 10%. Table 19-3
The hot collar tests for TV bushings and neutral bushing are below recommended limit (0.1 W at 10 kV). Table 19-4
The Doble exciting current test are normal. Table 19-5
Table 19-1 – Doble Overall Test Results (2008)
Table 19-2 – Doble Bushing Test Results (2008)
Bushing C1
IC-NLH-1, Attachment 1 Page 39 of 58, Sunnyside - Replace Equipment
560246 – NALCOR Design Study & Failure Investigation Rev 0 Page 40
Table 19-3 – Doble Bushing Test Results (2008)
Bushing C2
Table 19-4 – Bushing Test Results (2008)
Hot Collar Test
Table 19-5 – Exciting Current Test Results (2008)
Doble Exciting Current Test
IC-NLH-1, Attachment 1 Page 40 of 58, Sunnyside - Replace Equipment

560246 – NALCOR Design Study & Failure Investigation Rev 0 Page 41
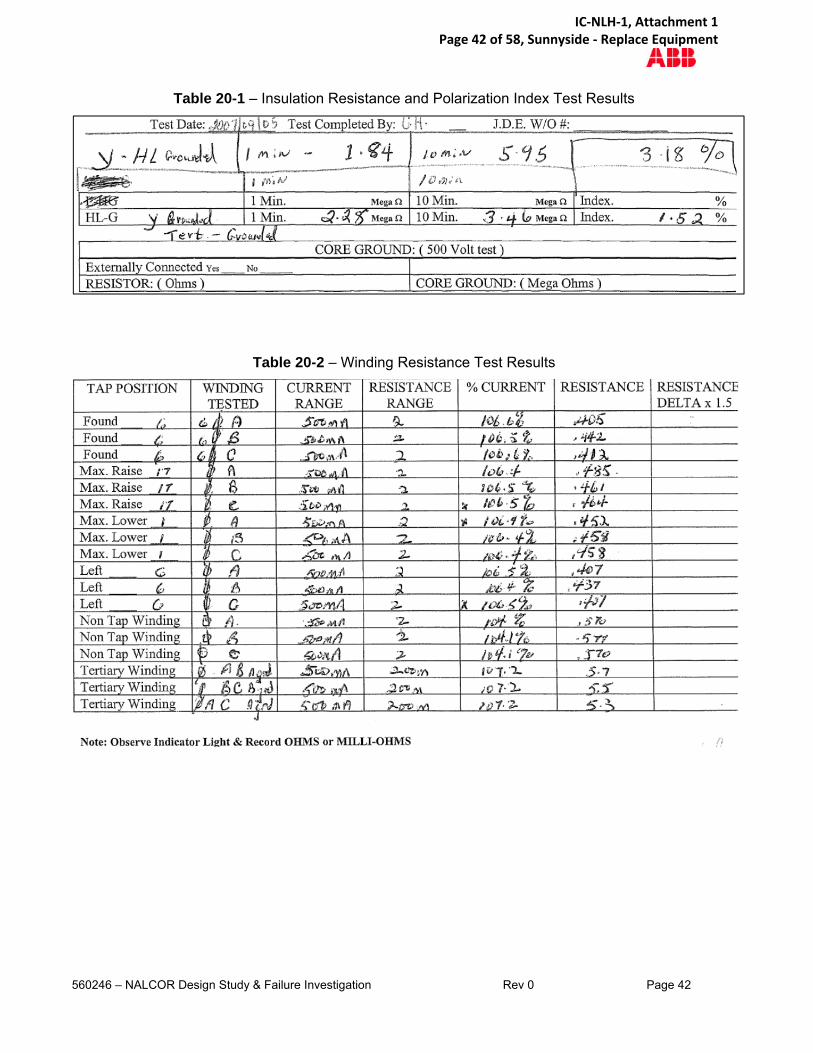
7. Maintenance History
7.1. SSD T1 – (CGE 289147)
Electrical testing was performed in this transformer on 2007. The tests included winding resistance, insulation resistance and polarization index test. The test results are shown in Table 20 below.
The winding resistance test for HV winding is consistent between phases, however the measured resistance is much lower than the other results for the sister units.
The winding resistance tests for LV & TV windings are consistent between phases, and also very close to the other sister units.
The ratio test and core Megger test was not performed.
The insulation resistance test was performed and results look normal in G-ohms, however the polarization index is lower than the ABB suggested value of 2.0 for HV/LV to ground.
IC-NLH-1, Attachment 1 Page 41 of 58, Sunnyside - Replace Equipment
560246 – NALCOR Design Study & Failure Investigation Rev 0 Page 42
Table 20-1 – Insulation Resistance and Polarization Index Test Results
Table 20-2 – Winding Resistance Test Results
IC-NLH-1, Attachment 1 Page 42 of 58, Sunnyside - Replace Equipment

560246 – NALCOR Design Study & Failure Investigation Rev 0 Page 43
7.2. SSD T4 – (CGE 288838)
Electrical testing was performed in 2012 including winding resistance, insulation resistance and polarization index test. The test results are shown in Table 21 below.
The winding resistance test for HV & LV & TV windings is consistent between phases.
The ratio test was not performed.
The core Megger test was performed and result looks normal.
The insulation resistance test was performed and results look normal in G-ohms however the polarization index is lower than the ABB suggested value of 2.0.
Table 21-1 – Insulation Resistance and Polarization Index Test Results
Table 21-2 – Winding Resistance Test Results
IC-NLH-1, Attachment 1 Page 43 of 58, Sunnyside - Replace Equipment
560246 – NALCOR Design Study & Failure Investigation Rev 0 Page 44
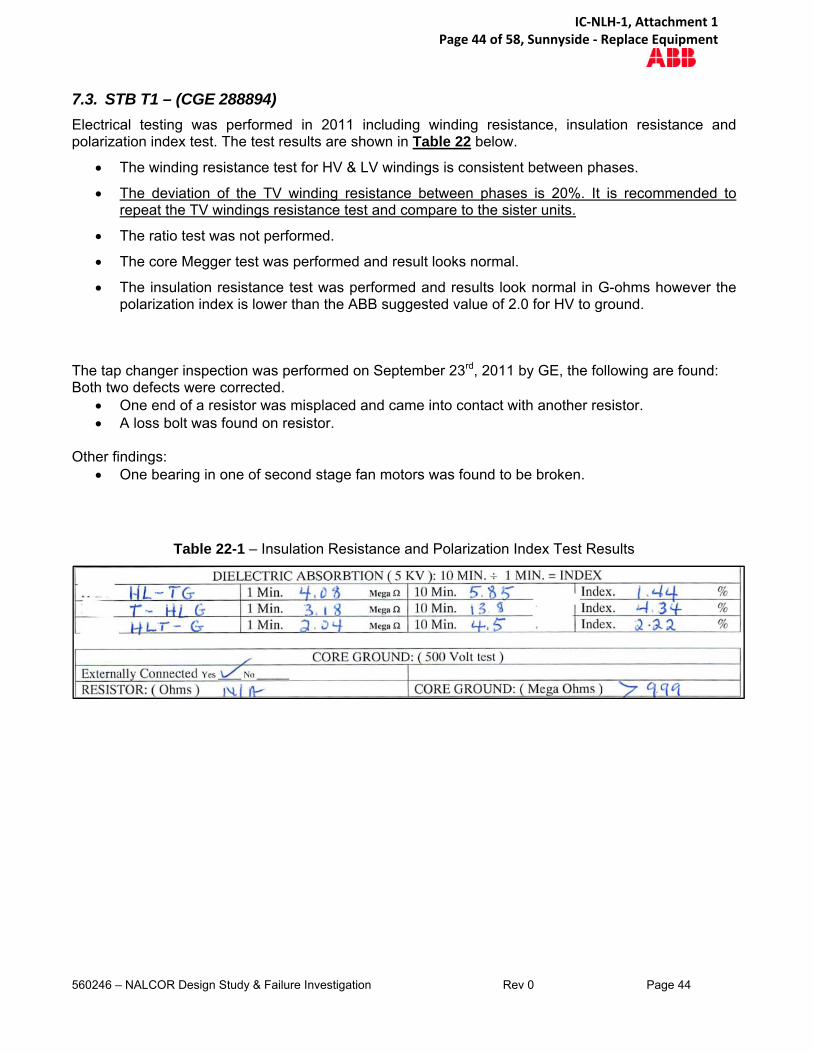
7.3. STB T1 – (CGE 288894)
Electrical testing was performed in 2011 including winding resistance, insulation resistance and polarization index test. The test results are shown in Table 22 below.
The winding resistance test for HV & LV windings is consistent between phases.
The deviation of the TV winding resistance between phases is 20%. It is recommended to repeat the TV windings resistance test and compare to the sister units.
The ratio test was not performed.
The core Megger test was performed and result looks normal.
The insulation resistance test was performed and results look normal in G-ohms however the polarization index is lower than the ABB suggested value of 2.0 for HV to ground.
The tap changer inspection was performed on September 23rd, 2011 by GE, the following are found: Both two defects were corrected.
One end of a resistor was misplaced and came into contact with another resistor. A loss bolt was found on resistor.
Other findings:
One bearing in one of second stage fan motors was found to be broken.
Table 22-1 – Insulation Resistance and Polarization Index Test Results
IC-NLH-1, Attachment 1 Page 44 of 58, Sunnyside - Replace Equipment

560246 – NALCOR Design Study & Failure Investigation Rev 0 Page 45
Table 22-2 – Winding Resistance Test Results
7.4. STB T2 – (CGE 288839)
The maintenance test history is not available for this unit.
IC-NLH-1, Attachment 1 Page 45 of 58, Sunnyside - Replace Equipment

560246 – NALCOR Design Study & Failure Investigation Rev 0 Page 46
8. Inspection (SSD T1)
The unit was inspected on January 21, 2014. Entry to the unit was made from the manhole located on the top cover between H2 and H3 bushings. Most of the other man holes and hand holes in the unit were opened also for inspection. It was possible to see and inspect all the active part components.
8.1. Findings and Observations
Because of risk of broken bushing porcelain falling; H3 and L2 bushing were removed before the inspection. L1 bushing was removed during the inspection.
Transformer cover was ripped open at the LV side. All the bolts on the LV side and some on the short sides were broken. See Photos 1&2&3&4
All transformer bushings are damaged. The most damaged are the H1, L2 and TV bushings. See Photos 5&6&7&8
The tap changer diverter cylinders of Phases 1 and 3 were separated from their aluminum flanges at the cover. This caused the tap changer assemblies, diverter and selector, to fall. The assemblies were found sitting at the bottom of the tap changer’s pocket. No signs of flashover were seen at the selector switches or tap cables. See Photos 9&10&11&12
No indication was found that the fault originated in the tap changers compartment. The fire left indications of burning on the tank wall to a level about a foot above the windings. See
Photo 13 No signs of flash over were seen in the cleats and leads including tap leads. All windings looked good with no signs of failure within the windings. See Photos 14&15 The L1 & L3 bushing’s porcelain inside the transformer were shattered. Also marks of flashover
were seen on core clamp just opposite to Phase 1 LV bushing. See Photos 16&17&18 No signs of phase to phase failure in the windings were found. Each of the LV bushings in this transformer has two leads connected to them. One lead is
connected to the winding and the other to the tap changer. See Sketch 1 For Phases 1 and 2 the leads connecting the LV bushings to the windings are disconnected. It
seems the two leads were mechanically pulled and cut at the crimp during the fault when the cover opened up. The insulation of the leads looks intact with no signs of failure. See Photos 19&20&21&22
Spitting and melting cooper were seen on the LV windings conductor copper strands of phase one. See Photo 23
IC-NLH-1, Attachment 1 Page 46 of 58, Sunnyside - Replace Equipment
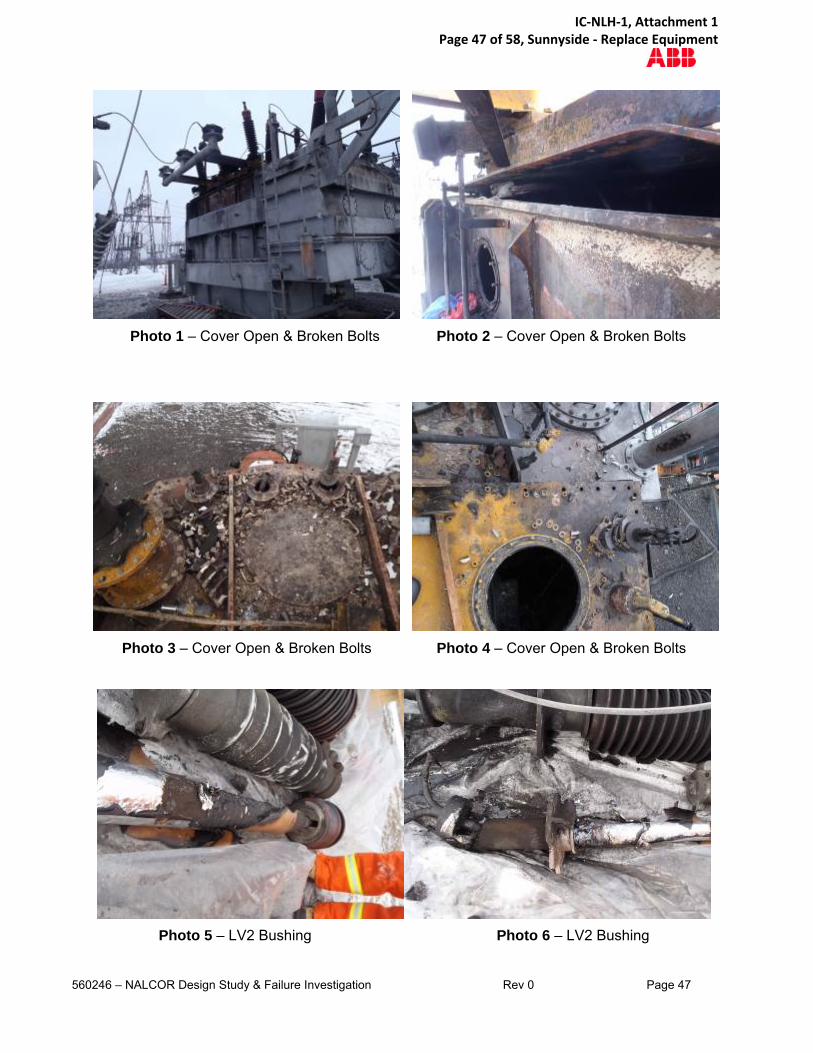
560246 – NALCOR Design Study & Failure Investigation Rev 0 Page 47
Photo 1 – Cover Open & Broken Bolts Photo 2 – Cover Open & Broken Bolts
Photo 3 – Cover Open & Broken Bolts Photo 4 – Cover Open & Broken Bolts
Photo 5 – LV2 Bushing Photo 6 – LV2 Bushing
IC-NLH-1, Attachment 1 Page 47 of 58, Sunnyside - Replace Equipment

560246 – NALCOR Design Study & Failure Investigation Rev 0 Page 48
Photo 7 – LV2 Bushing Porcelain Photo 8 – HV1 Bushing Porcelain
Photo 9 – LTC Compartment (Phases 2 & 3) Photo 10 – LTC Compartment (Phases 2 & 3)
IC-NLH-1, Attachment 1 Page 48 of 58, Sunnyside - Replace Equipment

560246 – NALCOR Design Study & Failure Investigation Rev 0 Page 49
Photo 11 – LTC Compartment (Phase 3) Photo 12 – LTC Compartment (Phases 2 & 1)
Photo 13 – Fire Line on Tank Wall & Core Clamp Photo 14 – Windings
IC-NLH-1, Attachment 1 Page 49 of 58, Sunnyside - Replace Equipment

560246 – NALCOR Design Study & Failure Investigation Rev 0 Page 50
Photo 15 – Windings Photo 16 – LV1 Bushing & Flashover marks
Photo 17 – LV1 Bushing Photo 18 – LV3 Bushing
IC-NLH-1, Attachment 1 Page 50 of 58, Sunnyside - Replace Equipment

560246 – NALCOR Design Study & Failure Investigation Rev 0 Page 51
Sketch 1: LV bushings Connected to the Windings & Tap Changers
Photo 19 – LV2 Winding Lead Broken Photo 20 – LV2 Bushing Lead Broken at the Crimp
Photo 21 – LV1 Winding Lead Broken Photo 22 – LV1 Bushing Lead Broken at the Crimp
IC-NLH-1, Attachment 1 Page 51 of 58, Sunnyside - Replace Equipment

560246 – NALCOR Design Study & Failure Investigation Rev 0 Page 52
Photo 23 – LV1 Winding Conductor Strand Copper Spitting
IC-NLH-1, Attachment 1 Page 52 of 58, Sunnyside - Replace Equipment

560246 – NALCOR Design Study & Failure Investigation Rev 0 Page 53
9. System Analysis during Fault
The system fault data was reviewed by an ABB power system expert and below are the comments: Between 9:03:21 and 9:04:49 something occurred causing the MVAR difference between
T1 & T4. Most probably T1 transformer was providing (compensating) the MVAR while there was a fault in T4. Detailed data for this time window is not available.
There is no indication that a system disturbance caused the failure, however we do not have detailed data to for the time before 9:04:57.
There is no indication that the failure was initiated externally. There is no indication that there was a phase to phase failure.
IC-NLH-1, Attachment 1 Page 53 of 58, Sunnyside - Replace Equipment

560246 – NALCOR Design Study & Failure Investigation Rev 0 Page 54
10. Conclusions
A comprehensive short circuit and dielectric study of the design was performed for transformer SN 289147 that was manufactured in 1978 and failed in service in 2014. A review of maintenance data and DGA history was completed. A failure investigation and inspection was also performed.
The short circuit design study showed that the HV and LV windings are able to withstand short circuit forces while the TV winding end rings are not strong enough to withstand the short circuit forces.
The Dielectric study showed that all windings and cable clearances are within the acceptable design levels for the voltage stresses in this transformer.
The DGA, oil quality, transformer power factor and maintenance history of the four transformers were reviewed.
For SSD T1 – CGE 288147
The DGA results showed that: The concentration of Acetylene (C2H2) has been above IEEE C57.104-2008 guide condition
level 1 (2 ppm) since 1991, The level went up and down since then but was almost stable around the 10ppm. This could be oil leaking from the LTC diverter compartment.
The oil samples from this transformer have consistently shown high oxygen concentrations.
The oil physical results showed that: (Main tank) The interfacial tension values are around 28.0 dynes/cm2 which are below the 32 dynes/cm2
limit recommended by IEEE C57.106-2002 for ≥ 230kV transformers.
The oil physical results showed that: (LTC tank) The measured breakdown voltage (around 22.0 kV/mm for LTC-A,B,C) is below the minimum
requirement (28 kV/mm for 1 mm gap and 45 kV/mm for 2 mm gap) as outlined by IEEE C57.106-2002.
The oil samples taken from the LTC-A tank does show moisture content of more than 25 ppm.
The power factor measurements showed that: The winding power factor values (CH & CT) are below 0.5%. The C1 power factor and capacitance values for HV & LV bushings are all acceptable. The measured C2 capacitance for HV & LV bushings is higher than the nameplate values by
more than 10%. The hot collar tests for TV bushings and neutral bushing are below recommended limit. The Doble exciting current test are normal.
The maintenance history showed that: The winding resistance test for HV winding is consistent between phases, however the
measured resistance is much lower than the other sister units. The winding resistance tests for LV & TV windings are consistent between phases, and also
very close to the other sister units. The insulation resistance test was performed and results look normal in G-ohms, however the
polarization index is lower than the ABB suggested value of 2.0 for HV/LV to ground.
IC-NLH-1, Attachment 1 Page 54 of 58, Sunnyside - Replace Equipment

560246 – NALCOR Design Study & Failure Investigation Rev 0 Page 55
For SSD T4 – CGE 288838
The DGA results showed that: The concentration of Acetylene (C2H2) has been above IEEE C57.104-2008 guide condition
level 1 (2 ppm) since 1991, The level went up and down since then but was almost stable around the 5ppm. This could be oil leaking from the LTC diverter compartment.
The oil samples from this transformer have consistently shown high oxygen concentrations.
The oil physical results showed that: (Main tank) The latest measured breakdown voltage (52.0kV/mm) is above the minimum requirement
(30kV/mm) as outlined by Doble Engineering for 230kV transformers. The interfacial tension values are around 33.6 dynes/cm2 which is slightly above the 32
dynes/cm2 limit recommended by IEEE C57.106-2002 for 230kV transformers. Lower values may indicate oil soluble contaminants and oxidation products in oil.
The measured Acid Numbers for the oil samples are all below the recommended limits. The measured power factor values at 25/100°C are all below the suggested limits. The moisture in oil is within the acceptable limits.
The oil physical results showed that: (LTC tank) The measured breakdown voltage (between 20.0 kV/mm and 21.0 kV/mm for LTC-A,B,C) is
below the minimum requirement (28 kV/mm for 1 mm gap and 45 kV/mm for 2 mm gap). IEEE C57.106-2002 Table 12 recommends that the maximum limit of water content in oil for
LTC is not to exceed 25 ppm. The oil samples taken from the LTC tank show moisture content much less than 25 ppm.
The power factor measurements showed that: The winding power factor value CH is below the allowed limit, but CT is above 0.5%. The C1 power factor and capacitance values for HV & LV bushings are all acceptable. The measured C2 capacitance for HV & LV bushings is higher than the nameplate values. This
needs to be compared to initial benchmark test results. The hot collar tests for TV bushings and neutral bushing are below recommended limit. The Doble exciting current test are normal.
The maintenance history showed that: The winding resistance test for HV & LV & TV windings is consistent between phases. The ratio test was not performed. The core Megger test was performed and result looks normal. The insulation resistance test was performed and results look normal in G-ohms however the
polarization index is lower than the ABB suggested value of 2.0.
For STB T1 – CGE 288894
The DGA results showed that: The concentration of Acetylene (C2H2) has been below IEEE C57.104-2008 guide condition
level 1 (2 ppm) since 2009. However the DGA sample for the year 1979 shows high level of C2H2. This could be a bad oil sample.
The oil samples from this transformer have consistently shown high oxygen concentrations.
The oil physical results showed that: (Main tank) The latest measured breakdown voltage (62.0kV/mm) is above the minimum requirement
(50kV/mm) as outlined in IEEE C57.106-2002 for 230kV transformers with service aged insulating oil based on D1816-2mm method.
IC-NLH-1, Attachment 1 Page 55 of 58, Sunnyside - Replace Equipment

560246 – NALCOR Design Study & Failure Investigation Rev 0 Page 56
The interfacial tension values are around 30.4 dynes/cm2 which is below the suggested limits (32 dynes/cm2) recommended by IEEE C57.106-2002 for 230kV transformers. Lower values may indicate oil soluble contaminants and oxidation products in oil.
The measured Acid Numbers for the oil samples are all below the recommended limits. The measured power factor values at 25/100°C are all below the suggested limits. The moisture in oil is within the acceptable limits.
The oil physical results showed that: (LTC tank) The latest measured breakdown voltage is 30, 31 and 33 kV/mm for LTC-A,B,C. the suggested
limits is 28 kV/mm for 1 mm gap and 45 kV/mm for 2 mm gap as outlined by IEEE C57.106-2002.
IEEE C57.106-2002 Table 12 recommends that the maximum limit of water content in oil for LTC is not to exceed 25 ppm. The latest oil samples taken from the LTC tank show moisture content of less than 25 ppm.
The power factor measurements showed that: The winding power factor value CH & CT are below the allowed limit. The C1 power factor and capacitance values for HV & LV bushings are all acceptable. The measured C2 capacitance for HV & LV bushings is higher than the nameplate values. This
needs to be compared to initial benchmark test results. The hot collar tests for TV bushings and neutral bushing are below recommended limit The Doble exciting current test are normal.
The maintenance history showed that: The winding resistance test for HV & LV windings is consistent between phases. The deviation of the TV winding resistance between phases is 20%. The ratio test was not performed. The core Megger test was performed and result looks normal. The insulation resistance test was performed and results look normal in G-ohms however the
polarization index is lower than the ABB suggested value of 2.0 for HV to ground.
For STB T2 – CGE 288839
The DGA results showed that: The transformer has consistently shown very high concentrations (>20 ppm) of Acetylene
(C2H2) since 1986, which is far above the IEEE C57.104-2008 guide condition level 1 (2 ppm). The high concentration of C2H2 indicates that possible high energy arcing occurred somewhere inside the transformer. The other reason could be oil leaking from the LTC diverter compartment. The Acetylene levels are about 10ppm for few years now. This needs to be monitored closely. Any sudden increase of Acetylene needs to be investigated.
The oil samples from this transformer have consistently shown high oxygen concentrations
The oil physical results showed that: (Main tank) The latest measured breakdown voltage (68.0kV/mm) is above the minimum requirement
(50kV/mm) as outlined in IEEE C57.106-2002 for 230kV transformers with service aged insulating oil based on D1816-2mm method.
The interfacial tension values are around 28.7 dynes/cm2 which is below the suggested limits (32 dynes/cm2) recommended by IEEE C57.106-2002 for 230kV transformers.
The measured Acid Numbers for the oil samples are all below the recommended. The measured power factor values at 25/100°C are all below the suggested limits. The moisture in oil is within the acceptable limit.
IC-NLH-1, Attachment 1 Page 56 of 58, Sunnyside - Replace Equipment
560246 – NALCOR Design Study & Failure Investigation Rev 0 Page 57
The oil physical results showed that: (LTC tank) The latest measured breakdown voltage is 17, 21 and 23 kV/mm for LTC-A,B,C, which is below
the suggested minimum limits (28 kV/mm for 1 mm gap and 45 kV/mm for 2 mm gap). IEEE C57.106-2002 Table 12 recommends that the maximum limit of water content in oil for
LTC is not to exceed 25 ppm. The latest oil samples taken from the LTC tank show moisture content of more than 25 ppm for all three LTCs.
The power factor measurements showed that: The winding power factor value CH & CT are below the allowed limit. The C1 power factor and capacitance values for HV & LV bushings are all acceptable. The measured C2 capacitance for HV bushings is higher than the nameplate values by more
than 10%. This needs to be compared to initial benchmark test results and investigated. The measured C2 capacitance for LV bushings is higher than the nameplate values but within 10%.
The hot collar tests for TV bushings and neutral bushing are below recommended limit. The Doble exciting current test are normal.
The failure inspection of SSD T1 showed the following: All transformer bushings are damaged. The tap changer diverter cylinders of Phases 1 and 3 were separated from their aluminum
flanges at the cover. There was no indication that the fault originated in the tap changers compartment. No signs of flash over were seen in the cleats and leads including tap leads. All windings looked good with no signs of failure within the windings. It was not possible
however to see the internal windings. No sign of phase to phase failure in the windings was found during the inspection. The L1 & L3 bushing’s porcelain inside the transformer were shattered. Also marks of flashover
were seen on core clamp just opposite to Phase 1 LV bushing. For Phases 1 and 2 the leads connecting the LV bushings to the windings are disconnected. It
seems the two leads were mechanically pulled and cut at the crimp during the fault when the cover opened up. The insulation of the leads looks intact with no signs of failure.
Spitting and melting copper were seen on the LV windings conductor copper strands of phase one.
The system analysis during the fault showed that:
Between 9:03:21 and 9:04:49 something happened causing the MVAR difference between T1 & T4. Most probably T1 transformer was providing (compensating) the MVAR while there was a fault in T4.
There is no indication that a system disturbance caused the failure. There is no indication that the failure was initiated externally. There is no indication that there was a phase to phase failure.
Based on the internal inspection observations, all the information available and the system analysis findings, it is concluded that most probably the LV1 or LV2 bushing failed first which initiated the failure and resulting fire.
IC-NLH-1, Attachment 1 Page 57 of 58, Sunnyside - Replace Equipment
560246 – NALCOR Design Study & Failure Investigation Rev 0 Page 58
11. Recommendations
The following is recommended during dismantling/scraping of the failed unit:
Inspect closely the LTC diverter switches.
As there was lots of carbon, debris, oil and water inside the tank during the internal inspection, closer inspection of the windings after un-tanking the active part is recommended.
The following is recommended for the other three transformers:
Comprehensive DGA, oil quality tests and transformer testing is to be planned.
Any bushings with high C2 capacitance need to be compared to initial benchmark test results. Higher results need to be investigated.
As the bushings of these transformers are about forty years old, it is recommended to replace the bushings.
Add a conservator diaphragm.
Consider adding oxidation inhibitor to oil.
Monitor Acetylene (C2H2) closely especially for (STB T2).
Confirm that the cause of the acetylene is due to seeping from the LTC diverter oil compartment. This can be done by applying pressure on the diverter compartment and checking if oil leaks into the main compartment (the pressure drops).
Consider adding online gas monitor.
Consider adding bushing monitors.
Measure the oil break down voltage per ASTM D1816 (1mm or 2mm) method.
Repeat the TV windings resistance test (on unit STB T1) and compare to the sister unit results.
Repeat the HV resistance test (on unit SSD T1) and compare to the sister unit results.
Inspect and overhaul the LTC diverters. Most LTC manufacturers recommend LTC diverter inspections every 7 years. It is also recommended to re-condition or replace the oil in the LTC diverter tanks with new oil if it is not already done.
IC-NLH-1, Attachment 1 Page 58 of 58, Sunnyside - Replace Equipment
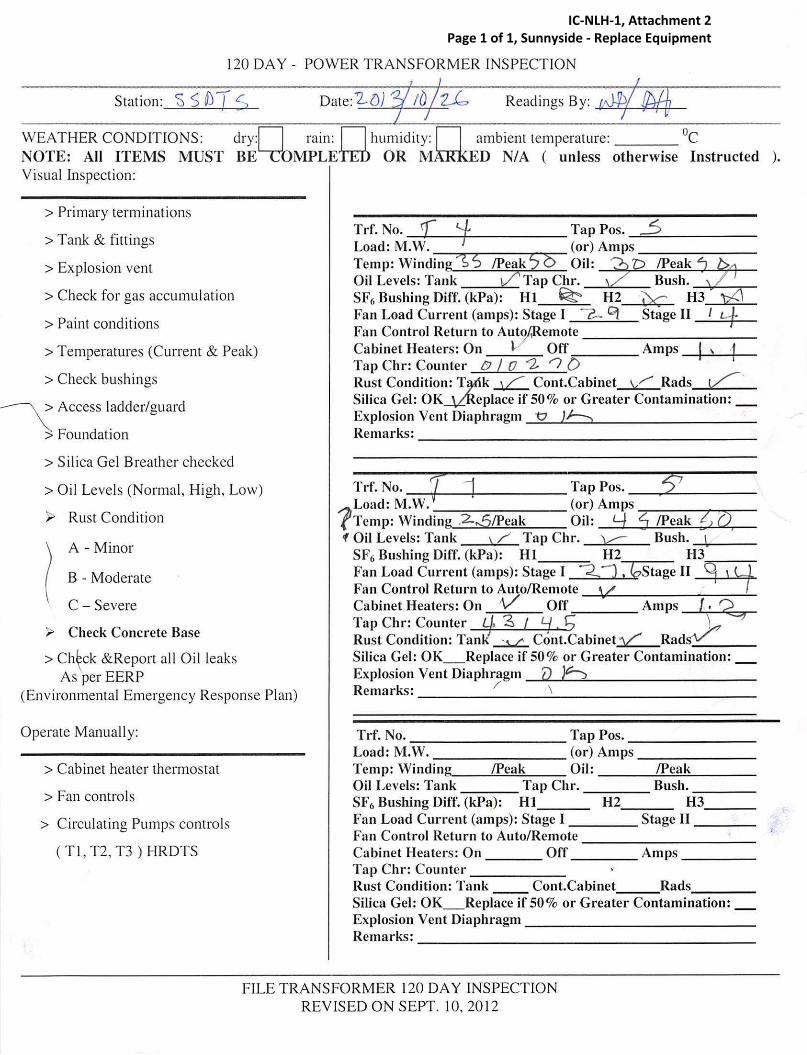
120 DAY- POWER TRANSFORMER INSPECTION
Station: S S OJ T S
WEATHER CONDITIONS: dry:n rain: n humidity: n ambient temperature: °C NOTE: All ITEMS MUST BE~OMPLETEi> OR MXRKED N/A ( unless otherwise Instructed ). Visual Inspection:
> Primary terminations
> Tank & fittings
> Explosion vent
> Check for gas accumulation
> Paint conditions
> Temperatures (Current & Peak)
> Check bushings
~Access ladder/guard
> Foundation
>Silica Gel Breather checked
>Oil Levels (Normal , High, Low)
~ Rust Condition
(
A- Minor
B - Moderate
C - Severe
>- Check Concrete Base
> Ch~ck &Report all Oil leaks As per EERP
(Environmental Emergency Response Plan)
Operate Manuall y:
> Cabinet heater thermostat
> Fan controls
> Circulating Pumps controls
( Tl , T2, T3) HRDTS
Trf. No. '[ * Tap Pos. --=3=-------Load: M.W. (or) Amps -----:----Temp: Winding /Peak Oil: 2P /Peak J ~ Oil Levels: Tank Tap Chr. ,/ Bush. \ SF6 Bushing Diff. (kPa): HI ~ H2 'Uc H3___,_~Fan Load Current (amps): Stage I ----c- '"i Stage II I kJ= Fan Control Return to Au~~emote ----------Cabinet Heaters: On Off Amps j , f Tap Chr: Counter tJ I 0 "2. 'I D Rust Condition: T~k ~ Cont.Cabinet \/ ....... Rads ~ Silica Gel: OK_.\L'R.eplace if 50 % or Greater Contamination:_ Explosion Vent Diaphragm _t1~~1t..:..b_.J_ _______ _ Remar~=-------------------
Trf. No. f j Tap Pos. --.....57..-<.----Load: M.W.r · (or) Amps
?Temp: Winding .2.5/Peak Oil: Y ...,S-!P-ea_k_£.,....: .,....()::-,-f Oil Levels: Tank , / Tap Chr. y...--= Bush.___,_. __ _
SF6 Bushing Diff. (kPa): HI H2 H3,.......-~
Fan Load Current (amps): Stage I --=s"J. ?Ostage II 9 1 W Fan Control Return to Auto/Remote . I Cabinet Heaters: On V Off Amps [. 0 Tap Chr: Counter 7} ~ I LJ . 5 \ ---=? Rust Condition: Tank'~ Cont. Cabinet V Rads/. ___ _ Silica Gel: OK_Replace if 50% or Greater Contamination: _ Explosion Vent Diaphragm ---'U"'-L-J~---==.----------Remarks: / \
Trf. No. Tap Pos. -------Load: M.W. (or) Amps-------Temp: Winding /Peak Oil : ___ ..:..:/P:..:e::.::a:.:.:k'------Oil Levels: Tank Tap Chr. ____ Bush. ___ _ SF6 Bushing Diff. (kPa): Hl H2___ H3 __ _ Fan Load Current (amps): Stage I ____ Stage II ___ _ Fan Control Return to Auto/Remote----------Cabinet Heaters: On Off ____ Amps ___ _ Tap Chr: Counter ____ _ Rust Condition: Tank Cont.Cabinet Rads ___ _ Silica Gel: OK_Replace if 50% or Greater Contamination:_ Explosion Vent Diaphragm------------Remar~=-------------------
FILE TRANSFORMER 120 DAY INSPECTION REVISED ON SEPT. 10, 2012
IC-NLH-1, Attachment 2 Page 1 of 1, Sunnyside - Replace Equipment