icahn enterprises l.p. q4 2016 earnings presentation
TRANSCRIPT
March 1, 2017
Icahn Enterprises L.P.
Q4 2016 Earnings Presentation
Safe Harbor Statement
Forward-Looking Statements and Non-GAAP Financial Measures
The Private Securities Litigation Reform Act of 1995 provides a "safe harbor" for forward-
looking statements we make in this presentation, including statements regarding our future
performance and plans for our businesses and potential acquisitions. These forward-
looking statements involve risks and uncertainties that are discussed in our filings with the
Securities and Exchange Commission, including economic, competitive, legal and other
factors. Accordingly, there is no assurance that our expectations will be realized. We
assume no obligation to update or revise any forward-looking statements should
circumstances change, except as otherwise required by law. This presentation also
includes certain non-GAAP financial measures. A reconciliation of such non-GAAP financial
measures to the most directly comparable GAAP financial measures can be found in the
back of this presentation.
2
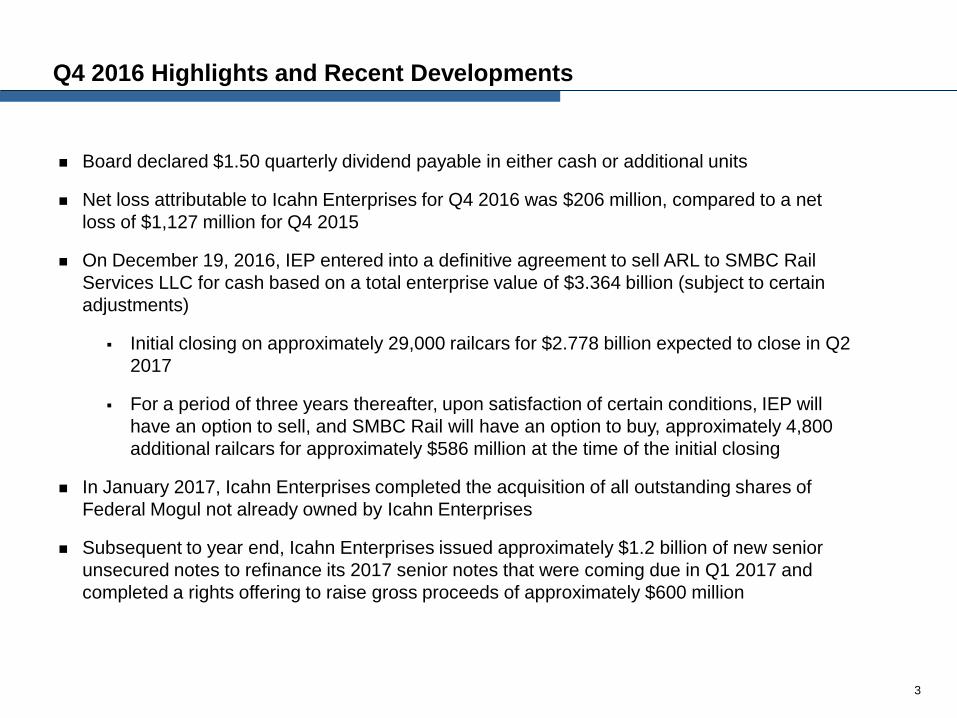
Q4 2016 Highlights and Recent Developments
Board declared $1.50 quarterly dividend payable in either cash or additional units
Net loss attributable to Icahn Enterprises for Q4 2016 was $206 million, compared to a net
loss of $1,127 million for Q4 2015
On December 19, 2016, IEP entered into a definitive agreement to sell ARL to SMBC Rail
Services LLC for cash based on a total enterprise value of $3.364 billion (subject to certain
adjustments)
Initial closing on approximately 29,000 railcars for $2.778 billion expected to close in Q2
2017
For a period of three years thereafter, upon satisfaction of certain conditions, IEP will
have an option to sell, and SMBC Rail will have an option to buy, approximately 4,800
additional railcars for approximately $586 million at the time of the initial closing
In January 2017, Icahn Enterprises completed the acquisition of all outstanding shares of
Federal Mogul not already owned by Icahn Enterprises
Subsequent to year end, Icahn Enterprises issued approximately $1.2 billion of new senior
unsecured notes to refinance its 2017 senior notes that were coming due in Q1 2017 and
completed a rights offering to raise gross proceeds of approximately $600 million
3
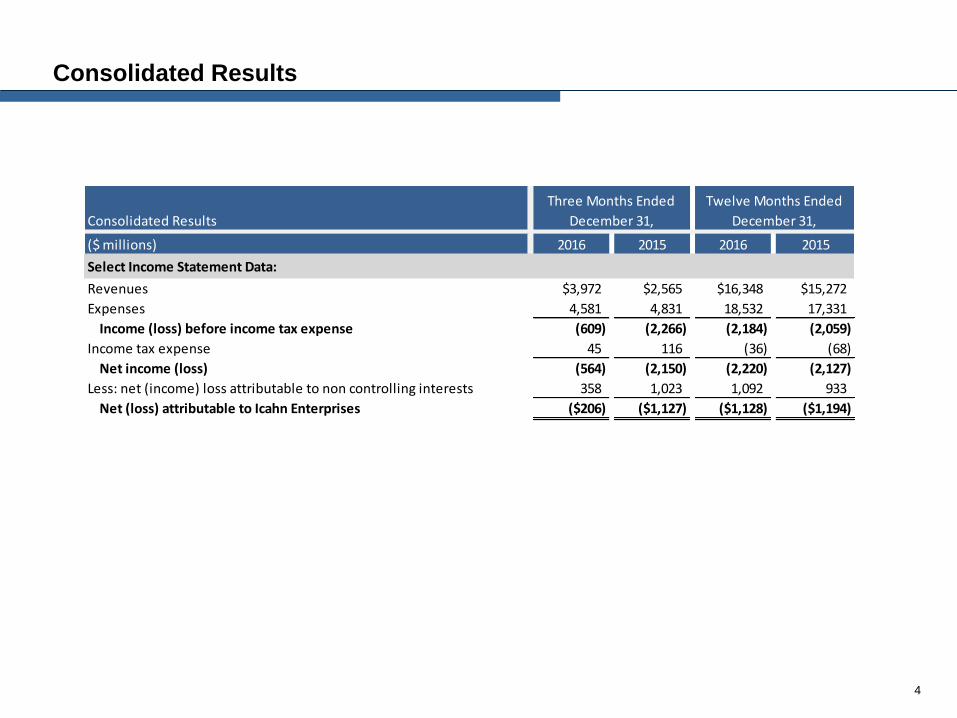
Consolidated Results
4
Consolidated Results
($ millions) 2016 2015 2016 2015
Select Income Statement Data:
Revenues $3,972 $2,565 $16,348 $15,272
Expenses 4,581 4,831 18,532 17,331
Income (loss) before income tax expense (609) (2,266) (2,184) (2,059)
Income tax expense 45 116 (36) (68)
Net income (loss) (564) (2,150) (2,220) (2,127)
Less: net (income) loss attributable to non controlling interests 358 1,023 1,092 933
Net (loss) attributable to Icahn Enterprises ($206) ($1,127) ($1,128) ($1,194)
Three Months Ended
December 31,
Twelve Months Ended
December 31,
Financial Performance
Adjusted EBITDA Attributable to Icahn Enterprises Net Loss Attributable to Icahn Enterprises
5
$153
($239)
$842 $930
($206)
($1,127)
($1,128) ($1,194)
Q4 2016 Q4 2015 YTD 2016 YTD 2015
($ in millions) 2016 2015 2016 2015 ($ in millions) 2016 2015 2016 2015
Investment ($158) ($641) ($604) ($760) Investment ($144) ($571) ($528) ($500)
Automotive (32) (295) 53 (299) Automotive 156 142 697 531
Energy 2 (156) (327) 25 Energy 20 30 156 436
Metals (7) (29) (20) (51) Metals (4) (11) (15) (29)
Railcar 52 39 150 137 Railcar 107 89 379 318
Gaming (29) 3 (109) 26 Gaming - 19 73 96
Mining (3) (140) (19) (150) Mining 3 (2) 1 (6)
Food Packaging - (4) 6 (3) Food Packaging 11 10 40 43
Real Estate (1) 6 12 61 Real Estate 12 13 41 45
Home Fashion (6) (1) (12) (4) Home Fashion (1) 2 (1) 6
Holding Company (24) 91 (258) (176) Holding Company (7) 40 (1) (10)
($206) ($1,127) ($1,128) ($1,194) $153 ($239) $842 $930
Three Months Ended December 31, Twelve Months Ended December 31,Three Months Ended December 31, Twelve Months Ended December 31,
Adjusted EBITDA attributable to Icahn EnterprisesNet income (loss) attributable to Icahn Enterprises
Net loss attributable to Icahn Enterprises
Adjusted EBITDA attributable to Icahn
Enterprises
Highlights and Recent Developments
Returns of (8.7%) for Q4 2016 and (20.3%) for FY 2016
From inception in November 2004, the Funds' gross return is approximately
116.1%, representing an annualized rate of return of approximately 6.5% through
December 31, 2016
Significant Holdings
As of December 31, 2016 (1)
Company
Mkt. Value
($mm)(2)
%
Ownership(3)
$2,981 4.4%
$1,354 13.7%
$1,318 2.8%
$1,203 6.3%
$1,083 24.2%
Segment: Investment
Company Description
IEP invests its proprietary capital through various
private investment funds (the “Funds”) managed
by the Investment segment
Fair value of IEP’s interest in the Funds was
approximately $1.7 billion as of December 31,
2016
Summary Segment Financial Results
6
(1) Aggregate ownership held directly by the Funds, as well as Carl Icahn and his affiliates. Based on most recent 13F
Holdings Reports, 13D flings or other public filings.
(2) Based on closing share price as of specified date.
(3) Total shares owned as a percentage of common shares issued and outstanding.
Investment Segment
($ millions) 2016 2015 2016 2015
Select Income Statement Data:
Total revenues ($463) ($1,220) ($1,223) ($865)
Adjusted EBITDA (469) (1,250) (1,257) (1,100)
Net loss (515) (1,402) (1,487) (1,665)
Adjusted EBITDA attrib. to IEP ($144) ($571) ($528) ($500)
Net loss attrib. to IEP (158) (641) (604) (760)
Returns (8.7)% (15.6)% (20.3)% (18.0)%
Three Months Ended
December 31,
Twelve Months Ended
December 31,
Highlights and Recent Developments
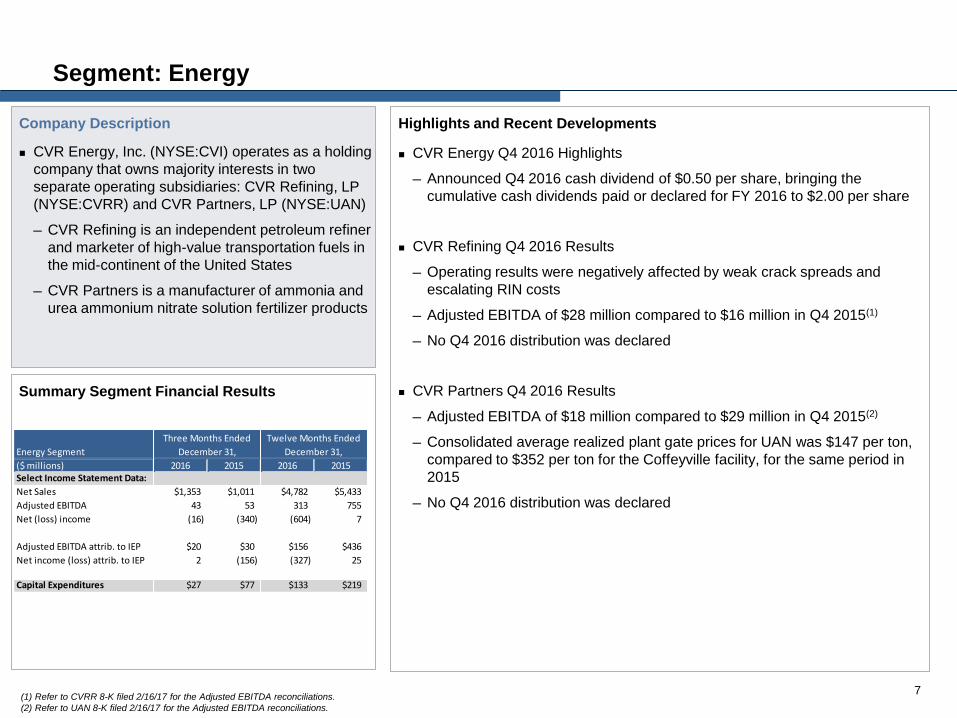
CVR Energy Q4 2016 Highlights
─ Announced Q4 2016 cash dividend of $0.50 per share, bringing the
cumulative cash dividends paid or declared for FY 2016 to $2.00 per share
CVR Refining Q4 2016 Results
─ Operating results were negatively affected by weak crack spreads and
escalating RIN costs
─ Adjusted EBITDA of $28 million compared to $16 million in Q4 2015(1)
─ No Q4 2016 distribution was declared
CVR Partners Q4 2016 Results
─ Adjusted EBITDA of $18 million compared to $29 million in Q4 2015(2)
─ Consolidated average realized plant gate prices for UAN was $147 per ton,
compared to $352 per ton for the Coffeyville facility, for the same period in
2015
─ No Q4 2016 distribution was declared
Segment: Energy
Company Description
CVR Energy, Inc. (NYSE:CVI) operates as a holding
company that owns majority interests in two
separate operating subsidiaries: CVR Refining, LP
(NYSE:CVRR) and CVR Partners, LP (NYSE:UAN)
─ CVR Refining is an independent petroleum refiner
and marketer of high-value transportation fuels in
the mid-continent of the United States
─ CVR Partners is a manufacturer of ammonia and
urea ammonium nitrate solution fertilizer products
Summary Segment Financial Results
7 (1) Refer to CVRR 8-K filed 2/16/17 for the Adjusted EBITDA reconciliations.
(2) Refer to UAN 8-K filed 2/16/17 for the Adjusted EBITDA reconciliations.
Energy Segment
($ millions) 2016 2015 2016 2015Select Income Statement Data:
Net Sales $1,353 $1,011 $4,782 $5,433
Adjusted EBITDA 43 53 313 755
Net (loss) income (16) (340) (604) 7
Adjusted EBITDA attrib. to IEP $20 $30 $156 $436
Net income (loss) attrib. to IEP 2 (156) (327) 25
Capital Expenditures $27 $77 $133 $219
Three Months Ended
December 31,
Twelve Months Ended
December 31,
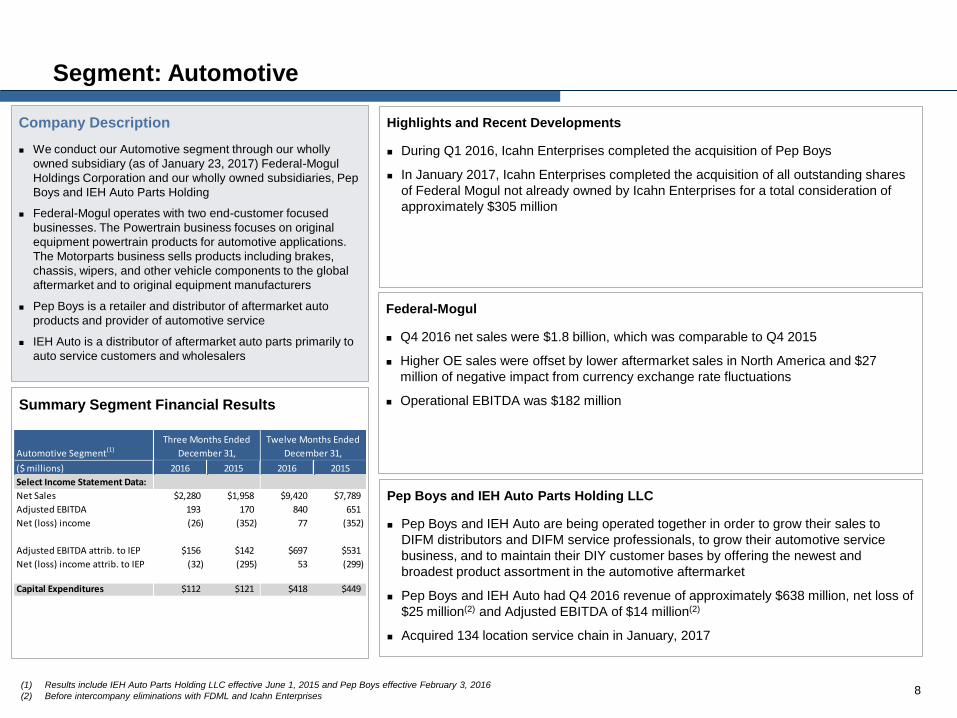
Segment: Automotive
Company Description
We conduct our Automotive segment through our wholly
owned subsidiary (as of January 23, 2017) Federal-Mogul
Holdings Corporation and our wholly owned subsidiaries, Pep
Boys and IEH Auto Parts Holding
Federal-Mogul operates with two end-customer focused
businesses. The Powertrain business focuses on original
equipment powertrain products for automotive applications.
The Motorparts business sells products including brakes,
chassis, wipers, and other vehicle components to the global
aftermarket and to original equipment manufacturers
Pep Boys is a retailer and distributor of aftermarket auto
products and provider of automotive service
IEH Auto is a distributor of aftermarket auto parts primarily to
auto service customers and wholesalers
Summary Segment Financial Results
8
Federal-Mogul
Q4 2016 net sales were $1.8 billion, which was comparable to Q4 2015
Higher OE sales were offset by lower aftermarket sales in North America and $27
million of negative impact from currency exchange rate fluctuations
Operational EBITDA was $182 million
Pep Boys and IEH Auto Parts Holding LLC
Pep Boys and IEH Auto are being operated together in order to grow their sales to
DIFM distributors and DIFM service professionals, to grow their automotive service
business, and to maintain their DIY customer bases by offering the newest and
broadest product assortment in the automotive aftermarket
Pep Boys and IEH Auto had Q4 2016 revenue of approximately $638 million, net loss of
$25 million(2) and Adjusted EBITDA of $14 million(2)
Acquired 134 location service chain in January, 2017
Highlights and Recent Developments
During Q1 2016, Icahn Enterprises completed the acquisition of Pep Boys
In January 2017, Icahn Enterprises completed the acquisition of all outstanding shares
of Federal Mogul not already owned by Icahn Enterprises for a total consideration of
approximately $305 million
(1) Results include IEH Auto Parts Holding LLC effective June 1, 2015 and Pep Boys effective February 3, 2016
(2) Before intercompany eliminations with FDML and Icahn Enterprises
Automotive Segment(1)
($ millions) 2016 2015 2016 2015
Select Income Statement Data:
Net Sales $2,280 $1,958 $9,420 $7,789
Adjusted EBITDA 193 170 840 651
Net (loss) income (26) (352) 77 (352)
Adjusted EBITDA attrib. to IEP $156 $142 $697 $531
Net (loss) income attrib. to IEP (32) (295) 53 (299)
Capital Expenditures $112 $121 $418 $449
Three Months Ended
December 31,
Twelve Months Ended
December 31,
Highlights and Recent Developments
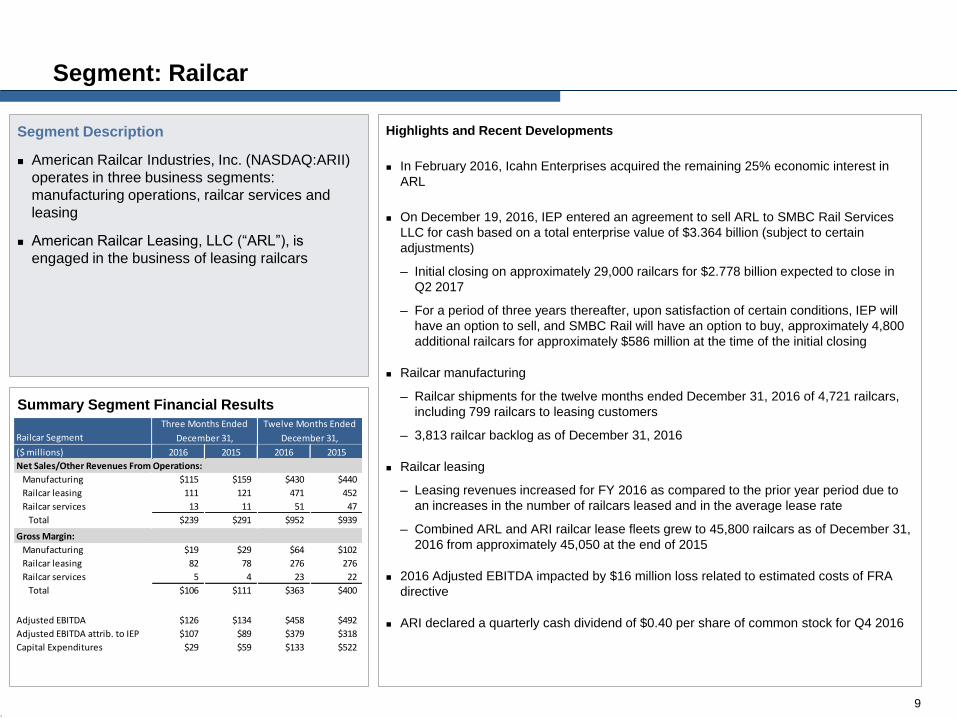
In February 2016, Icahn Enterprises acquired the remaining 25% economic interest in
ARL
On December 19, 2016, IEP entered an agreement to sell ARL to SMBC Rail Services
LLC for cash based on a total enterprise value of $3.364 billion (subject to certain
adjustments)
─ Initial closing on approximately 29,000 railcars for $2.778 billion expected to close in
Q2 2017
─ For a period of three years thereafter, upon satisfaction of certain conditions, IEP will
have an option to sell, and SMBC Rail will have an option to buy, approximately 4,800
additional railcars for approximately $586 million at the time of the initial closing
Railcar manufacturing
─ Railcar shipments for the twelve months ended December 31, 2016 of 4,721 railcars,
including 799 railcars to leasing customers
─ 3,813 railcar backlog as of December 31, 2016
Railcar leasing
─ Leasing revenues increased for FY 2016 as compared to the prior year period due to
an increases in the number of railcars leased and in the average lease rate
─ Combined ARL and ARI railcar lease fleets grew to 45,800 railcars as of December 31,
2016 from approximately 45,050 at the end of 2015
2016 Adjusted EBITDA impacted by $16 million loss related to estimated costs of FRA
directive
ARI declared a quarterly cash dividend of $0.40 per share of common stock for Q4 2016
Segment: Railcar
Segment Description
American Railcar Industries, Inc. (NASDAQ:ARII)
operates in three business segments:
manufacturing operations, railcar services and
leasing
American Railcar Leasing, LLC (“ARL”), is
engaged in the business of leasing railcars
Summary Segment Financial Results
. 9
Railcar Segment
($ millions) 2016 2015 2016 2015
Net Sales/Other Revenues From Operations:
Manufacturing $115 $159 $430 $440
Railcar leasing 111 121 471 452
Railcar services 13 11 51 47
Total $239 $291 $952 $939
Gross Margin:
Manufacturing $19 $29 $64 $102
Railcar leasing 82 78 276 276
Railcar services 5 4 23 22
Total $106 $111 $363 $400
Adjusted EBITDA $126 $134 $458 $492
Adjusted EBITDA attrib. to IEP $107 $89 $379 $318
Capital Expenditures $29 $59 $133 $522
Three Months Ended
December 31,
Twelve Months Ended
December 31,
Highlights and Recent Developments
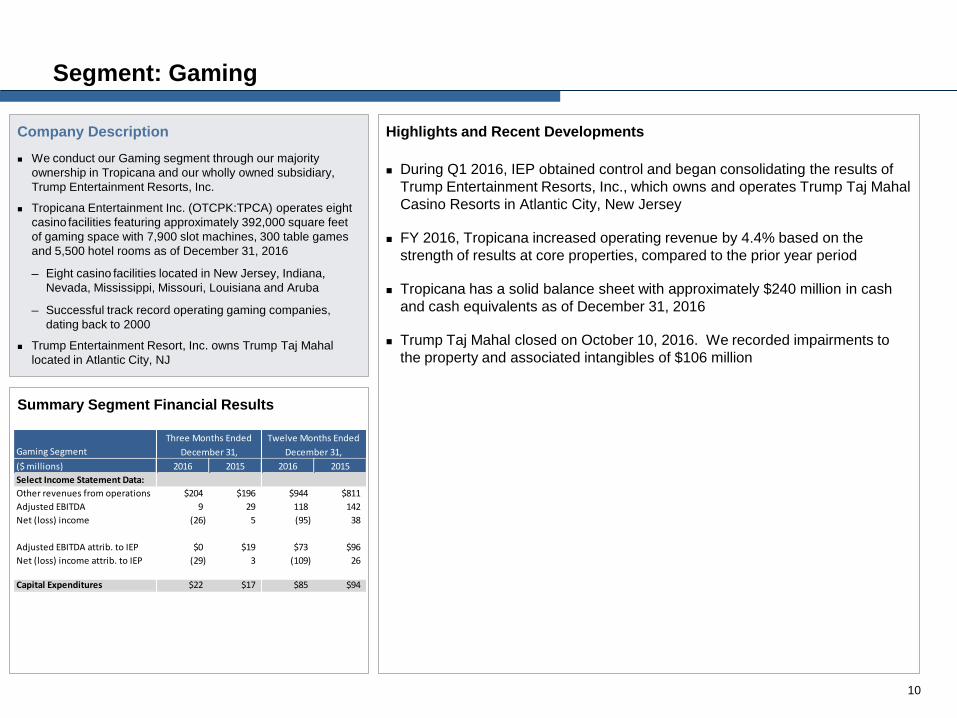
During Q1 2016, IEP obtained control and began consolidating the results of
Trump Entertainment Resorts, Inc., which owns and operates Trump Taj Mahal
Casino Resorts in Atlantic City, New Jersey
FY 2016, Tropicana increased operating revenue by 4.4% based on the
strength of results at core properties, compared to the prior year period
Tropicana has a solid balance sheet with approximately $240 million in cash
and cash equivalents as of December 31, 2016
Trump Taj Mahal closed on October 10, 2016. We recorded impairments to
the property and associated intangibles of $106 million
Segment: Gaming
Company Description
We conduct our Gaming segment through our majority
ownership in Tropicana and our wholly owned subsidiary,
Trump Entertainment Resorts, Inc.
Tropicana Entertainment Inc. (OTCPK:TPCA) operates eight
casino facilities featuring approximately 392,000 square feet
of gaming space with 7,900 slot machines, 300 table games
and 5,500 hotel rooms as of December 31, 2016
─ Eight casino facilities located in New Jersey, Indiana,
Nevada, Mississippi, Missouri, Louisiana and Aruba
─ Successful track record operating gaming companies,
dating back to 2000
Trump Entertainment Resort, Inc. owns Trump Taj Mahal
located in Atlantic City, NJ
Summary Segment Financial Results
10
Gaming Segment
($ millions) 2016 2015 2016 2015
Select Income Statement Data:
Other revenues from operations $204 $196 $944 $811
Adjusted EBITDA 9 29 118 142
Net (loss) income (26) 5 (95) 38
Adjusted EBITDA attrib. to IEP $0 $19 $73 $96
Net (loss) income attrib. to IEP (29) 3 (109) 26
Capital Expenditures $22 $17 $85 $94
Three Months Ended
December 31,
Twelve Months Ended
December 31,
Highlights and Recent Developments
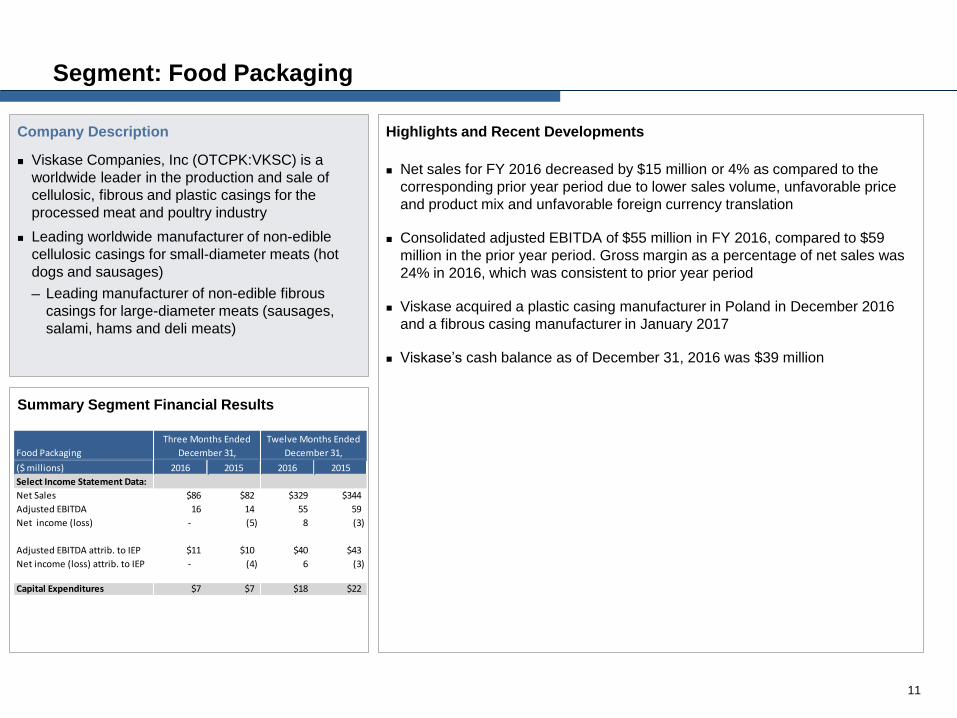
Net sales for FY 2016 decreased by $15 million or 4% as compared to the
corresponding prior year period due to lower sales volume, unfavorable price
and product mix and unfavorable foreign currency translation
Consolidated adjusted EBITDA of $55 million in FY 2016, compared to $59
million in the prior year period. Gross margin as a percentage of net sales was
24% in 2016, which was consistent to prior year period
Viskase acquired a plastic casing manufacturer in Poland in December 2016
and a fibrous casing manufacturer in January 2017
Viskase’s cash balance as of December 31, 2016 was $39 million
Segment: Food Packaging
Company Description
Viskase Companies, Inc (OTCPK:VKSC) is a
worldwide leader in the production and sale of
cellulosic, fibrous and plastic casings for the
processed meat and poultry industry
Leading worldwide manufacturer of non-edible
cellulosic casings for small-diameter meats (hot
dogs and sausages)
─ Leading manufacturer of non-edible fibrous
casings for large-diameter meats (sausages,
salami, hams and deli meats)
Summary Segment Financial Results
11
Food Packaging
($ millions) 2016 2015 2016 2015
Select Income Statement Data:
Net Sales $86 $82 $329 $344
Adjusted EBITDA 16 14 55 59
Net income (loss) - (5) 8 (3)
Adjusted EBITDA attrib. to IEP $11 $10 $40 $43
Net income (loss) attrib. to IEP - (4) 6 (3)
Capital Expenditures $7 $7 $18 $22
Three Months Ended
December 31,
Twelve Months Ended
December 31,

Highlights and Recent Developments
Net sales for 2016 decreased by $94 million, or 26%, compared to the prior
year period. The net sales decrease was driven by lower selling prices and
lower shipping volumes across all product lines, with the exception of
secondary plate volume
Adjusted EBITDA was a loss of $15 million in FY 2016 compared to a loss of
$29 million in FY 2015
Committed to improving buying practices to improve materials margins
Segment: Metals
Company Description
PSC Metals, Inc. is one of the largest independent
metal recycling companies in the U.S.
Collects industrial and obsolete scrap metal,
processes it into reusable forms and supplies the
recycled metals to its customers
Strong regional footprint (Upper Midwest, St. Louis
Region and the South)
Summary Segment Financial Results
12
Metals Segment
($ millions) 2016 2015 2016 2015
Select Income Statement Data:
Net Sales $61 $60 $267 $361
Adjusted EBITDA (4) (11) (15) (29)
Net loss (7) (29) (20) (51)
Adjusted EBITDA attrib. to IEP ($4) ($11) ($15) ($29)
Net loss attrib. to IEP (7) (29) (20) (51)
Capital Expenditures $2 $1 $5 $24
Ferrous tons sold (in 000's) 136 179 662 850
Non-ferrous pounds sold (in 000's) 25,571 23,854 105,660 117,939
Three Months Ended
December 31,
Twelve Months Ended
December 31,

Highlights and Recent Developments
Business strategy is based on long-term investment outlook and operational expertise
Rental Real Estate Operations
Net lease portfolio overview
─ Single tenant (Over $100bn market cap, A- credit) for two large buildings with leases
through 2020 – 2021
─ 13 legacy properties with 2.9 million square feet: 12% Retail, 60% Industrial, 28% Office.
Maximize value of commercial lease portfolio through effective management of existing
properties
─ Seek to sell assets on opportunistic basis
Property Development
New Seabury in Cape Cod, Massachusetts and Grand Harbor in Vero Beach, Florida
include land for future residential development of approximately 272 and 1,128 units,
respectively
Opportunistically acquired Fontainebleau (Las Vegas casino development) in 2009 for $150
million
Club Operations
Club operations in New Seabury, Cape Cod and Grand Harbor, Vero Beach focus on
operating golf club and related activities
Segment: Real Estate
Company Description
Consists of rental real estate, property development
and club operations
Rental real estate consists primarily of retail, office
and industrial properties leased to single corporate
tenants
Property development is focused on the construction
and sale of single and multi-family houses, lots in
subdivisions and planned communities and raw land
for residential development
Club operations focus on operating golf club and
related activities
Summary Segment Financial Results
13
Real Estate Segment
($ millions) 2016 2015 2016 2015
Select Income Statement Data:
Total revenues $20 $28 $88 $131
Adjusted EBITDA 12 13 41 45
Net (loss) income (1) 6 12 61
Adjusted EBITDA attrib. to IEP $12 $13 $41 $45
Net (loss) income attrib. to IEP (1) 6 12 61
Capital Expenditures $1 $2 $1 $3
Three Months Ended
December 31,
Twelve Months Ended
December 31,
Highlights and Recent Developments
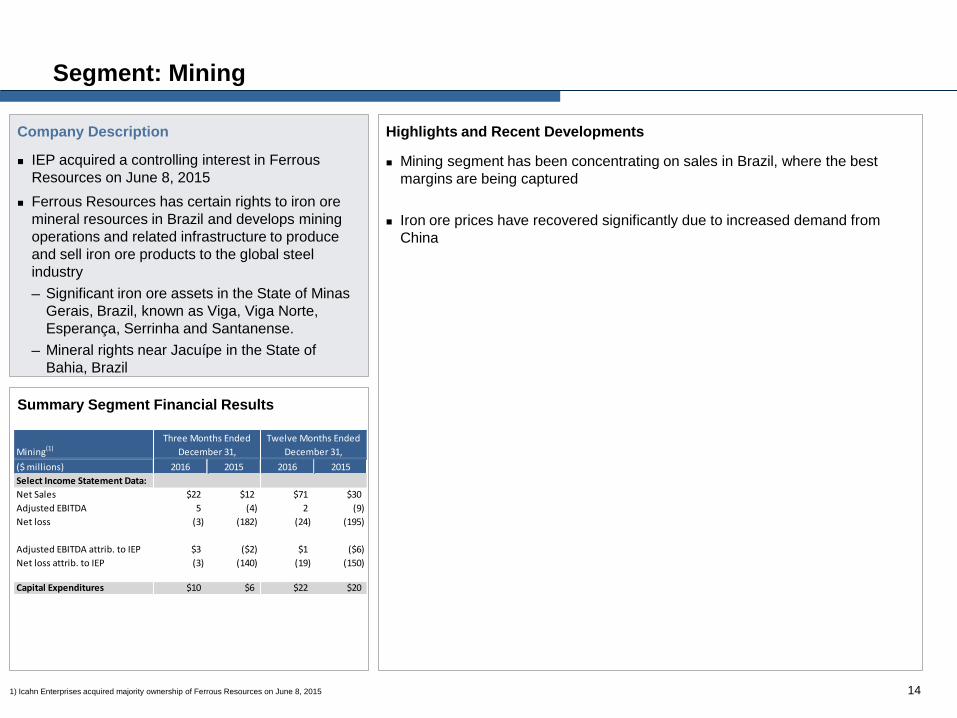
Mining segment has been concentrating on sales in Brazil, where the best
margins are being captured
Iron ore prices have recovered significantly due to increased demand from
China
Segment: Mining
Company Description
IEP acquired a controlling interest in Ferrous
Resources on June 8, 2015
Ferrous Resources has certain rights to iron ore
mineral resources in Brazil and develops mining
operations and related infrastructure to produce
and sell iron ore products to the global steel
industry
─ Significant iron ore assets in the State of Minas
Gerais, Brazil, known as Viga, Viga Norte,
Esperança, Serrinha and Santanense.
─ Mineral rights near Jacuípe in the State of
Bahia, Brazil
Summary Segment Financial Results
14 1) Icahn Enterprises acquired majority ownership of Ferrous Resources on June 8, 2015
Mining(1)
($ millions) 2016 2015 2016 2015
Select Income Statement Data:
Net Sales $22 $12 $71 $30
Adjusted EBITDA 5 (4) 2 (9)
Net loss (3) (182) (24) (195)
Adjusted EBITDA attrib. to IEP $3 ($2) $1 ($6)
Net loss attrib. to IEP (3) (140) (19) (150)
Capital Expenditures $10 $6 $22 $20
Three Months Ended
December 31,
Twelve Months Ended
December 31,
Highlights and Recent Developments
FY 2016 net sales were $195 million, up $2 million from FY 2015
Adjusted EBITDA was a loss of $1 million in FY 2016, compared to a gain of $6
million in FY 2015
─ Higher costs associated with supply chain logistics
Streamlined merchandising, sales and customer service divisions
Focus on core profitable customers and product lines. Seeing traction from
developing new brands
Segment: Home Fashion
Company Description
WestPoint Home LLC is engaged in
manufacturing, sourcing, marketing, distributing
and selling home fashion consumer products
WestPoint Home owns many of the most well-
know brands in home textiles including Martex,
Grand Patrician, Luxor and Vellux
WPH also licenses brands such as IZOD, Under
the Canopy, Southern Tide and Hanes
Summary Segment Financial Results
15
Home Fashion Segment
($ millions) 2016 2015 2016 2015
Select Income Statement Data:
Net Sales $44 $46 $195 $193
Adjusted EBITDA (1) 2 (1) 6
Net loss (6) (1) (12) (4)
Adjusted EBITDA attrib. to IEP ($1) $2 ($1) $6
Net loss income attrib. to IEP (6) (1) (12) (4)
Capital Expenditures $1 $2 $11 $6
Three Months Ended
December 31,
Twelve Months Ended
December 31,
Financial Performance
16
Liquidity Serves as a Competitive Advantage
The Company and its subsidiaries maintain ample liquidity to take advantage of attractive
opportunities for their respective businesses
($Millions)
17
Liquidity
Liquid Assets:
Hold Co. Cash & Cash Equivalents $225
IEP Interest in Investment Funds 1,652
Subsidiaries Cash & Cash Equivalents 1,608
Total $3,485
Subsidiary Revolver Availability:
Automotive $405
Energy 361
Railcar 200
Gaming 15
Food Packaging 8
Home Fashion 30
Subsidiary Revolver Availability $1,019
Total Liquidity $4,504
As of 12/31/2016
IEP Summary Financial Information
Significant Valuation demonstrated by market value of IEP’s public subsidiaries and Holding Company interest in Funds and book value
or market comparables of other assets
18
($ Millions)
Note: Indicative net asset value does not purport to reflect a valuation of IEP. The calculated Indicative net asset value does not include any value for our Investment Segment other than the fair market value of our
investment in the Investment Funds. A valuation is a subjective exercise and Indicative net asset value does not necessarily consider all elements or consider in the adequate proportion the elements that could
affect the valuation of IEP. Investors may reasonably differ on what such elements are and their impact on IEP. No representation or assurance, express or implied is made as to the accuracy and correctness of
indicative net asset value as of these dates or with respect to any future indicative or prospective results which may vary.
(1) Represents equity attributable to us as of each respective date.
(2) Based on closing share price on each date (or if such date was not a trading day, the immediately preceding trading day) and the number of shares owned by the Holding Company as of each respective date.
(3) Amounts based on market comparables due to lack of material trading volume. Tropicana valued at 8.5x Adjusted EBITDA for the twelve months ended December 31, 2015, March 31, 2016, June 30, 2016,
September 30, 2016 and December 31, 2016. Viskase valued at 9.0x Adjusted EBITDA for the twelve months ended December 31, 2015, March 31, 2016, June 30, 2016, September 30, 2016 and December 31,
2016.
(4) Represents the estimated present value of projected cash flows from leased railcars, net of debt, plus working capital. December 31, 2016 is adjusted to reflect the initial sale of ARL to SMBC Rail and assumes that
the ARL cars not being sold to SMBC Rail during the initial closing are valued at the purchase price option set forth in the ARL sales agreement less liabilities.
(5) Holding Company’s balance as of each respective date.
Dec 31 March 31 June 30 Sept 30 Dec 31
2015 2016 2016 2016 2016
Market-valued Subsidiaries:
Holding Company interest in Funds (1) $3,428 $1,820 $1,713 $1,825 $1,669
Federal-Mogul (2) 949 1,369 1,152 1,332 1,429
CVR Energy (2) 2,802 1,858 1,104 980 1,808
CVR Refining - direct holding (2) 114 72 47 50 60
American Railcar Industries (2) 549 484 469 492 538
Total market-valued subsidiaries $7,842 $5,604 $4,483 $4,680 $5,503
Other Subsidiaries
Tropicana (3) $794 $844 $811 $877 $862
Viskase (3) 183 165 143 145 154
Real Estate Holdings (1) 656 649 647 644 642
PSC Metals (1) 182 174 178 169 155
WestPoint Home (1) 176 175 174 169 164
ARL (4) 852 1,024 1,033 1,029 1,689
Ferrous Resources (1) 95 85 81 79 104
IEH Auto & PepBoys (1) 249 1,418 1,423 1,364 1,319
Trump Entertainment (1) - 203 208 118 86
Total - other subsidiaries $3,187 $4,736 $4,697 $4,594 $5,176
Add: Holding Company cash and cash equivalents (5) 166 212 211 192 225
Less: Holding Company debt (5) (5,490) (5,487) (5,488) (5,489) (5,490)
Add: Other Holding Company net assets (5) 615 (13) 133 183 171
Indicative Net Asset Value $6,320 $5,052 $4,036 $4,160 $5,585
As of
Appendix
Adjusted EBITDA
19
Non-GAAP Financial Measures
20
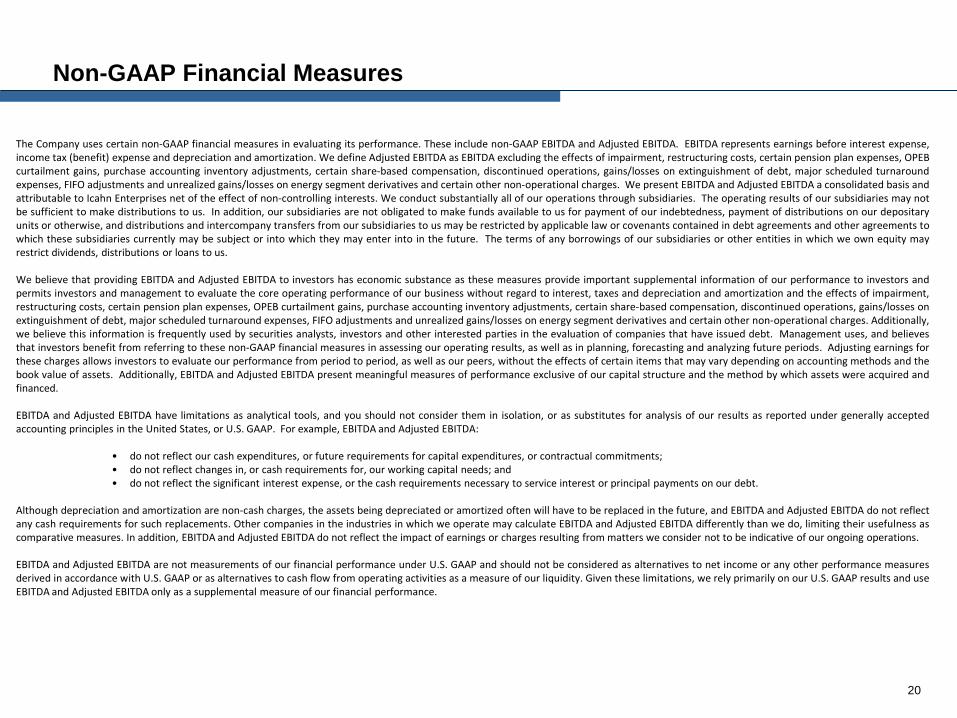
The Company uses certain non-GAAP financial measures in evaluating its performance. These include non-GAAP EBITDA and Adjusted EBITDA. EBITDA represents earnings before interest expense, income tax (benefit) expense and depreciation and amortization. We define Adjusted EBITDA as EBITDA excluding the effects of impairment, restructuring costs, certain pension plan expenses, OPEB curtailment gains, purchase accounting inventory adjustments, certain share-based compensation, discontinued operations, gains/losses on extinguishment of debt, major scheduled turnaround expenses, FIFO adjustments and unrealized gains/losses on energy segment derivatives and certain other non-operational charges. We present EBITDA and Adjusted EBITDA a consolidated basis and attributable to Icahn Enterprises net of the effect of non-controlling interests. We conduct substantially all of our operations through subsidiaries. The operating results of our subsidiaries may not be sufficient to make distributions to us. In addition, our subsidiaries are not obligated to make funds available to us for payment of our indebtedness, payment of distributions on our depositary units or otherwise, and distributions and intercompany transfers from our subsidiaries to us may be restricted by applicable law or covenants contained in debt agreements and other agreements to which these subsidiaries currently may be subject or into which they may enter into in the future. The terms of any borrowings of our subsidiaries or other entities in which we own equity may restrict dividends, distributions or loans to us. We believe that providing EBITDA and Adjusted EBITDA to investors has economic substance as these measures provide important supplemental information of our performance to investors and permits investors and management to evaluate the core operating performance of our business without regard to interest, taxes and depreciation and amortization and the effects of impairment, restructuring costs, certain pension plan expenses, OPEB curtailment gains, purchase accounting inventory adjustments, certain share-based compensation, discontinued operations, gains/losses on extinguishment of debt, major scheduled turnaround expenses, FIFO adjustments and unrealized gains/losses on energy segment derivatives and certain other non-operational charges. Additionally, we believe this information is frequently used by securities analysts, investors and other interested parties in the evaluation of companies that have issued debt. Management uses, and believes that investors benefit from referring to these non-GAAP financial measures in assessing our operating results, as well as in planning, forecasting and analyzing future periods. Adjusting earnings for these charges allows investors to evaluate our performance from period to period, as well as our peers, without the effects of certain items that may vary depending on accounting methods and the book value of assets. Additionally, EBITDA and Adjusted EBITDA present meaningful measures of performance exclusive of our capital structure and the method by which assets were acquired and financed. EBITDA and Adjusted EBITDA have limitations as analytical tools, and you should not consider them in isolation, or as substitutes for analysis of our results as reported under generally accepted accounting principles in the United States, or U.S. GAAP. For example, EBITDA and Adjusted EBITDA: • do not reflect our cash expenditures, or future requirements for capital expenditures, or contractual commitments; • do not reflect changes in, or cash requirements for, our working capital needs; and • do not reflect the significant interest expense, or the cash requirements necessary to service interest or principal payments on our debt. Although depreciation and amortization are non-cash charges, the assets being depreciated or amortized often will have to be replaced in the future, and EBITDA and Adjusted EBITDA do not reflect any cash requirements for such replacements. Other companies in the industries in which we operate may calculate EBITDA and Adjusted EBITDA differently than we do, limiting their usefulness as comparative measures. In addition, EBITDA and Adjusted EBITDA do not reflect the impact of earnings or charges resulting from matters we consider not to be indicative of our ongoing operations. EBITDA and Adjusted EBITDA are not measurements of our financial performance under U.S. GAAP and should not be considered as alternatives to net income or any other performance measures derived in accordance with U.S. GAAP or as alternatives to cash flow from operating activities as a measure of our liquidity. Given these limitations, we rely primarily on our U.S. GAAP results and use EBITDA and Adjusted EBITDA only as a supplemental measure of our financial performance.
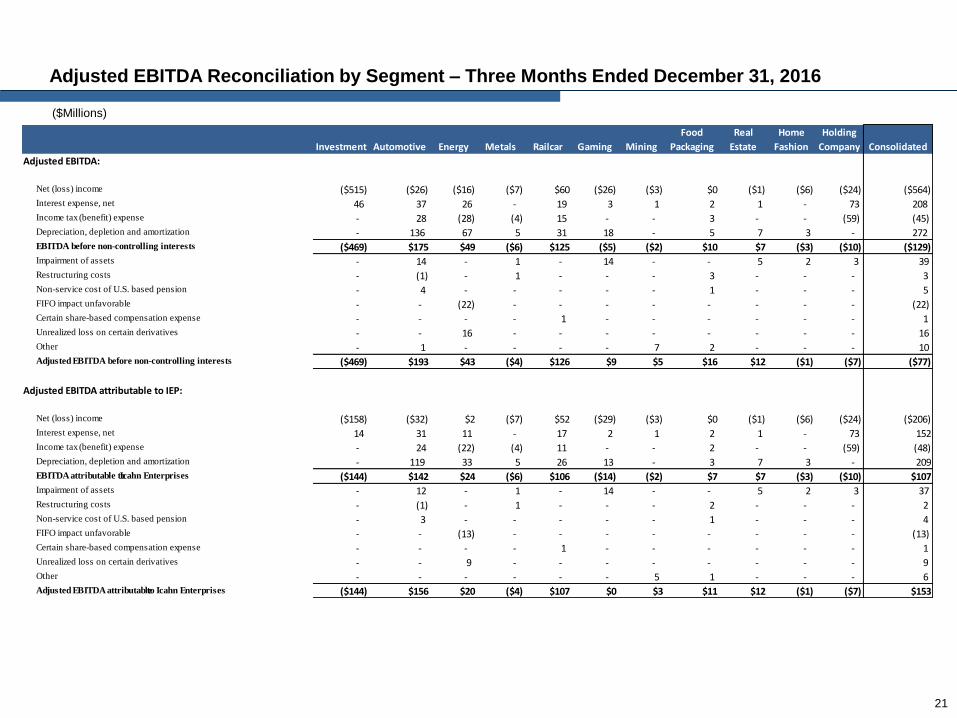
Adjusted EBITDA Reconciliation by Segment – Three Months Ended December 31, 2016
($Millions)
21
Investment Automotive Energy Metals Railcar Gaming Mining
Food
Packaging
Real
Estate
Home
Fashion
Holding
Company Consolidated
Adjusted EBITDA:
Net (loss) income ($515) ($26) ($16) ($7) $60 ($26) ($3) $0 ($1) ($6) ($24) ($564)Interest expense, net 46 37 26 - 19 3 1 2 1 - 73 208 Income tax (benefit) expense - 28 (28) (4) 15 - - 3 - - (59) (45)Depreciation, depletion and amortization - 136 67 5 31 18 - 5 7 3 - 272 EBITDA before non-controlling interests ($469) $175 $49 ($6) $125 ($5) ($2) $10 $7 ($3) ($10) ($129)Impairment of assets - 14 - 1 - 14 - - 5 2 3 39 Restructuring costs - (1) - 1 - - - 3 - - - 3 Non-service cost of U.S. based pension - 4 - - - - - 1 - - - 5 FIFO impact unfavorable - - (22) - - - - - - - - (22)Certain share-based compensation expense - - - - 1 - - - - - - 1 Unrealized loss on certain derivatives - - 16 - - - - - - - - 16 Other - 1 - - - - 7 2 - - - 10 Adjusted EBITDA before non-controlling interests ($469) $193 $43 ($4) $126 $9 $5 $16 $12 ($1) ($7) ($77)
Adjusted EBITDA attributable to IEP:
Net (loss) income ($158) ($32) $2 ($7) $52 ($29) ($3) $0 ($1) ($6) ($24) ($206)Interest expense, net 14 31 11 - 17 2 1 2 1 - 73 152 Income tax (benefit) expense - 24 (22) (4) 11 - - 2 - - (59) (48)Depreciation, depletion and amortization - 119 33 5 26 13 - 3 7 3 - 209 EBITDA attributable to Icahn Enterprises ($144) $142 $24 ($6) $106 ($14) ($2) $7 $7 ($3) ($10) $107 Impairment of assets - 12 - 1 - 14 - - 5 2 3 37 Restructuring costs - (1) - 1 - - - 2 - - - 2 Non-service cost of U.S. based pension - 3 - - - - - 1 - - - 4 FIFO impact unfavorable - - (13) - - - - - - - - (13)Certain share-based compensation expense - - - - 1 - - - - - - 1 Unrealized loss on certain derivatives - - 9 - - - - - - - - 9 Other - - - - - - 5 1 - - - 6 Adjusted EBITDA attributable to Icahn Enterprises ($144) $156 $20 ($4) $107 $0 $3 $11 $12 ($1) ($7) $153
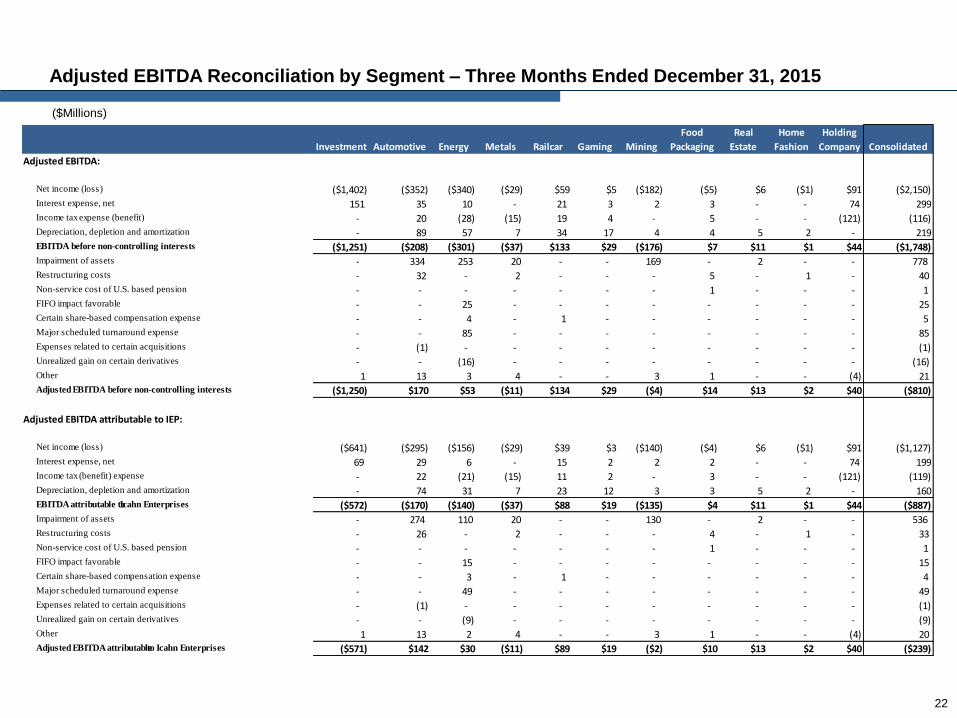
Adjusted EBITDA Reconciliation by Segment – Three Months Ended December 31, 2015
($Millions)
22
Investment Automotive Energy Metals Railcar Gaming Mining
Food
Packaging
Real
Estate
Home
Fashion
Holding
Company Consolidated
Adjusted EBITDA:
Net income (loss) ($1,402) ($352) ($340) ($29) $59 $5 ($182) ($5) $6 ($1) $91 ($2,150)Interest expense, net 151 35 10 - 21 3 2 3 - - 74 299 Income tax expense (benefit) - 20 (28) (15) 19 4 - 5 - - (121) (116)Depreciation, depletion and amortization - 89 57 7 34 17 4 4 5 2 - 219 EBITDA before non-controlling interests ($1,251) ($208) ($301) ($37) $133 $29 ($176) $7 $11 $1 $44 ($1,748)Impairment of assets - 334 253 20 - - 169 - 2 - - 778 Restructuring costs - 32 - 2 - - - 5 - 1 - 40 Non-service cost of U.S. based pension - - - - - - - 1 - - - 1 FIFO impact favorable - - 25 - - - - - - - - 25 Certain share-based compensation expense - - 4 - 1 - - - - - - 5 Major scheduled turnaround expense - - 85 - - - - - - - - 85 Expenses related to certain acquisitions - (1) - - - - - - - - - (1)Unrealized gain on certain derivatives - - (16) - - - - - - - - (16)Other 1 13 3 4 - - 3 1 - - (4) 21 Adjusted EBITDA before non-controlling interests ($1,250) $170 $53 ($11) $134 $29 ($4) $14 $13 $2 $40 ($810)
Adjusted EBITDA attributable to IEP:
Net income (loss) ($641) ($295) ($156) ($29) $39 $3 ($140) ($4) $6 ($1) $91 ($1,127)Interest expense, net 69 29 6 - 15 2 2 2 - - 74 199 Income tax (benefit) expense - 22 (21) (15) 11 2 - 3 - - (121) (119)Depreciation, depletion and amortization - 74 31 7 23 12 3 3 5 2 - 160 EBITDA attributable to Icahn Enterprises ($572) ($170) ($140) ($37) $88 $19 ($135) $4 $11 $1 $44 ($887)Impairment of assets - 274 110 20 - - 130 - 2 - - 536 Restructuring costs - 26 - 2 - - - 4 - 1 - 33 Non-service cost of U.S. based pension - - - - - - - 1 - - - 1 FIFO impact favorable - - 15 - - - - - - - - 15 Certain share-based compensation expense - - 3 - 1 - - - - - - 4 Major scheduled turnaround expense - - 49 - - - - - - - - 49 Expenses related to certain acquisitions - (1) - - - - - - - - - (1)Unrealized gain on certain derivatives - - (9) - - - - - - - - (9)Other 1 13 2 4 - - 3 1 - - (4) 20 Adjusted EBITDA attributable to Icahn Enterprises ($571) $142 $30 ($11) $89 $19 ($2) $10 $13 $2 $40 ($239)
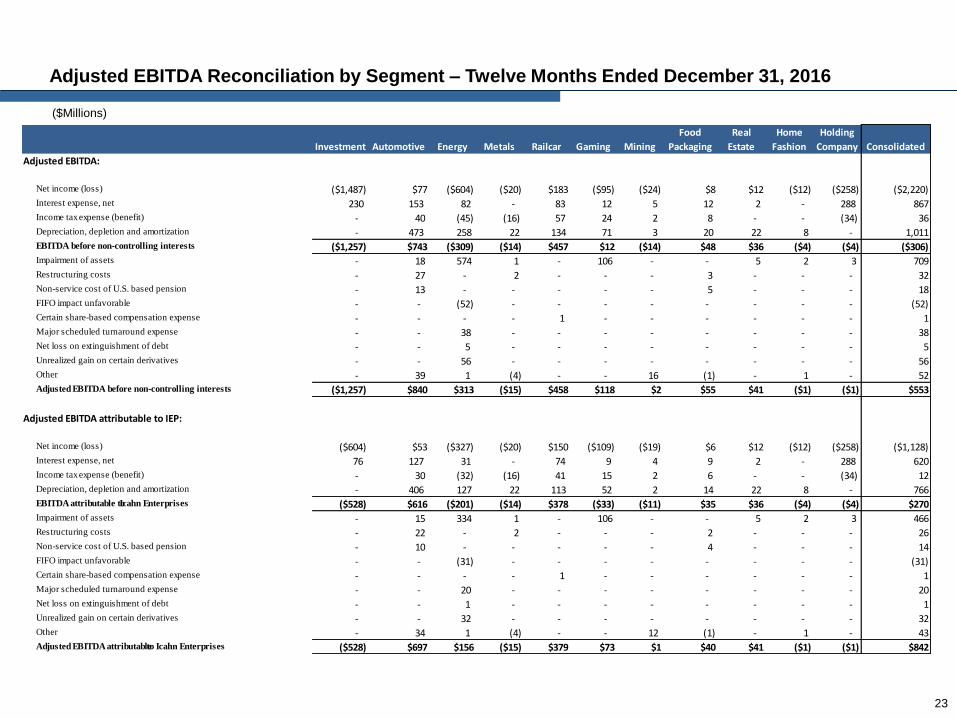
Adjusted EBITDA Reconciliation by Segment – Twelve Months Ended December 31, 2016
($Millions)
23
Investment Automotive Energy Metals Railcar Gaming Mining
Food
Packaging
Real
Estate
Home
Fashion
Holding
Company Consolidated
Adjusted EBITDA:
Net income (loss) ($1,487) $77 ($604) ($20) $183 ($95) ($24) $8 $12 ($12) ($258) ($2,220)Interest expense, net 230 153 82 - 83 12 5 12 2 - 288 867 Income tax expense (benefit) - 40 (45) (16) 57 24 2 8 - - (34) 36 Depreciation, depletion and amortization - 473 258 22 134 71 3 20 22 8 - 1,011 EBITDA before non-controlling interests ($1,257) $743 ($309) ($14) $457 $12 ($14) $48 $36 ($4) ($4) ($306)Impairment of assets - 18 574 1 - 106 - - 5 2 3 709 Restructuring costs - 27 - 2 - - - 3 - - - 32 Non-service cost of U.S. based pension - 13 - - - - - 5 - - - 18 FIFO impact unfavorable - - (52) - - - - - - - - (52)Certain share-based compensation expense - - - - 1 - - - - - - 1 Major scheduled turnaround expense - - 38 - - - - - - - - 38 Net loss on extinguishment of debt - - 5 - - - - - - - - 5 Unrealized gain on certain derivatives - - 56 - - - - - - - - 56 Other - 39 1 (4) - - 16 (1) - 1 - 52 Adjusted EBITDA before non-controlling interests ($1,257) $840 $313 ($15) $458 $118 $2 $55 $41 ($1) ($1) $553
Adjusted EBITDA attributable to IEP:
Net income (loss) ($604) $53 ($327) ($20) $150 ($109) ($19) $6 $12 ($12) ($258) ($1,128)Interest expense, net 76 127 31 - 74 9 4 9 2 - 288 620 Income tax expense (benefit) - 30 (32) (16) 41 15 2 6 - - (34) 12 Depreciation, depletion and amortization - 406 127 22 113 52 2 14 22 8 - 766 EBITDA attributable to Icahn Enterprises ($528) $616 ($201) ($14) $378 ($33) ($11) $35 $36 ($4) ($4) $270 Impairment of assets - 15 334 1 - 106 - - 5 2 3 466 Restructuring costs - 22 - 2 - - - 2 - - - 26 Non-service cost of U.S. based pension - 10 - - - - - 4 - - - 14 FIFO impact unfavorable - - (31) - - - - - - - - (31)Certain share-based compensation expense - - - - 1 - - - - - - 1 Major scheduled turnaround expense - - 20 - - - - - - - - 20 Net loss on extinguishment of debt - - 1 - - - - - - - - 1 Unrealized gain on certain derivatives - - 32 - - - - - - - - 32 Other - 34 1 (4) - - 12 (1) - 1 - 43 Adjusted EBITDA attributable to Icahn Enterprises ($528) $697 $156 ($15) $379 $73 $1 $40 $41 ($1) ($1) $842
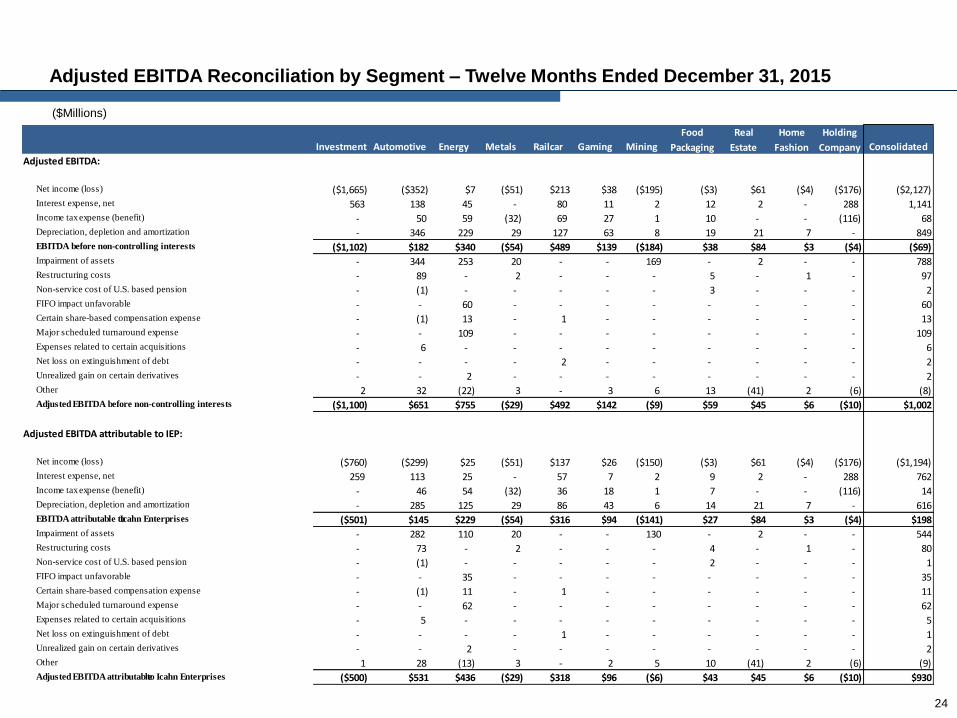
Adjusted EBITDA Reconciliation by Segment – Twelve Months Ended December 31, 2015
($Millions)
24
Investment Automotive Energy Metals Railcar Gaming Mining
Food
Packaging
Real
Estate
Home
Fashion
Holding
Company Consolidated
Adjusted EBITDA:
Net income (loss) ($1,665) ($352) $7 ($51) $213 $38 ($195) ($3) $61 ($4) ($176) ($2,127)Interest expense, net 563 138 45 - 80 11 2 12 2 - 288 1,141 Income tax expense (benefit) - 50 59 (32) 69 27 1 10 - - (116) 68 Depreciation, depletion and amortization - 346 229 29 127 63 8 19 21 7 - 849 EBITDA before non-controlling interests ($1,102) $182 $340 ($54) $489 $139 ($184) $38 $84 $3 ($4) ($69)Impairment of assets - 344 253 20 - - 169 - 2 - - 788 Restructuring costs - 89 - 2 - - - 5 - 1 - 97 Non-service cost of U.S. based pension - (1) - - - - - 3 - - - 2 FIFO impact unfavorable - - 60 - - - - - - - - 60 Certain share-based compensation expense - (1) 13 - 1 - - - - - - 13 Major scheduled turnaround expense - - 109 - - - - - - - - 109 Expenses related to certain acquisitions - 6 - - - - - - - - - 6 Net loss on extinguishment of debt - - - - 2 - - - - - - 2 Unrealized gain on certain derivatives - - 2 - - - - - - - - 2 Other 2 32 (22) 3 - 3 6 13 (41) 2 (6) (8)Adjusted EBITDA before non-controlling interests ($1,100) $651 $755 ($29) $492 $142 ($9) $59 $45 $6 ($10) $1,002
Adjusted EBITDA attributable to IEP:
Net income (loss) ($760) ($299) $25 ($51) $137 $26 ($150) ($3) $61 ($4) ($176) ($1,194)Interest expense, net 259 113 25 - 57 7 2 9 2 - 288 762 Income tax expense (benefit) - 46 54 (32) 36 18 1 7 - - (116) 14 Depreciation, depletion and amortization - 285 125 29 86 43 6 14 21 7 - 616 EBITDA attributable to Icahn Enterprises ($501) $145 $229 ($54) $316 $94 ($141) $27 $84 $3 ($4) $198 Impairment of assets - 282 110 20 - - 130 - 2 - - 544 Restructuring costs - 73 - 2 - - - 4 - 1 - 80 Non-service cost of U.S. based pension - (1) - - - - - 2 - - - 1 FIFO impact unfavorable - - 35 - - - - - - - - 35 Certain share-based compensation expense - (1) 11 - 1 - - - - - - 11 Major scheduled turnaround expense - - 62 - - - - - - - - 62 Expenses related to certain acquisitions - 5 - - - - - - - - - 5 Net loss on extinguishment of debt - - - - 1 - - - - - - 1 Unrealized gain on certain derivatives - - 2 - - - - - - - - 2 Other 1 28 (13) 3 - 2 5 10 (41) 2 (6) (9)Adjusted EBITDA attributable to Icahn Enterprises ($500) $531 $436 ($29) $318 $96 ($6) $43 $45 $6 ($10) $930