ice ages and the mitochondrial dna chronology of human ... · ice ages and the mitochondrial dna...
TRANSCRIPT
Published online 13 January 2004
Ice Ages and the mitochondrial DNA chronologyof human dispersals: a review
Peter ForsterThe McDonald Institute for Archaeological Research, University of Cambridge, Downing Street, Cambridge CB2 3ER, UK
Modern DNA, in particular maternally inherited mitochondrial DNA (mtDNA), is now routinely usedto trace ancient human migration routes and to obtain absolute dates for genetic prehistory. The errorson absolute genetic dates are often large (50% or more) and depend partly on the inherent evolutionarysignal in the DNA data, and partly on our imperfect knowledge of the DNA mutation rate. Despite theirimprecision, the genetic dates do provide an independent, consistent and global chronology linking livinghumans with their ancestors. Combining this chronology with archaeological and climatological data, mostof our own mtDNA studies during the past decade strongly imply a major role for palaeoclimate indetermining conditions for prehistoric migrations and demographic expansions. This paper summarizesour interpretation of the genetic findings, covering the initial and modest spread of humans within Africamore than 100 ka, the striking re-expansion within Africa 60–80 ka, leading ultimately to the out-of-Africamigration of a single, small group which settled in Australia, Eurasia and America during windows ofopportunity at least partly dictated by fluctuations in sea-levels and climatic conditions.
Keywords: female; migration; prehistory; genetics; palaeoclimate; demography
1. INTRODUCTION
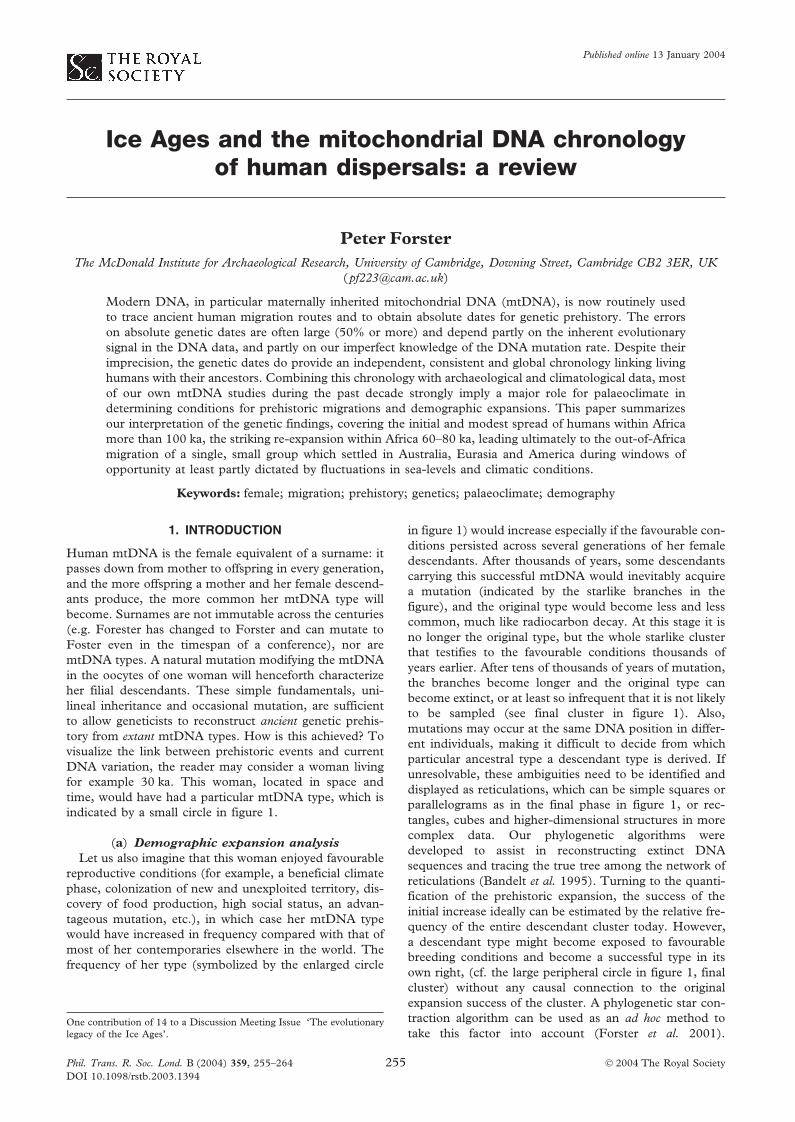
Human mtDNA is the female equivalent of a surname: itpasses down from mother to offspring in every generation,and the more offspring a mother and her female descend-ants produce, the more common her mtDNA type willbecome. Surnames are not immutable across the centuries(e.g. Forester has changed to Forster and can mutate toFoster even in the timespan of a conference), nor aremtDNA types. A natural mutation modifying the mtDNAin the oocytes of one woman will henceforth characterizeher filial descendants. These simple fundamentals, uni-lineal inheritance and occasional mutation, are sufficientto allow geneticists to reconstruct ancient genetic prehis-tory from extant mtDNA types. How is this achieved? Tovisualize the link between prehistoric events and currentDNA variation, the reader may consider a woman livingfor example 30 ka. This woman, located in space andtime, would have had a particular mtDNA type, which isindicated by a small circle in figure 1.
(a) Demographic expansion analysisLet us also imagine that this woman enjoyed favourable
reproductive conditions (for example, a beneficial climatephase, colonization of new and unexploited territory, dis-covery of food production, high social status, an advan-tageous mutation, etc.), in which case her mtDNA typewould have increased in frequency compared with that ofmost of her contemporaries elsewhere in the world. Thefrequency of her type (symbolized by the enlarged circle
One contribution of 14 to a Discussion Meeting Issue ‘The evolutionarylegacy of the Ice Ages’.
Phil. Trans. R. Soc. Lond. B (2004) 359, 255–264 255 2004 The Royal SocietyDOI 10.1098/rstb.2003.1394
in figure 1) would increase especially if the favourable con-ditions persisted across several generations of her femaledescendants. After thousands of years, some descendantscarrying this successful mtDNA would inevitably acquirea mutation (indicated by the starlike branches in thefigure), and the original type would become less and lesscommon, much like radiocarbon decay. At this stage it isno longer the original type, but the whole starlike clusterthat testifies to the favourable conditions thousands ofyears earlier. After tens of thousands of years of mutation,the branches become longer and the original type canbecome extinct, or at least so infrequent that it is not likelyto be sampled (see final cluster in figure 1). Also,mutations may occur at the same DNA position in differ-ent individuals, making it difficult to decide from whichparticular ancestral type a descendant type is derived. Ifunresolvable, these ambiguities need to be identified anddisplayed as reticulations, which can be simple squares orparallelograms as in the final phase in figure 1, or rec-tangles, cubes and higher-dimensional structures in morecomplex data. Our phylogenetic algorithms weredeveloped to assist in reconstructing extinct DNAsequences and tracing the true tree among the network ofreticulations (Bandelt et al. 1995). Turning to the quanti-fication of the prehistoric expansion, the success of theinitial increase ideally can be estimated by the relative fre-quency of the entire descendant cluster today. However,a descendant type might become exposed to favourablebreeding conditions and become a successful type in itsown right, (cf. the large peripheral circle in figure 1, finalcluster) without any causal connection to the originalexpansion success of the cluster. A phylogenetic star con-traction algorithm can be used as an ad hoc method totake this factor into account (Forster et al. 2001).
256 P. Forster Ice Ages and mtDNA chronology of human dispersals
16 217
13 068
9429
5985
16 30316 2
0814 6
48
16 3103337
16 310
12 528
598513 068
15 897
4464
8249
16 2
54
16 2
17
6258838
16 310
9429
369816 30316
208
14 6
48
16 310
5538
9553
0
time
space
13 2
68
13 268
16 303
16 2
08
Figure 1. Starlike cluster of mtDNA types resulting from a successful prehistoric maternal lineage. The cluster at the bottomright is one of the major Papuan clusters today. The original phase of breeding success (top left) occurred ca. 30 ka, probablyafter the arrival in Papua New Guinea. Numbers refer to positions (1–16 569) on the mtDNA at which mutations haveoccurred.
Incidentally, the phylogenetic methods mentioned hereare not restricted to DNA applications but have also beenapplied to the reconstruction of extinct amino acidsequences (Bandelt et al. 1999) and extinct languages(Forster et al. 1998; Forster & Toth 2003).
(b) Geographical founder analysisStarlike clusters in the evolutionary tree are in them-
selves interesting for dating and geographically localizingprehistoric demographic increase of an mtDNA type(which may have increased relative to others because itlived at a time and place of climatic improvement, becauseit underwent an advantageous mutation, etc.), but theyare not necessarily informative for counting and datingmtDNA types arriving in new territories. This is the taskof founder analysis (e.g. Torroni et al. 1993a,b; Forster etal. 1996; Richards et al. 2000), where an ancestral node(whether living, or extinct and phylogeneticallyreconstructed) shared between a source continent (e.g.Asia) and a destination continent (America) is identifiedas a founder mtDNA type having entered the continent.The age of the founder mtDNA type would yield a timeestimate for its arrival in the continent. In practice, severalmtDNA founders (sometimes arriving at quite differenttimes) are found in most continents. Often, founder typesshow the starlike signature of expansion (e.g. types A, B,C, and D in the Americas), which indicates that the dis-covery of a new continent led to noticeably increased sur-vival of offspring. In other instances, such as with putativeEuropean U founder types, the starlike signal is much lessevident (Richards et al. 2000). This may be due to thegreater time-depths involved, during which much of theancient lineage variation has been lost, or indeed theremay have been no significant increase in the lineage atthe time of entry into Europe, which was populated byNeanderthals until 30 ka.
Phil. Trans. R. Soc. Lond. B (2004)
(c) Genetic datingOnce the tree is reconstructed and an ancestral mtDNA
type of interest (for example, an expansion type, a foundertype or a disease type) is identified, the task of dating theancestors can begin. The age of the cluster is obtained byequating the average length of the branches with elapsedtime, measured in number of mutations (Morral et al.1994). A standard error on each date can be calculated(Saillard et al. 2000); this error reflects the number ofbranches available for estimation (which in turn is dictatedby the initial number of descendants generated, and bythe extent of subsequent lineage extinction during thevagaries of evolution) and the branching structure (forexample, five independent branches with one descendanteach yield a more reliable time estimate than one branchwith five descendants). ‘Mutational’ time can then be con-verted to absolute time by multiplying it with the mutationrate, if the DNA mutation rate is known (Forster et al.1996). The mutation rate is the Achilles’ heel for anyDNA chronology. Whereas relative genetic dates and theirrelative standard errors (expressed in mutations) arestraightforward to determine, their conversion to accurateabsolute dates (expressed in years) depends entirely on theestimated mtDNA mutation rate. Some efforts, albeitunsystematic, have been undertaken to determine mtDNAmutation rates using three different methods.
(i) For fossil-based calibrations, species splits identifiedand physically dated in fossil phylogenies are com-pared with equivalent splits in the DNA tree of theliving species, yielding a mutation rate for the DNA.The inherent drawback of any fossil calibration is thequestion of whether mutation rates have remainedconstant since the split.
(ii) Pedigree calibrations screen members of a family fornew mutations. However, it is quite likely that DNA
Ice Ages and mtDNA chronology of human dispersals P. Forster 257
mismatches are due to undisclosed adoptions, orunfaithful marriage partners. Without maternitytesting in our own mtDNA pedigree study of 991individuals (Forster et al. 2002), we would have‘found’ 25 full mutations instead of none. Anotherproblem in pedigree studies, specific to mtDNA, isthe distinction between ‘full’ homoplasmicmutations and initial ‘partial’ or heteroplasmicmutations (Bendall et al. 1997). Such problems canlead to a considerable error, implying for examplean implausible age of only 6 kyr for the mtDNAancestor of all modern humans (Parsons et al. 1997).It is often thought that mutational hotspots explainthis discrepancy, but that is an arithmetical faux-pas(Sigurðardottir et al. 2000).
(iii) In archaeological calibrations, the archaeologicalrecord ideally is dense enough to provide bench-marks for initial settlement or resettlement of adefined area. If these settlers have left at least somesurviving allele lineages until today, then the diver-sity of each of these founding lineages can beequated separately with the elapsed time since thearchaeological benchmark. We have used thisapproach in Alaska and in the Cook Islands (Forsteret al. 1996; Macaulay et al. 1997). It would fail iffounding lineages were replaced completely by laterimmigrants. Another potential problem is the demo-graphic history of the founding alleles: if a markedallele increase did not occur soon after the bench-mark, then there is a paucity of lineages and thus ofindependent estimators to the founder type, generat-ing a large standard error in the calibration, as weruefully noted in Saillard et al. (2000). Nevertheless,the archaeologically based mutation rate weobtained (Forster et al. 1996, 2001) is similar to thevalue obtained from the independent calibration ofHorai et al. (1995) using primate mtDNA, andserves as a reference value for this paper. Any futureimproved calibration for the mutation rate candirectly be multiplied with the values presentedthroughout this paper to obtain improved absolutetime estimates. For example, if the out-of-Africafounder date were doubled from 55 to 110 ka (e.g.to accommodate the Skhul/Qafzeh remains as theancestors of today’s Eurasians), then the mtDNAdate for the migration into the Americas would cor-respondingly increase from 25 to 50 ka. Likewise, anew calibration (Mishmar et al. 2003) assuming ahuman–chimpanzee split 6.5 Ma yields mtDNA ageestimates that are in general somewhat older thanthose proposed here.
(d) NomenclatureWhen referring to branches (also known as ‘clades’ or
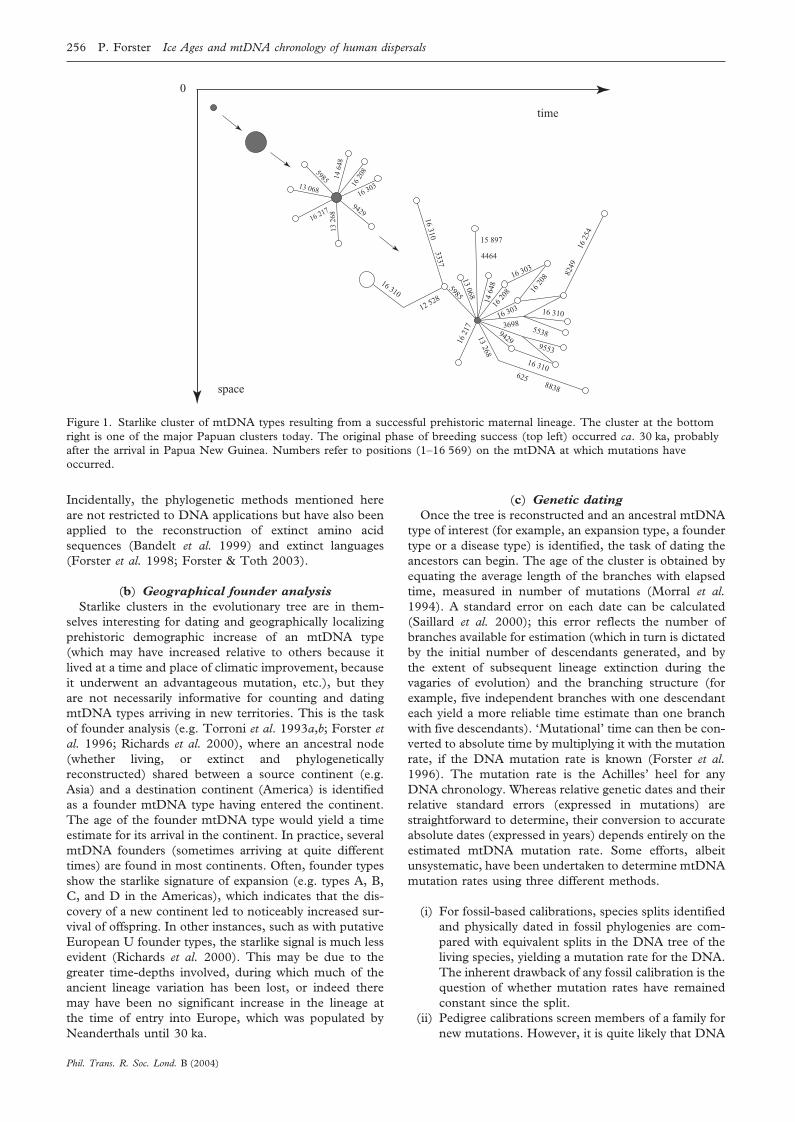
‘haplogroups’) in the mtDNA tree, the mtDNA phylogen-etic nomenclature initiated by Torroni et al. (1993b) andupdated by Macaulay et al. (1999) and Richards &Macaulay (2000) is used. Each branch consists of severalmtDNA types, either extinct or living. The types discussedin this paper are named after the branches in which theylie. Only a selection of mtDNA types is shown on themaps of figure 2, for space reasons.
Phil. Trans. R. Soc. Lond. B (2004)
2. RESULTS: THE HUMAN MITOCHONDRIAL DNACHRONOLOGY
(a) Before modern humans: 2.5–0.2 MaThe rise of the genus Homo at ca. 2.5 Ma in Africa is
characterized by the first significant increase in brain sizesince the split from the apes more than 5 Ma, and by thewidespread use of stone tools. It may well be theseadvances that enabled Homo to spread out of Africa,unlike his Australopithecine predecessors, leaving a fossiltrail in Dmanisi, Georgia (1.75 Myr old (Vekua et al.2002)) and in Java (more than 1.5 Myr old (Larick et al.2001)). Between this early migration and the migration ofmodern humans out of Africa less than 100 ka, lies thedate of the human–Neanderthal split ca. 0.5 Ma calcu-lated from ancient Neanderthal mtDNA (Krings et al.1997). It should be noted that this date times the splitbetween the modern human and Neanderthal mtDNA lin-eages. It would time the species split only if just onemtDNA type were present in the common ancestral popu-lation. Assuming such monomorphy as a rough approxi-mation of the truth (indeed, modern human mtDNA aswell as the few Neanderthal mtDNA sequences obtainedso far have relatively limited mtDNA diversity), the0.5 Ma date would place the Neanderthal–human split atthe time of Homo heidelbergensis (Lahr & Foley 1998).
(b) Rise of Homo sapiens: 200–80 kaThe maternal lineages of all living humans coalesce in
‘mitochondrial Eve’, born in South or East Africa morethan 130 ka. The earliest lineages, known as L1 types(Watson et al. 1997), are restricted to Africa and, at fre-quencies of less than 1%, immediately adjacent Arabianand Mediterranean areas. In the fossil record, this periodalso marks the transition to anatomically modern humans(Day & Stringer 1982; Brauer 1989; White et al. 2003),in the remains of Herto and Omo (East Africa), KlasiesRiver Mouth (South Africa) and Skhul/Qafzeh (Israel).The fact that today’s mtDNA lineages ultimately coalescein one woman is not remarkable; all genes necessarilycoalesce at some point in the past. But it is interesting thatrather few mtDNA lineages (probably between one andeight distinct mtDNA types, see for example fig. 2 of Salaset al. (2002)) have survived from the time of the fossilarchaic–modern transition, possibly suggesting that thebreeding female population size at the birth of our specieswas modest. The mtDNA tree for several of these earliestlineages shows strong geographical structure today: cladesL1d and L1k occur only in southern Africa, particularlyin the Khoisan (Bushmen), clade L1c is found only incentral and western Africans, particularly in the Biaka(West Pygmies), and L1e and L1f are characteristic for aproportion of east Africans. This pattern has been inter-preted (Watson et al. 1997) as the surviving footprints ofan early spread across Africa, dated between the coalesc-ent age of 130 ka or more, and the onset of the majorAfrican re-expansion 60–80 ka. This early wave acrossAfrica coincides with the emergence of modern humanbehaviour: the first evidence for a marine diet is docu-mented at ca. 125 ka in east Africa (reviewed by Stringer2000) and geometric notches on bone (rudimentary art?)dated to 70 ka are found at Blombos Cave in South Africa(Henshilwood et al. 2002).
258 P. Forster Ice Ages and mtDNA chronology of human dispersals
L1L1
L1
L
Neanderthals
Homo erectus
Omo valley,Ethiopia
Klasies River Mouth,South Africa
Skhul/Qafzeh,Israel
L1
L1
L1
Neanderthals
Homo erectus?
L2 L3
L2L3 L2
L3
NM
(a)
Neanderthals
Lake Mungo,Australia
Niah Cave,Borneo
L1
L1
L1
L2 L3
L2L3 L2
L3
NM
NIU
H JT
NM
MN
Q
P
Mz Nz
NM
AB F
DMy
Mx Mx Mx
R U
(b)
(c)
Figure 2 (a–c). Evolution, expansion and migration of human mtDNA types across the world: (a) 200–100 ka; (b) 80–60 ka;(c) 60–30 ka.
Phil. Trans. R. Soc. Lond. B (2004)
Ice Ages and mtDNA chronology of human dispersals P. Forster 259
Zhoukoudian,China
Masterov Kliuch,Siberia
L1
L1
L1
L2 L3
L2L3 L2
L3
N R
IU
H JT
U M
NM
AB F
DMy
Gravettian,Europe
C
Mx Mx Mx
XAB C
D
X
L1
L1
L1
L2 L3
L2L3 L2
L3
NR
IUH
JT
V
Mx
QP
MzNz
Ny
A
BFD
My
Meadowcroft,Pennsylvania
C
AB C
D
X
A
B CD
D A
H
UR
L1
L1
L1
L2 L3
L2L3 L2
L3
NR
IUH
JT
V
Mx
QP
MzNz
NyA
BF
D
My
Clovis,New Mexico
C
AB C
D
X
A
B CD
D A
H
UR
Monte Verde,Chile
A
A
Magdalenian,Europe
Monte Allegre,Brazil
Studenoe,Siberia
I
UH VC Y
Z
Mesa site,Alaska
MN
Q
P
Mz Nz
RM1 R M1
(d )
(e)
( f )
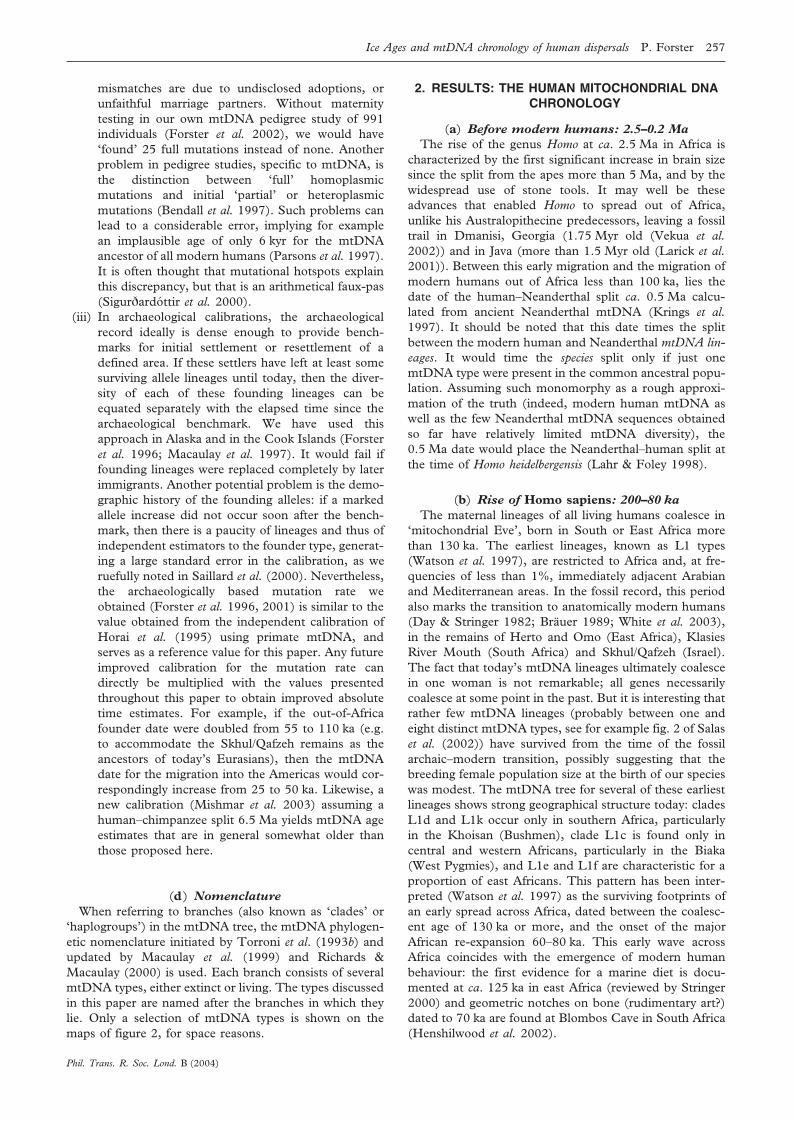
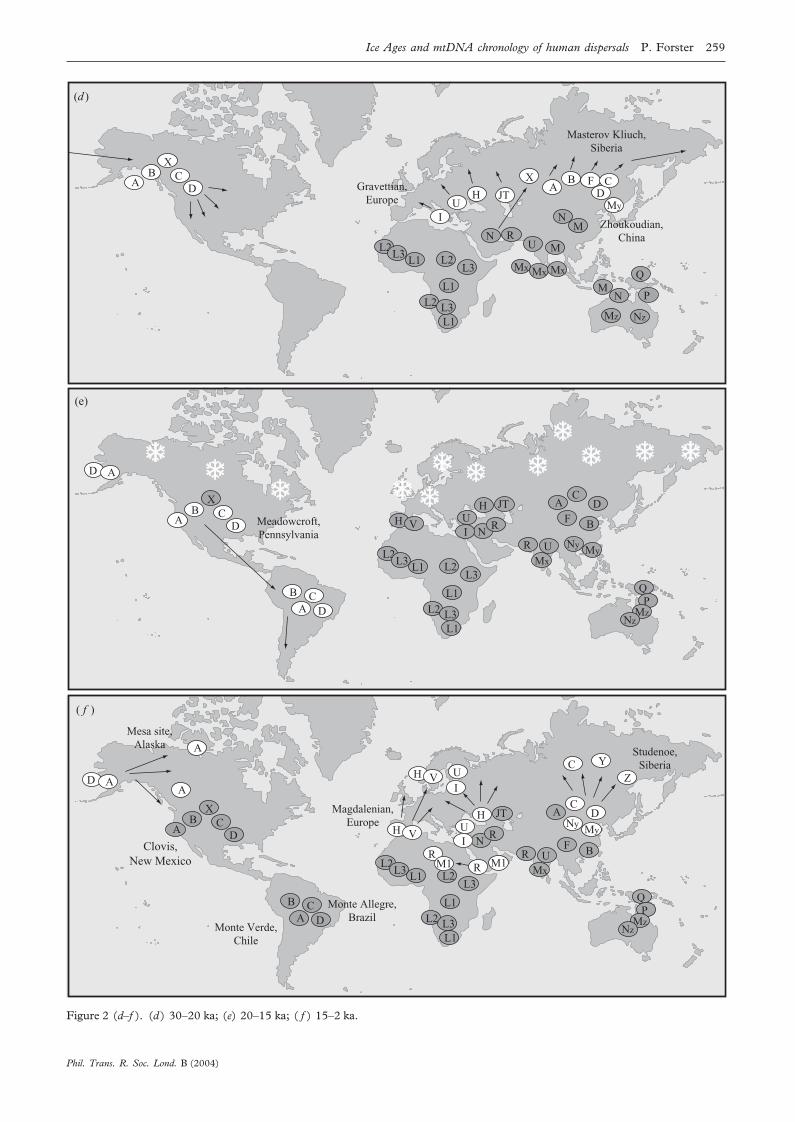
Figure 2 (d–f ). (d ) 30–20 ka; (e) 20–15 ka; ( f ) 15–2 ka.
Phil. Trans. R. Soc. Lond. B (2004)
260 P. Forster Ice Ages and mtDNA chronology of human dispersals
L1
L1
L1
L2 L3
L2L3 L2
L3
NR
IUH
J
V
Mx
QP
MzNz
NyA
BF
D
My
C
AB C
D
X
A
B CD
D A
H
UR
A
A I
UH VC Y
Z
A
B
B
B
A A
JT
T
RM1 R M1
B
BF B
B
B
(g)
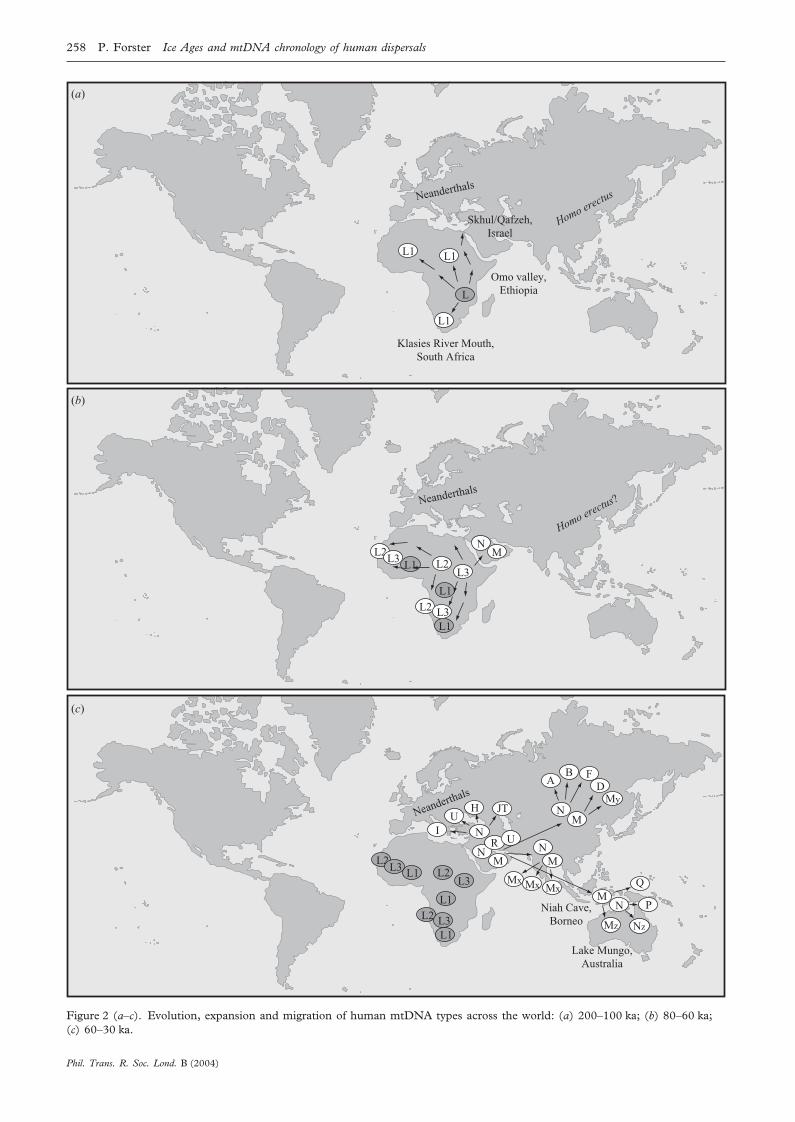
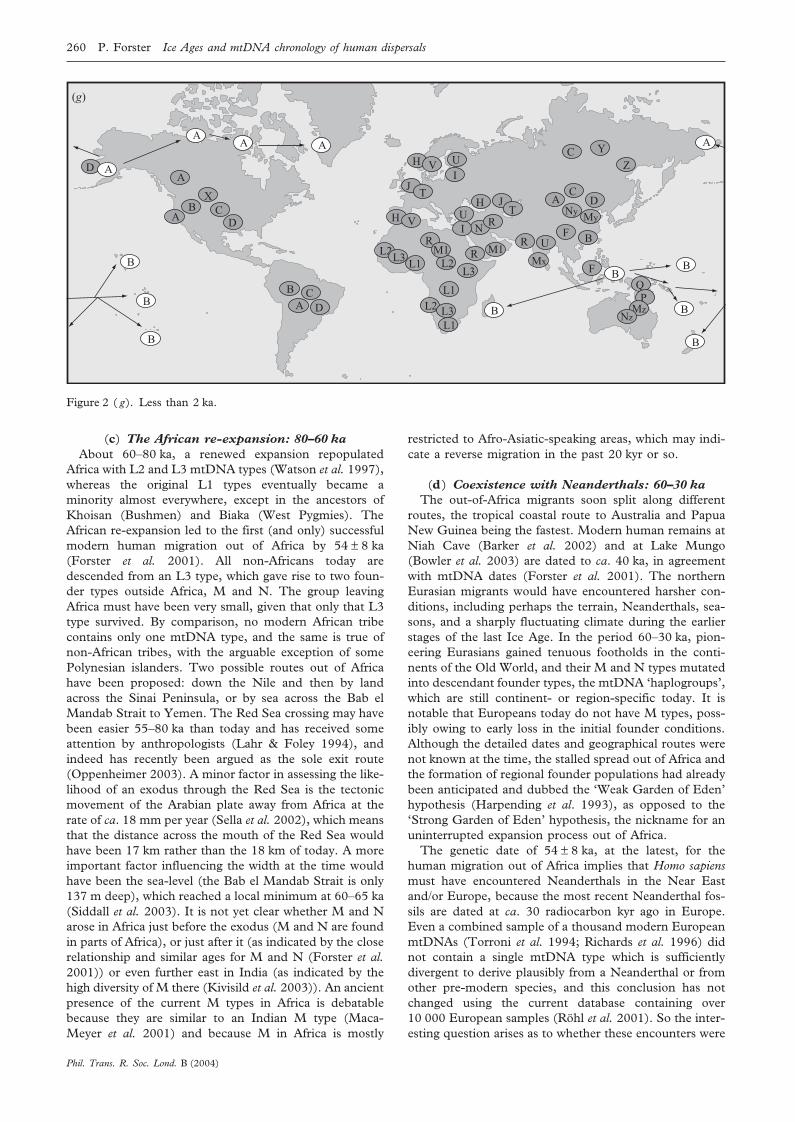
Figure 2 ( g). Less than 2 ka.
(c) The African re-expansion: 80–60 kaAbout 60–80 ka, a renewed expansion repopulated
Africa with L2 and L3 mtDNA types (Watson et al. 1997),whereas the original L1 types eventually became aminority almost everywhere, except in the ancestors ofKhoisan (Bushmen) and Biaka (West Pygmies). TheAfrican re-expansion led to the first (and only) successfulmodern human migration out of Africa by 54 ± 8 ka(Forster et al. 2001). All non-Africans today aredescended from an L3 type, which gave rise to two foun-der types outside Africa, M and N. The group leavingAfrica must have been very small, given that only that L3type survived. By comparison, no modern African tribecontains only one mtDNA type, and the same is true ofnon-African tribes, with the arguable exception of somePolynesian islanders. Two possible routes out of Africahave been proposed: down the Nile and then by landacross the Sinai Peninsula, or by sea across the Bab elMandab Strait to Yemen. The Red Sea crossing may havebeen easier 55–80 ka than today and has received someattention by anthropologists (Lahr & Foley 1994), andindeed has recently been argued as the sole exit route(Oppenheimer 2003). A minor factor in assessing the like-lihood of an exodus through the Red Sea is the tectonicmovement of the Arabian plate away from Africa at therate of ca. 18 mm per year (Sella et al. 2002), which meansthat the distance across the mouth of the Red Sea wouldhave been 17 km rather than the 18 km of today. A moreimportant factor influencing the width at the time wouldhave been the sea-level (the Bab el Mandab Strait is only137 m deep), which reached a local minimum at 60–65 ka(Siddall et al. 2003). It is not yet clear whether M and Narose in Africa just before the exodus (M and N are foundin parts of Africa), or just after it (as indicated by the closerelationship and similar ages for M and N (Forster et al.2001)) or even further east in India (as indicated by thehigh diversity of M there (Kivisild et al. 2003)). An ancientpresence of the current M types in Africa is debatablebecause they are similar to an Indian M type (Maca-Meyer et al. 2001) and because M in Africa is mostly
Phil. Trans. R. Soc. Lond. B (2004)
restricted to Afro-Asiatic-speaking areas, which may indi-cate a reverse migration in the past 20 kyr or so.
(d) Coexistence with Neanderthals: 60–30 kaThe out-of-Africa migrants soon split along different
routes, the tropical coastal route to Australia and PapuaNew Guinea being the fastest. Modern human remains atNiah Cave (Barker et al. 2002) and at Lake Mungo(Bowler et al. 2003) are dated to ca. 40 ka, in agreementwith mtDNA dates (Forster et al. 2001). The northernEurasian migrants would have encountered harsher con-ditions, including perhaps the terrain, Neanderthals, sea-sons, and a sharply fluctuating climate during the earlierstages of the last Ice Age. In the period 60–30 ka, pion-eering Eurasians gained tenuous footholds in the conti-nents of the Old World, and their M and N types mutatedinto descendant founder types, the mtDNA ‘haplogroups’,which are still continent- or region-specific today. It isnotable that Europeans today do not have M types, poss-ibly owing to early loss in the initial founder conditions.Although the detailed dates and geographical routes werenot known at the time, the stalled spread out of Africa andthe formation of regional founder populations had alreadybeen anticipated and dubbed the ‘Weak Garden of Eden’hypothesis (Harpending et al. 1993), as opposed to the‘Strong Garden of Eden’ hypothesis, the nickname for anuninterrupted expansion process out of Africa.
The genetic date of 54 ± 8 ka, at the latest, for thehuman migration out of Africa implies that Homo sapiensmust have encountered Neanderthals in the Near Eastand/or Europe, because the most recent Neanderthal fos-sils are dated at ca. 30 radiocarbon kyr ago in Europe.Even a combined sample of a thousand modern EuropeanmtDNAs (Torroni et al. 1994; Richards et al. 1996) didnot contain a single mtDNA type which is sufficientlydivergent to derive plausibly from a Neanderthal or fromother pre-modern species, and this conclusion has notchanged using the current database containing over10 000 European samples (Rohl et al. 2001). So the inter-esting question arises as to whether these encounters were
Ice Ages and mtDNA chronology of human dispersals P. Forster 261
brief and incompatible with life for Neanderthals, orwhether there was coexistence, possibly for many millen-nia. Much has been made of the proximity of Middle East-ern ‘modern’ crania in Skhul/Qafzeh dated at ca. 100 ka,to neighbouring Neanderthal fossils in Tabun dated at ca.50 ka (reviewed in Jordan 1999). But the Skhul/Qafzehfossils may not be relevant to the question of Neanderthal/modern human coexistence, because the genetic out-of-Africa date indicates that the Skhul/Qafzeh individualswere an evolutionary dead-end, in agreement with theirrugged morphology, which includes pronounced brow-ridges. Likewise in Europe, the raw archaeological datessuggest coexistence between moderns and Neanderthalsduring the initial period (45–30 ka) of the Aurignacianculture, whereas the mtDNA record finds only some evi-dence for human presence before the appearance of theGravettian culture at 30 ka (Richards et al. 2000). ThemtDNA may suggest therefore that archaic humans suchas Neanderthals survived contemporaneously with mod-ern humans for a few thousand years at best, and onlybecause the population density of moderns was initiallylow.
(e) Consolidation outside Africa: 30–20 kaThe climatic oscillations of the last Ice Age stabilized at
30 ka (the transition from glacial stage 3 to stage 2), localHomo sapiens populations grew strongly, evidenced bystarlike mtDNA clusters (Forster et al. 2001), expandedinto Europe and northern Asia, and drove Homo neander-thalensis to extinction. Our ancestors appear to havereplaced all pre-existing Eurasian Homo erectus or Homoneanderthalensis mtDNA types, given that no divergent(i.e. Neanderthal) mtDNA types have been found in anysurvey of modern humans (see above). The demographicexpansion signal in the mtDNA, dated to 30 ka, may inci-dentally coincide with archaeological evidence for modernhuman presence increasing at this time (Gravettian cul-ture in Europe, Zhoukoudian fossils in China). Anothermajor result of this expansion was the settlement of theAmericas. About 25 ka the sea-level was 120 m lower thanit is today, and America and Asia were connected by thewide land bridge of Beringia, now submerged. Beringia isknown to have supported large mammals (Zazula et al.2003). According to mtDNA founder analysis (Forster etal. 1996), a small group of Asians from northern Siberiamoved into the Americas, whose characteristic mtDNAtypes A, B, C and D are found today in tribes across theAmericas (Merriwether et al. 1994): all of them speakersof an ancestral Amerind language according to the lateJoseph Greenberg and colleagues (1986). In other words,linguists are capable, in principle, of reconstructing IceAge language relationships.
(f ) Retreat during the glacial maximum: 20–15 kaAbout 20 ka the glacial maximum was attained, forcing
humans to retreat southwards. Based on mtDNA staranalysis, we have proposed glacial refuges in Beringia andIberia, where survivors were narrowed to A/D and H/Vtypes respectively. The migrant group that entered Amer-ica just before the glacial maximum was subsequently splitinto two areas by the glacial conditions. One group sur-vived in Beringia (losing the original B, C and X types)and their descendants would later become the Eskimo-
Phil. Trans. R. Soc. Lond. B (2004)
Aleut and Dene-speaking peoples. The other, larger groupwere the Amerinds who proceeded to colonize the Amer-icas, arriving in Meadowcroft (Pennsylvania) by ca.18 000 calendar years ago (Adovasio 1993), and in MonteVerde (Chile) by 14 000 calendar years ago (Dillehay &Collins 1988). If we accept our 20–25 ka mtDNA date forthe entry into Alaska, then the minimal southwardmigration speed of Amerinds from Beringia to Chilewould amount to ca. 1000 m per year. This rate seemsplausible as it is the same order of magnitude as the mini-mal eastward migration speed of 300 m per year fromAfrica to east Asia, assuming a mean value of 31 ka as alower limit for the arrival in east Asia of the African foun-ders (a distance of ca. 8000 km) and 54 ka as the startingdate. Similarly, the arrival of the east African L2/L3expansion (60 kyr old) in west Africa by 30 ka (Watson etal. 1997) implies a westward migration speed of at least200 m per year. An entry into America 20–25 ka, and thesubsequent arrival date in South America, is thereforeconsistent with migration rates determined for other conti-nents.
(g) Postglacial recolonization: 15–20 kaThe Bølling/Allerød warm phases (15–13 ka) caused a
partial glacial retreat and a resettlement of northern lati-tudes by humans. The resulting reduced diversity in thenorth is evidenced today by the striking predominance ofA (nearly 100%) in Eskimo-Aleut and Na Dene speakers,by the very high percentages (50–60%) of H and V innorthwestern Europeans, which appears to have arisenfrom a founder effect from the Iberian peninsula or south-ern France (Torroni et al. 1998, 2001) and by the com-plete loss of the minor type X and even the major type Bin northern Asia (Shields et al. 1993). Distinctive archaeo-logical cultures testifying to the re-expansion after theLGM include the Magdalenian culture in Europe and theClovis culture in North America. Furthermore, linguisticsignals for the post-LGM expansion have been proposedfor Europe (reviewed by Hamel et al. 2002).
The last phase (the Younger Dryas phase) of the IceAge ended suddenly 11.4 ka (Bjorck et al. 1996), withinjust a decade (Alley et al. 1993). The ensuing climaticstability, unprecedented in the last 100 kyr, allowed thedevelopment of agriculture, with which major proto-languages may have spread, e.g. proto-Indo-European inEurope (Renfrew 1987; Forster & Toth 2003). Whetherthe spread of farming was also accompanied by a measur-able immigration of mtDNA types is the subject of currentresearch (Richards et al. 1996, 2000; Caramelli et al.2003).
(h) The final Holocene dispersals: less than 2 kaRemarkable settlement stories in the recent Holocene
include the peopling of Madagascar after ca. 2 ka(Dewar & Wright 1993) and the Pacific (by 1 ka (Green1991; Spriggs & Anderson 1993)) by seafaring Austronesi-ans (Richards et al. 1998), and the re-colonization ofGreenland by neo-Eskimos setting out from Alaska 2 ka.The neo-Eskimo migration is perhaps the most recentexample of glacial cycles significantly shaping humanmtDNA variation: palaeoclimatological research onGreenland ice cores has uncovered a 2600 year coolingcycle active throughout the Holocene (O’Brien et al.
262 P. Forster Ice Ages and mtDNA chronology of human dispersals
1995). The last cooling event was the Little Ice Age fromAD 1350–AD 1850, which extinguished the Viking colon-ies in Greenland after five centuries of flourishing exist-ence (Lynnerup 1998). In contrast to the Vikings, thecontemporary Greenlandic Eskimo inhabitants survivedthis latest cycle relatively unscathed, but their palaeo-Eskimo predecessors had been less fortunate in the pre-vious cooling event. According to a founder analysis ofSiberian, Alaskan and Greenlandic Eskimo mtDNA, allcurrent Eskimos, whether Yupik or Inuit speakers, derivefrom an Alaskan homeland as recently as 2 ka (Saillard etal. 2000). This genetic date implies that the first Green-landic palaeo-Eskimo culture, radiocarbon-dated to4.5 ka, succumbed to the subsequent cooling event 2.9 ka,in agreement with the archaeological record (Fitzhugh1984).
3. CONCLUSIONS
This synthesis argues that Ice Age conditions in the past100 kyr have substantially determined times and routes forprehistoric humans settling the world. An early exodus outof Africa evidenced by the remains at Skhul and Qafzeh100 ka has not left any descendants in today’s EurasianmtDNA pool. By contrast, the successful exodus ofwomen carrying M and N mtDNA at ca. 60 ka, ancestralto all non-African mtDNA today, may coincide with theunprecedented low sea-levels at that time, probably open-ing a route across the Red Sea to Yemen. Whereas proto-Australian and proto-Papuan mtDNA may have takenadvantage of the southern dispersal route along the bor-ders of the Indian Ocean to arrive at their destinationsrelatively rapidly (i.e. by 46 ka), more difficult conditionsin northern latitudes would have inhibited colonizationthere by the newcomers, giving Neanderthals a few millen-nia of respite before becoming extinct. At about the timeof the transition between glacial stages 2 and 3, significantexpansions take place in Europe (witnessed by the Gravet-tian culture 30 ka and the disappearance of Neanderthals)and northern Asia (witnessed by the Zhoukoudian finds),the latter ultimately leading to the settlement of the Amer-icas just before the LGM 20 ka, when the crossing toNorth America was facilitated by the lowered sea-level,turning Beringia into a land bridge. This glacial maximumwould have subsequently isolated most of America fromits Beringian and Asian source area, and depopulatednorthern latitudes across the world. The end of the IceAge enabled repopulation of northern Europe, Asia andAmerica from continental glacial refugia, leaving a geo-graphical signature in mtDNA and nuclear genes which isevident today. This overall account diminishes the geneticrole of Holocene movements, such as the spread of Neo-lithic farmers, and historical or mythological migrations byPhoenicians, Greeks and others. In terms of geneticimpact, only movements in much more recent colonialand postcolonial times can compare with the Ice-Agemovements of people 60–11 ka.
I thank Martin Richards (Huddersfield) and StephenOppenheimer (Oxford) for commenting on a previous versionof the manuscript, and for fruitful interaction throughout theprojects summarized here, and Giovanni Sella (Evanston) forstate-of the-art information on plate tectonics.
Phil. Trans. R. Soc. Lond. B (2004)
APPENDIX A
(a) Notes arising from the conference discussionThe mtDNA history recounted here was reconstructed
since 1992 with teams of collaborators, and is only oneview among several in the field. This is because a consen-sus on methodological questions has not yet been reached.In particular, the lineage approach described in § 1 isequated by some with the conceptually different popu-lation approach (the differing aims of the two are dis-cussed in Forster et al. 2001) and the role of data errorsin undermining meaningful analyses of mtDNA in the pastdecade is only gradually becoming apparent (Rohl et al.2001; Forster 2003). The strategy adopted in this paperis to integrate those modules of colleagues’ results that arerelevant to the lineage analytical perspective. Inevitably,future genetic research and archaeological discoveries willchange many of the conclusions presented here, and somedetails have been omitted intentionally for space reasons.To remedy the latter shortcoming, the reader may wish toconsult the literature below and our website for updates:http://www.mcdonald.cam.ac.uk/genetics/research.html.
REFERENCES
Adovasio, J. M. 1993 The ones that will not go away. A biasedview of pre-Clovis populations in the New World. In FromKostenki to Clovis: Upper Paleolithic-paleo-Indian adaptations(ed. O. Soffer & N. D. Praslov), pp. 199–218. New York:Plenum.
Alley, R. B. (and 10 others) 1993 Abrupt increase in Green-land snow accumulation at the end of the Younger Dryasevent. Nature 362, 527–529.
Bandelt, H.-J., Forster, P., Sykes, B. C. & Richards, M. B.1995 Mitochondrial portraits of human populations usingmedian networks. Genetics 141, 743–753.
Bandelt, H.-J., Forster, P. & Rohl, A. 1999 Median-joiningnetworks for inferring intraspecific phylogenies. Mol. Biol.Evol. 16, 37–48.
Barker, G. (and 19 others) 2002 Prehistoric foragers and far-mers in southeast Asia: renewed investigations at Niah Cave,Sarawak. Proc. Prehistoric Soc. 68, 147–164.
Bendall, K., Macaulay, V. & Sykes, B. 1997 Variable levels ofheteroplasmic point mutation in individual hair roots. Am.J. Hum. Genet. 61, 1303–1308.
Bjorck, S. (and 10 others) 1996 Synchronized terrestrial-atmospheric deglacial records around the North Atlantic.Science 274, 1155–1160.
Bowler, J. M., Johnston, H., Olley, J. M., Prescott, J. R., Rob-erts, R. G., Shawcross, W. & Spooner, N. A. 2003 New agesfor human occupation and climatic change at Lake Mungo,Australia. Nature 421, 837–840.
Brauer, G. 1989 The evolution of modern humans: a compari-son of the African and non-African evidence. In The humanrevolution: behavioural and biological perspectives in the originsof modern humans (ed. P. Mellars & C. Stringer), pp. 123–154. Edinburgh University Press.
Caramelli, D. (and 10 others) 2003 Evidence for a genetic dis-continuity between Neandertals and 24 000 year old ana-tomically modern Europeans. Proc. Natl Acad. Sci. USA 100,6593–6597.
Day, M. H. & Stringer, C. B. 1982 A reconsideration of theOmo Kibish remains and the erectus–sapiens transition. InL’Homo erectus et la place de l’homme de Tautavel parmi leshominides fossiles (ed. H. De Lumley), pp. 814–846. Nice,France: Centre National de la Recherche Scientifique/Louis-Jean Scientific and Literary.
Ice Ages and mtDNA chronology of human dispersals P. Forster 263
Dewar, R. E. & Wright, H. T. 1993 The culture history ofMadagascar. J. World Prehistory 7, 417–466.
Dillehay, T. D. & Collins, M. B. 1988 Early cultural evidencefrom Monte Verde in Chile. Nature 332, 150–152.
Fitzhugh, W. W. 1984 Palaeo-Eskimo cultures of Greenland.In Handbook of North American Indians, vol. 5 (ed. D.Damas), pp. 528–539. Washington, DC: Smithsonian Insti-tute.
Forster, P. 2003 To err is human. Ann. Hum. Genet. 67, 2–4.Forster, L., Forster, P., Lutz-Bonengel, S., Willkomm, H. &
Brinkmann, B. 2002 Natural radioactivity and human mito-chondrial DNA mutations. Proc. Natl Acad. Sci. USA 99,13 950–13 954.
Forster, P. & Toth, A. 2003 Toward a phylogenetic chronologyof ancient Gaulish, Celtic and Indo-European. Proc. NatlAcad. Sci. USA 100, 9079–9084.
Forster, P., Harding, R., Torroni, A. & Bandelt, H.-J. 1996Origin and evolution of native American mtDNA variation:a reappraisal. Am. J. Hum. Genet. 59, 935–945.
Forster, P., Toth, A. & Bandelt, H.-J. 1998 Evolutionary net-works of word lists: visualising the relationships betweenAlpine Romance languages. J. Quantitative Linguistics 5,174–187.
Forster, P., Torroni, A., Renfrew, C. & Rohl, A. 2001 Phylo-genetic star contraction applied to Asian and PapuanmtDNA evolution. Mol. Biol. Evol. 18, 1864–1881.
Green, R. C. 1991 Near and Remote Oceania: disestablishing‘Melanesia’ in culture history. In Man and a half (ed. A.Pawley), pp. 491–502. Auckland, New Zealand: Polyne-sian Society.
Greenberg, J. H., Turner, C. G. & Zegura, L. Z. 1986 Thesettlement of the Americas: a comparison of the linguistic,dental and genetic evidence. Curr. Anthropol. 27, 477–497.
Hamel, E., Vennemann, T. & Forster, P. 2002 Le vascon, pre-miere langue d’Europe. Pour la Science, vol. 299 (Vasconic, thefirst language of Europe. Scientific American, French edn, vol.299, September 2002).
Harpending, H. C., Sherry, S. T., Rogers, A. R. & Stoneking,M. 1993 The genetic structure of ancient human popu-lations. Curr. Anthropol. 34, 483–496.
Henshilwood, C. S. (and 10 others) 2002 Emergence of mod-ern human behavior: Middle Stone Age engravings fromSouth Africa. Science 295, 1278–1280.
Horai, S., Hayasaka, K., Kondo, R., Tsugane, K. & Takahata,N. 1995 Recent African origin of modern humans revealedby complete sequences of hominoid mitochondrial DNAs.Proc. Natl Acad. Sci. USA 92, 532–536.
Jordan, P. 1999 Neanderthal. Stroud, Gloucestershire, UK:Sutton Publishing.
Kivisild, T. (and 17 others) 2003 The genetic heritage of theearliest settlers persists both in Indian tribal and caste popu-lations. Am. J. Hum. Genet. 72, 313–332.
Krings, M., Stone, A., Schmitz, R. W., Krainitzki, H., Stonek-ing, M. & Paabo, S. 1997 Neandertal DNA sequences andthe origin of modern humans. Cell 90, 19–30.
Lahr, M. M. & Foley, R. A. 1994 Multiple dispersals and mod-ern human origins. Evol. Anthropol. 3, 48–60.
Lahr, M. M. & Foley, R. A. 1998 Towards a theory of modernhuman origins: geography, demography, and diversity inrecent human evolution. Am. J. Phys. Anthropol.1998(Suppl. 27), 137–176.
Larick, R., Ciochon, R. L., Zaim, Y., Suminto, S., Rizal, Y.,Aziz, F., Reagan, M. & Heizler, M. 2001 Early Pleistocene40 Ar/39 Ar ages for Bapang Formation hominins, CentralJawa, Indonesia. Proc. Natl Acad. Sci. USA 98, 4866–4871.
Lynnerup, N. 1998 The Greenland Norse. Meddelser omGrønland, Man and Society, vol. 24. Copenhagen: The Com-mission for Scientific Research in Greenland.
Phil. Trans. R. Soc. Lond. B (2004)
Maca-Meyer, N., Gonzalez, A. M., Larruga, J. M., Flores,C. & Cabrera, V. M. 2001 Major genomic mitochondrial lin-eages delineate early human expansions. BMC Genet. 2, 13.
Macaulay, V., Richards, M. B., Forster, P., Bendall, K. E.,Watson, E., Sykes, B. C. & Bandelt, H.-J. 1997 mtDNAmutation rates: no need to panic. Am. J. Hum. Genet. 61,983–986.
Macaulay, V., Richards, M., Hickey, E., Vega, E., Cruciani,F., Guida, V., Scozzari, R., Bonne-Tamir, B., Sykes, B. &Torroni, A. 1999 The emerging tree of west EurasianmtDNAs: a synthesis of control-region sequences andRFLPs. Am. J. Hum. Genet. 64, 232–249.
Merriwether, D. A., Rothhammer, F. & Ferrell, R. E. 1994Genetic variation in the New World: ancient teeth, bone,and tissue as sources of DNA. Experientia 50, 592–601.
Mishmar, D. (and 12 others) 2003 Natural selection shapedregional mtDNA variation in humans. Proc. Natl Acad. Sci.USA 100, 171–176.
Morral, N. (and 29 others) 1994 The origin of the major cysticfibrosis mutation (delta F508) in European populations.Nature Genet. 7, 169–175.
O’Brien, S. R., Mayewski, P. A., Meeker, L. D., Meese, D. A.,Twickler, M. S. & Whitlow, S. I. 1995 Complexity of Holo-cene climate as reconstructed from a Greenland ice core.Science 270, 1962–1964.
Oppenheimer, S. 2003 Out of Eden: the peopling of the world.London: Constable.
Parsons, T. (and 10 others) 1997 A high observed substitutionrate in the human mitochondrial DNA control region.Nature Genet. 15, 363–368.
Renfrew, C. 1987 Archaeology and language. London: Jona-than Cape.
Richards, M. & Macaulay, V. 2000 Genetic data and thecolonization of Europe: genealogies and founders. In Archae-ogenetics: DNA and the population prehistory of Europe (ed. C.Renfrew & K. Boyle), pp. 139–151. Cambridge, UK:McDonald Institute for Archaeological Research.
Richards, M. B., Corte-Real, H., Forster, P., Macaulay, V.,Wilkinson-Herbots, H., Demaine, A., Papiha, S., Hedges,R., Bandelt, H.-J. & Sykes, B. C. 1996 Palaeolithic and neo-lithic lineages in the European mitochondrial gene pool. Am.J. Hum. Genet. 59, 185–203.
Richards, M., Oppenheimer, S. & Sykes, B. 1998 mtDNA sug-gests Polynesian origins in eastern Indonesia. Am. J. Hum.Genet. 63, 1234–1236.
Richards, M. (and 36 others) 2000 Tracing European founderlineages in the near Eastern mitochondrial gene pool. Am.J. Hum. Genet. 67, 1251–1276.
Rohl, A., Brinkmann, B., Forster, L. & Forster, P. 2001 Anannotated mtDNA database. Int. J. Legal Med. 115, 29–39.
Saillard, J., Forster, P., Lynnerup, N., Bandelt, H.-J. & Nørby,S. 2000 mtDNA variation among Greenland Eskimos: theedge of the Beringian expansion. Am. J. Hum. Genet. 67,718–726.
Salas, A., Richards, M., De la Fe, T., Lareu, M. V., Sobrino,B., Sanchez-Diz, P., Macaulay, V. & Carracedo, A. 2002The making of the African mtDNA landscape. Am. J. Hum.Genet. 71, 1082–1111.
Sella, G. F., Dixon, T.H. & Mao, A. 2002 Revel: a model forRecent plate velocities from space Geodesy. J. Geophys. Res.107, N. B4, 10.1029/2000JB000033.
Shields, G. F., Schmiechen, A. M., Frazier, B. L., Redd, A.,Voevoda, M. I., Reed, J. K. & Ward, R. H. 1993 mtDNAsequences suggest a recent evolutionary divergence forBeringian and northern North American populations. Am.J. Hum. Genet. 53, 549–562.
Siddall, M., Rohling, E. J., Almogi-Labin, A., Hemleben, C.,Meischner, D., Schmelzer, I. & Smeed, D. A. 2003 Sea-levelfluctuations during the last glacial cycle. Nature 423, 853–858.
264 P. Forster Ice Ages and mtDNA chronology of human dispersals
Sigurðardottir, S., Helgason, A., Gulcher, J. R., Stefansson,K. & Donnelly, P. 2000 The mutation rate in the humanmtDNA control region. Am. J. Hum. Genet. 66, 1599–1609.
Spriggs, M. & Anderson, A. 1993 Late colonization of EastPolynesia. Antiquity 67, 200–217.
Stringer, C. 2000 Coasting out of Africa. Nature 405, 24–27.Torroni, A., Sukernik, R. I., Schurr, T. G., Starikorskaya,
Y. B., Cabell, M. F., Crawford, M. H., Comuzzie, A. G. &Wallace, D. C. 1993a mtDNA variation of aboriginal Siberi-ans reveals distinct genetic affinities with Native Americans.Am. J. Hum. Genet. 53, 591–608.
Torroni, A., Schurr, T. G., Cabell, M. F., Brown, M. D.,Neel, J. V., Larsen, M., Smith, D. G., Vullo, C. M. & Wal-lace, D. C. 1993b Asian affinities and continental radiationof the four founding Native American mtDNAs. Am. J.Hum. Genet. 53, 563–590.
Torroni, A., Lott, M. T., Cabell, M. F., Chen, Y.-S., Lav-ergne, L. & Wallace, D. C. 1994 mtDNA and the origin ofCaucasians: identification of ancient Caucasian-specifichaplogroups, one of which is prone to a recurrent somaticduplication in the D-loop region. Am. J. Hum. Genet. 55,760–776.
Torroni, A. (and 10 others) 1998 mtDNA analysis reveals amajor late Palaeolithic population expansion from south-western to northeastern Europe. Am. J. Hum. Genet. 62,1137–1152.
Torroni, A. (and 32 others) 2001 A signal, from humanmtDNA, of postglacial recolonization in Europe. Am. J.Hum. Genet. 69, 844–852.
Vekua, A. (and 11 others) 2002 A new skull of early Homofrom Dmanisi, Georgia. Science 297, 85–89.
Watson, E., Forster, P., Richards, M. & Bandelt, H.-J. 1997Mitochondrial footprints of human expansions in Africa.Am. J. Hum. Genet. 61, 691–704.
White, T. D., Asfaw, B., DeGusta, D., Gilbert, H., Richards,G. D., Suwa, G. & Clark Howell, F. 2003 Pleistocene Homosapiens from Middle Awash, Ethiopia. Nature 423, 742–747.
Zazula, G. D., Froese, D. G., Schweger, C. E., Mathewes,R. W., Beaudoin, A. B., Telka, A. M., Harington, C. R. &Westgate, J. A. 2003 Ice-Age steppe vegetation in east Berin-gia. Nature 423, 603.
DiscussionS. J. Oppenheimer (Green College, University of Oxford,
Oxford, UK). You are suggesting that the permafrost line
Phil. Trans. R. Soc. Lond. B (2004)
defines human absence during the LGM but there isevidence for human persistence in the steppe–tundra ofSiberia.
P. Forster. In fact I used the (unfortunately ambiguous)term ‘depopulation’, by which I mean reduction in popu-lation rather than extinction. Indeed, the survival of mito-chondrial A and D types in the Beringian glacial refugedemonstrates that survival was possible north of the per-mafrost line, in agreement with the archaeological record.
G. Rowe (School of Biological Sciences, University of Sus-sex, Sussex , UK). You show mitochondrial haplogroup Xentering North America from the west. There have beensome suggestions that it entered from the east, via Europe.Would you comment on this, please?
P. Forster. This recent idea is motivated by the presenceof X in Europe and America, and its rarity or absence inSiberia. By contrast, we suggested in 1996 that the Amer-ican mtDNA X entered Alaska via northeastern Siberia asdid all the other American mtDNA types. In this hypoth-esis, X would have undergone the same fate as mtDNAtype B in northern Asian and American latitudes duringthe LGM, namely extinction. Given that the very frequentmtDNA type B went extinct in the north, it is not surpris-ing that a minor type such as X (generally less than 5% inAmericans and Europeans) is likewise absent in northernSiberia and northern America today.
C. Tyler-Smith (Department of Biochemistry, Universityof Oxford, Oxford, UK). Archaeological evidence suggeststhat the people who reached Australia ca. 50 ka were usingMiddle Palaeolithic technology, whereas those whoreached western Asia slightly later were using UpperPalaeolithic technology. Can you reconcile this with a sin-gle migration out of Africa?
P. Forster. Australians have the same two founder typesM and N as do all other non-Africans. It seems to meunlikely that a hypothetical second migration out of thediverse African mtDNA pool would yield the same two Mand N founder types, and no other types.
GLOSSARY
LGM: last glacial maximum