ice supersaturation and the potential for contrail
TRANSCRIPT
Ice supersaturation and the potential for contrail formation in a changing climate
Article
Published Version
Creative Commons: Attribution 3.0 (CC-BY)
Open Access
Irvine, E. A. and Shine, K. P. (2015) Ice supersaturation and the potential for contrail formation in a changing climate. Earth System Dynamics, 6 (2). pp. 555-568. ISSN 2190-4987 doi: https://doi.org/10.5194/esd-6-555-2015 Available at http://centaur.reading.ac.uk/42127/
It is advisable to refer to the publisher’s version if you intend to cite from the work. See Guidance on citing .
To link to this article DOI: http://dx.doi.org/10.5194/esd-6-555-2015
Publisher: European Geosciences Union
All outputs in CentAUR are protected by Intellectual Property Rights law, including copyright law. Copyright and IPR is retained by the creators or other copyright holders. Terms and conditions for use of this material are defined in the End User Agreement .
www.reading.ac.uk/centaur

CentAUR
Central Archive at the University of Reading
Reading’s research outputs online

Earth Syst. Dynam., 6, 555–568, 2015
www.earth-syst-dynam.net/6/555/2015/
doi:10.5194/esd-6-555-2015
© Author(s) 2015. CC Attribution 3.0 License.
Ice supersaturation and the potential for contrail
formation in a changing climate
E. A. Irvine and K. P. Shine
Department of Meteorology, University of Reading, Reading, UK
Correspondence to: E. A. Irvine ([email protected])
Received: 22 January 2015 – Published in Earth Syst. Dynam. Discuss.: 18 February 2015
Revised: 3 July 2015 – Accepted: 8 August 2015 – Published: 2 September 2015
Abstract. Ice supersaturation (ISS) in the upper troposphere and lower stratosphere is important for the for-
mation of cirrus clouds and long-lived contrails. Cold ISS (CISS) regions (taken here to be ice-supersaturated
regions with temperature below 233 K) are most relevant for contrail formation. We analyse projected changes to
the 250 hPa distribution and frequency of CISS regions over the 21st century using data from the Representative
Concentration Pathway 8.5 simulations for a selection of Coupled Model Intercomparison Project Phase 5 mod-
els. The models show a global-mean, annual-mean decrease in CISS frequency by about one-third, from 11 to
7 % by the end of the 21st century, relative to the present-day period 1979–2005. Changes are analysed in further
detail for three subregions where air traffic is already high and increasing (Northern Hemisphere mid-latitudes)
or expected to increase (tropics and Northern Hemisphere polar regions). The largest change is seen in the trop-
ics, where a reduction of around 9 percentage points in CISS frequency by the end of the century is driven by
the strong warming of the upper troposphere. In the Northern Hemisphere mid-latitudes the multi-model-mean
change is an increase in CISS frequency of 1 percentage point; however the sign of the change is dependent not
only on the model but also on latitude and season. In the Northern Hemisphere polar regions there is an increase
in CISS frequency of 5 percentage points in the annual mean. These results suggest that, over the 21st century,
climate change may have large impacts on the potential for contrail formation; actual changes to contrail cover
will also depend on changes to the volume of air traffic, aircraft technology and flight routing.
1 Introduction
Regions of ice supersaturation (ISS) are a relatively com-
mon feature of the upper troposphere. Aircraft flying through
ISS regions may form persistent contrails, which have been
shown to contribute to anthropogenic climate change. Be-
cause they make a potentially large contribution to the cli-
mate impact of aviation (e.g. Lee et al., 2009), many stud-
ies have considered possible strategies to reduce contrail for-
mation in the future, for example by developments to en-
gine technology (Gierens et al., 2008; Haglind, 2008) or by
changing aircraft altitude (Williams et al., 2002; Fichter et
al., 2005; Mannstein et al., 2005; Rädel and Shine, 2008;
Schumann et al., 2011; Deuber et al., 2013) or route (Srid-
har et al., 2013; Irvine et al., 2014b; Soler et al., 2014; Zou
et al., 2015) to avoid flying through ISS regions. In addition,
it is likely that contrail formation will become more frequent
due to increased air traffic, and the introduction of newer,
more efficient engines, which consume less fuel but allow
contrail formation to occur at higher temperatures and thus
over a wider range of cruise altitudes than at present (Schu-
mann, 2000; Schumann et al., 2000; Marquart et al., 2003).
Using projected future air traffic scenarios, including an in-
crease in engine propulsion efficiency, but with a present-day
climate, Gierens et al. (1999) projected that global-mean con-
trail cover would increase by a factor of between 3 and 9 by
2050 (depending on the scenario used) relative to 1992.
One additional factor in determining future contrail cover
which has received much less attention is how climate
change itself may alter the likelihood of contrail formation
by causing changes to the frequency and distribution of ISS
regions. Minnis et al. (2004) analysed upper-tropospheric rel-
ative humidity trends, derived from reanalyses, for the period
1979–1995, over Northern Hemisphere mid-latitude regions,
Published by Copernicus Publications on behalf of the European Geosciences Union.

556 E. A. Irvine and K. P. Shine: Ice supersaturation
in the context of changes in contrail and cirrus occurrence.
They found relative humidity decreases of up to 6 % per
decade, although they noted that data quality issues meant
that these trends should be “viewed with some scepticism”.
Marquart et al. (2003) found that, in simulations for the year
2050, climate change had a smaller impact on contrail cover
than increasing air traffic. There was some regionality to the
calculated changes in contrail cover; in the tropics the impact
of climate change was important, but in the Northern Hemi-
sphere mid-latitudes, a region where present-day air traffic
is already high, an increase in air traffic was more important
than any climate changes. Marquart et al. (2003) combined
time-slice simulations from a single climate model with air
traffic projections, both for 2050; together these increased
the global-mean contrail cover by a factor of 3.7, relative to
1992. The present study makes use of the latest climate pro-
jections submitted to IPCC (2013), which extend out to 2100,
allowing not only the assessment of changes to ISS over a
longer time period but also an examination of the time evolu-
tion of these changes. Further, by comparing the results from
multiple climate models, we can assess the robustness of our
conclusions. Unlike the Marquart et al. (2003) and Gierens
et al. (1999) studies, we do not attempt to calculate contrail
cover using air traffic projections; the focus of this paper is
the impact of climate change on ISS regions, independent of
changes to air traffic, aircraft technology or routing. How-
ever, the close link between ISS and potential contrail cover
has been clearly demonstrated by Burkhardt et al. (2008).
Regions of ISS are generally shallow and located close to
the tropopause, which makes their global distribution highly
variable with altitude. They are typically associated with as-
cending air streams (Gierens and Brinkop, 2012; Irvine et
al., 2014a), such as those found in frontal systems and jet
streams in the mid-latitudes or deep convection in the trop-
ics (Kästner et al., 1999; Spichtinger et al., 2005; Gettelman
et al., 2006; Luo et al., 2007; Irvine et al., 2012), as well
as around high-pressure ridges (Immler et al., 2008; Gierens
and Brinkop, 2012; Irvine et al., 2014a). The present-day
global distribution of ISS regions, as determined by satel-
lite and aircraft observations, tends to coincide with regions
where these features occur. For example, in situ aircraft and
satellite measurements around the highest aircraft cruise al-
titudes (∼ 200 hPa) show the highest frequencies of ISS in
the tropics, in regions with deep convection (Spichtinger et
al., 2003b; Gettelman et al., 2006; Luo et al., 2007; Lamquin
et al., 2012). High frequencies are also found to coincide with
the mid-latitude storm tracks, where the frequency is highly
variable with altitude (e.g. Irvine et al., 2012; Lamquin et
al., 2012), and in high-latitude regions, particularly over the
Southern Hemisphere polar regions (Gettelman et al., 2006;
Lamquin et al., 2012).
The present-day distribution of ISS could be affected by
climate change in two ways: firstly, via changes to humidity,
and secondly via changes to temperature which may make a
region too warm to support contrail formation. The consen-
sus is that, under climate change, in the upper troposphere
and lowermost stratosphere there will be a decrease in rela-
tive humidity in the tropics and increases towards the poles,
with a transition at mid-latitudes (e.g. Lorenz and DeWeaver,
2007; Wright et al., 2010; Sherwood et al., 2010). This sug-
gests that the pattern of the response of ISS regions to cli-
mate change will be regional rather than globally uniform.
Wright et al. (2010) and Sherwood et al. (2010) discuss in
detail the reasons for the changing distributions of relative
humidity. Briefly, the tropical decrease is driven by the ver-
tical and poleward expansion of Hadley circulation and the
changes in temperature in regions where air parcels reaching
the upper troposphere are last saturated. In the extratropics,
changes in relative humidity are largely driven by tempera-
ture changes. In the context of contrails, a further mechanism
is at play, because contrail formation is dependent on the air
being below a given threshold temperature (Schumann, 1996
and see Sect. 2.2).
Climate models predict a general warming of the upper
troposphere with climate change (e.g. Thorne et al., 2011),
which is projected to be strongest in the tropics. Due to this
warming, and since present-day temperatures at typical air-
craft cruise altitudes in the tropics are often close to the
threshold temperature for contrail formation, it is in the trop-
ics that we might expect to see the largest impact of climate
change on contrail cover, as was indeed found by Marquart
et al. (2003). Outside of the tropics, the uppermost flight lev-
els used by commercial aircraft are often in the lowermost
stratosphere, particularly over the polar regions. Here climate
models predict a general cooling, which is the main driver
of the increased relative humidity, although the impact on
threshold temperatures in the polar regions is likely limited
since temperatures are generally well below those required
for contrail formation.
This study analyses changes in ISS over the 21st century in
a selection of models from the Coupled Model Intercompar-
ison Project Phase 5 (CMIP5) multi-model ensemble (Tay-
lor et al., 2012). These data are described in Sect. 2.1. Data
from simulations of the 21st century with a pathway of high
greenhouse gas emissions (named RCP8.5 in the CMIP5 ex-
periments) are compared to simulations of the present-day
climate. ERA-Interim reanalysis data are used to evaluate the
distribution of ISS in the present-day climate simulations of
the CMIP5 models (Sect. 3.1). Changes to the global fre-
quency and distribution of ISS are analysed for an end-of-
century time period. The end-of-century change, as well as
the time evolution of this change and its seasonal aspects,
is analysed further for three regions of interest: the tropics,
Northern Hemisphere (NH) mid-latitudes and NH polar re-
gions (Sect. 3.2). Finally, since the daily-mean data used in
this study are only available on a single pressure level rel-
evant to contrail formation, monthly-mean data are used to
understand whether the conclusions reached from the single-
level data might be applicable to the range of aircraft flight
altitudes (Sect. 3.3). Conclusions are presented in Sect. 4.
Earth Syst. Dynam., 6, 555–568, 2015 www.earth-syst-dynam.net/6/555/2015/

E. A. Irvine and K. P. Shine: Ice supersaturation 557
2 Method
2.1 Data
Climate model data from the CMIP5 multi-model archive
were used, from two simulations: historical and Represen-
tative Concentration Pathway (RCP) scenario 8.5 (Taylor et
al., 2012). The historical simulation aims to reproduce the
present-day climate by forcing the models with observed or
simulated greenhouse gas and aerosol concentrations; for this
study we take data from the historical simulation for the pe-
riod 1979–2005. The RCP8.5 simulation uses economic sce-
narios to estimate future emissions of greenhouse gases and
the resulting impacts on climate, for the period 2006–2099.
RCP8.5 describes a world where there is little mitigation
of greenhouse gas emissions, such that by 2100, emissions
reach 3 times their 2000 values (Riahi et al., 2011). This
leads to a global-mean radiative forcing of 8.5 Wm−2 and
a surface temperature increase of about 4 ◦C by 2100 (IPCC,
2013). RCP8.5 has the highest emissions and largest warm-
ing of the scenarios considered by IPCC (2013). This im-
plies that we are analysing the maximum likely changes to
ISS from climate change; more moderate emissions scenar-
ios cause less warming, particularly in the second half of the
21st century, and therefore an evaluation of these simulations
would likely show smaller changes than in the RCP8.5 sim-
ulations.
For the purposes of this study, a selection of five CMIP5
models were chosen to analyse. Data were used from EC-
EARTH (Hazeleger et al., 2010, 2012), GFDL-ESM2G
(Dunne et al., 2012), HadGEM2-CC (Martin et al., 2011;
Collins et al., 2011), MIROC5 (Watanabe et al., 2010) and
MPI-ESM-MR (Stevens et al., 2013). These models have
been shown to have a good representation of key circula-
tion features (Lee and Black, 2013; Davini and Cagnazzo,
2013). In addition, EC-EARTH was chosen because it explic-
itly represents ISS in its cloud scheme (it is based on a similar
version of the European Centre for Medium-Range Weather
Forecasts (ECMWF) forecast model to ERA-Interim; a de-
scription of the model version is given in Hazeleger et
al., 2012). The resolution of the CMIP5 models used ranges
from 1.2 to 2.0◦ (Table 1). The greater part of this study uses
daily-mean global data, for which data are available only on a
limited number of pressure levels (in the UTLS regions these
are 500, 250, 100 and 50 hPa, with each CMIP5 modelling
group interpolating to these pressures from their own model’s
grid). Data are used on the 250 hPa level, as this corresponds
most closely to typical aircraft cruise altitudes and so is most
appropriate to study changes in ISS that are relevant to air-
craft contrail formation (see e.g. Wilkerson et al., 2010, who
show peak emissions at about 10.5 km, with the vast major-
ity of flights cruising at between 10 and 12 km; about 200–
260 hPa). We note that even the use of daily data will fail
to resolve ice-supersaturated regions with shorter lifetimes.
To investigate whether the changes seen at the 250 hPa level
might also be observed at other cruise altitudes, monthly-
mean relative humidity data archived for each model were
used; these data are available on seven pressure levels be-
tween 500 and 100 hPa (500, 400, 300, 250, 200, 150 and
100 hPa).
For an evaluation of regions of high humidity in the his-
torical simulations of the CMIP5 models, reanalysis data
from the ECMWF Interim reanalysis (ERA-Interim; Dee et
al., 2011) were used. Daily-mean data at a pressure level
of 250 hPa, as well as monthly-mean data, were used for
the period 1979–2005. The data are available at a horizon-
tal resolution of 0.7◦. ERA-Interim is particularly suited to
studies of ISS since ISS is explicit within the cloud scheme
(Tompkins et al., 2007). This has led to an improved hu-
midity analysis at upper levels, although the analyses show
a general dry bias when compared to Atmospheric Infrared
Sounder satellite measurements (Lamquin et al., 2009); the
ISS frequency in the model climate is lower than observed in
the tropics, particularly over the maritime continent, Africa
and South America (Tompkins et al., 2007). Forecasts of
ice-supersaturated regions produced using the same model
version as used to produce the reanalyses also validate well
against radiosonde observations and visual observations of
contrails (Rädel and Shine, 2010).
In addition to analysing changes to the global frequency
and distribution of ISS, regional changes are also analysed.
Three subregions of interest are defined: the tropics (30◦ S–
30◦ N), NH mid-latitudes (40–60◦ N) and NH polar regions
(70–90◦ N). The choice of these three regions is motivated
by the present-day distribution of air traffic and projected
changes during the 21st century. Of these three regions, the
NH mid-latitude region currently has the highest proportion
of global air traffic (e.g. Wilkerson et al., 2010). Air traffic
growth is projected in all three regions, particularly in the
tropics; for example, Owen et al. (2010) predict 5 times as
much air traffic in some regions in 2050 compared to 2000
for the A2 scenario (their Fig. 2) used in the 2007 IPCC as-
sessment (Riahi et al., 2007), on which the RCP8.5 scenario
is based.
2.2 Definition of ice supersaturation
Regions of ISS are defined using both relative humidity with
respect to ice (RHi) and a temperature threshold. Typically,
for persistent contrail formation, the RHi should be greater
than 100 %, and the temperature should be below a thresh-
old value of 233 K. This temperature threshold is necessary
in order to avoid considering regions where mixed-phase or
supercooled clouds could form, and is additionally consis-
tent with the threshold temperature for contrail formation at
cruise altitudes, defined by the Schmidt–Appleman criterion
(e.g. Schumann, 1996); we note that in reality the threshold
temperature is somewhat dependent on altitude, humidity,
fuel type and engine efficiency (Schumann, 1996). To make
it clear that the temperature threshold has been applied, we
www.earth-syst-dynam.net/6/555/2015/ Earth Syst. Dynam., 6, 555–568, 2015
558 E. A. Irvine and K. P. Shine: Ice supersaturation
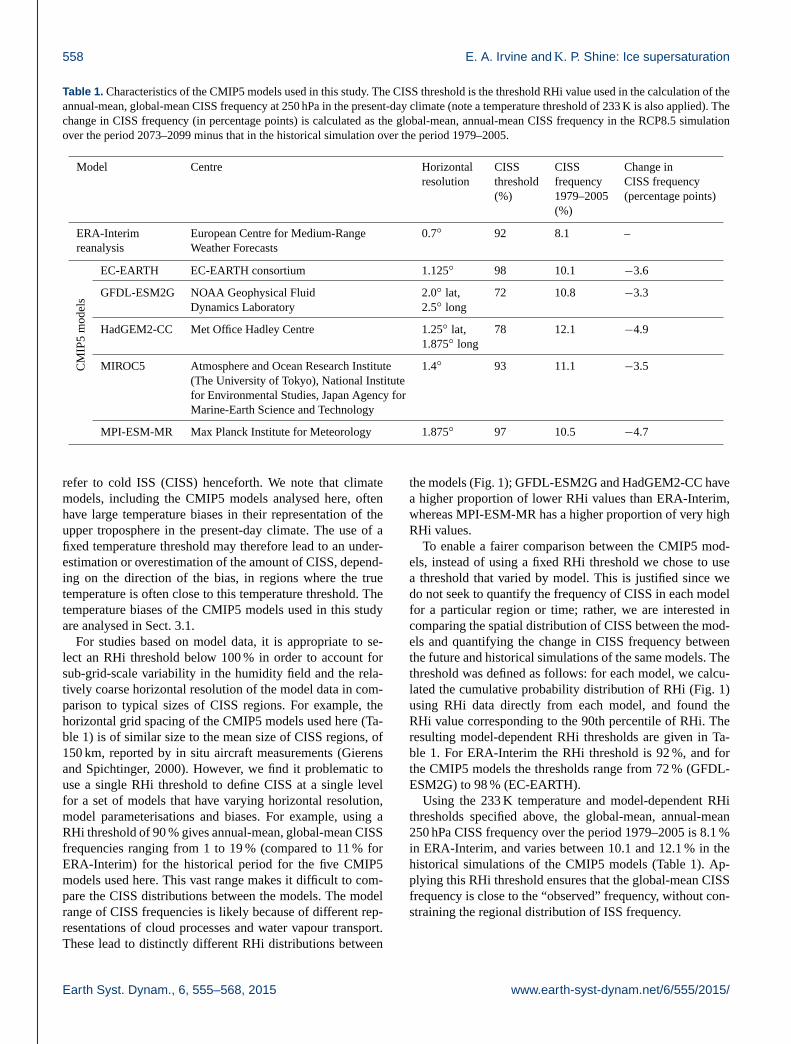
Table 1. Characteristics of the CMIP5 models used in this study. The CISS threshold is the threshold RHi value used in the calculation of the
annual-mean, global-mean CISS frequency at 250 hPa in the present-day climate (note a temperature threshold of 233 K is also applied). The
change in CISS frequency (in percentage points) is calculated as the global-mean, annual-mean CISS frequency in the RCP8.5 simulation
over the period 2073–2099 minus that in the historical simulation over the period 1979–2005.
Model Centre Horizontal CISS CISS Change in
resolution threshold frequency CISS frequency
(%) 1979–2005 (percentage points)
(%)
ERA-Interim European Centre for Medium-Range 0.7◦ 92 8.1 –
reanalysis Weather Forecasts
CM
IP5
mo
del
s
EC-EARTH EC-EARTH consortium 1.125◦ 98 10.1 −3.6
GFDL-ESM2G NOAA Geophysical Fluid 2.0◦ lat, 72 10.8 −3.3
Dynamics Laboratory 2.5◦ long
HadGEM2-CC Met Office Hadley Centre 1.25◦ lat, 78 12.1 −4.9
1.875◦ long
MIROC5 Atmosphere and Ocean Research Institute 1.4◦ 93 11.1 −3.5
(The University of Tokyo), National Institute
for Environmental Studies, Japan Agency for
Marine-Earth Science and Technology
MPI-ESM-MR Max Planck Institute for Meteorology 1.875◦ 97 10.5 −4.7
refer to cold ISS (CISS) henceforth. We note that climate
models, including the CMIP5 models analysed here, often
have large temperature biases in their representation of the
upper troposphere in the present-day climate. The use of a
fixed temperature threshold may therefore lead to an under-
estimation or overestimation of the amount of CISS, depend-
ing on the direction of the bias, in regions where the true
temperature is often close to this temperature threshold. The
temperature biases of the CMIP5 models used in this study
are analysed in Sect. 3.1.
For studies based on model data, it is appropriate to se-
lect an RHi threshold below 100 % in order to account for
sub-grid-scale variability in the humidity field and the rela-
tively coarse horizontal resolution of the model data in com-
parison to typical sizes of CISS regions. For example, the
horizontal grid spacing of the CMIP5 models used here (Ta-
ble 1) is of similar size to the mean size of CISS regions, of
150 km, reported by in situ aircraft measurements (Gierens
and Spichtinger, 2000). However, we find it problematic to
use a single RHi threshold to define CISS at a single level
for a set of models that have varying horizontal resolution,
model parameterisations and biases. For example, using a
RHi threshold of 90 % gives annual-mean, global-mean CISS
frequencies ranging from 1 to 19 % (compared to 11 % for
ERA-Interim) for the historical period for the five CMIP5
models used here. This vast range makes it difficult to com-
pare the CISS distributions between the models. The model
range of CISS frequencies is likely because of different rep-
resentations of cloud processes and water vapour transport.
These lead to distinctly different RHi distributions between
the models (Fig. 1); GFDL-ESM2G and HadGEM2-CC have
a higher proportion of lower RHi values than ERA-Interim,
whereas MPI-ESM-MR has a higher proportion of very high
RHi values.
To enable a fairer comparison between the CMIP5 mod-
els, instead of using a fixed RHi threshold we chose to use
a threshold that varied by model. This is justified since we
do not seek to quantify the frequency of CISS in each model
for a particular region or time; rather, we are interested in
comparing the spatial distribution of CISS between the mod-
els and quantifying the change in CISS frequency between
the future and historical simulations of the same models. The
threshold was defined as follows: for each model, we calcu-
lated the cumulative probability distribution of RHi (Fig. 1)
using RHi data directly from each model, and found the
RHi value corresponding to the 90th percentile of RHi. The
resulting model-dependent RHi thresholds are given in Ta-
ble 1. For ERA-Interim the RHi threshold is 92 %, and for
the CMIP5 models the thresholds range from 72 % (GFDL-
ESM2G) to 98 % (EC-EARTH).
Using the 233 K temperature and model-dependent RHi
thresholds specified above, the global-mean, annual-mean
250 hPa CISS frequency over the period 1979–2005 is 8.1 %
in ERA-Interim, and varies between 10.1 and 12.1 % in the
historical simulations of the CMIP5 models (Table 1). Ap-
plying this RHi threshold ensures that the global-mean CISS
frequency is close to the “observed” frequency, without con-
straining the regional distribution of ISS frequency.
Earth Syst. Dynam., 6, 555–568, 2015 www.earth-syst-dynam.net/6/555/2015/

E. A. Irvine and K. P. Shine: Ice supersaturation 559
Figure 1. Cumulative frequency distribution of 250 hPa relative
humidity with respect to ice for ERA-Interim (solid line) and the
CMIP5 models (symbols). Global daily data over the period 1979–
2005 are used. The dashed line marks the 90th percentile of the RHi
distribution, used to define the model-dependent RHi threshold for
ice-supersaturated regions.
3 Results
3.1 Cold ice supersaturation in the present-day climate
The annual-mean distribution of CISS at 250 hPa in the
present-day climate for the period 1979–2005 is shown for
ERA-Interim in Fig. 2a. At this pressure level, there are high
frequencies (exceeding 20 %) of cold ice supersaturation
over the tropics, although, as previously noted, ERA-Interim
is known to underestimate CISS in this region (Tompkins et
al., 2007). The distribution of high ISS frequencies in the
tropics is not uniform and is linked to regions of deep con-
vection; high frequencies are observed in particular over the
northern Indian Ocean and maritime continent and also parts
of central Africa, in agreement with in situ aircraft measure-
ments (Luo et al., 2007). Some of the highest frequencies of
CISS (exceeding 20 %) in ERA-Interim are in the Southern
Hemisphere polar region, south of 70◦ S. These are also ob-
served by satellite measurements (e.g. Gettelman et al., 2006;
Lamquin et al., 2012), but the future evolution of these is
of little interest to this study because of the lack of air traf-
fic in this region. There are also elevated frequencies in the
mid-latitude regions and over Russia. In particular, regions
of high frequencies of CISS are found in the North Atlantic
and north-west Pacific regions; their location and south-west
to north-east tilt suggest they are related to the storm tracks
in these regions (e.g. Irvine et al., 2012).
The distribution of CISS in the historical simulations of
the CMIP5 models for the same time period is shown in
Fig. 2b–f. These can be qualitatively compared to the dis-
tribution in ERA-Interim (Fig. 2a) in order to assess the per-
formance of each model in simulating CISS in the present-
day climate. (Values, as labelled contours, are also shown
Figure 2. Annual-mean CISS frequency at 250 hPa over the
present-day period 1979–2005 for (a) ERA-Interim reanalysis
and the CMIP5 models (b) EC-EARTH, (c) GFDL-ESM2G,
(d) HadGEM2-CC, (e) MIROC5 and (f) MPI-ESM-MR. The CISS
fields for the five CMIP5 models are repeated in Fig. 4 as labelled
contours.
as the underlay in Fig. 4.) There are differences in the dis-
tribution of CISS between the CMIP5 models, even though
the way the RHi threshold for CISS has been defined means
that the global-mean, annual-mean CISS frequency in each
model is similar. All models qualitatively reproduce the
main features of the ERA-Interim CISS distribution although
with varying frequencies; all models have high frequencies
of CISS in the tropics and in mid-latitude storm tracks.
EC-EARTH (Fig. 2b), GFDL-ESM2G (Fig. 2c) and MPI-
ESM-MR (Fig. 2f) also have high CISS frequencies in the
Southern Hemisphere polar region (exceeding 20 % in some
areas), in similar locations, and with similar frequencies,
to ERA-Interim; EC-EARTH and MPI-ESM-MR also have
high ISS frequencies over Russia (exceeding 14 %), in rea-
sonable agreement with ERA-Interim, which are missing
from GFDL-ESM2G at this level (where there are large ar-
eas at less than 2 %). HadGEM2-CC (Fig. 2d) has somewhat
lower frequencies of CISS over Antarctica (less than 8 % in
some regions) and Russia at this level (with maxima no more
than 8 %) than ERA-Interim. Of the five CMIP5 models anal-
ysed, the MIROC5 model distribution of CISS (Fig. 2e) has
www.earth-syst-dynam.net/6/555/2015/ Earth Syst. Dynam., 6, 555–568, 2015
560 E. A. Irvine and K. P. Shine: Ice supersaturation
the largest differences from ERA-Interim outside the trop-
ics: the CISS frequency in the mid-latitudes is the highest of
any of the models (exceeding 26 % in the Pacific), while the
CISS frequencies in the southern polar region are less than
2 % over large areas.
There are several reasons why we might expect to find dif-
ferences between the distribution of CISS in ERA-Interim
and the CMIP5 models. The use of a single pressure
level to analyse CISS is one factor, since regions of CISS
are typically shallow and located close to the tropopause
(Spichtinger et al., 2003a; Rädel and Shine, 2007). Satellite-
derived climatologies of ISS frequencies show significant
differences in ISS frequency and distribution at different lev-
els in the upper troposphere (e.g. Spichtinger et al., 2003b;
Lamquin et al., 2012). Hence any bias in tropopause height
in the models, particularly in the mid-latitudes, where the
250 hPa level is often close to the tropopause, would bias the
resulting CISS frequencies. Since the CMIP5 data archive re-
tains model data on only a limited number of pressure levels
in the upper troposphere, we do not attempt to compute a bias
in tropopause height for each model.
An additional reason for the differences between the mod-
els in Fig. 2 is that the CMIP5 models exhibit substantial
temperature biases at the 250 hPa level when compared to
ERA-Interim, although this is ameliorated to some extent
(at least at the global-mean level) by the choice of a model-
dependent CISS threshold (Table 1 and Fig. 1). Figure 3a, c
and e show probability density functions (PDFs) of temper-
ature for ERA-Interim and each CMIP5 model for the three
subregions of interest. The size of the temperature bias varies
by model and region, but is typically a few kelvin in magni-
tude, with almost all models and regions biased cold. Since
a region is only considered ice-supersaturated if the temper-
ature is below the 233 K threshold (shown as a dashed line in
Fig. 3), a cold bias could lead to an overestimation of ISS in
regions where the temperature is often close to this threshold.
Figure 3 shows that, for the NH mid-latitude (Fig. 3c) and po-
lar (Fig. 3e) regions, the temperature threshold is at the upper
limit of the temperature PDF in the present-day climate, and
so the bias will have little impact on CISS frequency. How-
ever, in the tropics, the 250 hPa temperature in ERA-Interim
is often around the 233 K threshold, but in the CMIP5 mod-
els it is almost always below the threshold in the present-day
climate (Fig. 3a), and so could impact the CISS frequency.
Additionally, since relative humidity is exponentially related
to temperature through the saturation vapour pressure, a cold
temperature bias will cause a high relative humidity bias (for
the same specific humidity). In the CMIP5 models, however,
the cold temperature bias is accompanied by a dry bias in the
specific humidity. PDFs of specific humidity (Fig. 3b, d, f)
show mean biases of the order of 10−2 gkg−1 in the tropics
and NH mid-latitude regions, and 10−3 gkg−1 in the NH po-
lar regions. In all regions, the CMIP5 models typically have
a higher proportion of points with low specific humidity than
in ERA-Interim, and fewer with high specific humidity in the
tail of the distribution.
3.2 Changes to ice supersaturation over the 21st
century
Changes to the ISS frequency and distribution over the 21st
century are now investigated, using the RCP8.5 simula-
tions of the CMIP5 models. The annual-mean, global-mean
change in 250 hPa CISS frequency by the end of the 21st cen-
tury is shown in Table 1, calculated as the average frequency
over the period 2073–2099 minus the average over 1979–
2005 (from the historical simulation). All models predict a
decrease in the annual-mean, global-mean CISS frequency
by the end of the 21st century, relative to the present day. The
multi-model-mean decrease is substantial, from a present-
day value of 11 % to an end-of-century value of 7 %. The
range of the decrease is 3.3–4.9 percentage points over the
individual models. This is a relatively narrow range, given
the differences in the spatial distribution of CISS in the mod-
els in the present-day climate.
The spatial distribution of the change in 250 hPa CISS fre-
quency due to climate change is shown in Fig. 4 for each of
the CMIP5 models, using the same time periods as above.
The present-day distribution of ISS in each model is shown
by black contours in order to see the relationship between
the present-day distribution of ISS and future changes to it.
There are several features common to all five models. Firstly,
all models predict strong decreases in the frequency of CISS
in the tropics; the regions of strongest decrease correlate well
with the regions of highest frequency of CISS in the present-
day climate. All models show an increase in CISS frequency
in both the northern and southern high latitudes, although the
size of the change varies between models. The largest dif-
ferences between the models are found in the mid-latitudes.
This is not surprising, given that the 250 hPa level is very
close to the tropopause in the mid-latitudes, as previously
discussed, and so the CISS frequency will be very sensi-
tive to small changes in tropopause height. CISS in the mid-
latitudes is often linked to the storm track regions; maxima
in CISS frequency coincide with the location and orientation
of the storm track in all major basins. In the annual mean,
all the models studied predict a small northward shift in jet
stream location over the North Atlantic (Irvine et al., 2015),
for example, but the change to ISS frequency in the models
in this region varies. For example, GFDL-ESM2G (Fig. 4b)
suggests a northward shift in the CISS frequency maxima in
both North Atlantic and Pacific storm track regions, whereas
for most other models the change appears to be a decrease in
the strength of the CISS maxima in these regions.
Figure 5 shows a time series of the multi-model-mean
change in CISS frequency, from 1979 to 2100, i.e. from the
historical period through the RCP8.5 period. The change in
frequency is calculated separately for each CMIP5 model as
the annual-mean frequency in each year minus the 1979–
Earth Syst. Dynam., 6, 555–568, 2015 www.earth-syst-dynam.net/6/555/2015/

E. A. Irvine and K. P. Shine: Ice supersaturation 561
(a) (b)
(c) (d)
(e) (f)
Figure 3. PDFs of temperature, T (left column), and specific humidity, q (right column), at 250 hPa in the present-day climate (1979–2005)
in three regions – (a, b) the tropics, (c, d) the NH mid-latitudes and (e, f) the NH polar regions – shown for ERA-Interim reanalysis (black
line) and CMIP5 models EC-EARTH (dark blue), GFDL-ESM2G (light blue), HadGEM2-CC (orange), MIROC5 (red) and MPI-ESM-MR
(dark red). The 233 K temperature threshold is marked by the dashed line on panels (a), (c) and (e).
2005 average. The individual time series are then averaged
together to provide a multi-model mean (plotted). There is
considerable inter-annual variability in the CISS frequency,
particularly on seasonal timescales, and so the multi-model-
mean time series has been smoothed with a 10-year running
mean to allow the long-term trends in the multi-model mean
to be more clearly seen. The time series are shown separately
for each region, and the mean changes in that region from
the historical period to mid-century (2030–2056) and late-
century (2073–2099) periods are given separately for each
model as well as the multi-model mean in Table 2.
For the NH polar regions, the time series shows an increase
in CISS frequency through the 21st century. By 2100, the
changes in the smoothed time series are clearly larger than
any internal variability. The rate of increase is faster over
the second half of the 21st century than the first half; the
multi-model-mean increase in annual-mean CISS frequency
is 1.7 percentage points (range 0.9 to 2.2 percentage points,
Table 2) by mid-century and 4.9 percentage points (range 2.8
to 6.2 percentage points) by the end of the century. There is a
strong seasonality to the changes; the largest changes are in
the autumn (September, October and November) and small-
est in the spring (March, April and May) (not shown). At
these latitudes, 250 hPa is certainly in the stratosphere, and
the water vapour content of the air is very small, as shown by
the small values of specific humidities in the PDFs in Fig. 3f.
Any contrails forming in this region may have small opti-
cal depths such that their impact on climate is lower than
contrails formed in other regions with higher water vapour
contents. Thus the increase in CISS frequency shown here
www.earth-syst-dynam.net/6/555/2015/ Earth Syst. Dynam., 6, 555–568, 2015

562 E. A. Irvine and K. P. Shine: Ice supersaturation
Figure 4. Change in mean CISS frequency at 250 hPa (colours) in percentage points between the RCP8.5 simulation (average over 2073–
2099) and historical simulation (average over 1979–2005) for the CMIP5 models (a) EC-EARTH, (b) GFDL-ESM2G, (c) HadGEM2-CC,
(d) MIROC5 and (e) MPI-ESM-MR. The mean CISS frequency (in %) in each model over the historical period 1979–2005 is overlaid (black
contours – starting at 2 %, with a 6 % contour interval).
may be less significant in terms of persistent-contrail climate
impact than for the other regions studied.
In the NH mid-latitude region there is little change in the
annual-mean CISS frequency over the 21st century (Fig. 5).
The multi-model-mean changes by mid-century and the end
of century are comparable, with increases of 0.7 and 0.9
percentage points respectively. Moreover, there is some dis-
agreement between the models on the sign of the change.
MIROC5 predicts small decreases in CISS frequency by
both the mid-century and end-of-century time periods. EC-
EARTH and MPI-ESM-MR predict no change by the end
of the 21st century, whereas GFDL-ESM2G and HadGEM2-
CC predict small increases. This spread in model behaviour
is likely linked to the different jet stream and tropopause
height climatologies in the models, since in this region
250 hPa is often close to the tropopause, and regions of CISS
are often associated with the position of the jet stream in
the model. There is some seasonality to the CISS changes
shown; the multi-model mean shows an increase of around 3
percentage points in winter (December, January and Febru-
ary – DJF), and a decrease of around 2 percentage points in
summer (June, July and August – JJA) by the end of the 21st
century (Fig. 5). At this altitude, the CISS frequency is higher
in summer than winter in the reanalysis data (not shown).
Earth Syst. Dynam., 6, 555–568, 2015 www.earth-syst-dynam.net/6/555/2015/
E. A. Irvine and K. P. Shine: Ice supersaturation 563
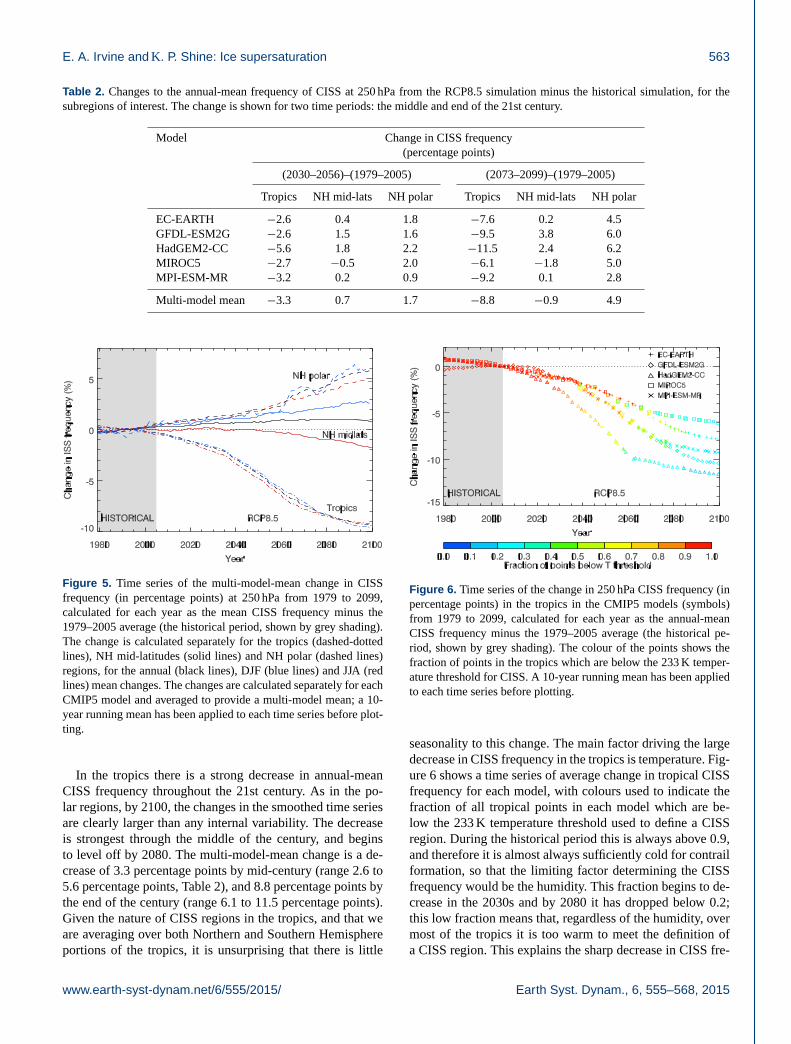
Table 2. Changes to the annual-mean frequency of CISS at 250 hPa from the RCP8.5 simulation minus the historical simulation, for the
subregions of interest. The change is shown for two time periods: the middle and end of the 21st century.
Model Change in CISS frequency
(percentage points)
(2030–2056)–(1979–2005) (2073–2099)–(1979–2005)
Tropics NH mid-lats NH polar Tropics NH mid-lats NH polar
EC-EARTH −2.6 0.4 1.8 −7.6 0.2 4.5
GFDL-ESM2G −2.6 1.5 1.6 −9.5 3.8 6.0
HadGEM2-CC −5.6 1.8 2.2 −11.5 2.4 6.2
MIROC5 −2.7 −0.5 2.0 −6.1 −1.8 5.0
MPI-ESM-MR −3.2 0.2 0.9 −9.2 0.1 2.8
Multi-model mean −3.3 0.7 1.7 −8.8 −0.9 4.9
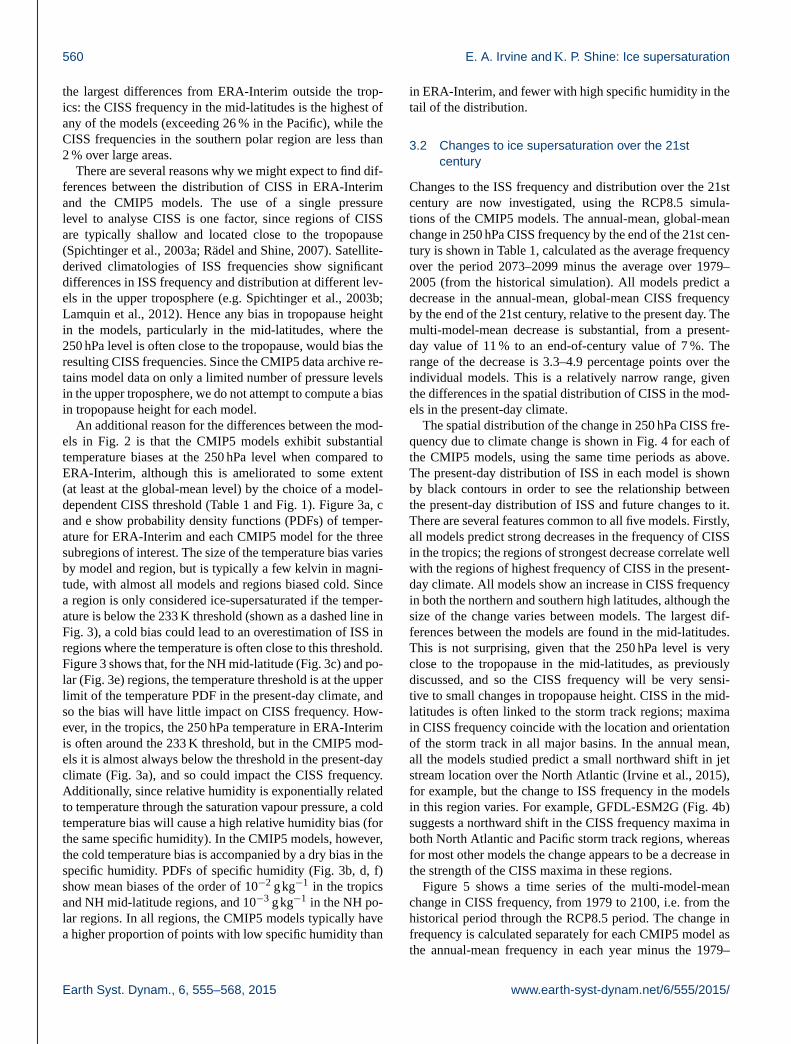
Figure 5. Time series of the multi-model-mean change in CISS
frequency (in percentage points) at 250 hPa from 1979 to 2099,
calculated for each year as the mean CISS frequency minus the
1979–2005 average (the historical period, shown by grey shading).
The change is calculated separately for the tropics (dashed-dotted
lines), NH mid-latitudes (solid lines) and NH polar (dashed lines)
regions, for the annual (black lines), DJF (blue lines) and JJA (red
lines) mean changes. The changes are calculated separately for each
CMIP5 model and averaged to provide a multi-model mean; a 10-
year running mean has been applied to each time series before plot-
ting.
In the tropics there is a strong decrease in annual-mean
CISS frequency throughout the 21st century. As in the po-
lar regions, by 2100, the changes in the smoothed time series
are clearly larger than any internal variability. The decrease
is strongest through the middle of the century, and begins
to level off by 2080. The multi-model-mean change is a de-
crease of 3.3 percentage points by mid-century (range 2.6 to
5.6 percentage points, Table 2), and 8.8 percentage points by
the end of the century (range 6.1 to 11.5 percentage points).
Given the nature of CISS regions in the tropics, and that we
are averaging over both Northern and Southern Hemisphere
portions of the tropics, it is unsurprising that there is little
Figure 6. Time series of the change in 250 hPa CISS frequency (in
percentage points) in the tropics in the CMIP5 models (symbols)
from 1979 to 2099, calculated for each year as the annual-mean
CISS frequency minus the 1979–2005 average (the historical pe-
riod, shown by grey shading). The colour of the points shows the
fraction of points in the tropics which are below the 233 K temper-
ature threshold for CISS. A 10-year running mean has been applied
to each time series before plotting.
seasonality to this change. The main factor driving the large
decrease in CISS frequency in the tropics is temperature. Fig-
ure 6 shows a time series of average change in tropical CISS
frequency for each model, with colours used to indicate the
fraction of all tropical points in each model which are be-
low the 233 K temperature threshold used to define a CISS
region. During the historical period this is always above 0.9,
and therefore it is almost always sufficiently cold for contrail
formation, so that the limiting factor determining the CISS
frequency would be the humidity. This fraction begins to de-
crease in the 2030s and by 2080 it has dropped below 0.2;
this low fraction means that, regardless of the humidity, over
most of the tropics it is too warm to meet the definition of
a CISS region. This explains the sharp decrease in CISS fre-
www.earth-syst-dynam.net/6/555/2015/ Earth Syst. Dynam., 6, 555–568, 2015

564 E. A. Irvine and K. P. Shine: Ice supersaturation
quency predicted by the models. Note that the changes during
the historical period, a decrease in CISS frequency, are very
small in comparison to the predicted changes over the 21st
century.
Since the ISS changes without application of the temper-
ature threshold are also of interest, beyond the context of
contrail formation, we briefly comment on the ISS trends.
Since the tropics dominate the global mean, and the tropi-
cal CISS results are strongly influenced by the temperature
threshold, the global-mean ISS trends are expected to be less
strong than their CISS counterparts. The global-mean val-
ues (in percentage points) corresponding to the time period
in Table 1 are −1.5 (EC-EARTH), +4.9 (GFDL-ESM2G),
−0.004 (HadGEM2-CC), −1.5 (MIROC5) and −1.2 (MPI-
ESM-MR). All models show an increase in polar regions,
albeit less strong than indicated for CISS in Table 2, while
all models show a decrease in the tropics, with the excep-
tion of GFDL-ESM2G, which shows an increase and hence
strongly influences the global-mean response in that model.
As will be discussed in Sect. 3.3, the GFDL-ESM2G model
has quite a different predicted relative humidity response in
the tropical upper troposphere compared to the other models
discussed here, with increases near 250 hPa.
3.3 Extension of results to multiple levels
Our analysis of CISS regions has so far concentrated on the
250 hPa level, for which daily-mean data are available. In or-
der to assess whether the changes in CISS frequency over the
21st century can be generalised to levels other than 250 hPa,
monthly-mean data are analysed. Given the relatively small-
scale and short-timescale nature of CISS regions, it would
not be particularly meaningful to try to define regions of
CISS using monthly-mean data. Instead, we use the annual-
mean zonal-mean differences between the RCP8.5 and his-
torical simulations of the CMIP5 models to analyse the ver-
tical structure of changes in mean RHi and temperature.
These are shown separately for each CMIP5 model as the
average over 2073–2099 minus the average over 1979–2005,
in Fig. 7. The latitudinal bounds of the tropical, NH mid-
latitudes and NH polar regions are also given, along with the
range of typical cruise altitudes of commercial aircraft (ap-
proximately 300–200 hPa).
There is generally good agreement on the vertical structure
of zonal-mean temperature and relative humidity changes
between the models. For the NH polar regions, the models
agree on an increase in mean relative humidity over the al-
titude range of interest, which suggests that the increase in
CISS frequency predicted in this region at 250 hPa will also
occur at other cruise altitudes. Mean temperature changes in
this region are irrelevant for CISS frequency, since the tem-
peratures at flight level are well below the 233 K threshold.
For the NH mid-latitude region, there is less agreement be-
tween models; the mean changes are more dependent on alti-
tude and latitude. However, all models agree on an increase in
relative humidity at altitudes above 250 hPa, with the largest
changes at the highest flight levels. It is possible that there
will be a decrease in CISS regions at low mid-latitudes and
flight levels, from a combination of the decrease in relative
humidity and increase in temperature (which will increase
the number of days where the temperature is above the 233 K
threshold). In the tropics, all models except GFDL-ESM2G
(Fig. 7b) predict a decrease in mean relative humidity; this
decrease in relative humidity has been found by many pre-
vious studies (e.g. Lorenz and DeWeaver, 2007; Wright et
al., 2010; Sherwood et al., 2010) and is considered a robust
signal of climate change. All models predict a strong warm-
ing over the altitude range of interest in the tropics; most im-
portantly, this has the effect of pushing temperatures above
the 233 K threshold and so reducing the potential for con-
trail formation, regardless of any changes in relative humid-
ity. This effect is strongest at the 250 hPa level in the mod-
els, but all levels show some reduction. The effect is smaller
at higher altitudes, where temperatures are lower and the
warming is not sufficient to result in temperatures above the
233 K threshold. At lower altitudes, where it is warmer, in the
present-day climate much of the temperature PDF is already
above the 233 K threshold, so any warming has a smaller ef-
fect on the CISS frequency.
4 Conclusions
The evolution of meteorological conditions controlling per-
sistent contrail formation during the 21st century is inves-
tigated. Specifically, the frequency and distribution of cold
ice-supersaturated regions are analysed in simulations from a
selection of models in the CMIP5 multi-model archive, using
a model-dependent RHi threshold defined using the cumula-
tive probability distribution of RHi in each model.
The present-day simulations from the CMIP5 models
qualitatively reproduce the main features of the CISS distri-
bution seen in ERA-Interim reanalysis data: high frequencies
of CISS in the tropical regions, mid-latitude storm tracks, and
most models also simulate high frequencies in the southern
high-latitude regions. At the 250 hPa level analysed, all mod-
els have cold biases of a few kelvin in the tropics. This is
particularly significant as in this region observed tempera-
tures are close to the temperature threshold for CISS; as a
result, CISS frequencies in the tropics may be overestimated
for the present-day climate by the CMIP5 models.
To analyse the impact of climate change on CISS fre-
quency, RCP8.5 simulations were used. This scenario has the
highest greenhouse gas concentrations and therefore largest
temperature changes of the different scenarios considered by
the 2013 IPCC report. Globally, the CMIP5 models predict a
decrease in CISS frequency by the end of the 21st century, of
average 4 percentage points (a decrease of about one-third of
the present-day value) over the models analysed here. How-
ever, this change is not uniform globally, and both the sign
Earth Syst. Dynam., 6, 555–568, 2015 www.earth-syst-dynam.net/6/555/2015/

E. A. Irvine and K. P. Shine: Ice supersaturation 565
(a)
0
0
0
1
1 1
1
2
2
2
3
3
3
3
4
4
4
45
5
5
6
-0.9-0.7-0.5
-0.3
-0.3 -0
.3
-0.1
-0.1
-0.1
-0.1
-0.1
90S 60S 30S 0 30N 60N 90N500
400
300
250
200
150
100
Pre
ssur
e (h
Pa)
(b)
-1
0
0
01
1
1
2
2
2
2
3
3
3
4
4
4
4
5
5
-0.9-0.7-0.5
-0.3 -0
.3
-0.1
-0.1
-0.1
-0.1
-0.1
-0.1
90S 60S 30S 0 30N 60N 90N500
400
300
250
200
150
100
Pre
ssur
e (h
Pa)
(c)
-3
-2
-1
-1
-1
-10
0
0
0
1
1
1
1
2
2
2
2
3
3
3
4
4
4
4 5
5
5
5
6
6
6
6
7
7
8
-0.9-0.7
-0.5
-0.3
-0.3
-0.3
-0.3
-0.1
-0.1 -0.1
-0.1
90S 60S 30S 0 30N 60N 90N500
400
300
250
200
150
100
Pre
ssur
e (h
Pa)
(d)
-2
-1
-1 -1
0
0 0
0
1
1 1
1
2
2
2
3
3
3
3
4
4
4
4
5
5
5
5
6
-0.9-0.7
-0.5
-0.3 -0
.3
-0.1
-0.1
-0.1
-0.1
-0.1
90S 60S 30S 0 30N 60N 90N500
400
300
250
200
150
100
Pre
ssur
e (h
Pa)
(e)
-1
0
0 0
0
1
1 1
1
2
2
2
3
3
3
3
4
4
4
4
5
5
5
6
6
7
-0.9-0.7
-0.5
-0.3
-0.3
-0.3
-0.3
-0.1
-0.1
-0.1
-0.1
-0.1
-0.1
90S 60S 30S 0 30N 60N 90N500
400
300
250
200
150
100
Pre
ssur
e (h
Pa)
-12 -10 -8 -6 -4 -2 0 2 4 6 8 10 12Zonal-mean change (%)
Figure 7. Zonal-mean change in annual-mean RHi (colours), temperature (solid black lines) and fraction of points below the 233 K temper-
ature threshold (dotted black lines) as a function of pressure for the CMIP5 models (a) EC-EARTH, (b) GFDL-ESM2G, (c) HadGEM2-CC,
(d) MIROC5 and (e) MPI-ESM-MR. The changes are calculated using monthly-mean data, as the average over 2073–2099 (RCP8.5 sim-
ulation) minus the average over 1979–2005 (historical simulation). The subregions of particular interest are highlighted by black boxes:
the tropics, Northern Hemisphere mid-latitudes and Northern Hemisphere polar regions. The vertical range of these boxes is 200–300 hPa,
spanning the range of typical cruise altitudes for commercial aircraft.
and magnitude of the change in CISS vary by region. The
largest contribution to the global-mean decrease is the strong
decrease in CISS frequency in the tropics, of 8.8 percent-
age points in the multi-model mean by the end of the 21st
century. The rate of decrease is strongest in the mid-century,
and levels off by the later part of the century. The decrease
in CISS frequency is mainly due to the strong warming at
the 250 hPa level, which shifts the temperature PDF from be-
low the 233 K temperature threshold to above it. There is less
consensus between the models on the sign and magnitude of
the change in the NH mid-latitudes at the 250 hPa level. The
multi-model-mean, annual-mean change is around 1 percent-
age point by 2100, and seasonally dependent; models show
small increases in CISS frequency in winter and decreases in
summer. The models agree on an increase in CISS frequency
over the NH polar regions in all seasons, reaching approxi-
mately 5 percentage points by 2100. The results are broadly
consistent with those of Marquart et al. (2003), where the fo-
cus was on predicting changes in contrail cover for specified
distributions of air traffic growth, rather than the frequency
www.earth-syst-dynam.net/6/555/2015/ Earth Syst. Dynam., 6, 555–568, 2015

566 E. A. Irvine and K. P. Shine: Ice supersaturation
of CISS. In their simulations, the impact of climate change
reduces the 2050 contrail cover by 20 percentage points com-
pared to the case with no climate change, with that decrease
concentrated in the tropics.
The CMIP5 zonal-mean monthly-mean relative humidity
and temperature projections suggest that the changes pro-
jected at the 250 hPa level are applicable to other cruise al-
titudes, perhaps with the exception of the NH mid-latitudes,
where the sign of any change in CISS frequency is more de-
pendent on latitude and altitude. In the tropics, the largest
change in the CMIP5 models is at 250 hPa, which is in the
middle of the range of permitted cruise altitudes. However,
since the models have a cold bias, relative to the reanalyses,
the level at which the maximum change is seen may actually
be higher than this.
The projected changes to ISS frequency over the 21st cen-
tury have implications for contrail cover, and consequently
contrail climate impact. Persistent contrails form when air-
craft fly through the CISS regions analysed here; making pro-
jections of actual contrail cover for the 21st century would re-
quire combining the climate model data with estimates of the
amount and distribution of air traffic throughout this time pe-
riod of the climate model simulations, as well as accounting
for improvements to aircraft engine technology. Here we pro-
vide a discussion of the possible impact of the CISS changes
on contrail cover, given projections of air traffic demand and
increasing aircraft engine efficiency. In the NH mid-latitudes,
where there is already a high volume of air traffic, climate
models predict small increases in CISS frequency, particu-
larly in winter. This suggests that there could be small in-
creases in contrail cover from the combination of increased
CISS frequency and increased air traffic. Increases in engine
efficiency are likely to have only minor impacts on contrail
cover in this region since temperatures are normally well be-
low those required for contrail formation. In the tropics, the
reduction in CISS frequency is in opposition to the predicted
growth in aviation and increase in engine efficiency. It seems
likely, however, that a factor of 2–5 increase in air traffic from
2000 to 2050 (Owen et al., 2010) along with an increase in
engine efficiency will outweigh the few percentage point de-
crease in CISS frequency shown here, leading to an increase
in contrail cover. In the NH polar regions, the situation is
similar to the NH mid-latitudes, but with more confidence
in larger increases in CISS frequency due to climate change.
The predicted increases in CISS frequency presented here, as
well as a possible factor of 2 increase in air traffic (Owen et
al., 2010), suggest an increase in contrail cover. The climate
significance of this is less obvious, since any contrails formed
at high latitudes are likely to be very thin, and the level of air
traffic is likely to remain far below that of the mid-latitude or
tropical regions. Overall, global contrail cover seems likely
to increase over the 21st century, with climate change act-
ing to increase contrail cover in the mid-latitude and po-
lar regions and constraining changes in contrail cover in the
tropics. In time, improvement in the global observing system
may allow a robust evaluation of the model-derived humid-
ity trends, which would impact on the confidence with which
those trends can be viewed.
Acknowledgements. This work was supported by the Natural
Environment Research Council, grant NE/J021113/1. We thank
Brian Hoskins and Jake Gristey for useful discussions during this
work. We acknowledge the World Climate Research Programme’s
Working Group on Coupled Modelling, which is responsible for
CMIP, and we thank the climate modelling groups for producing
and making available their model output. For CMIP the U.S.
Department of Energy’s Program for Climate Model Diagnosis
and Intercomparison provides coordinating support and led devel-
opment of software infrastructure in partnership with the Global
Organization for Earth System Science Portals. The reviewers are
thanked for many helpful comments.
Edited by: V. Lucarini
References
Burkhardt, U., Kärcher, B., Ponater, M., Gierens, K., and
Gettelman, A.: Contrail cirrus supporting areas in model
and observations, Geophys. Res. Lett., 35, L16808,
doi:10.1029/2008GL034056, 2008.
Collins, W. J., Bellouin, N., Doutriaux-Boucher, M., Gedney, N.,
Halloran, P., Hinton, T., Hughes, J., Jones, C. D., Joshi, M., Lid-
dicoat, S., Martin, G., O’Connor, F., Rae, J., Senior, C., Sitch,
S., Totterdell, I., Wiltshire, A., and Woodward, S: Develop-
ment and evaluation of an Earth-system model – HadGEM2,
Geosci. Model Dev., 4, 1051–1075, doi:10.5194/gmd-4-1051-
2011, 2011.
Davini, P. and Cagnazzo, C.: On the misinterpretation of the north
Atlantic oscillation in CMIP5 models, Clim. Dynam., 43, 1497–
1511, doi:10.1007/s00382-013-1970-y, 2013.
Dee, D. P., Uppala, S. M., Simmons, A. J., Berrisford, P., Poli,
P., Kobayashi, S., Andrae, U., Balmaseda, M. A., Balsamo, G.,
Bauer, P., Bechtold, P., Beljaars, A. C. M., van de Berg, L., Bid-
lot, J., Bormann, N., Delsol, C., Dragani, R., Fuentes, M., Geer,
A. J., Haimberger, L., Healy, S. B., Hersbach, H., Hólm, E. V.,
Isaksen, L., Kållberg, P., Köhler, M., Matricardi, M., McNally,
A. P., Monge-Sanz, B. M., Morcrette, J- J., Park, B- K., Peubey,
C., de Rosnay, P., Tavolato, C., Thépaut, J- N., and Vitart, F.: The
ERA-Interim reanalysis: configuration and performance of the
data assimilation system, Q. J. Roy. Meteor. Soc., 13, 553–597,
2011.
Deuber, O., Matthes, S., Sausen, R., Ponater, M., and Ling,
L.: A physical metric-based framework for evaluating the cli-
mate trade-off between CO2 and contrails – the case of low-
ering flight trajectories, Environ. Sci. Policy, 25, 176–185,
doi:10.1016/j.envsci.2012.10.004, 2013.
Dunne, J. P., John, J. G., Adcroft, A. J., Griffies, S. M., Hallberg,
R. W., Shevliakova, E., Stouffer, R. J., Cooke, W., Dunne, K. A.,
Harrison, M. J., Krasting, J. P., Malyshev, S. L., Milly, P. C. D.,
Phillipps, P. J., Sentman, L. T., Samuels, B. L., Spelman, M. J.,
Winton, M., Wittenberg, A. T., and Zadeh, N.: GFDL’s ESM2
global coupled climate–carbon earth system models, part I, phys-
Earth Syst. Dynam., 6, 555–568, 2015 www.earth-syst-dynam.net/6/555/2015/

E. A. Irvine and K. P. Shine: Ice supersaturation 567
ical formulation and baseline simulation characteristics, J. Cli-
mate, 25, 6646–6665, doi:10.1175/JCLI-D-11-00560.1, 2012.
Fichter, C., Marquart, C., Sausen, R., and Lee, D. S.: The impact of
cruise altitude on contrails and related radiative forcing, Meteo-
rol. Z., 14, 563–572, 2005.
Gettelman, A., Fetzer, E. J., Eldering, A., and Irion, F. W.: The
global distribution of supersaturation in the upper troposphere
from the Atmospheric Infrared Sounder, J. Climate, 19, 6089–
6103, 2006.
Gierens, K. and Brinkop. S.: Dynamical characteristics of ice su-
persaturated regions, Atmos. Chem. Phys., 12, 11933–11942,
doi:10.5194/acp-12-11933-2012, 2012.
Gierens, K. and Spichtinger, P.: On the size distribution of ice-
supersaturated regions in the upper troposphere and lowermost
stratosphere, Ann. Geophys., 18, 499–504, doi:10.1007/s00585-
000-0499-7, 2000.
Gierens, K., Sausen, R., and Schumann, U.: A diagnostic study of
the global distribution of contrails, Part II: Future air traffic sce-
narios, Theor. Appl. Climatol., 63, 1–9, 1999.
Gierens, K., Lim, L., and Eleftheratos, K.: A review of various
strategies for contrail avoidance, Open Atmos. Sci. J., 2, 1–7,
2008.
Haglind, F.: Potential of lowering the contrail formation of aircraft
exhausts by engine re-design, Aerosp. Sci. Technol., 12, 490–
497, 2008.
Hazeleger, W., Severijns, C., Semmler, T., Stefanescu, S., Yang, S.,
Wang, X., Wyser, K., Dutra, E., Baldasano, J. M., Bintanja, R.,
Bougeault, P., Caballero, R., Ekman, A. M. L., Christensen, J. H.,
van den Hurk, B., Jimenez, P., Jones, C., Kållberg, P., Koenigk,
T., McGrath, R., Miranda, P., Van Noije, T., Palmer, T., Parodi,
J. A., Schmith, T., Selten, F., Storelvmo, T., Sterl, A., Tapamo,
H., Vancoppenolle, M., Viterbo, P., and Willén, U.: EC-Earth:
a seamless earth-system prediction approach in action, B. Am.
Meteorol. Soc., 91, 1357–1363, 2010.
Hazeleger, W., Wang, X., Severijns, C., Stefanescu, S., Bintanja,
R., Sterl, A., Wyser, K., Semmler, T., Yang, S., van den Hurk,
B., van Noije, T., van der Linden, E., and van der Wiel, K.:
EC-EARTH V2.2: description and validation of a new seamless
earth system prediction model, Clim. Dynam., 39, 2611–2629,
doi:10.1007/s00382-011-1228-5, 2012.
Immler, F., Treffeisen, R., Engelbart, D., Krüger, K., and Schrems,
O.: Cirrus, contrails, and ice supersaturated regions in high pres-
sure systems at northern mid latitudes, Atmos. Chem. Phys., 8,
1689–1699, doi:10.5194/acp-8-1689-2008, 2008.
IPCC: Climate Change 2013: The Physical Science Basis. Con-
tribution of Working Group I to the Fifth Assessment Report
of the Intergovernmental Panel on Climate Change, edited by:
Stocker, T. F., Qin, D., Plattner, G.-K., Tignor, M., Allen, S. K.,
Boschung, J., Nauels, A., Xia, Y., Bex, V. and Midgley, P. M.,
Cambridge University Press, Cambridge, UK and New York,
1535 pp., doi:10.1017/CBO9781107415324, 2013.
Irvine, E. A., Hoskins, B. J., and Shine, K. P.: The depen-
dence of contrail formation on the weather pattern and alti-
tude in the north Atlantic, Geophys. Res. Lett., 39, L12802,
doi:10.1029/2012GL051909, 2012.
Irvine, E. A., Hoskins, B. J., and Shine, K. P.: A Lagrangian analy-
sis of ice-supersaturated air over the North Atlantic, J. Geophys.
Res., 119, 90–100, doi:10.1002/2013JD020251, 2014a.
Irvine, E. A., Hoskins, B. J., and Shine, K. P.: A simple framework
for assessing the trade-off between the climate impact of aviation
dioxide emissions and contrails for a single flight, Environ. Res.
Lett., 9, 064021, doi:10.1088/1748-9326/9/6/064021, 2014b.
Irvine, E. A., Shine, K. P., and Stringer, M. A.: What are the impli-
cations of climate change for trans-Atlantic aircraft routing and
flight time?, Transport. Res. D-Tr. E., in review, 2015.
Kästner, M., Meyer, R., and Wendling, P.: Influence of weather
conditions on the distribution of persistent contrails, Meteorol.
Appl., 6, 261–271, doi:10.1017/S1350482799001231, 1999.
Lamquin, N., Gierens, K., Stubenrauch, C. J., and Chatterjee,
R.: Evaluation of upper tropospheric humidity forecasts from
ECMWF using AIRS and CALIPSO data, Atmos. Chem. Phys.,
9, 1779–1793, doi:10.5194/acp-9-1779-2009, 2009.
Lamquin, N., Stubenrauch, C. J., Gierens, K., Burkhardt, U., and
Smit, H.: A global climatology of upper-tropospheric ice su-
persaturation occurrence inferred from the Atmospheric Infrared
Sounder calibrated by MOZAIC, Atmos. Chem. Phys., 12, 381–
405, doi:10.5194/acp-12-381-2012, 2012.
Lee, D. S., Fahey, D. W., Forster, P. M., Newton, P. J., Wit, R. C. N.,
Lim, L. L., Owen, B., and Sausen, R.: Aviation and global cli-
mate change in the 21st century, Atmos. Environ., 43, 3520–
3537, 2009.
Lee, Y.-Y. and Black, R. X.: Boreal winter low-frequency variability
in CMIP5 models, J. Geophys. Res.-Atmos., 118, 6891–6904,
doi:10.1002/jgrd.50493, 2013.
Lorenz, D. J. and DeWeaver, E. T.: The response of the extratropi-
cal hydrological cycle to global warming, J. Climate, 20, 3470–
3484, 2007.
Luo, Z., Kley, D., Johnson, R. H., and Smit, H.: Ten years of mea-
surements of tropical upper-tropospheric water by MOZAIC,
Part I: Climatology, variability, transport and relation to deep
convection, J. Climate, 20, 418–435, 2007.
Mannstein, H., Spichtinger, P., and Gierens, K.: A note on how
to avoid contrail cirrus, Transport. Res. D-Tr. E., 10, 421–426,
2005.
Marquart, S., Ponater, M., Mager, F., and Sausen, R.: Future de-
velopment of contrail cover, optical depth, and radiative forcing:
impacts of increasing air traffic and climate change, J. Climate,
16, 2890–2904, 2003.
Martin, G. M., Bellouin, N., Collins, W. J., Culverwell, I. D., Hallo-
ran, P. R., Hardiman, S. C., Hinton, T. J., Jones, C. D., McDon-
ald, R. E., McLaren, A. J., O’Connor, F. M., Roberts, M. J., Ro-
driguez, J. M., Woodward, S., Best, M. J., Brooks, M. E., Brown,
A. R., Butchart, N., Dearden, C., Derbyshire, S. H., Dharssi, I.,
Doutriaux-Boucher, M., Edwards, J. M., Falloon, P. D., Gedney,
N., Gray, L. J., Hewitt, H. T., Hobson, M., Huddleston, M. R.,
Hughes, J., Ineson, S., Ingram, W. J., James, P. M., Johns, T. C.,
Johnson, C. E., Jones, A., Jones, C. P., Joshi, M. M., Keen, A. B.,
Liddicoat, S., Lock, A. P., Maidens, A. V., Manners, J. C., Mil-
ton, S. F., Rae, J. G. L., Ridley, J. K., Sellar, A., Senior, C. A.,
Totterdell, I. J., Verhoef, A., Vidale, P. L., and Wiltshire, A.: The
HadGEM2 family of Met Office Unified Model climate config-
urations, Geosci. Model Dev., 4, 723–757, doi:10.5194/gmd-4-
723-2011, 2011.
Minnis, P., Ayers, J. K., Palikonda, R., and Phan, D.: Contrails, cir-
rus trends and climate, J. Climate, 17, 1671–1685, 2004.
www.earth-syst-dynam.net/6/555/2015/ Earth Syst. Dynam., 6, 555–568, 2015
568 E. A. Irvine and K. P. Shine: Ice supersaturation
Owen, B., Lee, D. S., and Lim, L.: Flying into the future: aviation
emissions scenarios to 2050, Environ. Sci. Technol., 44, 2255–
2260, doi:10.1021/es902530z, 2010.
Rädel, G. and Shine, K. P.: Evaluation of the use of radiosonde hu-
midity data to predict the occurrence of persistent contrails, Q. J.
Roy. Meteor. Soc., 133, 1413–1423, doi:10.1002/qj.128, 2007.
Rädel, G. and Shine, K. P.: Radiative forcing by persistent contrails
and its dependence on cruise altitudes, J. Geophys. Res., 113,
D07105, doi:10.1029/2007JD009117, 2008.
Rädel, G. and Shine, K. P.: Validating ECMWF forecasts for the oc-
currence of ice supersaturation using visual observations of per-
sistent contrails and radiosonde measurements over the UK, Q.
J. Roy. Meteor. Soc., 136, 1723–1732, doi:10.1002/qj.670, 2010.
Riahi, K., Grübler, A., and Nakicenovic, N.: Scenarios of long-
term socio-economic and environmental development under
climate stabilization, Technol. Forecast. Soc., 74, 887–935,
doi:10.1016/j.techfore.2006.05.026, 2007.
Riahi, K., Rao, S., Krey, V., Cho, C., Chirkov, V., Fischer, G., Kin-
dermann, G., Nakicenovic, N., and Rafaj, P.: RCP 8.5 – a sce-
nario of comparatively high greenhouse gas emissions, Climatic
Change, 109, 33–57, doi:10.1007/s10584-011-0149-y, 2011.
Schumann, U.: On conditions of contrail formation from aircraft
exhausts, Meteorol. Z., 5, 4–23, 1996.
Schumann, U.: Influence of propulsion efficiency on contrail for-
mation, Aerosp. Sci. Technol., 4, 391–401, 2000.
Schumann, U., Busen, R., and Plohr, M.: Experimental test of the
influence of propulsion efficiency on contrail formation, J. Air-
craft, 37, 1083–1087, 2000.
Schumann, U., Graf, K., and Mannstein, H.: Potential to reduce the
climate impact of aviation by flight level changes, 3rd AIAA At-
mospheric Space Environments Conference, 27–30 June 2011,
Honolulu, Hawaii, USA, 1–22, 2011.
Sherwood, S. C., Ingram, W., Tsushima, Y., Satoh, M., Roberts,
M., Vidale, P. L., and O’Gorman, P. A.: Relative humidity
changes in a warmer climate, J. Geophys. Res., 115, D09104,
doi:10.1029/2009JD012585, 2010.
Soler, M., Zou, B., and Hansen, M.: Flight trajectory design in the
presence of contrails: application of a multiphase mixed-integer
optimal control approach, Transport. Res. C-Emer., 48, 172–194,
doi:10.1016/j.trc.2014.08.009, 2014.
Spichtinger, P., Gierens, K., Leiterer, U., and Dier, H.: Ice super-
saturation in the tropopause region over Lindenberg, Germany,
Meteorol. Z., 12, 143–156, 2003a.
Spichtinger, P., Gierens, K., and Read, W.: The global distribu-
tion of ice-supersaturated regions as seen by the microwave limb
sounder, Q. J. Roy. Meteor. Soc., 129, 3391–3410, 2003b.
Spichtinger, P., Gierens, K., and Wernli, H.: A case study on the
formation and evolution of ice supersaturation in the vicinity of
a warm conveyor belt’s outflow region, Atmos. Chem. Phys., 5,
973–987, doi:10.5194/acp-5-973-2005, 2005.
Sridhar, B., Chen, N. Y., and Ng, H. K.: Energy efficient contrail
mitigation strategies for reducing the environmental impact of
aviation, 10th USA/Europe Air Traffic Management Research
and Development Seminar, 212, 10–13 June 2013, Chicago, Illi-
nois, USA, 2013.
Stevens, B., Giorgetta, M., Esch, M., Mauritsen, T., Crueger, T.,
Rast, S., Salzmann, M., Schmidt, H., Bader, J., Block, K.,
Brokopt, R., Fast, I., Kinne, S., Kornblueh, L., Lohmann, U., Pin-
cus, R., Reichler, T., and Roeckner, E.: Atmospheric component
of the MPI-M earth system model: ECHAM6, JAMES, 5, 146–
172, doi:10.1002/jame.20015, 2013.
Taylor, K. E., Stouffer, R. J., and Meehl, G. A.: An overview of
CMIP5 and the experiment design, B. Am. Meteorol. Soc., 93,
485–498, doi:10.1175/BAMS-D-11-00094.1, 2012.
Thorne, P. W., Lanzante, J. R., Peterson, T. C., Seidel, D. J.,
and Shine, K. P.: Tropospheric temperature trends: history
of an ongoing controversy, WIREs Clim. Change, 2, 66–88,
doi:10.1002/wcc.80, 2011.
Tompkins, A. M., Gierens, K., and Rädel, G.: Ice supersaturation in
the ECMWF integrated forecast system, Q. J. Roy. Meteor. Soc.,
133, 53–63, 2007.
Watanabe, M., Suzuki, T., O’ishi, R., Komuro, Y., Watanabe, S.,
Emori, S., Takemura, T., Chikira, M., Ogura, T., Sekiguchi, M.,
Takata, K., Yamazaki, D., Yokohata, T., Nozawa, T., Hasumi,
H., Tatebe, H., and Kimoto, M.: Improved climate simulation by
MIROC5: mean states, variability, and climate sensitivity, J. Cli-
mate, 23, 6312–6335, doi:10.1175/2010JCLI3679.1, 2010.
Wilkerson, J. T., Jacobson, M. Z., Malwitz, A., Balasubrama-
nian, S., Wayson, R., Fleming, G., Naiman, A. D., and Lele,
S. K.: Analysis of emission data from global commercial avi-
ation: 2004 and 2006, Atmos. Chem. Phys., 10, 6391–6408,
doi:10.5194/acp-10-6391-2010, 2010.
Williams, V., Noland, R. B., and Toumi, R.: Reducing the climate
change impacts of aviation by restricting cruise altitudes, Trans-
port. Res. D-Tr. E., 7, 451–464, 2002.
Wright, J. S., Sobel, A., and Galewsky, J.: Diagnosis of zonal mean
relative humidity changes in a warmer climate, J. Climate, 23,
4556–4569, doi:10.1175/2010JCLI3488.1, 2010.
Zou, B., Buxi, G. S., and Hansen, M.: Optimal 4-D aircraft tra-
jectories in a contrail sensitive environment, Netw. Spat. Econ.,
doi:10.1007/s11067-013-9210-x, online first, 2015.
Earth Syst. Dynam., 6, 555–568, 2015 www.earth-syst-dynam.net/6/555/2015/