iceland - fiscal consolidation plan ministry of finance - iceland (2) - n. bragason - ice.pdf ·...
TRANSCRIPT
Iceland - Fiscal Consolidation Plan
Ministry of Finance
33rd Annual Meeting of OECD Senior Budget Officials
Nökkvi Bragason
June 7th 2012
1
Policy Report: Fiscal Consolidation Plan
2
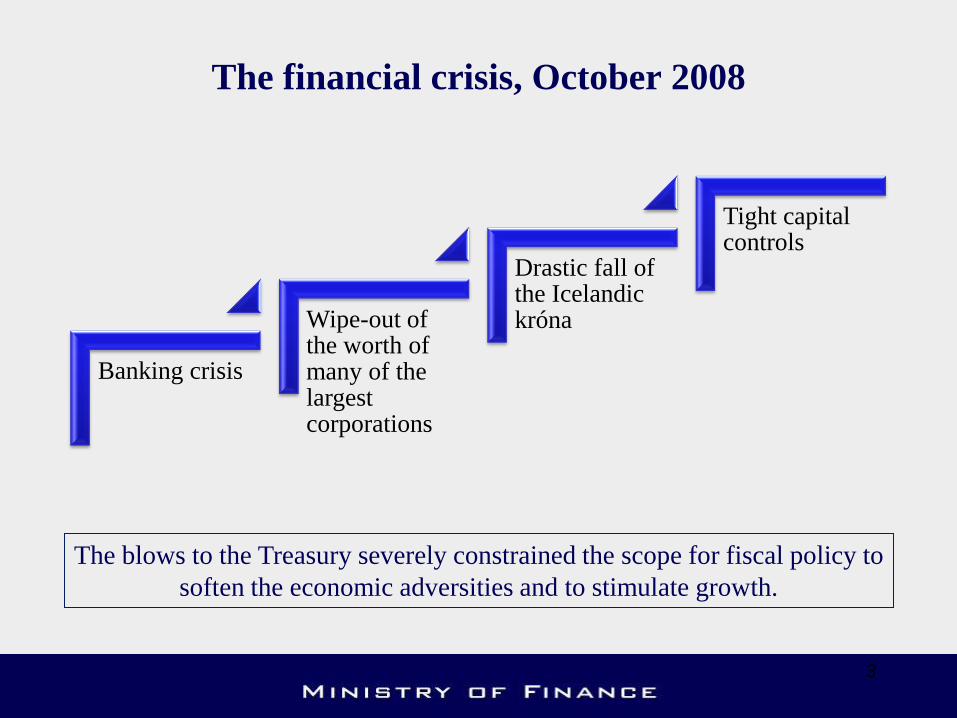
The financial crisis, October 2008
Banking crisis
Wipe-out of the worth of many of the largest corporations
Drastic fall of the Icelandic króna
Tight capital controls
3
The blows to the Treasury severely constrained the scope for fiscal policy to
soften the economic adversities and to stimulate growth.
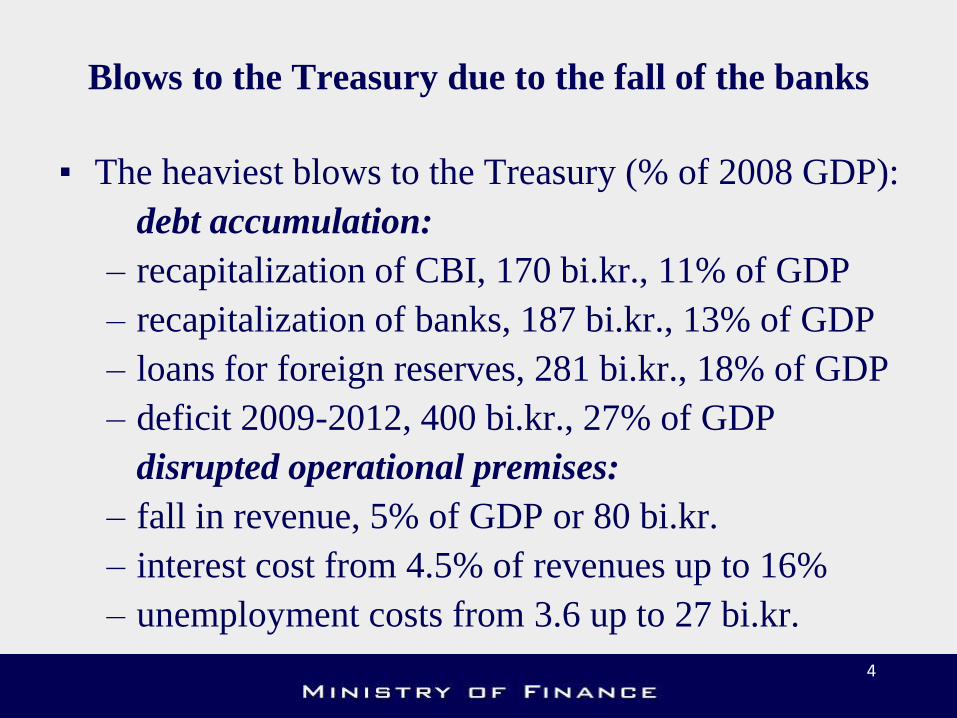
Blows to the Treasury due to the fall of the banks
▪ The heaviest blows to the Treasury (% of 2008 GDP):
debt accumulation:
– recapitalization of CBI, 170 bi.kr., 11% of GDP
– recapitalization of banks, 187 bi.kr., 13% of GDP
– loans for foreign reserves, 281 bi.kr., 18% of GDP
– deficit 2009-2012, 400 bi.kr., 27% of GDP
disrupted operational premises:
– fall in revenue, 5% of GDP or 80 bi.kr.
– interest cost from 4.5% of revenues up to 16%
– unemployment costs from 3.6 up to 27 bi.kr.
4
Strengths in the position of the Treasury
• The net debt of the Treasury (4% of GDP) was
among the lowest in Europe due to sizeable surpluses
for a number of years and the sale of assets.
• Treasury deposits with the Central Bank at the end of
2007 amounted 150 billion ISK, equivalent to 10% of
GDP.
• The net financial position of the Treasury excluding
financial assets had become positive by over 3% of
GDP and the interest balance was positive as well.
5
Weaknesses in the position of the Treasury
• A large portion of revenues was based on:
– oversized banking system
– networks of leveraged holding corporations
– huge current account deficit
– bloated economy due to asset bubbles
• A series of tax cuts as well as various taxes and fees
denominated in krónur that were allowed to be eroded
by inflation weakened the revenue collection system.
6
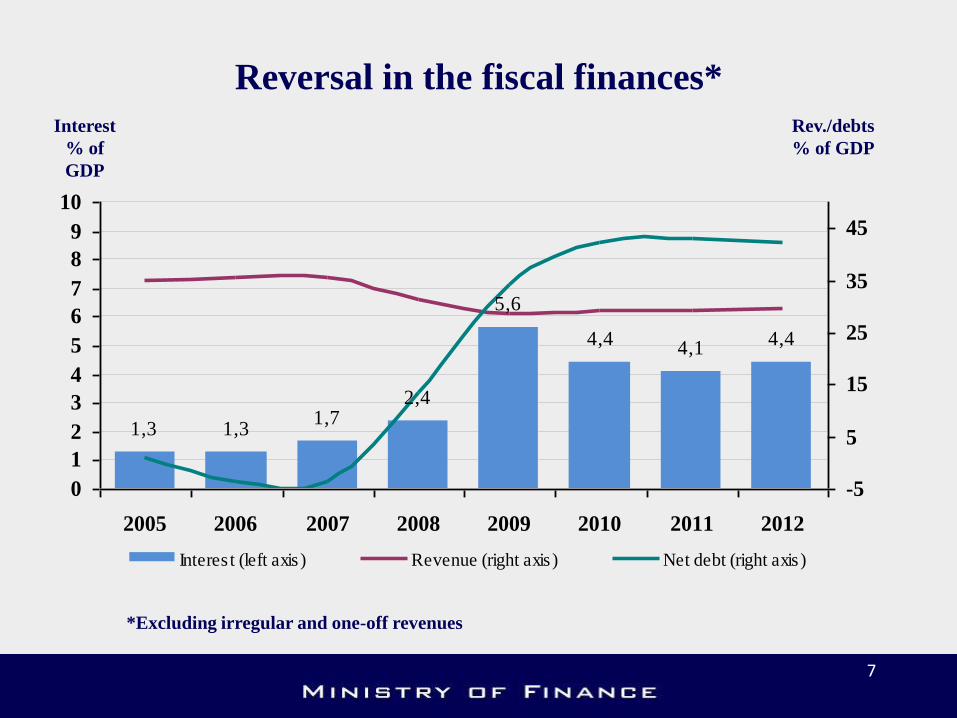
Reversal in the fiscal finances*
7
Rev./debts
% of GDP
Interest
% of
GDP
*Excluding irregular and one-off revenues
1,3 1,31,7
2,4
5,6
4,44,1
4,4
0
1
2
3
4
5
6
7
8
9
10
2005 2006 2007 2008 2009 2010 2011 2012
-5
5
15
25
35
45
Interes t (left axis ) Revenue (right axis ) Net debt (right axis )
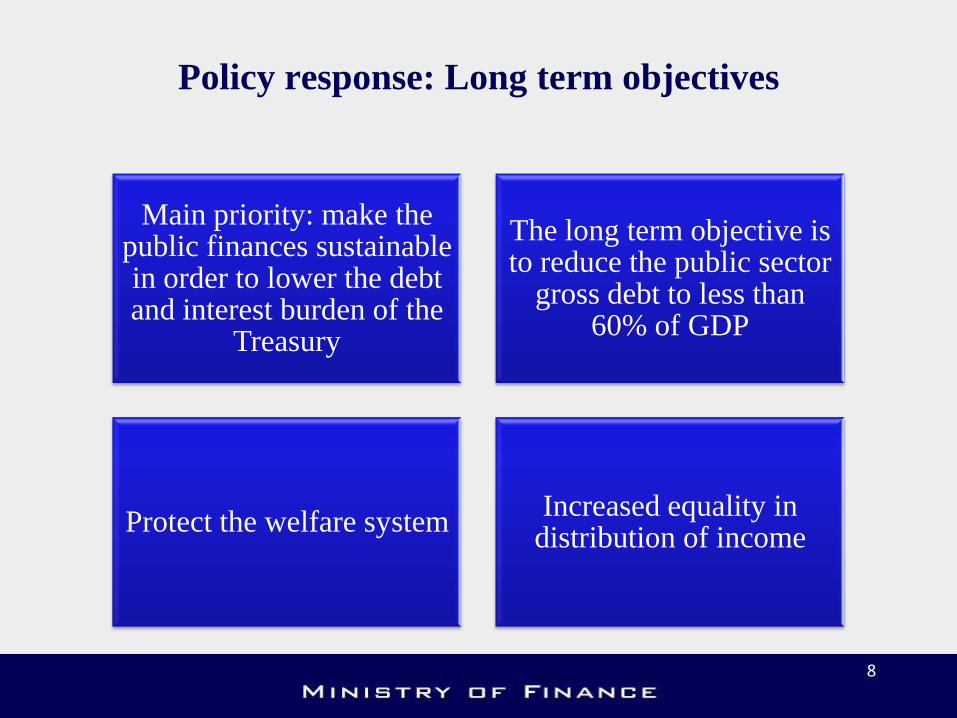
Policy response: Long term objectives
8
Main priority: make the public finances sustainable in order to lower the debt and interest burden of the
Treasury
The long term objective is to reduce the public sector
gross debt to less than 60% of GDP
Protect the welfare system Increased equality in
distribution of income
Policy response: The fiscal consolidation plan
9
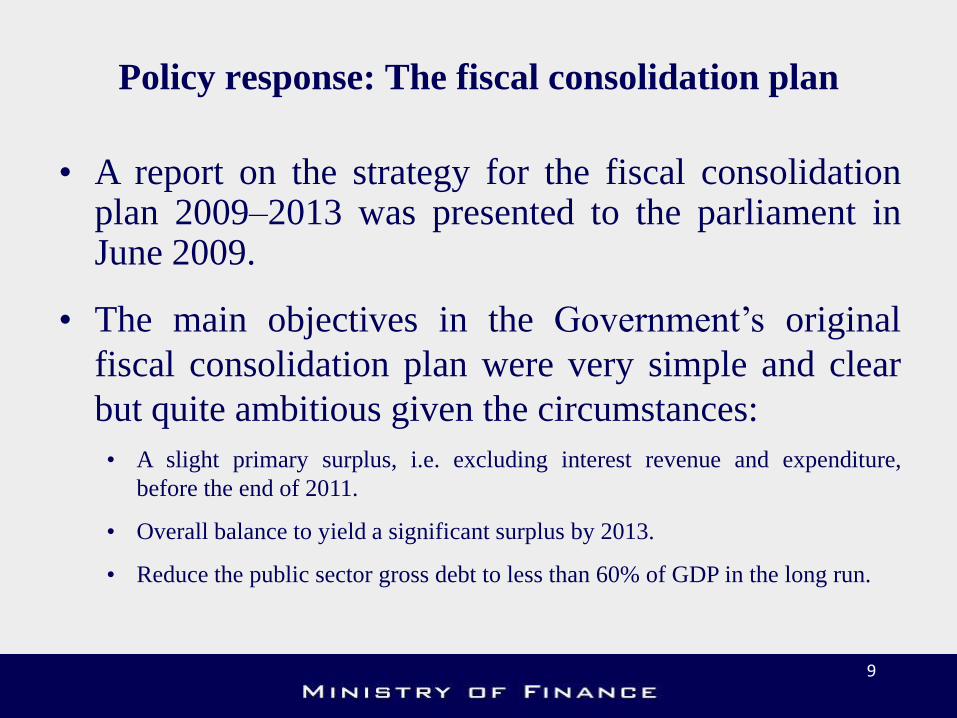
• A report on the strategy for the fiscal consolidation plan 2009–2013 was presented to the parliament in June 2009.
• The main objectives in the Government’s original
fiscal consolidation plan were very simple and clear
but quite ambitious given the circumstances:
• A slight primary surplus, i.e. excluding interest revenue and expenditure,
before the end of 2011.
• Overall balance to yield a significant surplus by 2013.
• Reduce the public sector gross debt to less than 60% of GDP in the long run.
Revision of the fiscal consolidation plan
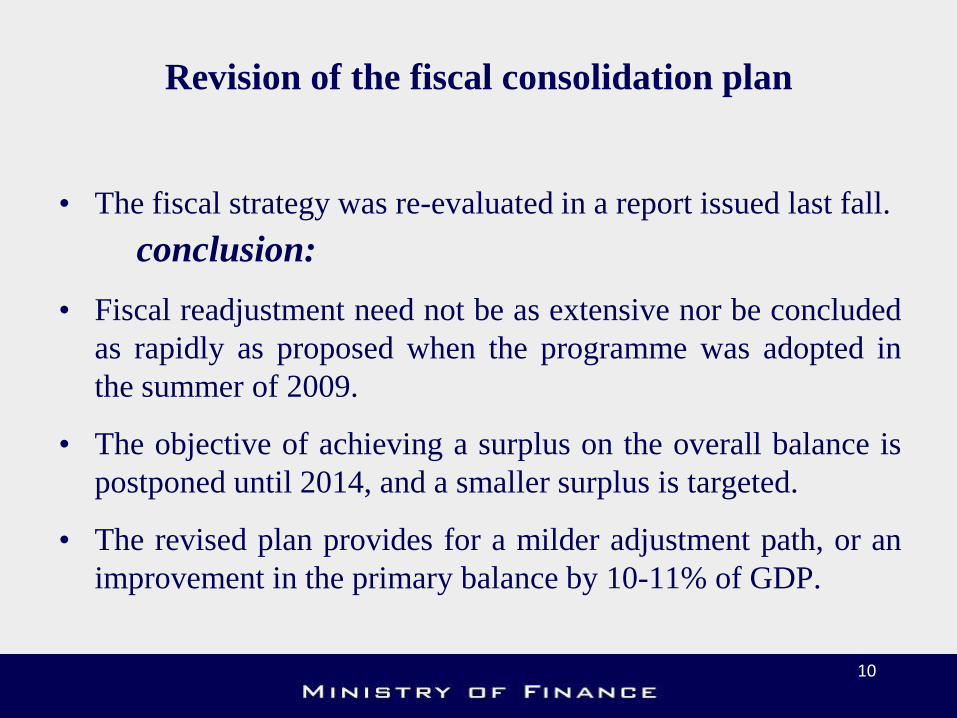
• The fiscal strategy was re-evaluated in a report issued last fall.
conclusion:
• Fiscal readjustment need not be as extensive nor be concluded
as rapidly as proposed when the programme was adopted in
the summer of 2009.
• The objective of achieving a surplus on the overall balance is
postponed until 2014, and a smaller surplus is targeted.
• The revised plan provides for a milder adjustment path, or an
improvement in the primary balance by 10-11% of GDP.
10
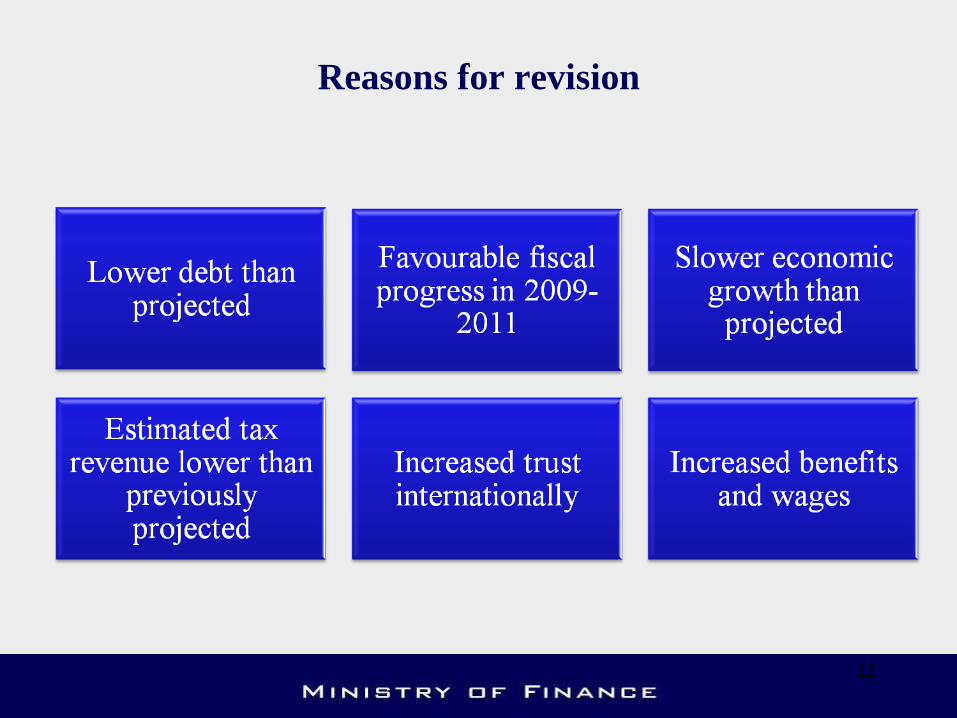
Reasons for revision
11
12
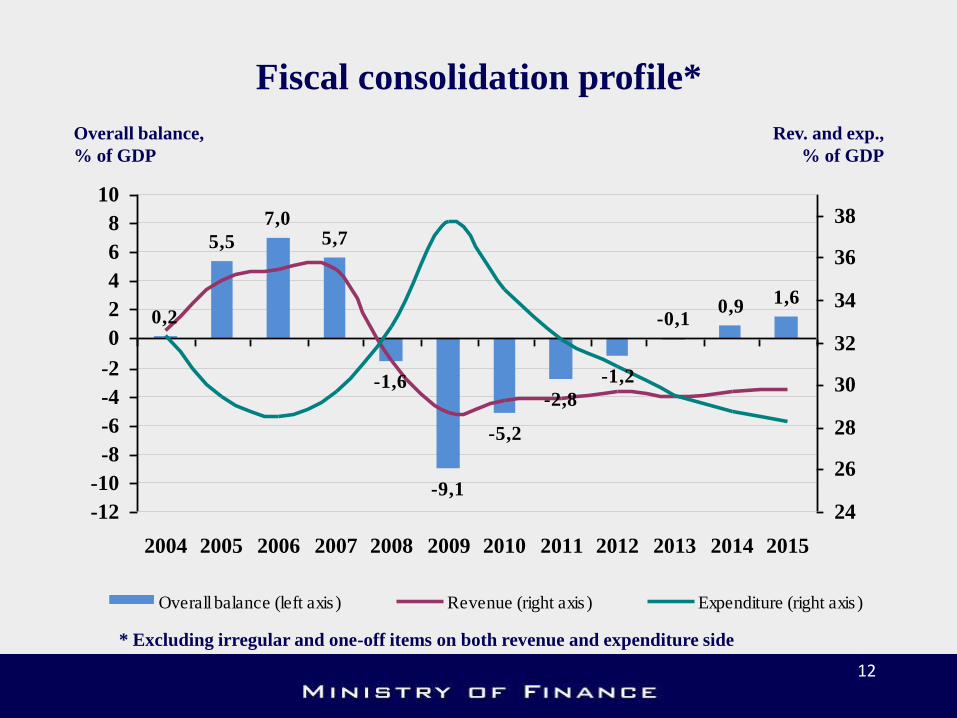
* Excluding irregular and one-off items on both revenue and expenditure side
Overall balance,
% of GDP
Rev. and exp.,
% of GDP
0,2
5,5
7,05,7
-1,6
-9,1
-5,2
-2,8
-1,2
-0,10,9
1,6
-12
-10
-8
-6
-4
-2
0
2
4
6
8
10
2004 2005 2006 2007 2008 2009 2010 2011 2012 2013 2014 2015
24
26
28
30
32
34
36
38
Overall balance (left axis ) Revenue (right axis ) Expenditure (right axis )
Fiscal consolidation profile*
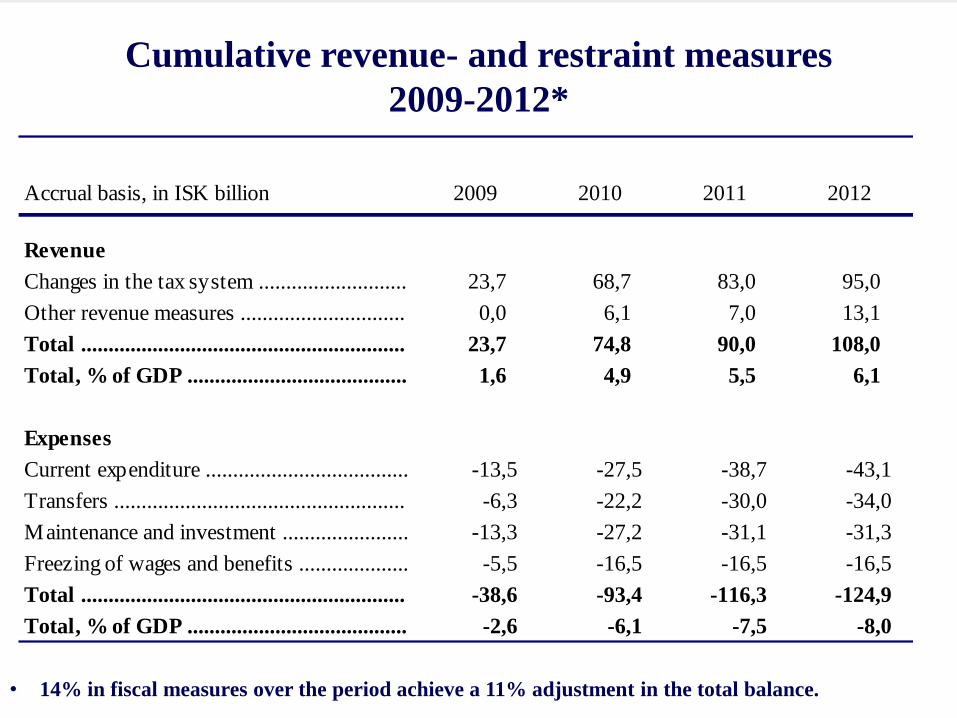
13 13 • 14% in fiscal measures over the period achieve a 11% adjustment in the total balance.
Cumulative revenue- and restraint measures
2009-2012*
Accrual basis, in ISK billion 2009 2010 2011 2012
Revenue
Changes in the tax system ........................... 23,7 68,7 83,0 95,0
Other revenue measures .............................. 0,0 6,1 7,0 13,1
Total ........................................................... 23,7 74,8 90,0 108,0
Total, % of GDP ........................................ 1,6 4,9 5,5 6,1
Expenses
Current expenditure ..................................... -13,5 -27,5 -38,7 -43,1
Transfers ..................................................... -6,3 -22,2 -30,0 -34,0
Maintenance and investment ....................... -13,3 -27,2 -31,1 -31,3
Freezing of wages and benefits .................... -5,5 -16,5 -16,5 -16,5
Total ........................................................... -38,6 -93,4 -116,3 -124,9
Total, % of GDP ........................................ -2,6 -6,1 -7,5 -8,0
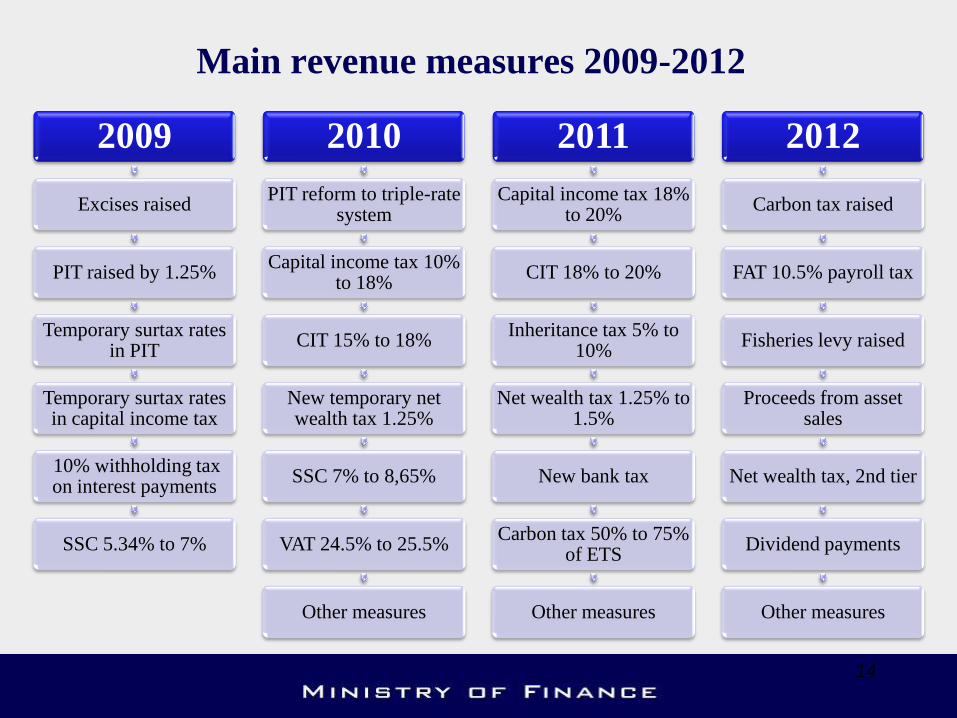
Main revenue measures 2009-2012
14
2009
Excises raised
PIT raised by 1.25%
Temporary surtax rates in PIT
Temporary surtax rates in capital income tax
10% withholding tax on interest payments
SSC 5.34% to 7%
2010
PIT reform to triple-rate system
Capital income tax 10% to 18%
CIT 15% to 18%
New temporary net wealth tax 1.25%
SSC 7% to 8,65%
VAT 24.5% to 25.5%
Other measures
2011
Capital income tax 18% to 20%
CIT 18% to 20%
Inheritance tax 5% to 10%
Net wealth tax 1.25% to 1.5%
New bank tax
Carbon tax 50% to 75% of ETS
Other measures
2012
Carbon tax raised
FAT 10.5% payroll tax
Fisheries levy raised
Proceeds from asset sales
Net wealth tax, 2nd tier
Dividend payments
Other measures
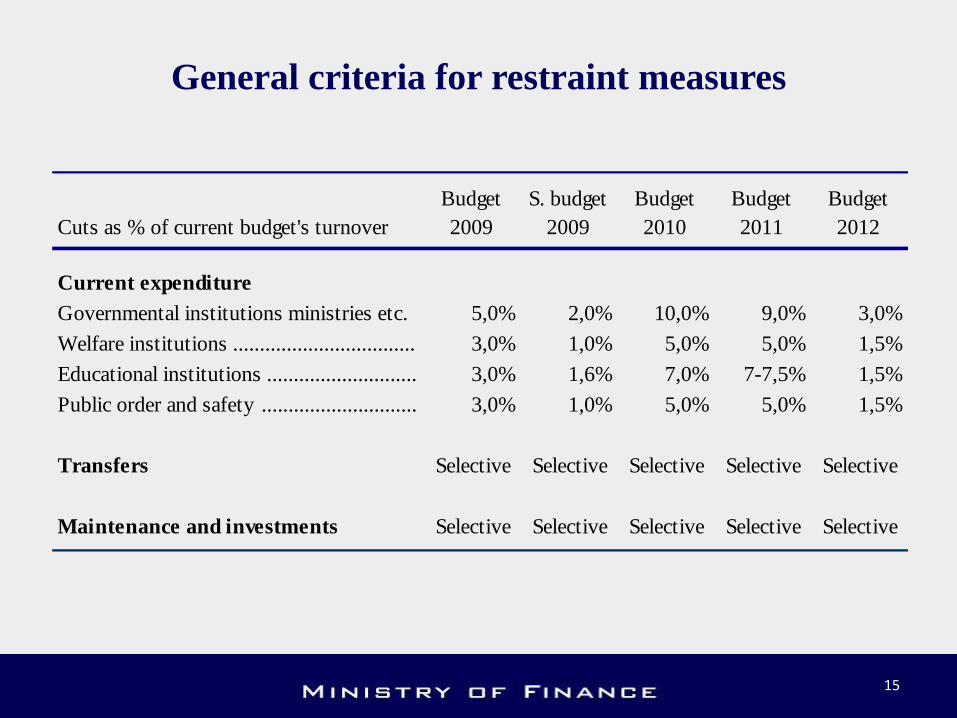
15
Cuts as % of current budget's turnover
Budget
2009
S. budget
2009
Budget
2010
Budget
2011
Budget
2012
Current expenditure
Governmental institutions ministries etc. 5,0% 2,0% 10,0% 9,0% 3,0%
Welfare institutions .................................. 3,0% 1,0% 5,0% 5,0% 1,5%
Educational institutions ............................ 3,0% 1,6% 7,0% 7-7,5% 1,5%
Public order and safety ............................. 3,0% 1,0% 5,0% 5,0% 1,5%
Transfers Selective Selective Selective Selective Selective
Maintenance and investments Selective Selective Selective Selective Selective
General criteria for restraint measures
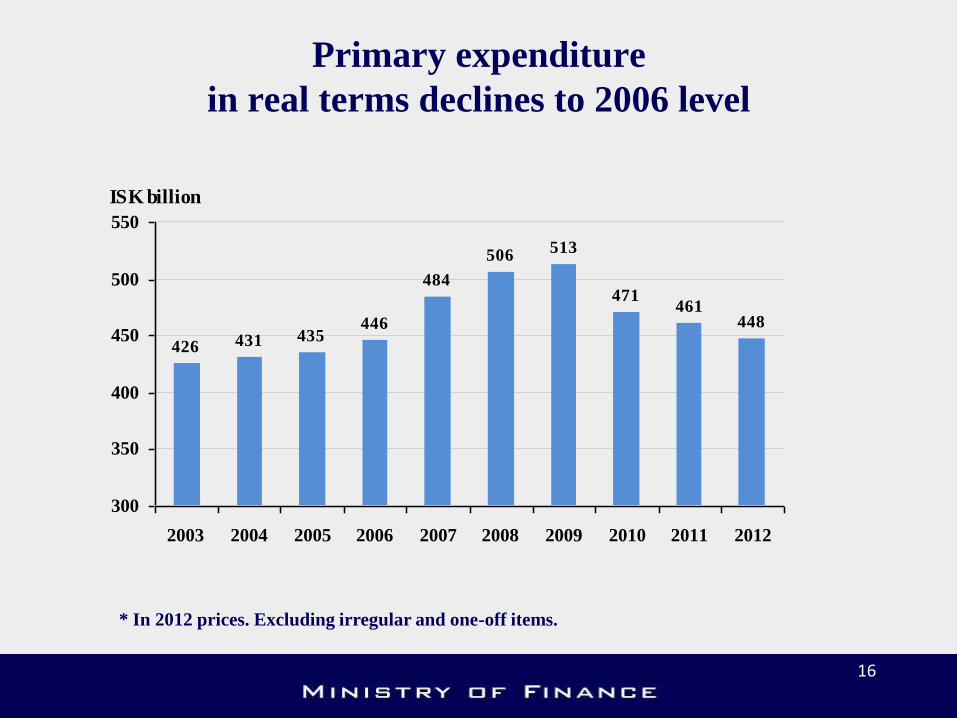
Primary expenditure
in real terms declines to 2006 level
16
426 431 435446
484
506513
471461
448
300
350
400
450
500
550
2003 2004 2005 2006 2007 2008 2009 2010 2011 2012
ISK billion
* In 2012 prices. Excluding irregular and one-off items.
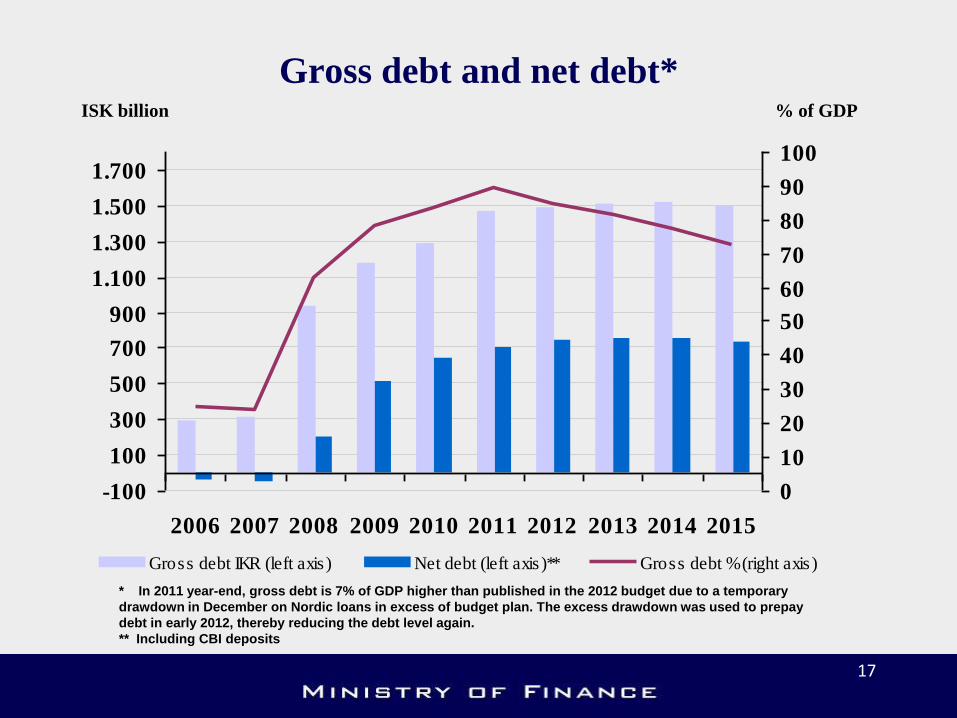
Gross debt and net debt*
17
ISK billion % of GDP
-100
100
300
500
700
900
1.100
1.300
1.500
1.700
2006 2007 2008 2009 2010 2011 2012 2013 2014 2015
0
10
20
30
40
50
60
70
80
90
100
Gross debt IKR (left axis ) Net debt (left axis )** Gross debt % (right axis )
* In 2011 year-end, gross debt is 7% of GDP higher than published in the 2012 budget due to a temporary
drawdown in December on Nordic loans in excess of budget plan. The excess drawdown was used to prepay
debt in early 2012, thereby reducing the debt level again.
** Including CBI deposits