icellis® 500+ single-use generation q bioreactor cell
TRANSCRIPT

Application Note USD 3404
iCELLis® 500+ Single-Use Generation Q Bioreactor Cell Culture Validation Study .

Table of Contents
1 Summary .................................................................................................................................................. 3 1.1 iCELLis 500+ Bioreactor Performance ........................................................................................ 3
2 Introduction ............................................................................................................................................... 3 3 Materials and Methods ............................................................................................................................. 4
3.1 iCELLis 500+ and iCELLis Nano Bioreactor Materials ................................................................ 4 3.2 iCELLis 500+ System Process Details and Preparation ............................................................. 5 3.3 iCELLis 500+ Bioreactor Inoculation and Growth Phase ............................................................ 7 3.4 iCELLis 500+ Bioreactor Transfection ......................................................................................... 7 3.5 iCELLis 500+ Bioreactor Harvest ................................................................................................ 8 3.6 iCELLis Nano Bioreactor Process ............................................................................................... 9 3.7 iCELLis Nano Bioreactor Inoculation and Growth Phase ............................................................ 9 3.8 iCELLis Nano Bioreactor Transfection and Harvest .................................................................. 10
4 Results .................................................................................................................................................... 11 4.1 iCELLis 500+ and iCELLis Nano Bioreactor Runs .................................................................... 11 4.1.1 iCELLis 500+ Bioreactor Cell Growth Curves and Cell Distribution .......................................... 11 4.1.2 iCELLis 500+ and iCELLis Nano Bioreactor Metabolite Analysis ............................................. 14 4.1.3 iCELLis 500+ Bioreactor pH Monitoring and iCELLis Nano Bioreactor pH Control .................. 15 4.1.4 iCELLis 500+ Bioreactor DO Monitoring and iCELLis Nano Bioreactor DO Control ................ 18
5 Discussion .............................................................................................................................................. 20 6 Conclusions ............................................................................................................................................ 21 7 Perspectives ........................................................................................................................................... 21
1 Summary
The iCELLis 500+ single-use bioreactor cell culture run was performed as a validation study for the improved fixed-bed compaction (with folded carriers) and Hamilton♦ single-use probes included in the iCELLis 500+ Generation Q (Gen Q) bioreactors. In this work, we tested the iCELLis 500+ Gen Q bioreactor performance and usability, cell distribution, cell metabolite profiles, and pH and dissolved oxygen (DO) vessel monitoring. These tests demonstrated that we have a well-controlled system with homogenous bioreactor cell distribution. We also performed a transient transfection with adeno-associated virus serotype 5 (rAAV5), and those results are to be reported in a separate application note.
NOTE: All studies within this application note were conducted using the low compaction 333 m2 iCELLis 500+ bioreactor and the low compaction 2.65 m2 iCELLis Nano bioreactor – hereafter referred to as the iCELLis 500+ bioreactor and iCELLis Nano bioreactor.
1.1 iCELLis 500+ Bioreactor Performance The iCELLis 500+ bioreactor was successfully inoculated at 5,000 cells/cm2 from an Xpansion® 200 bioreactor cell pool. The cells were transfected at day 5 with predicted cell density between 100 – 150,000 cells/cm2. An iCELLis Nano bioreactor was run in parallel as the control and to monitor cell density throughout the run. The bioreactors were harvested after 24 hours post-rAAV5 transfection (total 6 days growth) and carrier samples were processed for cell nuclei counts.
• Cell density at day 6 was 211,000 cells/cm2 in the iCELLis 500+ bioreactor and 244,000 cells/cm2 in the iCELLis Nano bioreactor
• Uniform cell distribution between all radial and vertical vessel sections • Glucose and lactate metabolism profiles very similar between the iCELLis bioreactor and the
CellSTACK♦ 10 (CS10) and T-flask 75 (T-75) controls • Consistent iCELLis 500+ bioreactor media pH values before and after the fixed-bed at all
locations tested
2 Introduction
The iCELLis 500+ Gen Q validation study aim is to evaluate the impact of the short and mid-term latest changes on the iCELLis 500+ bioreactor cell culture performance as well as cell distribution throughout the fixed-bed. The iCELLis 500+ Gen Q bioreactor is an intermediate solution to the Gen R consumable and encompasses two major changes: Hamilton single-use pH and DO probes and improved fixed-bed compaction (due to the introduction of folded carriers). The sampling is improved with an after fixed-bed sampling line addition, allowing for more accurate media sampling and probe calibration. The iCELLis Nano bioreactor and iCELLis 500+ system were run in parallel to determine the scalability of cell growth and cell distribution. The 10 cm fixed-bed with compaction 1 was used for both bioreactors.
In conjunction with the iCELLis 500+ bioreactor cell culture run, a pH and DO monitoring study was performed to study the accuracy and compatibility of the Hamilton pH probe locations to the location of the new after fixed-bed sampling line. In the iCELLis 500+ Gen Q bioreactor and future series of consumables, the pH probe before the fixed-bed is removed and there are two pH probes after the fixed-bed. Due to the manufacturing change, it is important to document the reliability and accuracy of the pH probes after the fixed-bed compared to before fixed-bed values during a cell culture run. The DO probes will remain both before and after the fixed-bed in both bioreactor generations.
3 Materials and Methods
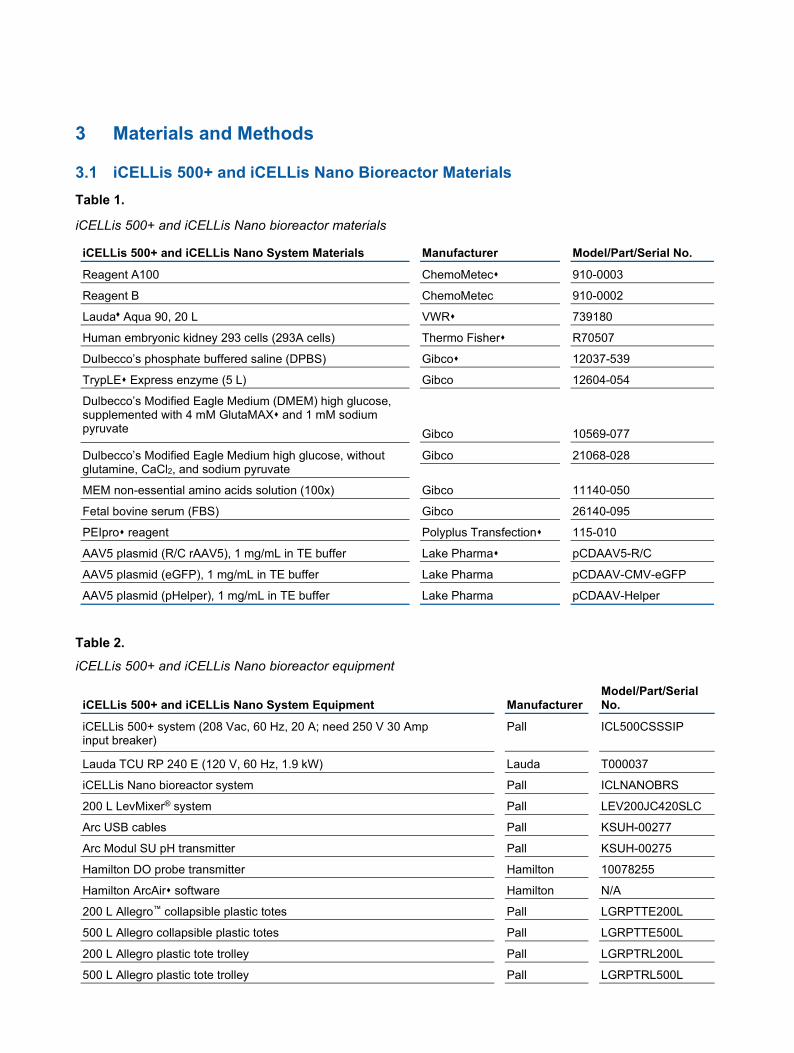
3.1 iCELLis 500+ and iCELLis Nano Bioreactor Materials Table 1.
iCELLis 500+ and iCELLis Nano bioreactor materials
iCELLis 500+ and iCELLis Nano System Materials Manufacturer Model/Part/Serial No.
Reagent A100 ChemoMetec 910-0003
Reagent B ChemoMetec 910-0002
Lauda♦ Aqua 90, 20 L VWR 739180
Human embryonic kidney 293 cells (293A cells) Thermo Fisher R70507
Dulbecco’s phosphate buffered saline (DPBS) Gibco 12037-539
TrypLE Express enzyme (5 L) Gibco 12604-054
Dulbecco’s Modified Eagle Medium (DMEM) high glucose, supplemented with 4 mM GlutaMAX and 1 mM sodium pyruvate
Gibco
10569-077
Dulbecco’s Modified Eagle Medium high glucose, without glutamine, CaCl2, and sodium pyruvate
Gibco 21068-028
MEM non-essential amino acids solution (100x) Gibco 11140-050
Fetal bovine serum (FBS) Gibco 26140-095
PEIpro reagent Polyplus Transfection 115-010
AAV5 plasmid (R/C rAAV5), 1 mg/mL in TE buffer Lake Pharma pCDAAV5-R/C
AAV5 plasmid (eGFP), 1 mg/mL in TE buffer Lake Pharma pCDAAV-CMV-eGFP
AAV5 plasmid (pHelper), 1 mg/mL in TE buffer Lake Pharma pCDAAV-Helper
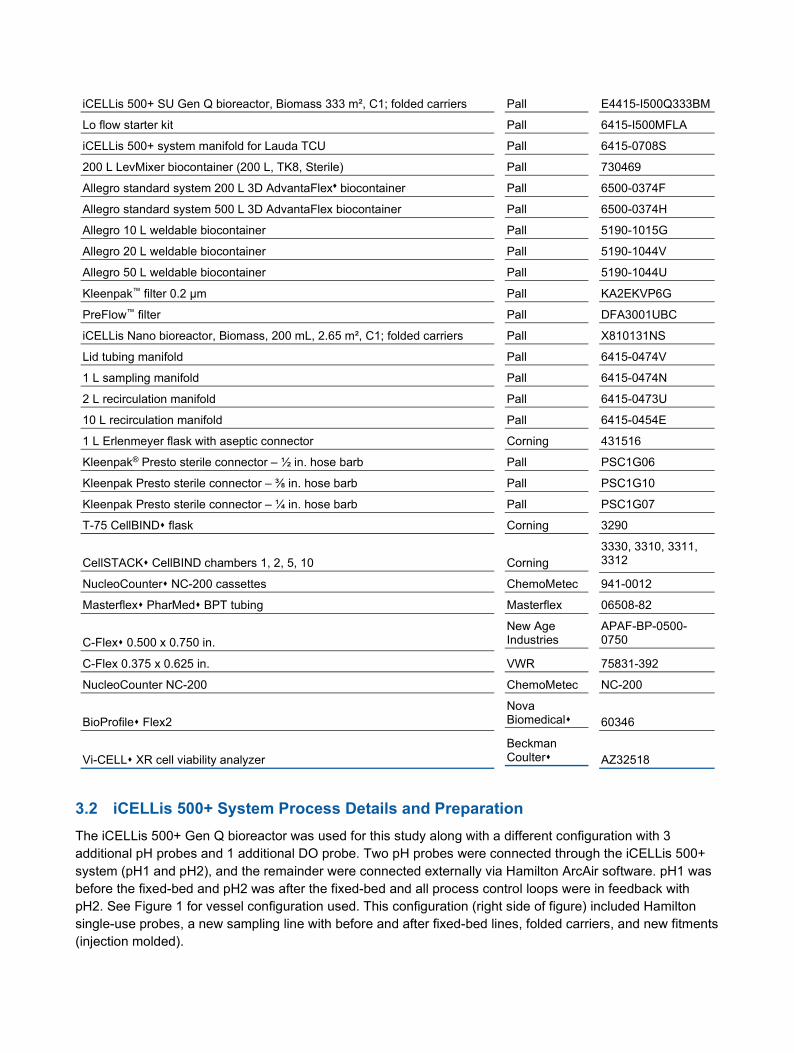
Table 2. iCELLis 500+ and iCELLis Nano bioreactor equipment
iCELLis 500+ and iCELLis Nano System Equipment Manufacturer Model/Part/Serial No.
iCELLis 500+ system (208 Vac, 60 Hz, 20 A; need 250 V 30 Amp input breaker)
Pall
ICL500CSSSIP
Lauda TCU RP 240 E (120 V, 60 Hz, 1.9 kW) Lauda T000037
iCELLis Nano bioreactor system Pall ICLNANOBRS
200 L LevMixer® system Pall LEV200JC420SLC
Arc USB cables Pall KSUH-00277
Arc Modul SU pH transmitter Pall KSUH-00275
Hamilton DO probe transmitter Hamilton 10078255
Hamilton ArcAir software Hamilton N/A
200 L Allegro™ collapsible plastic totes Pall LGRPTTE200L
500 L Allegro collapsible plastic totes Pall LGRPTTE500L
200 L Allegro plastic tote trolley Pall LGRPTRL200L
500 L Allegro plastic tote trolley Pall LGRPTRL500L
iCELLis 500+ SU Gen Q bioreactor, Biomass 333 m², C1; folded carriers Pall E4415-I500Q333BM
Lo flow starter kit Pall 6415-I500MFLA
iCELLis 500+ system manifold for Lauda TCU Pall 6415-0708S
200 L LevMixer biocontainer (200 L, TK8, Sterile) Pall 730469
Allegro standard system 200 L 3D AdvantaFlex♦ biocontainer Pall 6500-0374F
Allegro standard system 500 L 3D AdvantaFlex biocontainer Pall 6500-0374H
Allegro 10 L weldable biocontainer Pall 5190-1015G
Allegro 20 L weldable biocontainer Pall 5190-1044V
Allegro 50 L weldable biocontainer Pall 5190-1044U
Kleenpak™ filter 0.2 µm Pall KA2EKVP6G
PreFlow™ filter Pall DFA3001UBC
iCELLis Nano bioreactor, Biomass, 200 mL, 2.65 m², C1; folded carriers Pall X810131NS
Lid tubing manifold Pall 6415-0474V
1 L sampling manifold Pall 6415-0474N
2 L recirculation manifold Pall 6415-0473U
10 L recirculation manifold Pall 6415-0454E
1 L Erlenmeyer flask with aseptic connector Corning 431516
Kleenpak® Presto sterile connector – ½ in. hose barb Pall PSC1G06
Kleenpak Presto sterile connector – ⅜ in. hose barb Pall PSC1G10
Kleenpak Presto sterile connector – ¼ in. hose barb Pall PSC1G07
T-75 CellBIND flask Corning 3290
CellSTACK CellBIND chambers 1, 2, 5, 10
Corning
3330, 3310, 3311, 3312
NucleoCounter NC-200 cassettes ChemoMetec 941-0012
Masterflex PharMed BPT tubing Masterflex 06508-82
C-Flex 0.500 x 0.750 in.
New Age Industries
APAF-BP-0500-0750
C-Flex 0.375 x 0.625 in. VWR 75831-392
NucleoCounter NC-200 ChemoMetec NC-200
BioProfile Flex2
Nova Biomedical
60346
Vi-CELL XR cell viability analyzer
Beckman Coulter
AZ32518
3.2 iCELLis 500+ System Process Details and Preparation The iCELLis 500+ Gen Q bioreactor was used for this study along with a different configuration with 3 additional pH probes and 1 additional DO probe. Two pH probes were connected through the iCELLis 500+ system (pH1 and pH2), and the remainder were connected externally via Hamilton ArcAir software. pH1 was before the fixed-bed and pH2 was after the fixed-bed and all process control loops were in feedback with pH2. See Figure 1 for vessel configuration used. This configuration (right side of figure) included Hamilton single-use probes, a new sampling line with before and after fixed-bed lines, folded carriers, and new fitments (injection molded).

Figure 1.
iCELLis 500+ Gen Q bioreactor pH and DO mapping configuration. Right side is experimental configuration. Red text highlights internal additions to the consumable for testing.
For bioreactor set up, the pH proportional-integral-derivative (PID) settings were set with control on pH2 probe and DO PID settings were set to control on DO2 (both after fixed-bed). Temperature control was with Temp 1 probe. See Table 3 for all PID settings.
Table 3.
iCELLis 500+ bioreactor PID controls.
Sensor Variable Control P I D
pH Base Disabled 100 300 0
CO2 Enabled 600 2500 0
DO O2 Enabled 2.5 656 0
N2 Disabled 16.8 500 2
Feed in Pre-heater Enabled 4 300 0
Feed out Weight Enabled 5 20 10
Hamilton ArcAir software was used to monitor the additional pH and DO probes. The software was installed onto an external computer with 4 USB ports (3 for pH and 1 for DO). The Modbus addresses for each transmitter on the external PC ArcAir software were confirmed and an experiment was started on the software. The biomass probe reading was unreliable throughout the entire run so data was disregarded. An investigation is on-going to find the root-cause.
Cell culture growth medium was prepared in a 500 L tote and then sterile filtered using a Kleenpak 0.2 µm filter (KA2EKVP6G) into 500 L and 200 L 3D tote biocontainers for bioreactor fill and operation. All tote biocontainers had weldable tubing lines for ease of manipulation with filtration and bioreactor operation. For media conditioning, 69 L of DMEM + 10% FBS was added to the vessel using the bioreactor system load cell for a target linear speed of 1.3 cm/s, 0 cm falling film height, and stirring set point of 282 rpm. Active aeration was set to 95% air and 5% CO2 gas flow rates overnight with temperature control via the Lauda TCU unit and

double jacket. The feed in preheater biocontainer was used to preheat media in the recirculation loop prior to bioreactor addition. Prior to inoculation, pH and DO probes were recalibrated and regulation mode was set to ‘auto’ for media equilibration. The pH setpoint was 7.2 ± 0.2 and DO regulation setpoint was 50% with a total gas flow of 2 L/min for the entirety of the run.
3.3 iCELLis 500+ Bioreactor Inoculation and Growth Phase The iCELLis 500+ bioreactor and iCELLis Nano bioreactor with flatware controls were seeded at 5,000 cells/cm2. A total of 8 T-75 flasks and 4 CS10 chambers were used as flatware controls, which were incubated at 37 ºC and 5% CO2. Immediately prior to the iCELLis 500+ bioreactor inoculation, 24.5 L media was removed from the vessel into the recirculation tote to accommodate for the cell inoculum. Cell inoculum was added via gravity into the vessel through the Feed 2 line and target linear speed was 1.3 cm/s, with 0 cm falling film height, media volume of 69 L, and 282 rpm. Attachment kinetics showed 98% cell attachment after 1 hour, and recirculation was started after 4 hours of cell attachment. After cell attachment phase, the linear speed was reduced to 0.7 cm/s with a falling film height of 6 cm, media volume of 63 L, and 252 rpm. The recirculation loop was regulated using the feed out ‘REG VOLUME’ setting to regulate based on 63 L set volume with the feed in set to ‘rpm heat’. The set recirculation rate was 4 volumes a day (0.92 L/min) throughout the course of the run, which was initially started at a lower rate to allow for initial media warm-up. The total volume recirculated at one time was 333 L, which translated to 0.92 L/min and was below the limit for the pre-heater and TCU in order to maintain the desired temperature setpoint.
The overall media volume to surface area ratio was 0.2 mL/cm2 to total 666 L during the iCELLis 500+ bioreactor cell culture growth phase. For easier manipulation, a 500 L tote was used with 370 L of DMEM with 10% FBS media during the first 3 days. On the third day, the recirculation loop media was replaced with a new 500 L tote with 270 L DMEM with 10% FBS without draining the vessel. The bioreactor was sampled twice a day, once through the syringe port and once through the collection biocontainer. Each sampling time point included a before and after fixed-bed media collection. Samples were processed on a Nova bioanalyzer as well as an additional Mettler Toledo♦ pH meter. The pH output value from the after fixed-bed sample on the Nova bioanalyzer was used to calibrate all pH probes.
3.4 iCELLis 500+ Bioreactor Transfection Cells were grown for 5 days followed by an rAAV5 transient transfection at day 5 and cell culture harvest at day 6. Transfection and production were done in serum-free DMEM media at 0.1 mL/cm2 volume/surface area (V/S). Prior to transfection, a fast perfusion media exchange was performed to transition the bioreactor to a serum-free media condition. A 200 L LevMixer tote was filled with 170 L DMEM serum-free media via in-line sterile filtration and pre-heated to 37 ºC the day prior to transfection using a Lauda T2200 temperature control unit (TCU) set at 39 ºC and the LevMixer system was set to 100 rpm. Prior to perfusion, the feed in pump, DO, and pH controls were stopped, and air flow was left on at 2 L/min. The harvest line was used to drain, and then the feed in line pump direction was reversed to remove any serum containing medium from the line back into the recirculation tote. The 200 L perfusion tote was welded onto the feed in line while the bioreactor was drained to 20 L with agitation and temperature control off and then refilled with fresh serum-free DMEM to 63 L. Once at 63 L, agitation was resumed at 0.7 cm/s linear speed for 15 minutes to homogenize fresh media. After 15 minutes, perfusion was started with an ‘rpm’ feed in strategy at 320 rpm and ‘REG_FEEDIN’ feed out strategy at 1.0. The harvest line was used for perfusion to remove media after the fixed-bed. After perfusion, the new stirring set point was 1.3 cm/s and 282 rpm with 69 L and 0 cm falling film. Recirculation loop remained off.
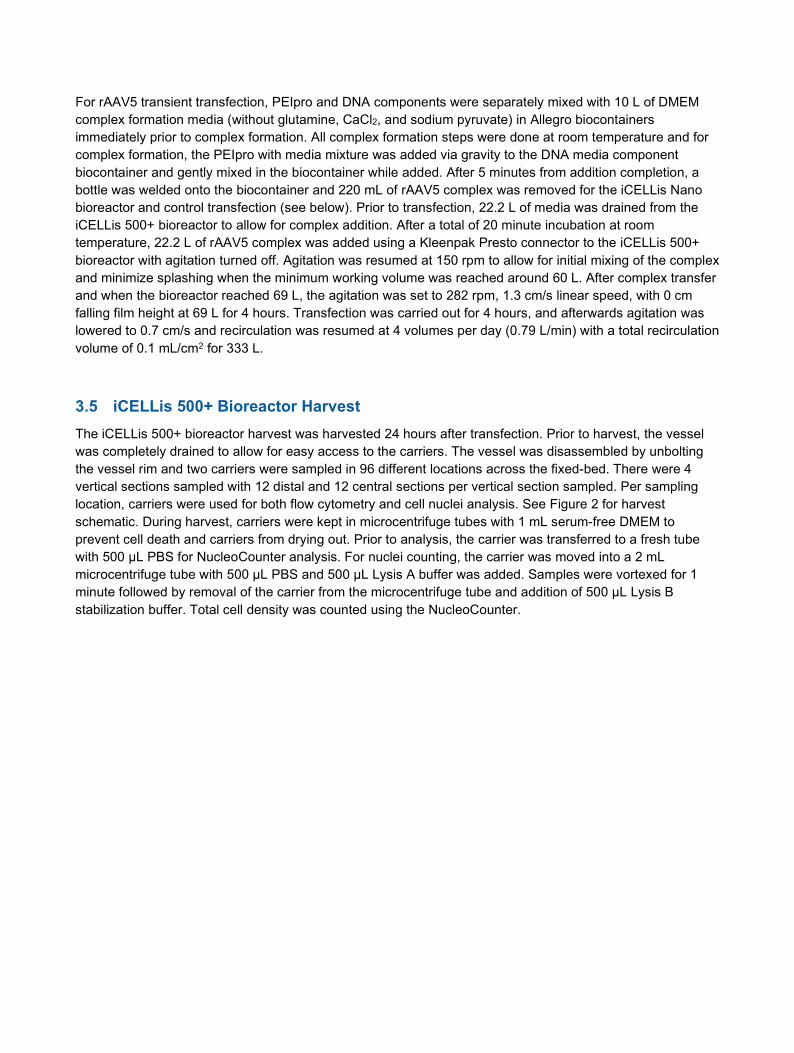
For rAAV5 transient transfection, PEIpro and DNA components were separately mixed with 10 L of DMEM complex formation media (without glutamine, CaCl2, and sodium pyruvate) in Allegro biocontainers immediately prior to complex formation. All complex formation steps were done at room temperature and for complex formation, the PEIpro with media mixture was added via gravity to the DNA media component biocontainer and gently mixed in the biocontainer while added. After 5 minutes from addition completion, a bottle was welded onto the biocontainer and 220 mL of rAAV5 complex was removed for the iCELLis Nano bioreactor and control transfection (see below). Prior to transfection, 22.2 L of media was drained from the iCELLis 500+ bioreactor to allow for complex addition. After a total of 20 minute incubation at room temperature, 22.2 L of rAAV5 complex was added using a Kleenpak Presto connector to the iCELLis 500+ bioreactor with agitation turned off. Agitation was resumed at 150 rpm to allow for initial mixing of the complex and minimize splashing when the minimum working volume was reached around 60 L. After complex transfer and when the bioreactor reached 69 L, the agitation was set to 282 rpm, 1.3 cm/s linear speed, with 0 cm falling film height at 69 L for 4 hours. Transfection was carried out for 4 hours, and afterwards agitation was lowered to 0.7 cm/s and recirculation was resumed at 4 volumes per day (0.79 L/min) with a total recirculation volume of 0.1 mL/cm2 for 333 L.
3.5 iCELLis 500+ Bioreactor Harvest The iCELLis 500+ bioreactor harvest was harvested 24 hours after transfection. Prior to harvest, the vessel was completely drained to allow for easy access to the carriers. The vessel was disassembled by unbolting the vessel rim and two carriers were sampled in 96 different locations across the fixed-bed. There were 4 vertical sections sampled with 12 distal and 12 central sections per vertical section sampled. Per sampling location, carriers were used for both flow cytometry and cell nuclei analysis. See Figure 2 for harvest schematic. During harvest, carriers were kept in microcentrifuge tubes with 1 mL serum-free DMEM to prevent cell death and carriers from drying out. Prior to analysis, the carrier was transferred to a fresh tube with 500 µL PBS for NucleoCounter analysis. For nuclei counting, the carrier was moved into a 2 mL microcentrifuge tube with 500 µL PBS and 500 µL Lysis A buffer was added. Samples were vortexed for 1 minute followed by removal of the carrier from the microcentrifuge tube and addition of 500 µL Lysis B stabilization buffer. Total cell density was counted using the NucleoCounter.

Figure 2.
iCELLis 500+ bioreactor carrier harvest method. BFB: Before Fixed-bed. AFB: After Fixed-bed.
3.6 iCELLis Nano Bioreactor Process The iCELLis Nano bioreactor was used as the iCELLis 500+ bioreactor control throughout the cell culture run. The PID parameters were based on previous experiments (Table 4). The biomass probe was used in the “custom” measurement mode with polarization correction “on”. Air was “on” at a constant flow rate of 30 mL/min.
Table 4.
iCELLis Nano bioreactor PID parameters.
Sensor P I D
pH (negative) 6,000 10,000 0
pH (positive) 280 100,000 0
DO 1.25 781 0
Temperature 40 2,000 0
3.7 iCELLis Nano Bioreactor Inoculation and Growth Phase The iCELLis Nano bioreactor and flatware controls (CS10 and T-75) were inoculated from the same cell pool seed train at 5,000 cells/cm2. The iCELLis Nano bioreactor was controlled with a pH setpoint of 7.2 ± 0.2 and DO regulation setpoint of 50% over the entire run with the manual air flow rate of 30 mL/min. A V/S of 0.2 mL/cm2 was used for both iCELLis Nano bioreactor and flatware controls during the growth phase. Flatware controls were kept at 5% CO2 and 37 ºC controlled humidified incubator. For inoculation, the iCELLis Nano bioreactor volume was 850 mL and agitation was 2 cm/s at 583 rpm for 4 hours with 90% of cell attachment after 2 hours. After 4 hours, agitation was decreased to 425 rpm and 1 cm/s linear speed. For the recirculation loop, 3.5 L (2.65 L + 0.85 L) DMEM + 10% FBS was recirculated for 3 days at a rate of 4 volumes per day. After 3 days, to mimic the iCELLis 500+ bioreactor cell culture, a new recirculation bottle was attached with 1.8 L DMEM + 10% FBS without draining the iCELLis Nano vessel. Sampling was done

each day, which included a bioreactor media sample and carrier sampling with cell counts (n=3). One CS10 was also sampled for media metabolites and a T-75 flask was harvested every day to monitor metabolites and cell growth.
3.8 iCELLis Nano Bioreactor Transfection and Harvest The iCELLis Nano bioreactor and controls were transfected at day 5 with a cell density of 123,000 cells/cm2. Prior to transfection, media was drained from the vessels and replaced with serum-free DMEM media. Transfection complex was from the bulk complex formation taken after the PEIpro and DNA mixed by gravity for 20 minutes. This rAAV5 complex was then added to a pre-existing volume in the iCELLis Nano bioreactor and transfection was carried out at 2 cm/s linear speed for 4 hours with no recirculation and a falling film height of 2 cm. After 4 hours, recirculation was resumed at 4 volumes per day with a new recirculation bottle with 2.25 L total volume in recirculation for 0.1 mL/cm2 V/S during the production phase. The iCELLis Nano bioreactor harvest was done 24 hours after transfection. Vessel was drained and carriers were sampled in 16 total sections according to Figure 3. There were 4 vertical sections and 4 sections per layer including 3 distal regions and one central region. All carrier processing was the same as the iCELLis 500+ bioreactor (see section 3.5).
Figure 3.
iCELLis Nano bioreactor harvest method
4 Results
4.1 iCELLis 500+ and iCELLis Nano Bioreactor Runs 4.1.1 iCELLis 500+ Bioreactor Cell Growth Curves and Cell Distribution
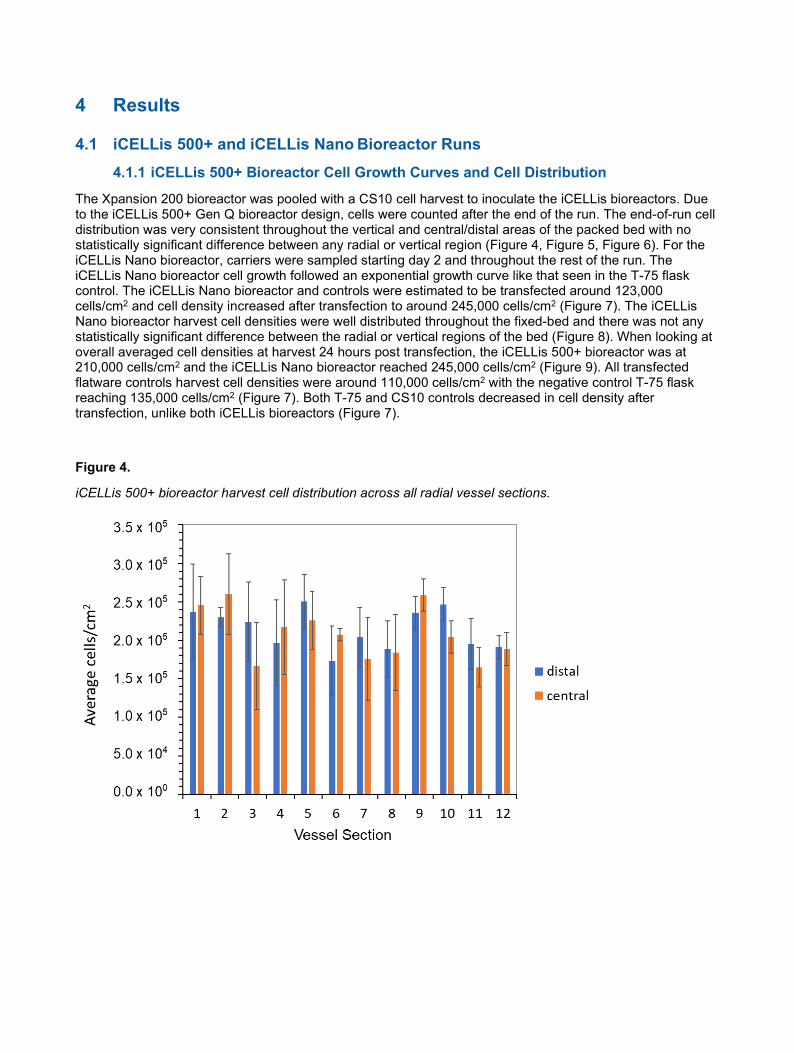
The Xpansion 200 bioreactor was pooled with a CS10 cell harvest to inoculate the iCELLis bioreactors. Due to the iCELLis 500+ Gen Q bioreactor design, cells were counted after the end of the run. The end-of-run cell distribution was very consistent throughout the vertical and central/distal areas of the packed bed with no statistically significant difference between any radial or vertical region (Figure 4, Figure 5, Figure 6). For the iCELLis Nano bioreactor, carriers were sampled starting day 2 and throughout the rest of the run. The iCELLis Nano bioreactor cell growth followed an exponential growth curve like that seen in the T-75 flask control. The iCELLis Nano bioreactor and controls were estimated to be transfected around 123,000 cells/cm2 and cell density increased after transfection to around 245,000 cells/cm2 (Figure 7). The iCELLis Nano bioreactor harvest cell densities were well distributed throughout the fixed-bed and there was not any statistically significant difference between the radial or vertical regions of the bed (Figure 8). When looking at overall averaged cell densities at harvest 24 hours post transfection, the iCELLis 500+ bioreactor was at 210,000 cells/cm2 and the iCELLis Nano bioreactor reached 245,000 cells/cm2 (Figure 9). All transfected flatware controls harvest cell densities were around 110,000 cells/cm2 with the negative control T-75 flask reaching 135,000 cells/cm2 (Figure 7). Both T-75 and CS10 controls decreased in cell density after transfection, unlike both iCELLis bioreactors (Figure 7).
Figure 4.
iCELLis 500+ bioreactor harvest cell distribution across all radial vessel sections.

Figure 5.
iCELLis 500+ bioreactor cell distribution between the central and distal sections of the bioreactor. Error bars are the standard deviation of the sample and represent 12 carriers per section average
Figure 6.
iCELLis 500+ bioreactor average harvest cell density across bed height. Error bars are average of 24 carriers per section

Figure 7.
iCELLis Nano bioreactor and control cell density. Day 5: transfection. iCELLis Nano bioreactor error bars are the average of 3 carriers per time point. Flatware error bars are from n=3 Vi-CELL measurements
Figure 8.
iCELLis Nano bioreactor average harvest cell density across bioreactor bed height. Error bars are from average of 4 carriers per section

Figure 9.
Cell harvest comparison between the iCELLis 500+ and iCELLis Nano bioreactors. Error bars represent average from all cell density measurements: iCELLis 500+ bioreactor (96), iCELLis Nano bioreactor (16)
4.1.2 iCELLis 500+ and iCELLis Nano Bioreactor Metabolite Analysis Glucose and lactate extracellular metabolites were very similar across all bioreactors. There was an observed increase in glucose concentration in the iCELLis 500+ bioreactor at day 3, but that was due to media recirculation tote exchange (Figure 10). Glucose levels in the bioreactor were also very similar between before and after fixed-bed locations, which indicates homogenous mixing of media within the vessel during the run. There was less than a 4% difference in glucose concentrations between before and after fixed-bed at day 5 after transfection and production state recirculation tote. For the day 5 sample after transfection, samples were taken 1 hour after the start of the recirculation tote so it is likely that the 0.14 g/L glucose difference between sampling locations is due to a non-equilibrated system. The system equilibrated overnight between day 5 and 6 and media glucose levels before harvest had a 0.02 g/L difference between before and after fixed-bed locations (Figure 10). Glucose concentration was also very similar between the iCELLis Nano bioreactor and flatware controls (Figure 10). Lactate profiles were similar between the iCELLis 500+
bioreactor, iCELLis Nano bioreactor, and controls. The iCELLis Nano bioreactor produced slightly lower lactate concentration during the start of the run, but overall production was the same as the iCELLis 500+ bioreactor and controls by the end of the run (Figure 11).

Figure 10.
Extracellular glucose concentrations in the iCELLis 500+ bioreactor, iCELLis Nano bioreactor, and controls
Figure 11.
Extracellular lactate concentrations in the iCELLis 500+ bioreactor, iCELLis Nano bioreactor, and controls
4.1.3 iCELLis 500+ Bioreactor pH Monitoring and iCELLis Nano Bioreactor pH Control Extra pH probes were installed along the vessel to determine the pH profile across various positions in the fixed-bed during a cell culture run. Locations included one pH probe before the fixed-bed in the center of the vessel and 4 pH probes after the fixed-bed, in two separate locations (Figure 1, Section 3.2). As seen in Figure 12, online pH values were very consistent for measurements after the fixed-bed (pH2-pH5). pH1 had inconsistent readings throughout the entire run and fluctuated between 7.4 ± 0.2 (Figure 12). It is most likely that foaming, normally generated at the level of this probe location, and other factors contributed to the pH1 before fixed-bed readings. There were also large pH fluctuations around day 5 (150 hours on x-axis of plot) (Figure 12), which corresponds with the vessel drain prior to media exchange, media perfusion, and transfection. There was a brief
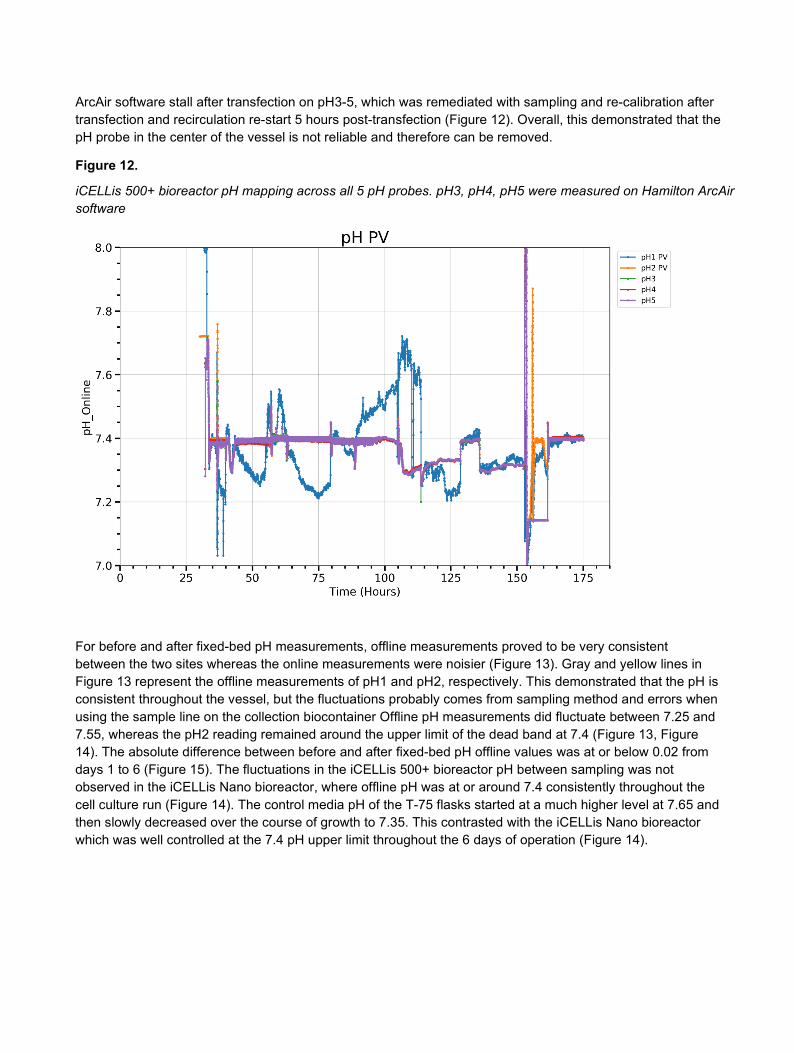
ArcAir software stall after transfection on pH3-5, which was remediated with sampling and re-calibration after transfection and recirculation re-start 5 hours post-transfection (Figure 12). Overall, this demonstrated that the pH probe in the center of the vessel is not reliable and therefore can be removed.
Figure 12.
iCELLis 500+ bioreactor pH mapping across all 5 pH probes. pH3, pH4, pH5 were measured on Hamilton ArcAir software
For before and after fixed-bed pH measurements, offline measurements proved to be very consistent between the two sites whereas the online measurements were noisier (Figure 13). Gray and yellow lines in Figure 13 represent the offline measurements of pH1 and pH2, respectively. This demonstrated that the pH is consistent throughout the vessel, but the fluctuations probably comes from sampling method and errors when using the sample line on the collection biocontainer Offline pH measurements did fluctuate between 7.25 and 7.55, whereas the pH2 reading remained around the upper limit of the dead band at 7.4 (Figure 13, Figure 14). The absolute difference between before and after fixed-bed pH offline values was at or below 0.02 from days 1 to 6 (Figure 15). The fluctuations in the iCELLis 500+ bioreactor pH between sampling was not observed in the iCELLis Nano bioreactor, where offline pH was at or around 7.4 consistently throughout the cell culture run (Figure 14). The control media pH of the T-75 flasks started at a much higher level at 7.65 and then slowly decreased over the course of growth to 7.35. This contrasted with the iCELLis Nano bioreactor which was well controlled at the 7.4 pH upper limit throughout the 6 days of operation (Figure 14).

Figure 13.
iCELLis 500+ bioreactor pH comparison between offline and online values
Figure 14.
iCELLis 500+ bioreactor, iCELLis Nano bioreactor, and controls offline pH measurements
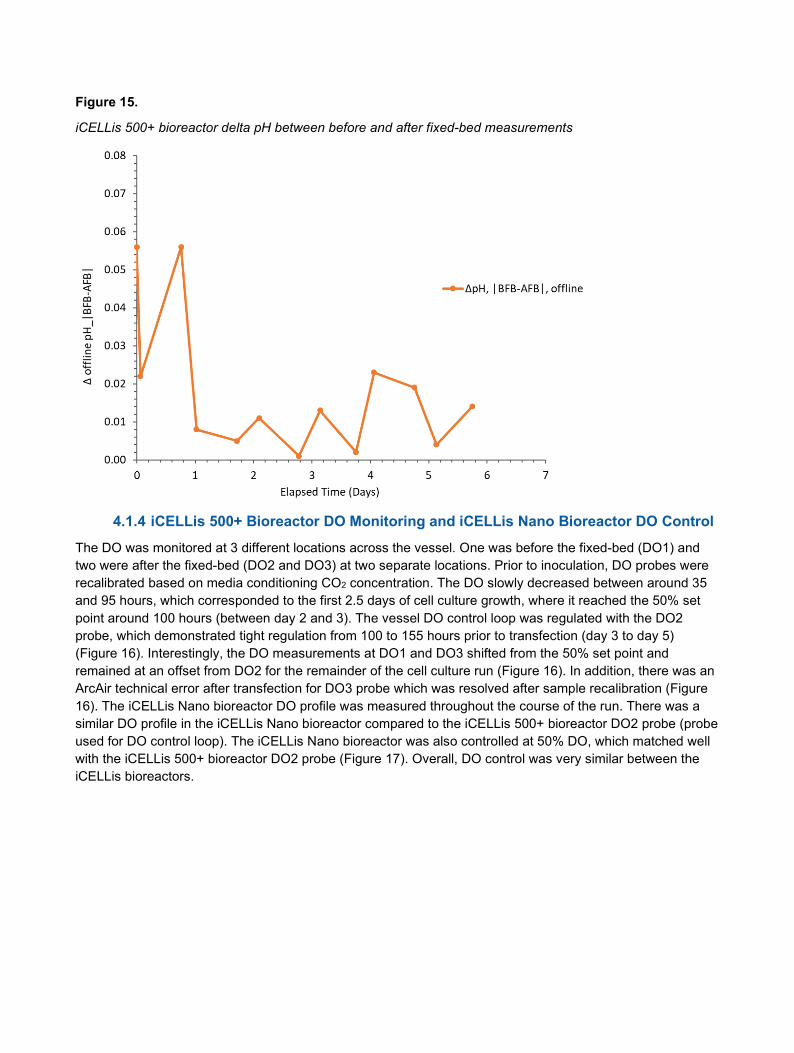
Figure 15.
iCELLis 500+ bioreactor delta pH between before and after fixed-bed measurements
4.1.4 iCELLis 500+ Bioreactor DO Monitoring and iCELLis Nano Bioreactor DO Control The DO was monitored at 3 different locations across the vessel. One was before the fixed-bed (DO1) and two were after the fixed-bed (DO2 and DO3) at two separate locations. Prior to inoculation, DO probes were recalibrated based on media conditioning CO2 concentration. The DO slowly decreased between around 35 and 95 hours, which corresponded to the first 2.5 days of cell culture growth, where it reached the 50% set point around 100 hours (between day 2 and 3). The vessel DO control loop was regulated with the DO2 probe, which demonstrated tight regulation from 100 to 155 hours prior to transfection (day 3 to day 5) (Figure 16). Interestingly, the DO measurements at DO1 and DO3 shifted from the 50% set point and remained at an offset from DO2 for the remainder of the cell culture run (Figure 16). In addition, there was an ArcAir technical error after transfection for DO3 probe which was resolved after sample recalibration (Figure 16). The iCELLis Nano bioreactor DO profile was measured throughout the course of the run. There was a similar DO profile in the iCELLis Nano bioreactor compared to the iCELLis 500+ bioreactor DO2 probe (probe used for DO control loop). The iCELLis Nano bioreactor was also controlled at 50% DO, which matched well with the iCELLis 500+ bioreactor DO2 probe (Figure 17). Overall, DO control was very similar between the iCELLis bioreactors.

Figure 16.
iCELLis 500+ bioreactor online dissolved oxygen profile. DO3 was measured on Hamilton ArcAir software. Red line is the 50% DO set point.
Figure 17. iCELLis 500+ bioreactor online dissolved oxygen readings at time of sample

5 Discussion
In this work, we demonstrated a successful iCELLis 500+ bioreactor cell culture run. Following the Xpansion 200 bioreactor harvest, the cells were pooled and used to inoculate an iCELLis 500+ bioreactor, an iCELLis Nano bioreactor, and several CS10 and T-75 flatware controls. Cells were grown for 5 days followed by rAAV5 transient transfection and production for 24 hours with a harvest at day 6. Both pH and DO were monitored at multiple sites around the iCELLis 500+ bioreactor. One main objective of this work was to determine the end-of-run cell distribution in the iCELLis 500+ Gen Q bioreactor. After 6 days, carrier cell distribution was homogenous in both the iCELLis 500+ and iCELLis Nano bioreactors with an even distribution of cells both radially and vertically. This demonstrated that the folded carriers were well distributed and packed within the bioreactor to allow for even distribution and attachment of cells throughout the fixed-bed. Additionally, based on inoculation via the Feed 2 line and a linear speed of 1.3 cm/s, cells were evenly distributed upon addition to the bioreactor that resulted in even cell distribution.
Extracellular metabolites were measured in all bioreactors and controls and measurements were very consistent between all bioreactors. In the iCELLis 500+ bioreactor, the glucose concentration differential between fixed-bed locations were less than 0.05 g/L throughout the entire run. One exception was after transfection and recirculation loop initiation, which was expected due to time needed to reach a steady state in the bioreactor. For example, the bioreactor was sampled one hour after recirculation, which resulted in a difference of 0.14 g/L between before and after bed locations. The recirculation loop was set to 4 volume recirculation per day, so one hour was not sufficient to reach media homeostasis within the vessel and the recirculation loop. For extracellular lactate concentrations, lactate profiles were also similar between the iCELLis bioreactors and controls. The iCELLis Nano bioreactor produced slightly lower lactate concentration during the start of the run, but overall production was the same as the iCELLis 500+ bioreactor and controls by the end of the run. This lower lactate production in the iCELLis Nano bioreactor in the first 3 days of culture may be the result of scale down and less stress of the cells during the inoculation and attachment phases.
The cell growth medium pH was monitored through both online and offline measurements at 5 different locations across the vessel. Online measurements demonstrated variability and inaccuracy of the pH probe before the fixed-bed. This was most likely due to the foam accumulation and loss of proper contact of the probes with the media in the center of the vessel before the fixed-bed. The offline pH measurements for before and after fixed-bed locations were very consistent with each other and were generally within 0.02 pH value. Both verifications support the new location of pH1 probe on the iCELLis 500+ bioreactor. Like previous observations, the pH of cell culture control flasks at 5% CO2 start at a higher pH (7.6) and the pH slowly drifts downward over time. It is possible that increasing the pH dead bands in the iCELLis bioreactors to better mimic the flatware controls would increase overall cell growth in the bioreactor. Further studies are needed to understand the impact of elevated CO2 levels and cell growth.
In addition to the pH monitoring, DO was also monitored across 3 different locations of the iCELLis 500+ bioreactor. These included one before the fixed-bed and two after the fixed-bed. In the iCELLis 500+ bioreactor, there was a difference in all 3 DO probe readings once the bioreactor needed to control at 50% DO. In this evaluation, it would be understandable to register a gap between DO1 (before fixed-bed) and DO2/DO3 (after fixed-bed). One cause for varied DO values across the fixed-bed is uneven cell distribution; however, our results demonstrate a homogenous distribution of cells in the bioreactor. The gap between the DO2 and DO3 after fixed-bed probes needs further investigation.
6 Conclusions
Overall, these results demonstrate a successful iCELLis 500+ Gen Q bioreactor cell culture run. The iCELLis 500+ low compaction bioreactor with folded carriers cell culture test demonstrated that there was even cell distribution during inoculation of the bioreactor, which resulted in homogenous cell distribution throughout the run. Glucose consumption and lactate production were also similar between the iCELLis 500+ and iCELLis Nano bioreactors. The pH monitoring results showed a well-mixed system with consistent pH control before and after the fixed-bed. These results demonstrate that the iCELLis Nano bioreactor process is indeed scalable for cell growth to the iCELLis 500+ bioreactor and that the iCELLis 500+ bioreactor results in a homogenous cell growth with uniform media pH and metabolites throughout the fixed-bed. This data upholds that recent design changes implemented on the iCELLis 500+ Gen Q bioreactor are suitable to become the main standard after launch of the iCELLis 500+ Gen R bioreactor.
7 Perspectives
The iCELLis 500+ bioreactor had homogenous cell distribution, which resulted in a harvest cell density of 210,000 cells/cm2 after 6 days of growth. Through pH and DO monitoring, we demonstrated that there were consistent media pH values before and after the fixed-bed. The relative DO profile across the vessel showed lower DO after the fixed-bed and further studies are needed to understand this phenomenon. Overall, the DO regulation was tight for the entirety of the run.
There are several iCELLis 500+ bioreactor considerations for future cell culture runs including preparation and operation. For preparation, we suggest using Kleenpak Presto connectors on biocontainers and for all preparation and operational procedures, with minimum tubing ID of ⅜ inch. This wider inner tubing diameter will allow for faster flow into the bioreactor (inoculation, transfection complex, etc.). During operation, we noticed a decrease in temperature after the initial start of any recirculation tote. To avoid this in the future, it should be advised to use a double jacketed recirculation tote to allow for more uniform temperature control in the vessel and tote.
Visit us on the Web at www.pall.com/biotech Contact us at www.pall.com/contact
Corporate Headquarters Port Washington, NY, USA +1.800.717.7255 toll free (USA)+1.516.484.5400 phone
European Headquarters Fribourg, Switzerland +41 (0)26 350 53 00 phone
Asia-Pacific Headquarters Singapore +65 6389 6500 phone
International Offices Pall Corporation has offices and plants throughout the world in locations such as: Argentina, Australia, Austria, Belgium, Brazil, Canada, China, France, Germany, India, Indonesia, Ireland, Italy, Japan, Korea, Malaysia, Mexico, the Netherlands, New Zealand, Norway, Poland, Puerto Rico, Russia, Singapore, South Africa, Spain, Sweden, Switzerland, Taiwan, Thailand, the United Kingdom, the United States, and Venezuela. Distributors in all major industrial areas of the world. To locate the Pall office or distributor nearest you, visit www. Pall.com/contact.
The information provided in this literature was reviewed for accuracy at the time of publication. Product data may be subject to change without notice. For current information consult your local Pall distributor or contact Pall directly.
© 2020 Pall Corporation. The Pall logo, Pall, Allegro, iCELLis, Kleenpak, PreFlow, LevMixer and Xpansion are trademarks of Pall Corporation. ® indicates a trademark registered in the USA and ™ indicates a common law trademark. Filtration. Separation. Solution is a service mark of Pall Corporation. ♦ArcAir is a trademark of Hamilton Company, TrypLE is a trademark of Life Technologies Corporation, GlutaMAX and Thermo Fisher are trademarks of Thermo Fisher Scientific, PEIpro and Polyplus Transfection are trademarks of Polyplus Transfection SA, CellBIND & CellSTACK are trademarks of Corning Incorporated, NucleoCounter is a trademark of ChemoMetec A/S, PharMED & C-Flex are trademarks of Saint-Gobain Corporation, Bioprofile Flex2 and Nova Biomedical are trademarks of Nova Biomedical Corporation, VWR is a trademark of VWR International LLC, Lake Pharma is a trademark of LakePharma Holdings Inc, AdvantaFlex is a trademark of New Age IndustriesInc., Masterflex PharMed is a trademark of Cole-Parmer Instrument Company LLC, Beckman Coulter is a trademark of Beckman Coulter Inc., Lauda is a trademark of LAUDA DR. R. WOBSER GMBH & CO. KG and Mettler Toledo is a trademark of Mettler Toledo GmbH LLC
9/20, PDF, GN20-07633 USD3404