icesat’s new perspective on ice shelf rifts: the...
TRANSCRIPT
ICESat’s new perspective on ice shelf rifts: The vertical dimension
H. A. Fricker, J. N. Bassis, and B. MinsterInstitute of Geophysics and Planetary Physics, Scripps Institution of Oceanography, La Jolla, California, USA
D. R. MacAyealDepartment of Geophysical Sciences, University of Chicago, Chicago, Illinois, USA
Received 28 October 2005; accepted 28 October 2005; published 1 December 2005.
[1] The small footprint (�70 m) and �172 m along-track spacing of the Geoscience Laser Altimeter System(GLAS) on the Ice, Cloud and land Elevation Satellite(ICESat) provides unprecedented horizontal resolution fora satellite altimeter. This enables ICESat to map manypreviously unresolved features on ice shelves, such ascrevasses, rifts, grounding zones and ice fronts. Wepresent examples of ICESat-derived elevation datashowing topography over rifts on the Amery and Rossice shelves, widths of rifts and as estimates of thethickness of melange (a collection of ice and snowtrapped inside the rifts). We show that melange thicknessremains constant over the ICESat data period and tends tobe thicker in older rifts. We validate the ICESat-derivedmelange depth estimate with an in situ measurement on theRoss Ice Shelf. Citation: Fricker, H. A., J. N. Bassis, B. Minster,
and D. R. MacAyeal (2005), ICESat’s new perspective on ice shelf
rifts: The vertical dimension, Geophys. Res. Lett., 32, L23S08,
doi:10.1029/2005GL025070.
1. Introduction
[2] Satellite radar altimeters (RA) have vastly improvedour knowledge of Antarctic ice sheet surface topography,with the ERS and Envisat RA’s providing data since 1991.Launched in January 2003, ICESat, carries the first laseraltimeter to operate in a polar orbit, and started a new era inice sheet altimetry. GLAS has higher accuracy, along-trackresolution and improved tracking over ice than the ERS/Envisat RAs. It also provides coverage to 86�S (cf. 81.5�S),which includes all of the Antarctic ice shelves. The in-creased resolution, tracking and coverage means that‘‘small-scale’’ features of ice shelves, e.g., rifts, ice frontsand grounding zones, can be studied for the first time withsatellite altimetry. Previous RA studies tend to neglect thesefeatures, because the data are typically averaged over largeareas, and because the large RA footprint (�2–3 km overice does not resolve such small features. ICESat’s highalong-track resolution (�65 m footprint and �172 mspacing) reveals exquisite topographic detail over featuressuch as crevasses, through-cutting rifts, ice shelf margins,ice fronts, icebergs and grounding zones. In this paper wefocus on rifts; another paper in this Special Section consid-ers icebergs [Scambos et al., 2005]. We present ICESatprofiles over a selection of rifts in Antarctica, and use thedata to estimate the melange thickness. This is a novelapplication of altimeter data over ice shelves, which dem-
onstrates the powerful capability of ICESat for monitoringfeatures that are too small to be resolved by other altimetrysystems.
2. Ice Shelf Rifts
[3] Rifts in Antarctic ice shelves are fractures that pen-etrate the full ice shelf thickness. Satellite imagery enablesus to examine the surface expressions of rifts. Some rifts areformed centuries earlier at locations far upstream and thenare advected toward the ice front. Such ‘‘relic’’ rifts mayprovide an important fingerprint of past ice shelf conditions[Fahnestock et al., 2000]. These rifts have often becomeinactive and have slowed or stopped propagating completelyby the time they reach the ice shelf front. Other rifts arebelieved to have initiated in the recent past in response tohigh glaciological stresses at the ice shelf front [Joughinand MacAyeal, 2005; Bassis et al., 2005]. These riftspropagate and can eventually form the detachment bound-aries for the calving of large tabular icebergs. Rift propa-gation rates on the Amery Ice Shelf have been shown to beseasonal [Fricker et al., 2005] indicating that it is possiblethat they might be sensitive to a changing climate. Rifts aretypically filled with a collection of different ice types calledice melange [MacAyeal et al., 1998], which several authorshave suggested may play an important role in controllingpropagation rates [e.g., Larour et al., 2004; Bassis et al.,2005; Hulbe et al., 1998]. However, its exact role isunknown, and little is known about its composition andproperties, especially how it effects rift propagation. Someauthors have suggested that melange acts as a glue whichholds the rift walls together and resists further propagation[Larour et al., 2004; Hulbe et al., 1998], while others havesuggested that the blocks of ice which fall into the rift are acomponent of the driving stresses, wedging the rift open[Bassis et al., 2005].
3. ICESat Data
[4] We used ICESat data from the 91-day repeat phases:Laser 2a, 10/04/03–11/18/03 (Release 21); Laser 2b, 02/17/2004–03/21/2004 (Release 16); Laser 2c: 05/18/04–06/21/04 (Release 17); Laser 3a, 10/03/04–11/08/04 (Release 18);Laser 3b, 02/17/05–03/22/05 (Release 19). We combineddata from the GLA01 Global Altimetry Data Product, theGLA05 Global Waveform-based Range Corrections DataProduct and the GLA12 Antarctic and Greenland Ice SheetData Product.[5] No data filtering—i.e., no rejection of data records—
for clouds was performed since we wished to retain infor-
GEOPHYSICAL RESEARCH LETTERS, VOL. 32, L23S08, doi:10.1029/2005GL025070, 2005
Copyright 2005 by the American Geophysical Union.0094-8276/05/2005GL025070$05.00
L23S08 1 of 5
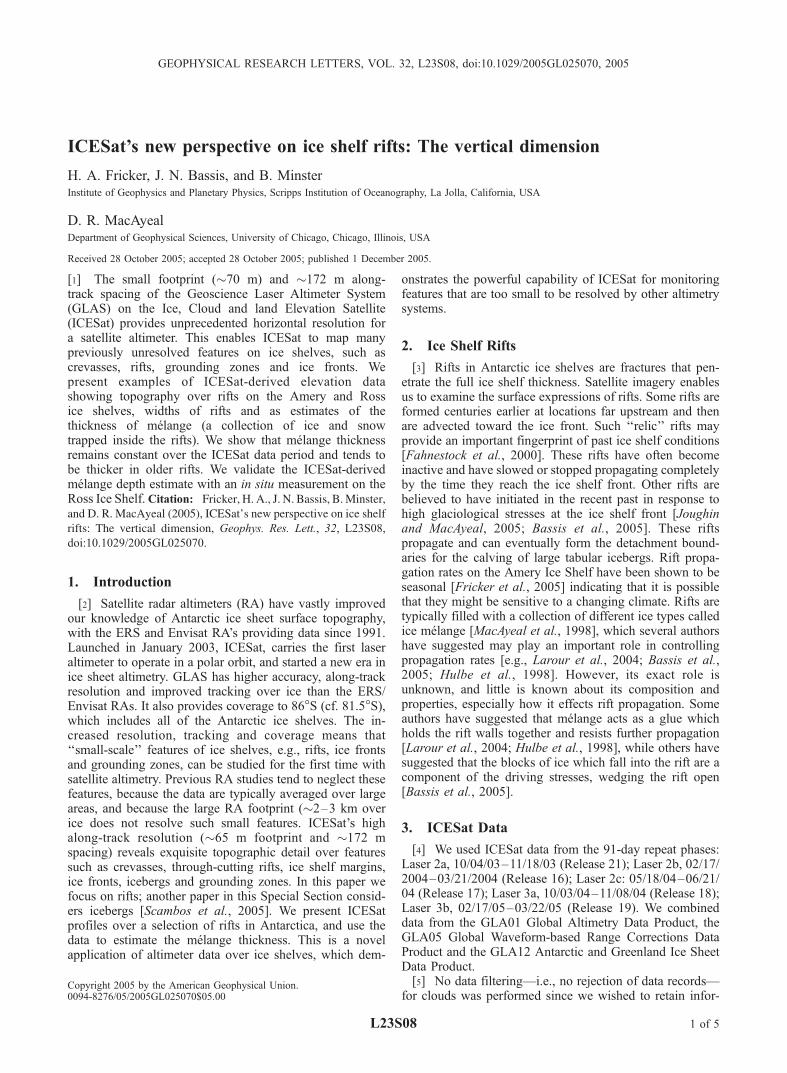
mation over rough surfaces, and we found that the filtersused by Smith et al. [2005] removed many of these data. Inthe ‘‘standard fit’’ process used to estimate the GLA12elevation, the elevation corresponds to the centroid of aGaussian fit to the return pulse (Figure 1a). Across most ofthe ice shelves there is only one peak in the return pulse,giving an unambiguous estimation of the elevation. Acrossrifts and other complex surfaces, multiple reflecting surfaceswithin the GLAS footprint yield multiple peaks in the returnpulse (Figure 1b). In such cases, an ‘‘alternate’’ fit with upto six Gaussians is used to estimate the set of elevationswithin the footprint, and these fits can provide validinformation about the small-scale topography with wave-length smaller than the footprint diameter. The alternate fitdata are given in GLA05, however, they are known tocontain errors in Release 18 and lower, so were notavailable for Laser 2b, Laser 2c or Laser 3a at the time ofwriting.
4. Study Regions
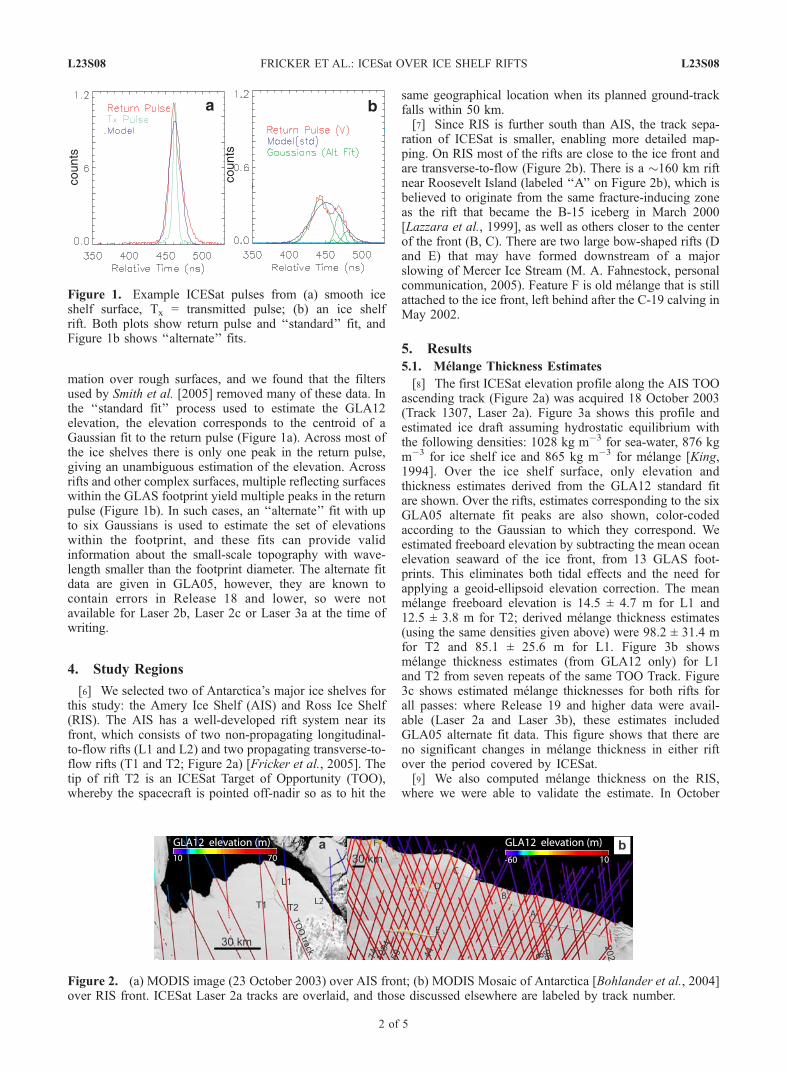
[6] We selected two of Antarctica’s major ice shelves forthis study: the Amery Ice Shelf (AIS) and Ross Ice Shelf(RIS). The AIS has a well-developed rift system near itsfront, which consists of two non-propagating longitudinal-to-flow rifts (L1 and L2) and two propagating transverse-to-flow rifts (T1 and T2; Figure 2a) [Fricker et al., 2005]. Thetip of rift T2 is an ICESat Target of Opportunity (TOO),whereby the spacecraft is pointed off-nadir so as to hit the
same geographical location when its planned ground-trackfalls within 50 km.[7] Since RIS is further south than AIS, the track sepa-
ration of ICESat is smaller, enabling more detailed map-ping. On RIS most of the rifts are close to the ice front andare transverse-to-flow (Figure 2b). There is a �160 km riftnear Roosevelt Island (labeled ‘‘A’’ on Figure 2b), which isbelieved to originate from the same fracture-inducing zoneas the rift that became the B-15 iceberg in March 2000[Lazzara et al., 1999], as well as others closer to the centerof the front (B, C). There are two large bow-shaped rifts (Dand E) that may have formed downstream of a majorslowing of Mercer Ice Stream (M. A. Fahnestock, personalcommunication, 2005). Feature F is old melange that is stillattached to the ice front, left behind after the C-19 calving inMay 2002.
5. Results
5.1. Melange Thickness Estimates
[8] The first ICESat elevation profile along the AIS TOOascending track (Figure 2a) was acquired 18 October 2003(Track 1307, Laser 2a). Figure 3a shows this profile andestimated ice draft assuming hydrostatic equilibrium withthe following densities: 1028 kg m�3 for sea-water, 876 kgm�3 for ice shelf ice and 865 kg m�3 for melange [King,1994]. Over the ice shelf surface, only elevation andthickness estimates derived from the GLA12 standard fitare shown. Over the rifts, estimates corresponding to the sixGLA05 alternate fit peaks are also shown, color-codedaccording to the Gaussian to which they correspond. Weestimated freeboard elevation by subtracting the mean oceanelevation seaward of the ice front, from 13 GLAS foot-prints. This eliminates both tidal effects and the need forapplying a geoid-ellipsoid elevation correction. The meanmelange freeboard elevation is 14.5 ± 4.7 m for L1 and12.5 ± 3.8 m for T2; derived melange thickness estimates(using the same densities given above) were 98.2 ± 31.4 mfor T2 and 85.1 ± 25.6 m for L1. Figure 3b showsmelange thickness estimates (from GLA12 only) for L1and T2 from seven repeats of the same TOO Track. Figure3c shows estimated melange thicknesses for both rifts forall passes: where Release 19 and higher data were avail-able (Laser 2a and Laser 3b), these estimates includedGLA05 alternate fit data. This figure shows that there areno significant changes in melange thickness in either riftover the period covered by ICESat.[9] We also computed melange thickness on the RIS,
where we were able to validate the estimate. In October
Figure 1. Example ICESat pulses from (a) smooth iceshelf surface, Tx = transmitted pulse; (b) an ice shelfrift. Both plots show return pulse and ‘‘standard’’ fit, andFigure 1b shows ‘‘alternate’’ fits.
Figure 2. (a) MODIS image (23 October 2003) over AIS front; (b) MODIS Mosaic of Antarctica [Bohlander et al., 2004]over RIS front. ICESat Laser 2a tracks are overlaid, and those discussed elsewhere are labeled by track number.
L23S08 FRICKER ET AL.: ICESat OVER ICE SHELF RIFTS L23S08
2 of 5

2004, a field party to the RIS rift E dropped and marked aclimbing rope inside the rift at the location of ICESat Track1288, 10 days after ICESat had acquired data along thistrack during Laser 3a (Figure 3a, at the location of label‘‘C’’). The estimate of the rift depth using the climbing ropewas 30.6 m and the estimate from ICESat (GLA12) was29.3 m, a remarkable agreement considering the relativedifferences and difficulties of the two measurementapproaches.
5.2. Rift Widening
[10] Repeats across rift T2 suggest evidence of riftwidening (Figure 3d). Here, the x-axis is perpendiculardistance across the rift, projected onto the normal to therift; the distance between ICESat points in this projection is�30 m. Ice motion has been removed to align each plot. On18 October 2003 two pulses reflected from inside the rift,suggesting a width of �90 m. On 28 February 2005 eightpulses (two of them were invalid) inside the rift suggests awidth of �270 m. Some of this widening is due to advectionof the rift downstream between passes. To estimate thiscontribution, we used ice velocities determined by GPSduring a 2002–2003 field campaign [Bassis et al., 2005] tosubtract the distance the rift had moved between each pass.By plotting these ‘‘ice-velocity-corrected’’ tracks on aMODIS image from 23 October 2003, we were able toestimate the width of the rift at the intersection point foreach pass (Figure 3e). From the MODIS widths, weestimate that the apparent change in rift width due to thetrack intersecting the rift at different locations is approxi-mately 26 cm/day (97 m/yr). The opening rate calculated
from the ICESat data is 31 cm/day (114 m/yr), therefore webelieve that part of the signal we observe is true riftwidening. The resultant opening rate of 18 m/yr is an orderof magnitude smaller than opening rates reported for rifts onRoss Ice Shelf near Roosevelt Island (150–250 m/yr),observed SAR imagery by Joughin and MacAyeal [2005].This is most likely because we are measuring the widthsvery close to the rift tip, where the widening is at itssmallest. We also see evidence of rift widening in repeatprofiles across rifts on RIS (e.g., Track 44, Figure 4e; seeFigure 2b for location).
5.3. Rift Topography
[11] Another feature of rifts that ICESat is able to resolveis the topography of the rift flanks. For example, a profileacross rift T2 reveals uplift on both sides (Figure 3a), whichis asymmetrical such that the northern (seaward) side ishigher in elevation than the southern (landward) side. Thiselevation difference is consistent with observations made inthe field in January 2003, when a 1–2 m elevation offset onthe northern side of T2 was noted. The repeat TOO passesof T2 show that as the rift propagates the topography alongthe rift changes, e.g., in the 28 February 2005 profile, thetopography on the southern rift flank has become gentlysloped. Similar topography across the rift flanks is seen onRIS. Figure 4a shows stacked profiles across rift A. Thespatial pattern of the structure of the rift flank topographyshows that the asymmetry is largest at a distance of 2–3 kmfrom the rift tip. Near the center of the rift both sides aretypically uplifted by similar amounts. We propose that theobserved uplift is related to the rifting process but is
Figure 3. (a) ICESat elevation profile along Laser 2a TOO track; (b) repeat passes of AIS TOO track, with estimatedmelange thicknesses; (c) time series of melange thicknesses for T2 and L1; (d) T2 rift opening; (e) ICESat vs MODISwidths for T2.
L23S08 FRICKER ET AL.: ICESat OVER ICE SHELF RIFTS L23S08
3 of 5

obscured over time by other processes (e.g., snow driftbuild-up, erosion and ice-shelf talus infall). The topographyacross relic rifts D and E supports this theory: profilesacross the rifts walls show a steepening on both sides intothe rift with some uplift on the northern side (Figures 4b, 4cand 4d). This implies that the topography across a rift mighttell us about the age and recent activity of the rift, inaddition to being an indicator of the mechanical processof rifting.[12] As an example of how extensively features can be
mapped on RIS, a three-dimensional (3-D) rendition of thetopography across rifts D and E is shown in Figure 4c. Anindividual profile across these rifts (Figure 4e; Track 1294;
see Figure 2b for location) reveals an asymmetry in theshape of the melange trapped inside them, and also showthat the melange in the older, downstream rift is substan-tially thicker (�204 m vs. �150 m). We believe that the topsurface of melange in these rifts is due to wind-blown snow,and that its surface pattern is asymmetric because snow isprimarily deposited on the windward side. Near the centerof Rift E there is a change in the sense of the asymmetry(Figure 4e; Track 59; see Figure 2b for location), which ispossibly due to the presence of two smaller rifts upstream,into which wind-blown snow gets deposited first (seeFigure 2). The residual melange platform from the C-15calving (F in Figure 2b) is indicated in Figure 4c. Alsoevident in this figure is a significant slope towards the RISfront, which is a likely due to local basal melting along thefront of the ice shelf [Jenkins and Doake, 1991].
6. Summary
[13] We have demonstrated the unique capability of theGLAS instrument on ICESat to provide topographic infor-mation over features that are too small to be visible withprevious altimeter instruments: ice shelf rifts. For the firsttime we are able to study in detail the topographic form ofice shelf rifts using satellite altimeter data. Since ice shelfrifting is a 3-D process it is important to gather both verticaland lateral information: ICESat combined with other satel-lite imagery provides this critical 3-D information. ICESatalso allows us to make measurements of the thickness ofmelange filling rifts, a potentially an important factor in iceshelf rifting. Rifts may be sensitive indicators of climatechange and ice dynamics, therefore monitoring them is animportant part of ice sheet change detection.
[14] Acknowledgments. This work was supported by NASA contractNAS5-99006 and NSF grant OPP-0337838. We thank NASA’s ICESatScience Project and the NSIDC for distribution of the ICESat data, seehttp://icesat.gsfc.nasa.gov and http://nsidc.org/data/icesat. We would like toacknowledge J. DiMarzio, D. Hancock, K. Barbieri, D. Harding, J. Saba, A.Borsa, C. Shuman, V. Suchdeo, R. Coleman, T. Scambos, M Fahnestockand R. Warner for helpful input. Our sincere thanks to K. Brunt, B. Brunnerand L. Littrel (latter two being part of the Raytheon Polar Services fieldsafety team) and rest of the Ross Ice Shelf 2003 field team. Fieldworksupported by NSF OPP-0229546.
ReferencesBassis, J. N., R. Coleman, H. A. Fricker, and J. B. Minster (2005), Episodicpropagation of a rift on the Amery Ice Shelf, East Antarctica, Geophys.Res. Lett., 32(6), L06502, doi:10.1029/2004GL022048.
Bohlander, J., T. Scambos, T. Haran, and M. Fahnestock (2004), A newMODIS-based mosaic of Antarctica: MOA, Eos Trans. AGU, 85(47), FallMeet. Suppl., Abstract C31B-0319.
Fahnestock, M. A., T. A. Scambos, R. A. Bindschadler, and G. Kvaran(2000), A millenium of variable ice flow recorded by the Ross Ice Shelf,Antarctica, J. Glaciol., 46, 652–664.
Fricker, H. A., N. W. Young, R. Coleman, J. N. Bassis, and J.-B. Minster(2005), Multi-year monitoring of rift propagation on Amery Ice Shelf,East Antarctica, Geophys. Res. Lett., 32(2), L02502, doi:10.1029/2004GL021036.
Hulbe, C. L., E. Rignot, and D. R. MacAyeal (1998), Comparison of ice-shelf creep flow simulations with ice-front motion of Filchner-Ronne IceShelf, Antarctica, detected by SAR interferometry, Ann. Glaciol., 27,182–186.
Jenkins, A., and C. S. M. Doake (1991), Ice-ocean interaction on Ronne IceShelf, Antarctica, J. Geophys. Res., 96, 791–813.
Joughin, I., and D. R. MacAyeal (2005), Calving of large tabular icebergsfrom ice shelf rift systems, Geophys. Res. Lett., 32, L02501, doi:10.1029/2004GL020978.
King, E. C. (1994), Observations of a rift in the Ronne Ice Shelf, Antarc-tica, J. Glaciol., 40, 187–189.
Figure 4. (a) ICESat Laser 2a profiles across a) Rift A(active) and (b) Rift E (relic) - adjacent profiles are offset by10 m in elevation and first and last profiles are labeled bytrack number (see Figure 2b); (c) Laser 3a and 3a profilesacross Rift C; (d) Laser 2a profiles across Rifts D and E andice front; (e) Laser 3c profiles across Rifts E and D (seeFigure 2b).
L23S08 FRICKER ET AL.: ICESat OVER ICE SHELF RIFTS L23S08
4 of 5

Larour, E., E. Rignot, and D. Aubry (2004), Modelling of rift propagationon Ronne Ice Shelf, Antarctica, and sensitivity to climate change, Geo-phys. Res. Lett., 31, L16404, doi:10.1029/2004GL020077.
Lazzara, M. A., K. C. Jezek, T. A. Scambos, D. R. MacAyeal, and C. J. vander Veen (1999), On the recent calving of icebergs from the Ross IceShelf, Polar Geogr., 23, 201–212.
MacAyeal, D. R., E. Rignot, and C. Hulbe (1998), Ice shelf dynamics nearthe front of the Filchner Ronne Ice Shelf, East Antarctica, revealed bySAR interferometry: Model/interferogram comparison, J. Glaciol., 44,419–428.
Scambos, T., O. Sergienko, A. Sargent, D. MacAyeal, and J. Fastook(2005), ICESat profiles of tabular iceberg margins and iceberg breakup
at low latitudes, Geophys. Res. Lett., 32, L23S09, doi:10.1029/2005GL023802.
Smith, B. E., C. R. Bentley, and C. F. Raymond (2005), Recent elevationchanges on the ice streams and ridges of the Ross Embayment from ICESatcrossovers,Geophys. Res. Lett., 32, L21S09, doi:10.1029/2005GL024365.
�����������������������J. N. Bassis, H. A. Fricker, and B. Minster, IGPP, Scripps Institution of
Oceanography, La Jolla, CA 92093, USA. ([email protected])D. R. MacAyeal, Department of Geophysical Sciences, University of
Chicago, Chicago, IL 60637, USA.
L23S08 FRICKER ET AL.: ICESat OVER ICE SHELF RIFTS L23S08
5 of 5