icheme sustainability metrics
DESCRIPTION
IChemE Sustainability MetricsTRANSCRIPT

T H E S U S T A I N A B I L I T Y M E T R I C S
i n s t i t u t i o n o f c h e m i c a l e n g i n e e r s
S u s t a i n a b l e D e v e l o p m e n t P r o g r e s s M e t r i c sr e c o m m e n d e d f o r u s e
i n t h e P r o c e s s I n d u s t r i e s

I C H E M E S U S T A I N A B L E D E V E L O P M E N T P R O G R E S S M E T R I C S 1
F O R E W O R D
I am pleased that the IChemE Sustainable Development Progress Metrics are now ready for issue. The
document is the result of three years work and debate by a number of individuals drawn from industry,
academia and consultancy. The people on the attached list deserve all our thanks for their contributions
and particularly their perseverance.
The emphasis in our work has been to produce a practical tool for practicing engineers using as far as
possible information already available. Our aim has also been to develop a wider understanding of
sustainability within the process industry sector.
I very much hope that you will find the metrics useful in measuring your company’s progress towards a
more sustainable operation and that you will share your experience via IChemE so that we can all learn to
improve.
Bill Tallis
Chairman
Sustainable Development Working Group
SUSTAINABILITY WORKING PARTY
Adisa Azapagic
Alan Howard
Alan Parfitt
Bill Tallis
Charles Duff
Clive Hadfield
Colin Pritchard
John Gillett
Judith Hackitt
Miles Seaman
Richard Darton
Richard Rathbone
Roland Clift
Steve Watson
Steven Elliot
INSTITUTION OF CHEMICAL ENGINEERS

I C H E M E S U S T A I N A B L E D E V E L O P M E N T P R O G R E S S M E T R I C S 2
S U S T A I N A B L E D E V E L O P M E N TP R O G R E S S M E T R I C S
Recommended for use in the Process Industries
S U M M A R Y
The Institution of Chemical Engineers sees sustainable development as the most significant issue facing
society today. Engineering for sustainable development means providing for human needs without
compromising the ability of future generations to meet their needs. The impact of industry on
sustainability can be summarised in the “triple bottom line”, covering the three components -
environmental responsibility, economic return (wealth creation), and social development. For industry to
guide its activities towards greater sustainability, more engineers need to have the tools to assess the
operations with which they are concerned. This publication therefore introduces a set of indicators that
can be used to measure the sustainability performance of an operating unit. These metrics will help
engineers address the issue of sustainable development. They will also enable companies to set targets
and develop standards for internal benchmarking, and to monitor progress year-on-year.
Sustainable Development Progress Metrics has been produced by the Sustainable Development
Working Group of The Institution of Chemical Engineers.
Correspondence should be sent to
External Relations Manager,
The Institution of Chemical Engineers,
Davis Building,
165-189 Railway Terrace,
Rugby CV21 3HQ, UK.
Tel: (44) (0) 1788 578214; Fax: (44) (0) 1788 534407.
E-mail: [email protected]
I C H E M E S U S T A I N A B L E D E V E L O P M E N T P R O G R E S S M E T R I C S 3
S U S T A I N A B L E D E V E L O P M E N TP R O G R E S S M E T R I C S
Recommended for use in the Process Industries
C O N T E N T S
1 Introduction
2 Reporting Format
3 The Metrics
3.1 Environmental indicators
3.1.1 Resource usage
3.1.2 Emissions, effluents and waste
3.1.3 Additional environmental items
3.2 Economic indicators
3.2.1 Profit, value and tax
3.2.2 Investments
3.2.3 Additional economic items
3.3 Social indicators
3.3.1 Workplace
3.3.2 Society
3.3.3 Additional social items
Appendix A Environmental Burdens for emissions to air
Appendix B Environmental Burdens for emissions to water
Appendix C Report Form

1 I N T R O D U C T I O N
The Institution of Chemical Engineers (IChemE), a learned society representing 25,000 chemical engineers worldwide, sees
sustainable development as the most significant issue facing society today. The IChemE’s approach to sustainable
development is encapsulated in the London Communiqué of 1997 (a statement signed by the leaders of 18 chemical
engineering societies throughout the world): “We will work to make the world a better place for future generations” and
to “provide the processes and products which will give the people of the world shelter, clothing, food and drink, and which
keep them in good health”. The IChemE has thus been working, with other bodies, to encourage progress to a more
sustainable world through the activities of its members and the organizations for which they work.
The laws of conservation of mass and energy are basic principles utilised by engineers. However the results of manipulating
the resources of the planet through these principles have consequences for the global eco-system. Engineering for
sustainable development means providing for human needs without compromising the ability of future generations to
meet their needs. It is clear that we have to be less profligate in our use of non-renewable resources if the planet is to be
fit for future generations to live on. We must also be more aware of the consequences of our activities for society at large.
The process industries have made significant progress over the last decade, particularly in improving their efficiency of
production and their environmental performance, and the IChemE has lent support to this improvement. However, moving
towards the goal of sustainability requires us also to examine and improve other aspects that have not traditionally been
given much attention, at least by practicing engineers.
Broadly, the impact of industry can be summarised in the “triple bottom line”, covering the three components of
sustainable development which are environmental responsibility, economic return (wealth creation), and social
development.
Many companies now recognize and monitor these three parallel strands, using their assessment to guide their product,
process and personnel development and to secure their position in the rapidly changing climate of environmental
legislation and stakeholder concerns. IChemE would like to encourage more companies to follow this lead, which requires
more engineers to have the tools to assess the sustainability of operations with which they are concerned.
This publication therefore introduces a set of indicators that can be used to measure sustainability performance of an
operating unit. If comparable statistics are gathered from a number of operations, they can be aggregated to present a
view of a larger operation, on a company, industry or regional basis for example. The operating unit envisaged is a process
plant, a group of plants, part of a supply chain, a whole supply chain, a utility or other process system.
We believe that these metrics will help engineers address the issue of sustainable development, and learn about the
broader impact of company operations. They will also enable companies to set targets and develop standards for internal
benchmarking, and to monitor progress year-on-year.
The IChemE would welcome your comments on these metrics, which we hope to develop in the light of experience with
their use.
I C H E M E S U S T A I N A B L E D E V E L O P M E N T P R O G R E S S M E T R I C S 4

2 R E P O R T I N G F O R M A T
Companies in the processing sector are encouraged to report their performance according to the standards recommended
by the Global Reporting Initiative (Sustainability Reporting Guidelines, www.globalreporting.org). The format
recommended here is consistent with that of the GRI. Naturally the contents of the report will depend on the scope of the
operations under consideration, but it is important that even for small operating units the wider implications and impacts
are considered.
The report should include the following.
1 Profile.
Definition of reporting unit, its boundaries and activities. Any significant changes over reporting period.
2 Summary.
Key indicators - environmental, economic and social - which give a balanced overview of the report. Other important
comments, conclusions and plans.
3 Vision and strategy.
Short-term and long-term actions planned for the unit, to move to greater sustainability. Explanation of how these
harmonise with company policy. Identification of specific targets.
4 Policy and organization.
Description of policies and organisation, management structure, stakeholder interactions – how these impact on unit
performance. Statement on compliance with ISO 14001, EMAS, Responsible Care, etc. Procedures for monitoring
sustainability performance of suppliers, contractors and outsourced activities in general.
5 Performance.
In this section the metrics are reported. It will be helpful also to note historical trends, targets, and factors affecting
performance, as an aid to interpretation.
Although designed for internal use, companies are encouraged to publish their progress metrics report, in whole or in part,
to demonstrate their commitment to sustainable development. The IChemE will be pleased to receive the information
collected by each Company, on a confidential basis not for publication. These data will help us to monitor the usefulness
of our metrics, and to develop future recommendations for best practice.
Respondents sending data to IChemE are kindly requested to use the Report Form (Appendix C). This can be completed
with the aid of the explanatory notes and working tables found in section 3 of this report.
I C H E M E S U S T A I N A B L E D E V E L O P M E N T P R O G R E S S M E T R I C S 5

3 T H E M E T R I C S
The metrics are presented in the three groups
3.1 Environmental indicators
3.2 Economic indicators
3.3 Social indicators
which reflect the three components of sustainable development.
Not all the metrics we suggest will be applicable to every operating unit. For some units other metrics will be more relevant
and respondents should be prepared to devise and report their own tailored metrics. Choosing relevant metrics is a task
for the respondent. Nevertheless, to give a balanced view of sustainability performance, there must be key indicators in
each of the three areas (environmental, economic, social).
Most products with which the process industries are concerned will pass through many hands in the chain resource
extraction – transport – manufacture – distribution – sale – utilization – disposal – recycling – final disposal. Suppliers,
customers and contractors all contribute to this chain, so in reporting the metrics it is important that the respondent makes
it clear where the boundaries have been drawn.
As with all benchmarking exercises, a company will receive most benefit from these data if they are collected for a number
of operating units, over a number of years, on a consistent basis. This will give an indication of trends, and the effect of
implementing policies.
A note on ratio indicators
Most of the progress metrics are calculated in the form of appropriate ratios. Ratio indicators can be chosen to provide a
measure of impact independent of the scale of operation, or to weigh cost against benefit, and in some cases they can
allow comparison between different operations. For example, in the environmental area, the unit of environmental impact
per unit of product or service value is a good measure of eco-efficiency. The preferred unit of product or service value is
the value added (see section 3.2.1), and this is the scaling factor generally used in this report. However, the value added
can sometimes be difficult to estimate accurately, so surrogate measures such as net sales, profit, or even mass of product
may be used. Alternatively, a measure of value might be the worth of the service provided, such as the value of personal
mobility, the value of improved hygiene, health or comfort. But a well-founded and consistent method of estimating these
‘values’ must be presented.
I C H E M E S U S T A I N A B L E D E V E L O P M E N T P R O G R E S S M E T R I C S 6

3.1 Environmental indicators
These metrics should give a balanced view of the environmental impact of inputs – resource usage, and outputs –
emissions, effluents and waste and the products and services produced.
3.1.1 Resource usage
(a) Energy
Imports
Export
Note
The Energy Value is multiplied by the Conversion factor to give the Primary Energy Value. It thus corrects for the
efficiency of generation and supply of the secondary energy source, to yield comparable figures for the primary energy
usage rate. The Conversion factors are available from the suppliers of the energy and will vary from provider to provider.
Total Net Primary Energy Usage rate = Imports – Exports GJ/y
Percentage Total Net Primary Energy sourced from renewables %
Total Net Primary Energy Usage per kg product kJ/kg
Total Net Primary Energy Usage per unit value added kJ/£
I C H E M E S U S T A I N A B L E D E V E L O P M E N T P R O G R E S S M E T R I C S 7
Electricity kJ a) kJ
Fuel Oil kJ/kg 1 kJ/kg
Gas kJ/kg 1 kJ/kg
Coal kJ/kg 1 kJ/kg
Steam kJ/kg a) kJ/kg
Other (specify) kJ/kg a) kJ/kg
Total
Energy Value Conversion Primary Energy Quantity used/y Usage rate GJ/yfactor Value
Electricity kJ a) kJ
Fuel Oil kJ/kg 1 kJ/kg
Gas kJ/kg 1 kJ/kg
Coal kJ/kg 1 kJ/kg
Steam kJ/kg a) kJ/kg
Other (specify) kJ/kg a) kJ/kg
Total
Energy Value Conversion Primary Energy Quantity used/y Usage rate GJ/yfactor Value

I C H E M E S U S T A I N A B L E D E V E L O P M E N T P R O G R E S S M E T R I C S 8
(b) Material (excluding fuel and water)
Total raw materials used, including packaging te/y
Raw material recycled from other company operations te/y
Raw material recycled from consumer te/y
Raw material used which poses health, safety or environmental hazard te/y
(describe hazard)
Total raw materials used per kg product kg/kg
Total raw materials used per unit value added kg/£
Fraction of raw materials recycled within company kg/kg
Fraction of raw materials recycled from consumers kg/kg
Hazardous raw material per kg product kg/kg
(c) Water
Water used in cooling te/y
Water used in process te/y
Other water used te/y Total te/y
Water recycled internally te/y
Net water consumed = Total used – recycled te/y
Net water consumed per unit mass of product kg/kg
Net water consumed per unit value added kg/£
(d) Land
Land occupied by operating unit m2 (include land needed for ALL activities)
Other land affected by unit’s activities m2 (describe effect)
Total land m2
Land restored to original condition m2/y
Total land occupied+affected for value added a) m2/(£/y)
Rate of land restoration (restored per year /total) b) (m2/ y)/m2
Notes
a) Land affected might be, eg land used in mining raw material or in dumping waste product.
b) The areas of land occupied and affected are those at the start of the reporting period, and the land restored is that area
restored during the reporting period.

3.1.2 Emissions, effluents and waste
The environmental impact categories chosen are a sub-set of those used internationally in environmental management,
selected to focus on areas where the process industry’s activities are most significant. The environmental burden approach
(developed by ICI) is a scientifically sound way to quantify environmental performance. It draws on developments in
environmental science to estimate potential environmental impact, rather than merely stating quantities of material
discharged.
The environmental impact arising from use of the product must be separately assessed under the appropriate
environmental impact headings and reported, see 3.1.3 (a).
Note on the calculation method (for further details see appendices A and B)
The Environmental Burden (EB) caused by the emission of a range of substances, is calculated by adding up the weighted
emission of each substance. The weighting factor is known as the “potency factor”. Note that because a single substance
will contribute differently to different Burdens, each substance will have a number of different potency factors.
EBi = ΣWN x PFi, N
where EBi = ith environmental burden
WN = weight of substance N emitted, including accidental and unintentional emissions
PFi,N = potency factor of substance N for ith environmental burden.
The ratio indicator is then found by dividing the Environmental Burden by the value added.
(a) Atmospheric impacts (see appendix A for calculation of Environmental Burdens)
Atmospheric acidification burden per unit value added a) te/£
Global warming burden per unit value added b) te/£
Human Health burden per unit value added c) te/£
Ozone depletion burden per unit value added d) te/£
Photochemical ozone burden per unit value added e) te/£
Notes
a) Atmospheric acidification. EB is te/y sulphur dioxide equivalent.
b) Global warming. EB is te/y carbon dioxide equivalent.
c) Human health (carcinogenic) effects. EB is te/y benzene equivalent.
d) Stratospheric ozone depletion. EB is te/y CFC-11 equivalent.
e) Photochemical ozone (smog) formation. EB is te/y ethylene equivalent.
I C H E M E S U S T A I N A B L E D E V E L O P M E N T P R O G R E S S M E T R I C S 9

(b) Aquatic impacts (see appendix B for calculation of Environmental Burden)
Aquatic acidification per unit value added a) te/£
Aquatic oxygen demand per unit value added b) te/£
Ecotoxicity to aquatic life per unit value added c) (i) metals te/£
(ii) other te/£
Eutrophication per unit value added d) te/£
Notes
a) Aquatic acidification. EB is te/y of released H+ ions.
b) Aquatic oxygen demand. EB is te/y oxygen.
c) Ecotoxity to aquatic life. EB is (i) te/y copper equivalent, and (ii) te/y formaldehyde equivalent.
d) Eutrophication. EB is te/y phosphate equivalent.
(c) Impacts to Land
Total Hazardous Solid Waste Disposal te/y (describe hazard)
Total Non-Hazardous Solid Waste Disposal te/y
Hazardous solid waste per unit value added te/£
Non-hazardous solid waste per unit value added te/£
3.1.3 Additional environmental items
Also report where appropriate
a) Duty of care with respect to products and services produced. Environmental impact and mitigating steps taken. This to
include issues concerning long-term environmental or health problems arising from process or product, for which the
solution is not yet known.
b) Issues concerning environmental impact of plant construction and decommissioning.
c) Compliance. Magnitude and nature of penalties for non-compliance with any local, national or international
environmental regulations or agreements.
d) Impacts on protected areas (Sites of Special Scientific Interest, proposed Special Areas of Conservation, National Parks).
Impacts on local biodiversity or important habitats.
e) Issues concerning long-term supply of raw materials from non-renewable resources.
f) Other possible relevant metrics.
I C H E M E S U S T A I N A B L E D E V E L O P M E N T P R O G R E S S M E T R I C S 10

I C H E M E S U S T A I N A B L E D E V E L O P M E N T P R O G R E S S M E T R I C S 11
3.2 Economic indicators
A key element of sustainability is the success of industry in creating wealth. The economic indicators go somewhat further
than conventional financial reporting in describing the creation of wealth or value, and in reporting its distribution and
reinvestment for future growth. Both human and financial capital are considered. The social consequences of economic
activity are explored further in section 3.3.
3.2.1 Profit, value and tax
Sales £/y
Cost of goods, raw materials and services purchased £/y
Value added £/y (see note a)
Gross margin £/y (see note b)
Net income before tax £/y (NIBT)
Taxes (total paid to all taxing authorities) £/y
Value added a) £/y
Value added per unit value of sales £/£
Value added per direct employee £/y
Gross margin b) per direct employee £/y
Return on average capital employed %/y
Taxes paid, as percent of NIBT %
Notes
a) Value added by the operation is the value of sales less the cost of goods, raw materials (including energy) and
services purchased.
b) Gross margin is the value of sales minus all variable costs.
3.2.2 Investments
(a) Direct
Average capital employed £
(plant, associated infrastructure, stocks, working capital etc.)
Increase (decrease) in capital employed £/y
Research and Development expenditure £/y
Average number of direct employees (full-time equivalents)
Number of new employees appointed /y
Number of employees with at least 2 years of
post-school education (defined in note a)
Total wages expense £/y
Total benefits expense £/y
Payroll expense = wages + benefits Total £/y
Total training expense for direct employees £/y

Percentage increase (decrease) in capital employed %/y
R&D expenditure as % sales %
Employees with post-school qualification a) %
New appointments/number of direct employees %/y
Training expense as percentage of payroll expense %
Note
a) Technicians and graduates and others who have had at least two years of education or training after leaving secondary
school. They should possess a vocational qualification, degree, or similar.
(b) Indirect
Number of indirect jobs wholly dependent on operating unit
(external, not on company payroll. Full-time equivalents.)
Investment in education (non-employee) at all levels £/y
(schools, colleges, universities and other educational programmes)
Other philanthropy and charitable gifts and donations £/y
Ratio of indirect jobs a)/number of direct employees
Investment in education b)/employee training expense £/£
Charitable gifts as percentage of NIBT c) %
Notes
a) The number of indirect jobs includes contractors with supply or other contract, and also includes workers servicing the
operation in any way, or in the local community, whose jobs would disappear or diminish if the operation ceased. This
could include teachers, shopkeepers, transport workers, accountants etc. Report full-time equivalents.
b) This item refers to support of educational institutions and programmes not specifically for the benefit of employees.
Employee education comes under the heading of training, see above.
c) This metric is a measure of the investment in the community.
3.2.3 Additional economic items
Also report where appropriate
a) Other possible relevant metrics.
I C H E M E S U S T A I N A B L E D E V E L O P M E N T P R O G R E S S M E T R I C S 12
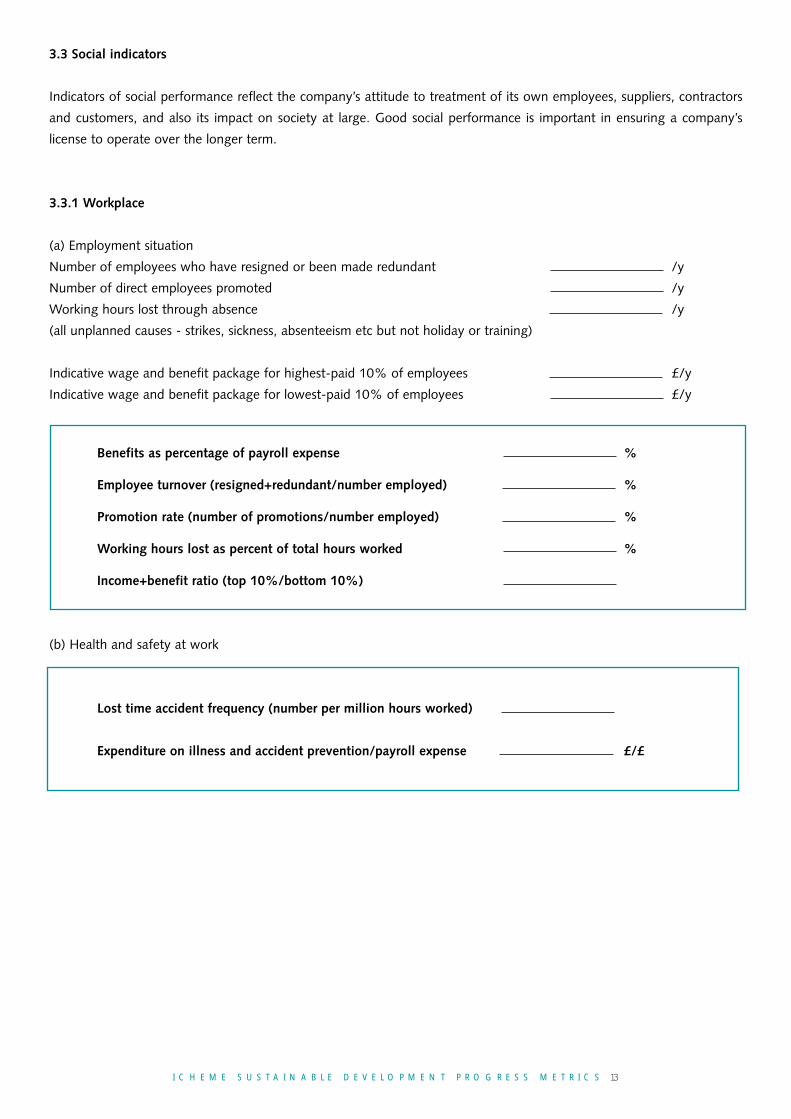
3.3 Social indicators
Indicators of social performance reflect the company’s attitude to treatment of its own employees, suppliers, contractors
and customers, and also its impact on society at large. Good social performance is important in ensuring a company’s
license to operate over the longer term.
3.3.1 Workplace
(a) Employment situation
Number of employees who have resigned or been made redundant /y
Number of direct employees promoted /y
Working hours lost through absence /y
(all unplanned causes - strikes, sickness, absenteeism etc but not holiday or training)
Indicative wage and benefit package for highest-paid 10% of employees £/y
Indicative wage and benefit package for lowest-paid 10% of employees £/y
Benefits as percentage of payroll expense %
Employee turnover (resigned+redundant/number employed) %
Promotion rate (number of promotions/number employed) %
Working hours lost as percent of total hours worked %
Income+benefit ratio (top 10%/bottom 10%)
(b) Health and safety at work
Lost time accident frequency (number per million hours worked)
Expenditure on illness and accident prevention/payroll expense £/£
I C H E M E S U S T A I N A B L E D E V E L O P M E N T P R O G R E S S M E T R I C S 13

3.3.2 Society
Number of meetings with external stakeholders concerning company operations /y
Indirect benefit to the community resulting from presence of operating unit £/y
Number of complaints registered from members of the public
concerning the process or products /y
Number of successful legal actions taken against company or employees for
work-related incidents or practices /y
Number of stakeholder a) meetings per unit value added /£
Indirect community benefit b) per unit value added £/£
Number of complaints per unit value added /£
Number of legal actions per unit value added c) /£
Note
a) External stakeholders include customers, residents and other community groups, local government, non-governmental
organizations (NGO’s). This metric represents company efforts in communicating with external stakeholders.
b) A major social benefit arising from the presence of a successful process industry unit is the dissemination of skills and
know-how which are used in the community to create wealth and enhance quality of life. It is difficult to quantify these
benefits, but estimates may be made. We suggest to include items such as
i) Net value to community of freely published information and know-how
ii) Net value to community of training given to contractors and suppliers
iii) Net value to community of training given to (ex-)employees.
These estimates of value should not include direct benefits which have already been included in section 3.2.2. Value
may be estimated by considering what it has cost the company to generate the benefit on the one hand, and what
society might be willing to pay for it on the other.
c) This metric is a measure of antisocial behaviour.
3.3.3 Additional items
Also report where appropriate
a) Issues concerning discrimination, concerning women and minorities or indigenous communities, the number in senior
and middle management; programmes to improve employability including focused education or training, and mentoring.
b) Incidents of child labour, forced labour or violation of human rights, on the part of the company, its suppliers or
contractors, and public protest concerning such issues. Report positive steps taken in this regard.
c)Performance of suppliers and contractors relative to criteria for their selection. Incidents of non-compliance with
sustainability requirements, eg Responsible Purchasing.
d) Other possible relevant metrics.
I C H E M E S U S T A I N A B L E D E V E L O P M E N T P R O G R E S S M E T R I C S 14
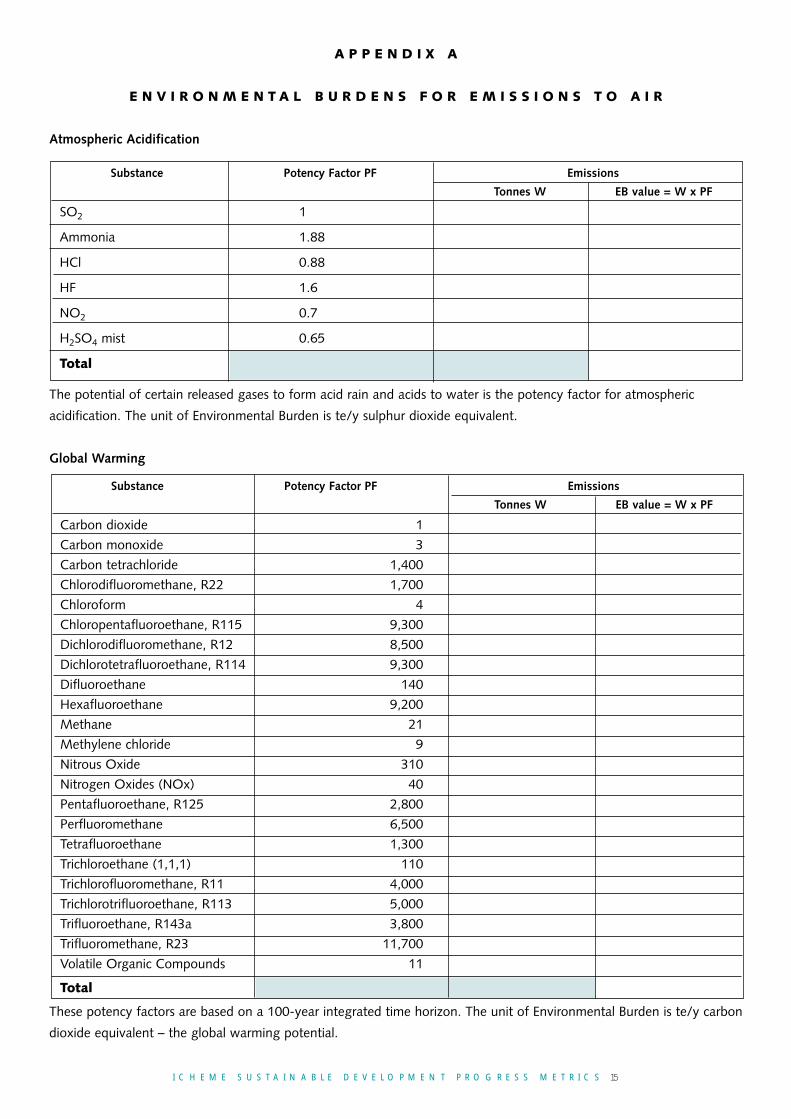
A P P E N D I X A
E N V I R O N M E N T A L B U R D E N S F O R E M I S S I O N S T O A I R
Atmospheric Acidification
The potential of certain released gases to form acid rain and acids to water is the potency factor for atmospheric
acidification. The unit of Environmental Burden is te/y sulphur dioxide equivalent.
Global Warming
These potency factors are based on a 100-year integrated time horizon. The unit of Environmental Burden is te/y carbon
dioxide equivalent – the global warming potential.
I C H E M E S U S T A I N A B L E D E V E L O P M E N T P R O G R E S S M E T R I C S 15
SO2 1
Ammonia 1.88
HCl 0.88
HF 1.6
NO2 0.7
H2SO4 mist 0.65
Total
Substance Potency Factor PF Emissions
Tonnes W EB value = W x PF
Carbon dioxide 1
Carbon monoxide 3
Carbon tetrachloride 1,400
Chlorodifluoromethane, R22 1,700
Chloroform 4
Chloropentafluoroethane, R115 9,300
Dichlorodifluoromethane, R12 8,500
Dichlorotetrafluoroethane, R114 9,300
Difluoroethane 140
Hexafluoroethane 9,200
Methane 21
Methylene chloride 9
Nitrous Oxide 310
Nitrogen Oxides (NOx) 40
Pentafluoroethane, R125 2,800
Perfluoromethane 6,500
Tetrafluoroethane 1,300
Trichloroethane (1,1,1) 110
Trichlorofluoromethane, R11 4,000
Trichlorotrifluoroethane, R113 5,000
Trifluoroethane, R143a 3,800
Trifluoromethane, R23 11,700
Volatile Organic Compounds 11
Total
Substance Potency Factor PF Emissions
Tonnes W EB value = W x PF

Human Health (carcinogenic) EffectsUnlike Global Warming, there are no internationally accepted potency factors for Human Health. For this reason,carcinogenic effects are offered as a default set but companies are encouraged to use other sets if they are moreappropriate.
The potency factor for this category in the table below has been derived from the reciprocal of the Occupational ExposureLimits (OEL) set by the UK Health and Safety Executive. The OEL for benzene has been chosen as the normalizing factorfor this category. For other chemicals take the OEL in mg m-3, calculate the reciprocal and divide it by the reciprocal ofthe OEL for benzene (0.0625) i.e. PFsubstance = (OEL benzene/OEL substance).
Chemicals with an OEL greater than 500 mg m-3 will have a minimal impact on the total weighted impact.
The unit of Environmental Burden is te/y benzene equivalent.
I C H E M E S U S T A I N A B L E D E V E L O P M E N T P R O G R E S S M E T R I C S 16
Acrylamide 79-06-1 53.3
Acrylonitrile 107-13-1 3.6
Antimony & compounds except stibine, as Sb 7440-36-0 32
Arsenic & compounds except arsine, as As 7440-38-0 160
Azodicarbonate 123-77-3 16
Benzene 71-43-2 1
Berylium & Compounds 8000
Bis (chloromethyl) ether 542-88-1 3200
Buta-1,3-diene 106-99-0 0.73
Cadmium & Compounds 640
Cadmium oxide fume 1306-19-0 640
Carbon disulphide 136-23-6 0.5
1-Chloro-2,3-epoxypropane 106-89-8 8.4
Chromium (VI) compounds 320
Cobalt & Compounds 160
Cotton dust 6.4
1,2-dibromoethane 106-93-4 4.1
1,2-dichloroethane 107-06-2 0.76
Dichloromethane 75-09-2 0.05
2-2’-Dichloro-4,4’-methylene dianiline (MbOCA) 101-14-4 3200
Diethyl sulphate 64-67-5 50
Dimethyl sulphate 77-78-1 3.8
2-Ethoxyethanol 110-80-5 0.43
2-Ethoxyethyl acetate 111-15-9 0.3
Ethylene oxide 75-21-8 1.7
Formaldehyde 50-00-0 6.4
Grain dust 1.6
Hardwood dust 3.2
Hydrazine 30-07-2 533.3
Iodomethane 74-88-4 1.3
Isocyanates, all 800
Maleic anhydride 108-31-6 16
Man-made mineral fibre 3.2
2-Methoxyethanol 109-86-4 1
2-Methoxyethyl acetate 110-49-6 0.64
4-4’-methylenedianiline 101-77-9 200
Nickel & inorganic compounds 160
Substance CAS Potency Emissions
Number Factor PF Tonnes W EB value = W x PF

Stratospheric Ozone DepletionThe potency factor for this category is based on the potential to deplete ozone in the upper atmosphere relative tochlorofluorocarbon – 11 (ODP - the ozone depletion potential). The unit of Environmental Burden is te/y CFC-11equivalent (CFC-11 is trichlorofluoromethane).
I C H E M E S U S T A I N A B L E D E V E L O P M E N T P R O G R E S S M E T R I C S 17
2-Nitropropane 79-46-9 0.8
Phthalic anhydride 85-44-9 4
Polychlorinated biphenyls (PCB) 1336-36-3 160
Propylene oxide 75-56-9 1.33
Rubber fume 26.7
Rubber process dust 2.6
Silica respirable crystalline 53.3
Softwood dust 3.2
Styrene 100-42-5 0.04
o-Toluidine 95-53-4 18
Triglycidyl isocyanurate (TGIC) 2451-62-9 160
Trimellite anhydride 552-30-7 400
Vinylidene chloride 75-35-4 0.4
Wool process dust 1.6
Softwood dust 3.2
Total
CFC - 11 1.0
CFC - 12 1.0
CFC - 113 0.8
CFC - 114 1.0
CFC - 115 0.6
CFC - 13 1.0
CFC - 111 1.0
CFC - 112 1.0
CFC - 212 1.0
CFC - 213 1.0
CFC - 214 1.0
CFC - 215 1.0
CFC - 216 1.0
CFC - 217 1.0
halon-1211 3.0
halon-1301 10.0
halon-2402 6.0
Carbon tetrachloride 1.1
1,1,1-trichloroethane 0.1
Methyl bromide 0.7
HCFC-21 0.04
HCFC-22 0.055
HCFC-31 0.02
HCFC-121 0.04
Substance Potency Factor PF Emissions
Tonnes W EB value = W x PF

Photochemical Ozone (smog) Formation
Potency factors for this category are obtained from the potential of substances to create ozone photochemically. The unit
of Environmental Burden is te/y ethylene equivalent.
I C H E M E S U S T A I N A B L E D E V E L O P M E N T P R O G R E S S M E T R I C S 18
HCFC-122 0.08
HCFC-123 (3) 0.02
HCFC-124 (3) 0.022
HCFC-131 0.05
HCFC-132 0.05
HCFC-133 0.06
HCFC-141 0.07
HCFC-141b (3) 0.11
HCFC-142 0.07
HCFC-142b (3) 0.065
HCFC-151 0.005
HCFC-221 0.07
HCFC-222 0.09
HCFC-223 0.08
HCFC-224 0.09
HCFC-225 0.07
HCFC-225ca (3) 0.025
HCFC-225cb (3) 0.033
HCFC-226 0.1
HCFC-231 0.09
HCFC-232 0.1
HCFC-233 0.23
HCFC-234 0.28
HCFC-235 0.52
HCFC-241 0.09
HCFC-242 0.13
HCFC-243 0.12
HCFC-244 0.14
HCFC-251 0.01
HCFC-252 0.04
HCFC-253 0.03
HCFC-261 0.02
HCFC-262 0.02
HCFC-271 0.03
Total
Substance Potency Factor PF Emissions
Tonnes W EB value = W x PF
Alkanes
Methane 0.034
Ethane 0.14
Propane 0.411
n-Butane 0.6
i-Butane 0.426

I C H E M E S U S T A I N A B L E D E V E L O P M E N T P R O G R E S S M E T R I C S 19
n-Pentane 0.624
i-Pentane 0.598
n-Hexane 0.648
2-Methylpentane 0.778
3-Methylpentane 0.661
2,2-Dimethylbutane 0.321
2,3-Dimethylbutane 0.943
n-heptane 0.77
2-Methylhexane 0.719
3-Methylhexane 0.73
n-Octane 0.682
2-Methylheptane 0.694
n-Nonane 0.693
2-Methyloctane 0.706
n-Decane 0.680
2-Methylnonane 0.657
n-Undecane 0.616
n-Dodecane 0.577
Cyclohexane 0.595
Methyl cyclohexane 0.732
Alkenes
Ethylene 1.0
Propylene 1.08
1-Butene 1.13
2-Butene 0.99
2-Pentene 0.95
1-Pentene 1.04
2-Methylbut-1-ene 0.83
3-Methylbut-1-ene 1.18
2-Methylbut-2-ene 0.77
Butylene 0.703
Isoprene 1.18
Styrene 0.077
Alkynes
Acetylene 0.28
Aromatics
Benzene 0.334
Toluene 0.771
o- Xylene 0.831
m-Xylene .08
p- Xylene 0.948
Ethylbenzene 0.808
n-Propylbenzene 0.713
i-Propylbenzene 0.744
1,2,3-Trimethylbenzene 1.245
1,2,4- Trimethylbenzene 1.324
1,3,5- Trimethylbenzene 1.299
o-Ethyltoluene 0.846
m-Ethyltoluene 0.985
p-Ethyltoluene 0.935

I C H E M E S U S T A I N A B L E D E V E L O P M E N T P R O G R E S S M E T R I C S 20
3,5-Dimethylethylbenzene 1.242
3,5-Diethyltoluene 1.195
Aldehydes
Formalhyde 0.554
Acetaldehyde 0.65
Propionaldehyde 0.755
Butyraldehyde 0.77
i-Butyraldehyde 0.855
Valeraldehyde 0.887
Benzaldehyde -0.056*
Ketones
Acetone 0.182
Methylethylketone 0.511
Methyl- i -butylketone 0.843
Cyclohexanone 0.529
Alcohols
Methyl alcohol 0.205
Ethyl alcohol 0.446
i-Propanol 0.216
n-Butanol 0.628
i-Butanol 0.591
s-Butanol 0.468
t-Butanol 0.191
Diacetone alcohol 0.617
Cyclohexanol 0.622
Esters
Methyl acetate 0.046
Ethyl acetate 0.328
n-Propyl acetate 0.481
i-Propyl acetate 0.291
n-Butyl acetate 0.511
s-Butyl acetate 0.452
Organic Acids
Formic acid 0.003
Acetic acid 0.156
Propionic acid 0.035
Ethers
Butyl glycol 0.629
Propylene glycol methyl ether 0.518
Dimethyl ether 0.263
Methyl- t -butyl ether 0.268
Halocarbons
Methyl chloride 0.035
Methylene chloride 0.031
Methylchloroform 0.002
Tetrachloroethylene 0.035
Trichloroethylene 0.075
Vinyl chloride 0.272
1,1-Dichloroethylene 0.232
cis 1,2- Dichloroethylene 0.172

* The negative values imply the ability to reduce photochemical ozone production.
I C H E M E S U S T A I N A B L E D E V E L O P M E N T P R O G R E S S M E T R I C S 21
trans 1,2- Dichloroethylene 0.101
Other Pollutants
Nitric oxide -0.427*
Nitrogen dioxide 0.028
Sulphur dioxide 0.048
Carbon monoxide 0.027
Total

A P P E N D I X B
E N V I R O N M E N T A L B U R D E N S F O R E M I S S I O N S T O W A T E R
Aquatic Acidification
The potency factor is the mass of hydrogen ion released by unit mass of acid i.e. the number of hydrogen ions releaseddivided by the molecular weight. The unit of Environmental Burden is te/y of H+ ions released.
The calculation of the H+ ion is the preferred method of deriving the potency factor in this category, however measuredpH values may also be used.
Aquatic Oxygen Demand
The Stoichiometric Oxygen Demand (StOD) has been chosen as the potency factor. It represents the maximum potential
of emissions to water to remove dissolved oxygen that would otherwise support fish and other aquatic life. StOD is
expressed as tonnes of oxygen required per tonne of substance. The unit of Environmental Burden is te/y oxygen.
An alternative potency factor is Chemical Oxygen Demand (COD).
I C H E M E S U S T A I N A B L E D E V E L O P M E N T P R O G R E S S M E T R I C S 22
Substance Potency Factor PF Emissions
Tonnes W EB value = W x PF
Sulphuric acid 0.02
Hydrochloric acid 0.027
Hydrogen fluoride 0.05
Acetic acid 0.02
Total
Substance Potency Factor PF Emissions
Tonnes W EB value = W x PF
Acetic acid 1.07
Acetone 2.09
Ammonium nitrate in solution 0.8
Ammonium sulphate in solution 1
Chlorotrifluoroethane 0.54
1,2 – Dichloroethane (EDC) 0.81
Ethylene 1
Ethylene glycol 1.29
Ferrous ion 0.14
Methanol 1.5
Methyl methacrylate 1.5
Methylene Chloride 0.47
Phenol 2.38
Vinyl chloride 1.28
Total

Calculation of the Stoichiometric Oxygen Demand (StOD)From knowledge of the chemical structure, calculate the empirical formula as follows:
CcHhNnClCINaNaOoPpSs
Then calculate the StOD in te O2 per te of substance from the equation:
StOD = 16(2c+0.5(h-Cl)+2.5n+3s+2.5p+0.5Na - o)/Molecular Weight
This equation assumes that nitrogen is oxidized and eventually released as the nitrate ion (NO3-). It is assumed that carbonis mineralized to CO2, hydrogen (H) to H2O, phosphorus (P) to P2O, sodium (Na) to Na2O, sulphur (S) to SO2 and halides(represented by Cl) to their respective acids. The compounds described after oxidation are those specified by internationalconvention for calculating oxygen demand.
For example, Acetic acid CH3COOH with a molecular weight of 60
StOD = 16(2´2 + 0.5´4 - 2)/60 = 1.07 te O2 per te acetic acid
Another example, Phenol C6H5OH with a molecular weight of 94
StOD = 16(2´6 + 0.5´6 - 1)/94 = 2.38 te O2 per te of phenol
For ionic species the calculation must take into account the charge of the ionic unit. For the ammonium ion(NH4+), for example, we remove an H+ ion and calculate on the NH3, so that the ionic balance is notdisturbed.
StOD = 16(0.5x3 + 2.5x1)/17 = 3.76 te O2 per te of ammonia
= 3.56 te O2 per te of ammonium ion
Ecotoxicity to Aquatic Life(values for sea water conditions)
(i) Metals
The potency factor is equal to the reciprocal of the Environmental Quality Standard (EQS) divided by the reciprocal ofthe EQS of copper. The unit of Environmental Burden is te/y copper equivalent.
I C H E M E S U S T A I N A B L E D E V E L O P M E N T P R O G R E S S M E T R I C S 23
Substance Potency Factor PF Emissions
Tonnes W EB value = W x PF
Arsenic 0.2
Cadmium 2.0
Chromium 0.33
Copper 1
Iron 0.005
Lead 0.2
Manganese 0.1
Mercury 16.67
Nickel 0.17
Vanadium 0.05
Zinc 0.125
Total

(ii) Other Substances
The above potency factors are equal to the reciprocal of the Environment Quality Standard (EQS) divided by the reciprocal
of the EQS of formaldehyde. The unit of Environmental Burden is te/y formaldehyde equivalent.
Eutrophication
Eutrophication is defined as the potential for over-fertilisation of water and soil, which can result in increased growth of
biomass. The species above are those considered to be responsible for eutrophication. The unit of Environmental Burden
is te/y phosphate equivalent.
I C H E M E S U S T A I N A B L E D E V E L O P M E N T P R O G R E S S M E T R I C S 24
Substance Potency Factor PF Emissions
Tonnes W EB value = W x PF
Ammonia 0.24
Benzene 0.17
Carbon tetrachloride 0.42
Chloride 0.5
Chlorobenzene 1.0
Chloroform 0.42
Cyanide 1.0
1,2-Dichloroethane (EDC) 0.5
Formaldehyde 1.0
Hexachlorobenzene 166.67
Hexachlorobutadiene 50
Methylene chloride 0.5
Nitrobenzene 0.25
Nitrophenol 0.5
Toluene 0.125
Tetrachloroethylene (PER) 0.5
Trichloroethylene (TRI) 0.5
Xylenes 0.17
Total
Substance Potency Factor PF Emissions
Tonnes W EB value = W ´ PF
NO2 0.2
NO 0.13
NOx 0.13
Ammonia 0.33
Nitrogen 0.42
PO4 (III-) 1
Phosphorus 3.06
COD 0.022
Total

A P P E N D I X C
R E P O R T F O R M
Name of company and unit:
Contact person: Job Title:
Address:
Phone and fax numbers: Email address:
Period covered by the report:
Signed:
Place:
Date:
This page containing company information will be kept by IChemE separately from the following report. The reported data
and metrics will thus be anonymous, providing respondents themselves do not reveal their identity in the report.
I C H E M E S U S T A I N A B L E D E V E L O P M E N T P R O G R E S S M E T R I C S 25
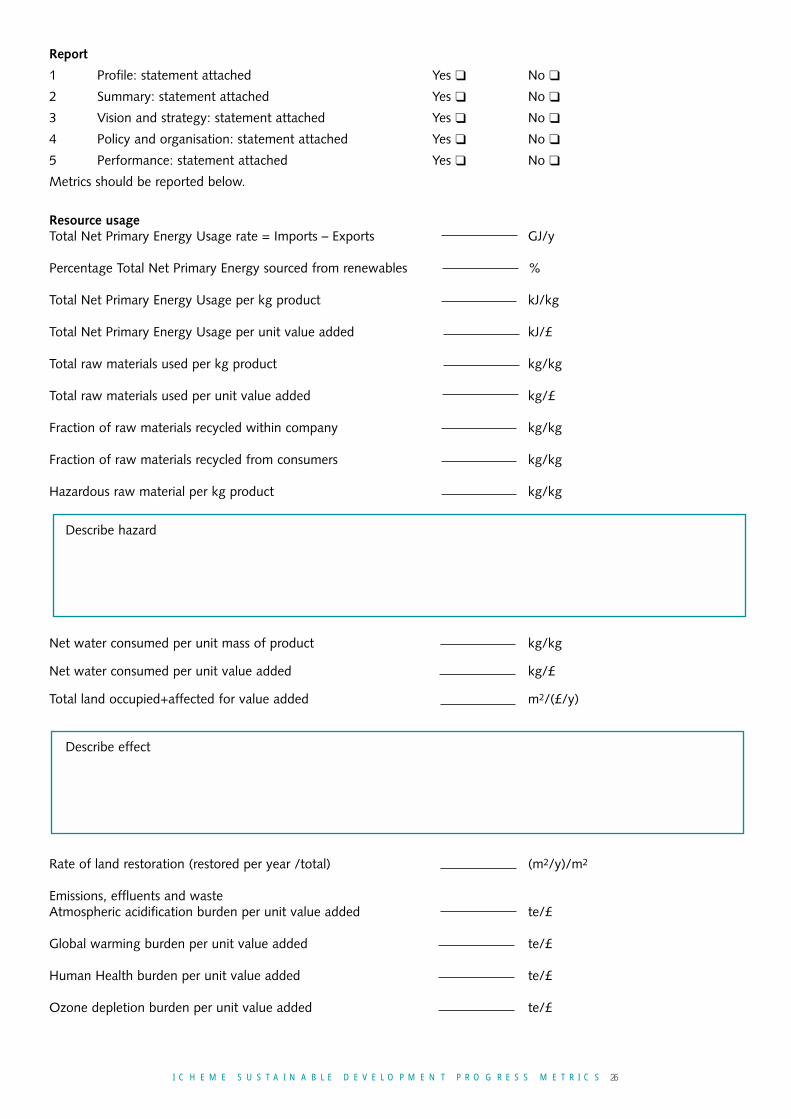
Report
1 Profile: statement attached Yes ❑ No ❑
2 Summary: statement attached Yes ❑ No ❑
3 Vision and strategy: statement attached Yes ❑ No ❑
4 Policy and organisation: statement attached Yes ❑ No ❑
5 Performance: statement attached Yes ❑ No ❑
Metrics should be reported below.
Resource usageTotal Net Primary Energy Usage rate = Imports – Exports GJ/y
Percentage Total Net Primary Energy sourced from renewables %
Total Net Primary Energy Usage per kg product kJ/kg
Total Net Primary Energy Usage per unit value added kJ/£
Total raw materials used per kg product kg/kg
Total raw materials used per unit value added kg/£
Fraction of raw materials recycled within company kg/kg
Fraction of raw materials recycled from consumers kg/kg
Hazardous raw material per kg product kg/kg
Describe hazard
Net water consumed per unit mass of product kg/kg
Net water consumed per unit value added kg/£
Total land occupied+affected for value added m2/(£/y)
Describe effect
Rate of land restoration (restored per year /total) (m2/y)/m2
Emissions, effluents and wasteAtmospheric acidification burden per unit value added te/£
Global warming burden per unit value added te/£
Human Health burden per unit value added te/£
Ozone depletion burden per unit value added te/£
I C H E M E S U S T A I N A B L E D E V E L O P M E N T P R O G R E S S M E T R I C S 26

Photochemical ozone burden per unit value added te/£
Aquatic acidification per unit value added te/£
Aquatic oxygen demand per unit value added te/£
Ecotoxicity to aquatic life per unit value added (i) metals te/£
(ii) other te/£
Eutrophication per unit value added te/£
Hazardous solid waste per unit value added te/£
Describe hazard
Non-hazardous solid waste per unit value added te/£
Additional environmental items Statement attached Yes ❑ No ❑
Profit, value and taxValue added £/y
Value added per unit value of sales £/£
Value added per direct employee £/y
Gross margin per direct employee £/y
Return on average capital employed %/y
Taxes paid, as percent of NIBT %
InvestmentsPercentage increase (decrease) in capital employed %
R&D expenditure as % sales %
Employees with post-school qualification %
New appointments/number of direct employees %
Training expense as percentage of payroll expense %
Ratio of indirect jobs/number of direct employees
Investment in education/employee training expense £/£
Charitable giving as percentage of NIBT %
Additional economic items Statement attached Yes ❑ No ❑
I C H E M E S U S T A I N A B L E D E V E L O P M E N T P R O G R E S S M E T R I C S 27
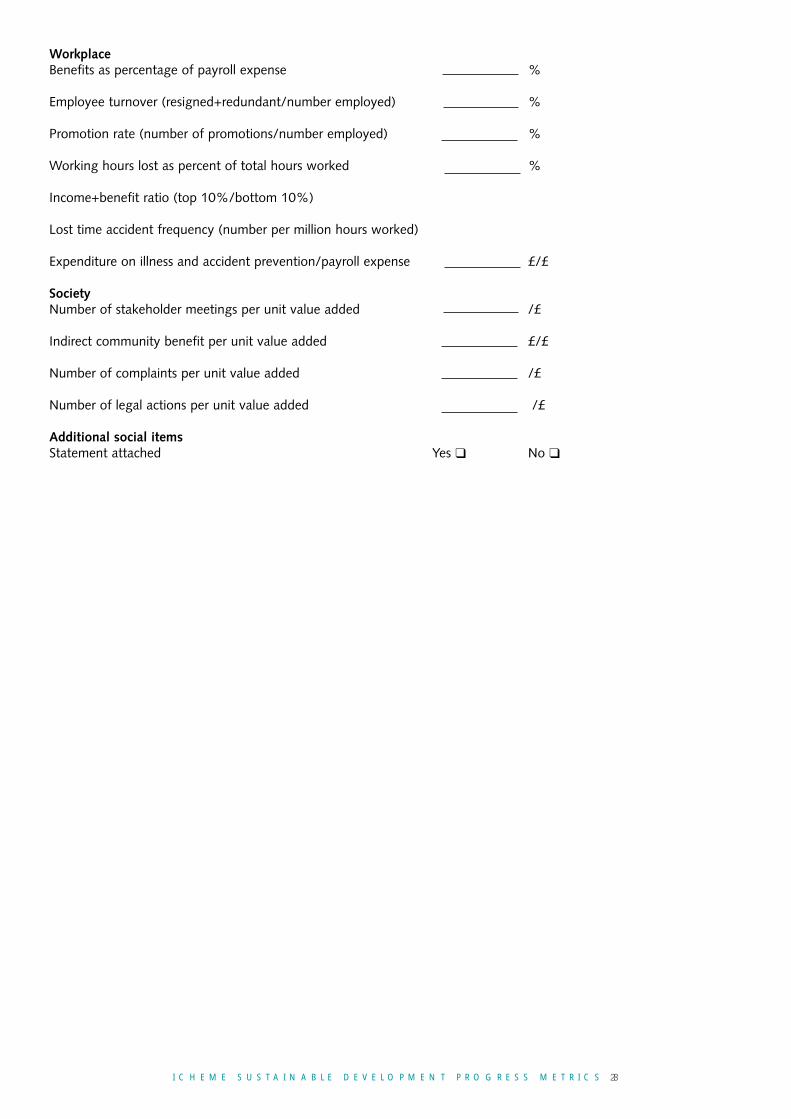
WorkplaceBenefits as percentage of payroll expense %
Employee turnover (resigned+redundant/number employed) %
Promotion rate (number of promotions/number employed) %
Working hours lost as percent of total hours worked %
Income+benefit ratio (top 10%/bottom 10%)
Lost time accident frequency (number per million hours worked)
Expenditure on illness and accident prevention/payroll expense £/£
SocietyNumber of stakeholder meetings per unit value added /£
Indirect community benefit per unit value added £/£
Number of complaints per unit value added /£
Number of legal actions per unit value added /£
Additional social items Statement attached Yes ❑ No ❑
I C H E M E S U S T A I N A B L E D E V E L O P M E N T P R O G R E S S M E T R I C S 28

P r o d u c e d b y t h e S u s t a i n a b l e D e v e l o p m e n t W o r k i n g G r o u p o f t h e I n s t i t u t i o n o f C h e m i c a l E n g i n e e r s
The leading profess ional body
IChemE i s the qua l i fy ing and profess iona l body for chemica l eng ineers . With theaddi t iona l ro le of learned soc iety, the Inst i tut ion has cont inuous ly expanded andtoday has an internat iona l membersh ip approach ing 25,000.
To promote and represent the v iews of chemica l eng ineers , IChemE organises arange of act iv i t ies invo lv ing members and profess iona ls f rom other d i sc ip l ines ,bus iness leaders , academics , po l i t i c ians and the publ ic at la rge.
w w w . i c h e m e . o r g
Published by
Institution of Chemical Engineers, Davis Building, Rugby, Warwickshire CV21 3HQ
t: +44 1788 578214 f: +44 1788 560833