ichiro kutani - eria: economic research institute … kutani leader of the working group june 2013 ....
TRANSCRIPT

ERIA Research Project Report 2012, No. 23
STUDY ON EFFECTIVE
INVESTMENT OF POWER
INFRASTRUCTURE
IN EAST ASIA THROUGH
POWER GRID INTERCONNECTION
Edited by
ICHIRO KUTANI

ERIA Research Project Report 2012, No. 23
STUDY ON EFFECTIVE
INVESTMENT OF POWER
INFRASTRUCTURE
IN EAST ASIA THROUGH
POWER GRID INTERCONNECTION
Edited by
ICHIRO KUTANI
June 2013

i
DISCLAIMER
This report was prepared by the Working Group for the “Study on Effective
Investment of Power Infrastructure in East Asia through Power Grid
Interconnection” under the Economic Research Institute for ASEAN and East Asia
(ERIA) Energy Project. Members of the Working Group, who represent the
participating EAS region countries, discussed and agreed to utilize certain data and
methodologies proposed by the Institute of Energy Economics, Japan (IEEJ) to
assess the optimal power supply infrastructure for this study. These data and
methodologies may differ from those normally used in each country. Therefore, the
calculated result presented here should not be viewed as official national analyses of
the participating countries.
iii
ACKNOWLEDGEMENTS
This analysis has been implemented by a working group under ERIA. It was a joint
effort of Working Group members from the EAS Countries and the IEEJ (The
Institute of Energy Economics, Japan). We would like to acknowledge the support
provided by everyone involved. We would especially like to express our gratitude to
the members of the Working Group, Economic Research Institute for ASEAN and
East Asia (ERIA) and IEEJ’s study project team.
Mr. Ichiro Kutani
Leader of the Working Group
June 2013

ii
FOREWORD
In East Asian countries where there electricity demand has rapidly increasing, are
facing necessity to construct new power plants in a timely manner to serve electricity
demand. At the same time, cheaper electricity will be required when considering
impact on general public and economy, and needs for cleaner electricity will become
stronger when considering impact on pollution and climate issue.
On the other hand in East Asian countries, there are remaining of undeveloped
(potential) resources like coal, natural gas and river to fuel power plant. If the region
can utilize these resources, it would benefit to cheaper supply and cleaner electricity
generation, and also contribute to enhance energy security through reducing regional
import dependency of energy supply.
One possible option to maximize the use of undeveloped (potential) resources in the
region is international grid interconnection. The region can optimize power supply
mix through cross-border power transaction.
Against this backdrop, ERIA organized a working group to carry out a new study
aims to analyze a possible optimum power generation mix of the region, and to
provide policy recommendations for the improvement of that situation. Experts from
EAS countries were gathered to discuss their existing power development plan and
possibility for regional optimization.
It is my hope that the outcomes of this study will serve as the point of reference for
policymakers in East Asian countries and contribute to the improvement of energy
security in the region as a whole.
Ichiro Kutani
Leader of the Working Group
June 2013

iv
TABLE OF CONTENTS
Disclaimer i
Foreword ii
Acknowledgements iii
Table of Contents iv
List of Project Members v
List of Tables vii
List of Figures ⅷ
List of Abbreviations and Acronyms ⅸ
Executive Summary ⅹ
Chapter 1. Introduction 1
Chapter 2. Power Infrastructure Developing Plan in Each Country 6
Chapter 3. Existing Initiatives and its Challenges 57
Chapter 4. Optimizing Power Infrastrucuture Development 71
Chapter 5. Key Findings and Next Step 106
v
LIST OF PROJECT MEMBERS
Working Group Members
MR. ICHIRO KUTANI (LEADER): Senior Economist, Manager, Global Energy Group
1 , Assistant to Managing Director, Strategy Research Unit, The Institute of
Energy Economics, Japan (IEEJ)
MR. MITSUO MATSUMOTO (ORGANIZER): Managing Director for Research Affairs,
Economic Research Institute for ASEAN and East Asia (ERIA)
MR. BRETT JACOBS (ORGANIZER): Energy Economist, Economic Research Institute
for ASEAN and East Asia (ERIA)
DR. HAN PHOUMIN (ORGANIZER): Energy Economist, Economic Research Institute
for ASEAN and East Asia (ERIA)
MR. PISETH SOUEM: Officer, General Department of Energy, Ministry of Industry,
Mines and Energy (MIME), Cambodia
MR. AWDHESH KUMAR YADAV: Deputy Director, System Planning and Project
Appraisal Power System, Central Electricity Authority (CEA), India
MR. PRAMUDYA: Planning Staff, Directorate General of Electricity, Ministry of
Energy and Mineral Resources (MEMR), Indonesia
MR. KAZUTAKA FUKASAWA: Senior Researcher, Global Energy Group 1, Strategy
Research Unit, The Institute of Energy Economics, Japan (IEEJ)
MR. YOHEI ODANI: Researcher, Global Energy Group 1, Strategy Research Unit,
The Institute of Energy Economics, Japan (IEEJ)
MS. SANTISOUK PHIMPHACHANH: Acting Director, Power System Planning Division,
Department of Energy Policy and Planning, Ministry of Energy and Mines
(MEM), Lao PDR

vi
MR. SUHANEE SUTREE CHIT: Manager for Technical Studies, System Planning and
Development Planning Division, Tenaga Nasional Berhad, Malaysia
MR. THUREIN THAN: Assistant Director, Department of Electric Power (DEP),
Ministry of Electric Power (MOEP), Myanmar.
DR. JIRAPORN SIRIKUM: Chief, Generation System Development Planning
Department, System Planning Division, Electricity Generating Authority of
Thailand (EGAT), Thailand
MR. TANG THE HUNG: Deputy Director "Planning Department, General Directorate
of Energy, Ministry of Industry and Trade (MOIT), Vietnam
vii
LIST OF TABLES
Table 2-1 Outlook of power generation capacity 19
Table 2-2 MOU for electricity trade with neighboring countries 53
Table 3-1 Regional Power Trade Roadmap 2008-2012 (to accomplish stage 1) 63
Table 3-2 Regional Power Trade Roadmap 2008-2012 (to prepare for stage 2) 64
Table 4-1 Electricity Demand (GWh) 81
Table 4-2 International interconnection transmission capacity (GWh) 82
Table 4-3 Capability of Electricity Supply (GWh) 82
Table 4-4 Generation cost by power source (US$ / kWh) 85
Table 4-5 CO2 emission factor by power source (kt-CO2 / GWh) 88
Table 4-6 Calculation results (Base Case in 2020)
[CO2 emission volume not restricted]
90
Table 4-7 Calculation results (Accelerated Case in 2030)
[CO2 emission volume not restricted]
91
Table 4-8 Calculation results (Base Case in 2030)
[CO2 emission volume not restricted]
92
Table 4-9 Optimal energy mixes by country
if international interconnection grid is augmented
(Cases in which CO2 emission volume is not restricted)
93
Table 5-1 Comparison of Each Fuel 106

viii
LIST OF FIGURES
Figure 2-1 Power development plan toward 2020 and 2030 (Bangladesh) 7
Figure 2-2 Power development plan toward 2020 and 2030 (Brunei) 11
Figure 2-3 Power development plan toward 2020 and 2030 (Cambodia) 14
Figure 2-4 Power development plan toward 2020 and 2030 (China
[Yunnan & Guangxi] )
18
Figure 2-5 Power development plan toward 2020 and 2030 (N-E India) 24
Figure 2-6 Power development plan toward 2020 and 2030 (Indonesia) 29
Figure 2-7 Power development plan toward 2020 and 2030 (Laos) 33
Figure 2-8 Power development plan toward 2020 and 2030 (Malaysia) 36
Figure 2-9 Power development plan toward 2020 and 2030 (Myanmar) 40
Figure 2-10 Power development plan toward 2020 and 2030 (Philippines) 43
Figure 2-11 Power development plan toward 2020 and 2030 (Singapore) 47
Figure 2-12 Power development plan toward 2020 and 2030 (Thailand) 50
Figure 2-13 Power development plan toward 2020 and 2030 (Vietnam) 54
Figure 3-1 Economic corridor of GMS program 60
Figure 3-2 Master Plan for Grid Interconnection 65
Figure 3-3 Overview of ASEAN Power Grid 67
Figure 4-1 Overview of LP Model 72
Figure 4-2 Scenario for Interconnection 74
Figure 4-3 Comparison of Total Generation Cost in 2020 76
Figure 4-4 Comparison of Total Generation Cost in 2030 78
ix
LIST OF ABBREVIATIONS AND ACRONYMS
ACE = ASEAN Center for Energy
ADB = Asia Development Bank
AEC = ASEAN Economic Community
AFTA = ASEAN Free Trade Area
AIMS = ASEAN Interconnection Master Plan
AMEM = ASEAN Ministers on Energy Meeting
APAEC = ASEAN Plan of Action on Energy Cooperation
ASEAN = Association of Southeast Asian Nations
CCGT = Combined cycle gas turbine
CDM = Clean Development Mechanism
CO2 = Carbon dioxide
EAS = East Asia Summit
ECTF = Energy Cooperation Task Force
ERIA = Economic Research Institute for ASEAN and East Asia
GDP = Gross Domestic Product
GMS = Greater Mekong Sub-region
GW = Giga Watt
GWh = Giga Watt hour
HAPUA= The Heads of ASEAN Power Utilities / Authorities
IEEJ = The Institute for Energy Economics, Japan
MOU = Memorandum of Understanding
MW = Mega Watt
MWh = Mega Watt hour
ODA = Official Development Assistance
PDP = Power Development Plan
TW = Tera Watt hour
TWh = Tera Watt hour
WG = Working group
x
EXECUTIVE SUMMARY
CHAPTER 1
For the EAS (East Asia Summit) countries, steady large-scale power source
development in an economically efficient way is an urgent task. It may be possible to
optimize or improve the efficiency of power infrastructure investments in terms of
not only an economic efficiency but also a stability of electricity supply and
reduction of the environmental burden if we consider ways of developing power
infrastructures (power plant and grids) on a pan-regional basis.
This study will analyze the possibility and benefits of the pan-regional
optimization of power infrastructure investments in the EAS region. By doing so, the
study is intended to accelerate or support the existing initiatives such as the Asian
Development Bank (ADB) and HAPUA (the Heads of ASEAN power
Utilities/Authorities).
CHAPTER 2
This chapter presents an overview of power sector and their power infrastructure
development plan toward the time frame of 2030 in 13 countries in East Asia region,
namely Bangladesh, Brunei Darussalam, Cambodia, China [Yunnan & Guangxi],
India [North-East], Indonesia, Lao PDR, Malaysia, Myanmar, Philippines, Singapore,
Thailand, and Vietnam. The information shown in this chapter will utilized as input
data for a simulation analysis in Chapter 4.
CHAPTER 3
This chapter summarizes existing initiatives by ADB and HAPUA for the power

xi
infrastructure development in the East Asia region.
The GMS (Greater Mekong Sub-region) program is an international
development plan with the ADB as its secretariat. It was launched in October 1992
through a ministerial meeting of six countries of the Mekong River basin, Thailand,
Lao PDR, Cambodia, Myanmar, Vietnam, and China. Some goals of the GMS
countries are to establish international power trading in order to increase mutual
economic and technical benefits, and to have well-balanced power plants through
regional energy sources that enable power transport spanning countries throughout
the region.
On the other hand, the ASEAN Power Grid concept in the electric power sector
was adopted at the ASEAN summit held in Kuala Lumpur, Malaysia, in December
1997. The secretariat of the ASEAN Power Grid is HAPUA. It was confirmed that
regional power interconnection can be promoted through information exchange and
technology introduction for the planning, construction, and operation of power grids
and through basic research on power interchange.
CHAPTER 4
This chapter presents a result of quantitative analysis of power supply mix in 13
countries in East Asia.
A linear programming (LP) model was developed in order to examine the
possibility to optimize power supply mix in the East Asia region. The preconditions
(input data) for this LP model are each country’s power demand, the cross-border
trading capacity of grid, power supply capacity by fuel, generating costs by power
source, and CO2 emission factor by power source. The objective function is cost
minimization under a certain limitation of CO2 emission.
xii
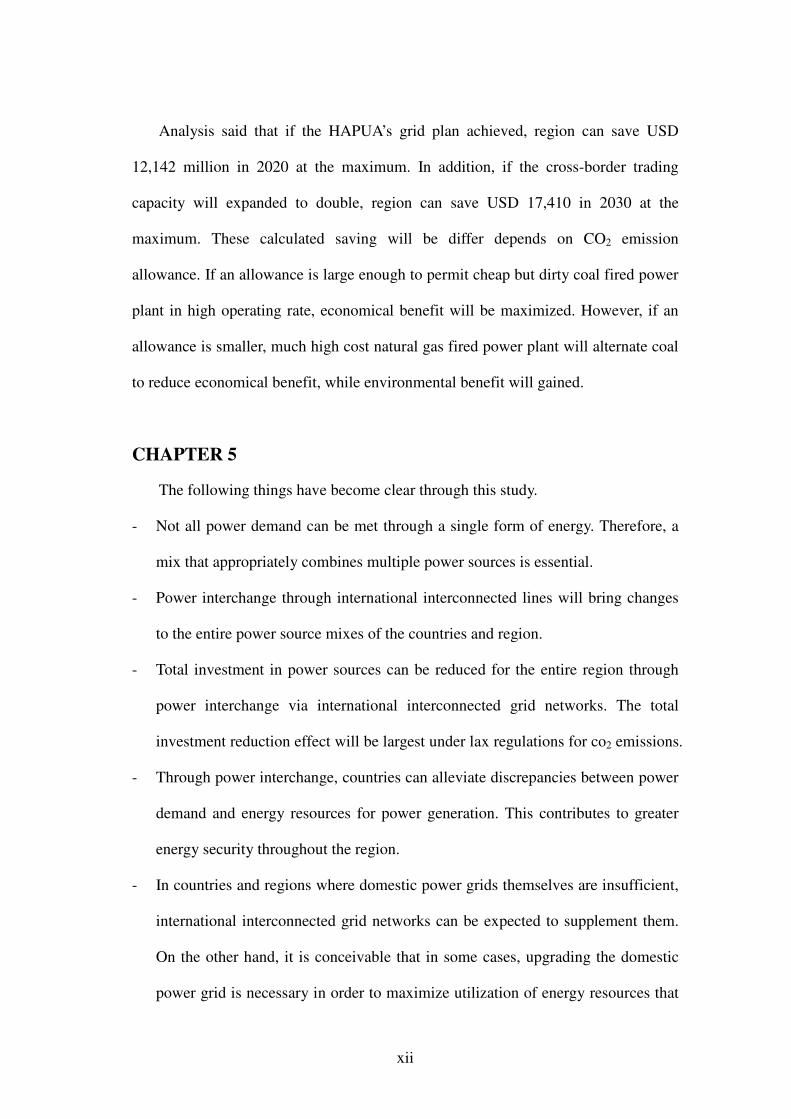
Analysis said that if the HAPUA’s grid plan achieved, region can save USD
12,142 million in 2020 at the maximum. In addition, if the cross-border trading
capacity will expanded to double, region can save USD 17,410 in 2030 at the
maximum. These calculated saving will be differ depends on CO2 emission
allowance. If an allowance is large enough to permit cheap but dirty coal fired power
plant in high operating rate, economical benefit will be maximized. However, if an
allowance is smaller, much high cost natural gas fired power plant will alternate coal
to reduce economical benefit, while environmental benefit will gained.
CHAPTER 5
The following things have become clear through this study.
- Not all power demand can be met through a single form of energy. Therefore, a
mix that appropriately combines multiple power sources is essential.
- Power interchange through international interconnected lines will bring changes
to the entire power source mixes of the countries and region.
- Total investment in power sources can be reduced for the entire region through
power interchange via international interconnected grid networks. The total
investment reduction effect will be largest under lax regulations for co2 emissions.
- Through power interchange, countries can alleviate discrepancies between power
demand and energy resources for power generation. This contributes to greater
energy security throughout the region.
- In countries and regions where domestic power grids themselves are insufficient,
international interconnected grid networks can be expected to supplement them.
On the other hand, it is conceivable that in some cases, upgrading the domestic
power grid is necessary in order to maximize utilization of energy resources that

xiii
exist in a region.
In light of the above outcomes, the following points should be borne in mind for
future power source development.
• Development of potential resources for power generation shall be quick. In a
development, it is necessary to consider the roles of each power source for the
base, middle, and peak load purpose and to combine them appropriately.
- Develop hydropower, which is economical and environmentally-friendly
(except during construction), and for which there is still much untapped
resources in the region.
- Develop coal-fired power plant, which is outstanding in terms of economy
and amount of resources, especially in China, Indonesia and Vietnam.
- Develop renewable energy that is relatively economical, such as geothermal
and biomass, except solar power.
• Energy utilization that ignores environmental impact is impossible. For power
generation as well, initiatives that move towards cleaner energy utilization
should be strengthened.
- Promote higher efficiency in coal-fired power generation. Reducing the
emission in flue gas through higher efficiency will alleviate the sole
disadvantage of coal utilization.
- Expanded use of natural gas with its outstanding environmental
performances is desirable from the perspective of reducing environmental
impact, but natural-gas-fired power plant is less economical than coal-fired.

xiv
It is, therefore, necessary to mitigate the economic disadvantage of natural-
gas-fired power plant by working to lower the procurement cost as well as
price of natural gas.
1
CHAPTER 1
Introduction
In the EAS (East Asia Summit) countries, power demand is steadily expanding
due to a population increase and economic growth. Moreover, as improving the
electrification rate is an important policy task in many countries, power demand
appears certain to increase in the future in line with a rise in living standards.
Meanwhile, as income is relatively low except for a small group of wealthy people, it
is necessary to supply electricity at minimal possible cost. Therefore, for the EAS
countries, steadily implementing large-scale power source development in an
economically efficient way is an urgent task.
Basically, a country implements power source development on the premise of
self-sufficiency. That is natural from the perspective of energy security of a country,
and it is a rational approach when demand growth is moderate and the country can
implement economically efficient power source development on its own so as to
meet the demand. However, when demand growth outstrips the capacity to supply
necessary domestic resources (manufacturing, human and financial resources) or
when economically efficient power source development is difficult due to some
constraints, such as high fuel transportation costs and power loss during transmission,
importing electricity from neighboring countries should be considered as an option.
In light of the above, it may be possible to optimize or to improve the efficiency of
power infrastructure investments in terms of supply stability, economic efficiency
and reduction of the environmental burden if we consider ways of developing power
infrastructures (power sources and grids) on a pan-regional basis.
2
In the ASEAN region, HAPUA (The Heads of ASEAN Power Utilities /
Authorities) and the Asian Development Bank are implementing initiatives related
to intra-region power grid interconnections, and bilateral power imports and exports
are ongoing. However, individual countries are still placing priority on optimization
of investments at the domestic level. Besides, power imports and exports are not
brisk enough to contribute to “power grid interconnection,” and moves toward pan-
regional optimization have been slow.
1. Rationale
The rationale of this study is derived from the 17th ECTF1 meeting held in
Phnom Penh of Cambodia on 5 July 2012. In this meeting, the ERIA explained and
proposed new ideas and initiatives for EAS energy cooperation, including the
following:
- Strategic Usage of Coal
- Optimum Electric Power Infrastructure
- Nuclear Power Safety management, and
- Smart Urban Traffic
The participants of the ECTF Meeting exchanged views on the above proposals
and agreed that it was time to consider new areas in addition to the current work
streams to reflect the dynamics of energy demand and supply in the East Asian
region. As such, the ECTF Meeting endorsed the proposed new areas and initiatives.
As a result, The Economic Research Institute for ASEAN and East Asia (ERIA)
has formulated the Working Group for the “Study on Effective Investment of Power
Infrastructure in East Asia through Power Grid Interconnection”. Members from 9
1 Energy Cooperation Task Force under the Energy Minister Meeting of EAS countries.
3
EAS countries are represented in the WG with Mr. Ichiro Kutani of the Institute of
Energy Economics, Japan (IEEJ) as the leader of the group.
2. Objective
This study will quantify the possibility and benefits of the pan-regional
optimization of power infrastructure investments in the EAS region. By doing so, the
study will provide clues for policy decisions toward the development of optimal
power infrastructures and investment decisions. In short, the study is intended to
promote power infrastructure investments or support existing initiatives including
GMS2 and APG
3.
3. Work Stream
The study consisted of four work streams for fiscal year 2012.
(A) Collection and compilation of information relating to power infrastructures
Information relating to power infrastructures in East Asia will be collected and
examined from the following perspectives:
・ Forecast of power demand
・ Power source development plans
・ Power grid investments and interconnection plans
・ Power generation and transmission costs
・ Common systems and technical standards, etc. relating to power grid
2 Greater Mekong sub-region program leaded by Asia Development Bank.
3 ASEAN Power Grid program leaded by HAPUA.
4
interconnection
When collecting information, we will pay as much attention as possible to the
results of existing initiatives relating to power grid interconnection in East Asia, such
as the initiatives of HAPUA (ASEAN Power Grid) and the ADB (Greater Mekong
Sub-region Program).
Although information will be collected through document research in principle, a
field survey may be conducted as needed.
(B) Identification of challenges and points of debate
Based on information collected as described in (A), challenges and points of
debate relating to broad-area infrastructure development in East Asia will be
identified. The following are examples of viewpoints of our analysis.
・ Entities in charge of developing power grid interconnection infrastructures
・ Costs of and financing for the development of power grid interconnection
infrastructures
・ Legal frameworks and technical standards relating to multilateral power trade
・ Incentives for power grid interconnection and the political and administrative
implementing capabilities, etc.
(C) Development of a broad-area power infrastructure simulation model and
evaluation of the simulation results
Based on information obtained as described in (A), we will develop a broad-area
power infrastructure simulation model for the EAS region. Using the developed
power grid interconnection model, we will simulate combinations of power sources
and power grid interconnections that would achieve the goals of minimizing the total
investment amount and the CO2 emission amount.
In addition, based on the simulation results, we will conduct a comparative
analysis of the simulations and existing power infrastructure development plans
5
drawn up by individual countries. The comparative analysis will be conducted from
the following viewpoints:
・ Whether it is possible to reduce the investment amount compared with existing
plans.
・ Whether it is possible to reduce the CO2 emission amount compared with
existing plans.
(D) Draw out policy recommendation
Based on study outcome from above mentioned (A), (B) and (C), we will draw out
policy recommendation to enhance effective investment of power infrastructure in
EAS region.
4. Working Group Activities in 2012
In 2012, the WG was held for 2 times in November 2012 in Jakarta, Indonesia
and April 2013 in Tokyo, Japan.
At the first meeting, information sharing and discussion regarding each country's
power source development plan took place. Additionally, issues related to existing
initiatives such as the ASEAN Power Grid and GMS were discussed.
At the second meeting, the validity of data input for simulations of optimal
energy mixes was examined, and calculation results were evaluated and discussed.

6
CHAPTER 2
Power Infrastructure Development Plan in Each Country
This chapter presents an overview of power infrastructure development plans in 13
countries in East Asia (Bangladesh, Brunei Darussalam, Cambodia, China [Yunnan
& Guangxi], India [North-East], Indonesia, Lao PDR, Malaysia, Myanmar,
Philippines, Singapore, Thailand, and Vietnam) and projections for their installed
generation capacities and power source mixes in 2020 and 2030.
1. Bangladesh's Power Development Plan
In Bangladesh, the Bangladesh Power Development Board (BPDB) and IPPs
generate electricity. The BPDB has been in unified charge of planning, construction,
and operation of national power generation, transmission, and distribution since the
nation gained independence in 1972. Electricity sector reform began in the 1990s
with the aim of introducing private capital into the sector. Conversion of existing
BPDB power plants into internal divisions and separate companies and the
participation of IPPs have progressed.
Even today, however, improvement of power plants and other power
transmission and distribution facilities in Bangladesh is notably lagging. Although
potential power demand is extremely high, the nation has been forced into chronic
power supply shortages and constant restrictions on demand. As of June 2010, the
rate of access to electricity remained at a low level, 47 percent.4 This forms an
impediment to economic growth and direct investment of foreign capital. With the
objective of raising national living standards, the Bangladeshi government aims to
increase the amount of power supplied.
4 Board of Investment, http://boi.gov.bd/key-sectors/power-industry
7
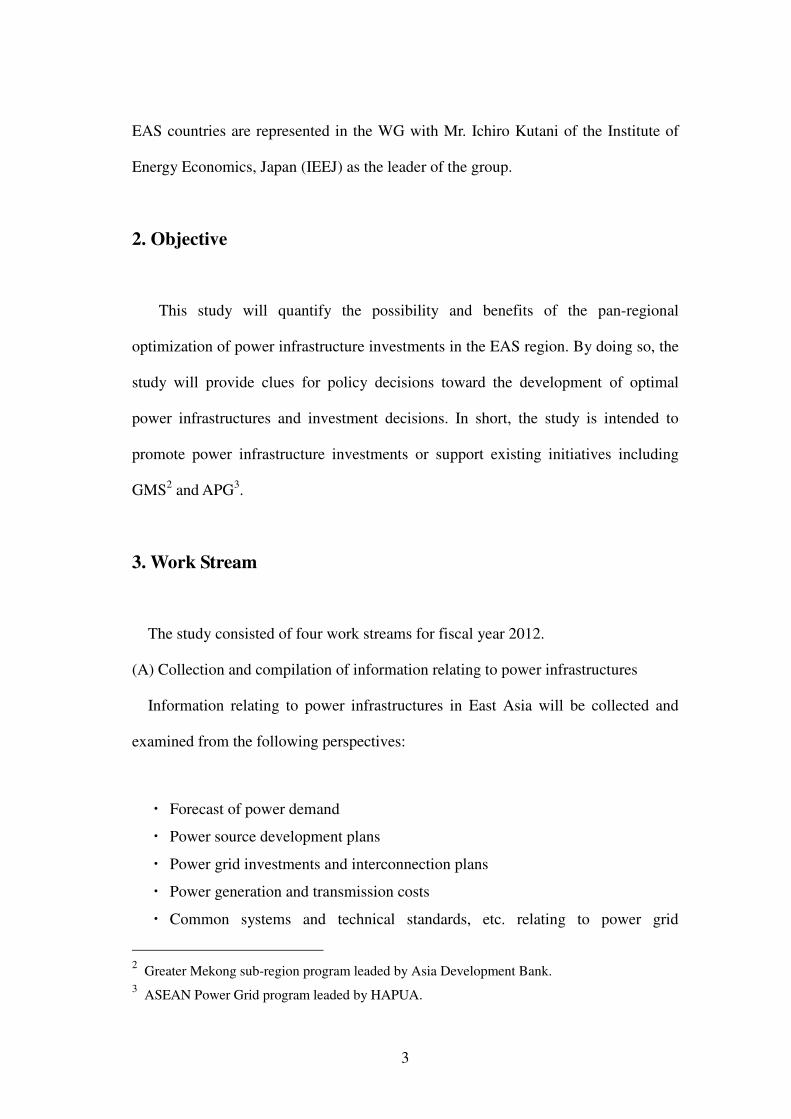
Figure 2-1: Power Development Plan toward 2020 and 2030 (Bangladesh)
0510152025303540
2011FY 2020 2030
(GW) RenewablesGeothermalDieselOilHydroCoalGasNuclear Bangladesh (GW)2011FY 2020 2030Nuclear 0.000 2.000 4.000Gas 4.863 5.427 8.850Coal 0.220 12.050 19.650Hydro 0.230 0.330 0.330Oil 0.671 0.735 1.199Diesel 0.655 0.718 1.171Geothermal 0.000 0.000 0.000Renewables 0.000 0.000 0.000Total Supply Capacity 6.639 21.260 35.200
Source: Power System Master Plan 2010.
In FY 2011, Bangladesh's generation capacity was 6,639 MW. The power source
mix was hydropower 230 MW (3.46 percent), coal-fired power 220 MW (3.31
percent), oil-fired power 671 MW (10.11 percent), diesel power 655 MW (9.87
percent), and gas-fired power 4,863 MW (73.25 percent). The power source mix
leans heavily on domestic natural gas resources.
On the other hand, development of new gas fields is lagging in Bangladesh, and
the transmission network is inadequate. Due to soaring demand accompanying
economic development, the supply and demand gap for domestic natural gas is
expanding, and already gas supply impediments are causing restrictions on power
plant operation. Diversification of the power mix is an urgent issue.
In response to this situation, the Bangladeshi government is considering
development of coal-fired power plants that use domestic and imported coal,
8
electricity imports from neighboring countries (India, Nepal, Bhutan, and Myanmar),
expanded use of renewable energy, and research on and adoption of nuclear power.
Coal, which is expected to be used as an alternative to gas, is present in the
country's northwest. There are estimated deposits of about 1.5 billion tons.5
Bangladeshi coal is generally bituminous coal, low in sulfur and ash, and well-suited
for power generation. Coal production began in Barapukuria in the north in 1994. In
2005, the Barapukuria Power Plant, Bangladesh's first coal-fired power plant, began
operation.
However, there are many issues associated with coal mining. Because most of
Bangladesh's land is a delta area on the Indian subcontinent along the Bay of Bengal,
in many places there are aquifers on top of the coal beds. When the coal is mined,
therefore, advanced technologies regarding ground subsidence and water removal are
necessary. Moreover, Bangladesh has a very high population density, and most of the
land is level, so most potential coalfields have already been developed as agricultural
or residential land. Thus, demonstrations against the displacement of residents and
the environmental impact of mining have broken out. Consensus forming in local
communities is thus a major issue.
As for the adoption of nuclear power, study and research on it has progressed on
it in terms of a power source as part of the electricity supply and in terms of
diversification of energy resources. In November 2011, Bangladesh signed an
agreement with the Russian Nuclear Energy State Corporation, ROSATOM, on
construction of a nuclear power plant with two 1,000 MW reactors. Construction is
to begin in 2013, with completion in 2018. The planned construction site is in
Rooppur, northwest of Dhaka. In addition, in September 2012, Prime Minister
Sheikh Hasina announced that in addition to the Rooppur Nuclear Power Plant on
which construction planning was advancing, another new nuclear power plant would
be built in the nation's south.6
Bangladesh's potential for hydropower generation is low. Although the nation is
crisscrossed by the Ganges, Brahmaputra River, and Meghna Rivers and their
5 Japan Electric Power Information Center, "Electric utilities in other countries, vol. 2, 2010"
6 Prime Minister’s Office, press releases, 2012.9.6

9
tributaries and branches, most of its land, except for the hilly country in the east, is
flat. There are extremely few places with the sharp changes in elevation needed for
hydropower generation. Only one hydropower plant, the Karnafuli Power Plant (five
units, total output 230 MW) in the Chittagong Hill Tracts, has been developed to date.
According to the United States Agency for International Development (USAID),
Bangladesh's hydropower generation potential is 1,897 MW. The Matamuhari and
Sangu hydropower projects are under study in the Chittagong Hill Tracts, but it is
unclear how realistic they are.
Finally, an overview of the transmission grid in Bangladesh will be presented.
The Bangladeshi power grid is divided into east and west regions along the
Brahmaputra River, which bisects the center of the country. The eastern region is
blessed with natural gas resources and hydropower that utilizes the Chittagong Hill
Tracts. Large gas-fired, combined cycle, and hydropower generation are the
backbones of the power supply. The western region, however, is poor in resources.
Oil- and diesel-fired power generation using imported fuel carries most of the supply
load. In order to correct such regional disparities, starting with fuel costs, major
substations around urban areas and two 230 kV transmission lines interconnecting
the eastern and western region are being constructed.
The country's most advanced international interconnection line is a grid
interconnection project with India's West Bengal State. A 400 kV, 125 km long
transmission line between Bheramara, Bangladesh and Baharampur, India, is under
construction. The Bangladeshi government has signed a contract to import 500 MW
of power from India via the line. In the future, it will also be possible for Bangladesh
to export power to India. Additionally, large gas fields have been discovered in
Tripura State in India's northeast. Construction of an interconnection line to import
power from gas-fired power plants in Tripura is now at the planning stage.
Furthermore, in Bangladesh's neighbors, hydropower potential is projected at
148,701 MW in India, 42,130 MW in Nepal, and 30,000 MW in Bhutan. Study of
international interconnection plans with those nations is also expected.7
7 South Asia Regional Initiative for Energy, USAID

10
2. Brunei Darussalam's Power Development Plan
Brunei Darussalam ("Brunei") achieved its independence from the UK in 1984.
It is a wealthy country, extremely stable politically and economically, with no
personal income tax, and well-developed social welfare programs including free
medical care. Supporting this stability and wealth are petroleum and natural gas. In
the past, those industries accounted for 70 percent of GDP, and today they still
account for about 50 percent. Development of petroleum and natural gas began long
ago, with production starting in 1929. Ever since, they have driven the economy.
Brunei's reserves as of the end of 2011 were estimated at 1.1 billion bbl for oil, with
an R/P of 18.2, and 300 billion m3 for natural gas, with an R/P of 22.5.
8
In order to maintain stable oil and gas production and exports over the long term,
energy policy centers on a "preservation plan." Barring special circumstances, rapid
increases in oil and gas production will be avoided, reserves will be added through
the discovery of new resources, and proven reserves will not be reduced. In recent
years, therefore, Brunei has emphasized development of its deep sea area, which will
contribute to stable long-term production. In March 2009, a six-year dispute with
Malaysia over territorial waters was resolved. The two countries' maritime borders
were finally set. A commercial agreement zone for oil and gas was arranged.
Mutually beneficial exploration and development of oil and gas resources is expected.
Exploration of mining areas in very deep waters is projected.9
Additionally, the government will proceed with joint development of new oil
and gas fields together with foreign oil companies. As for domestic energy use, the
government promotes energy conservation and diversification of energy sources. It is
developing renewable energy, installing combined cycle gas turbine (CCGT) power
plants, and campaigning for energy conservation.
Next, an overview of power supply and demand in Brunei will be presented.
Electricity supply in Brunei began with the installation in various areas of small-
scale diesel generators for home and agricultural use. After the completion of gas
supply facilities in the Seria region in 1955, in 1967 the Seria GT Power Plant,
8 BP Statistical Review of World Energy, June 2012
9 Japan-Brunei Friendship Association, Brunei News, March 18, 2009

11
Brunei's first gas turbine power plant, was installed. In conjunction with that, a 66 kV
transmission line between Seria and the capital area was completed. Subsequently, as
natural gas production increased, it was decided to convert all power plants to gas
turbines. With the exception of the Temburong region10
in the southeast, all power
plants were indeed upgraded to gas turbines. All new power plants also had gas
turbines installed.
There are two electric utilities in Brunei, the Department of Electrical Services
(DES), which is an internal organization of the Ministry of Energy (MOE), and
Berakas Power Company (BPC),11
which mainly provides the power supply to royal
palaces, the royal family, and the military. In addition, the oil and natural gas
companies Brunei Shell Petroleum (BSP), Brunei Liquefied Natural Gas (BLNG),
and Brunei Methanol Co. (BMC) also generate private power and sell their surpluses
to the DES.
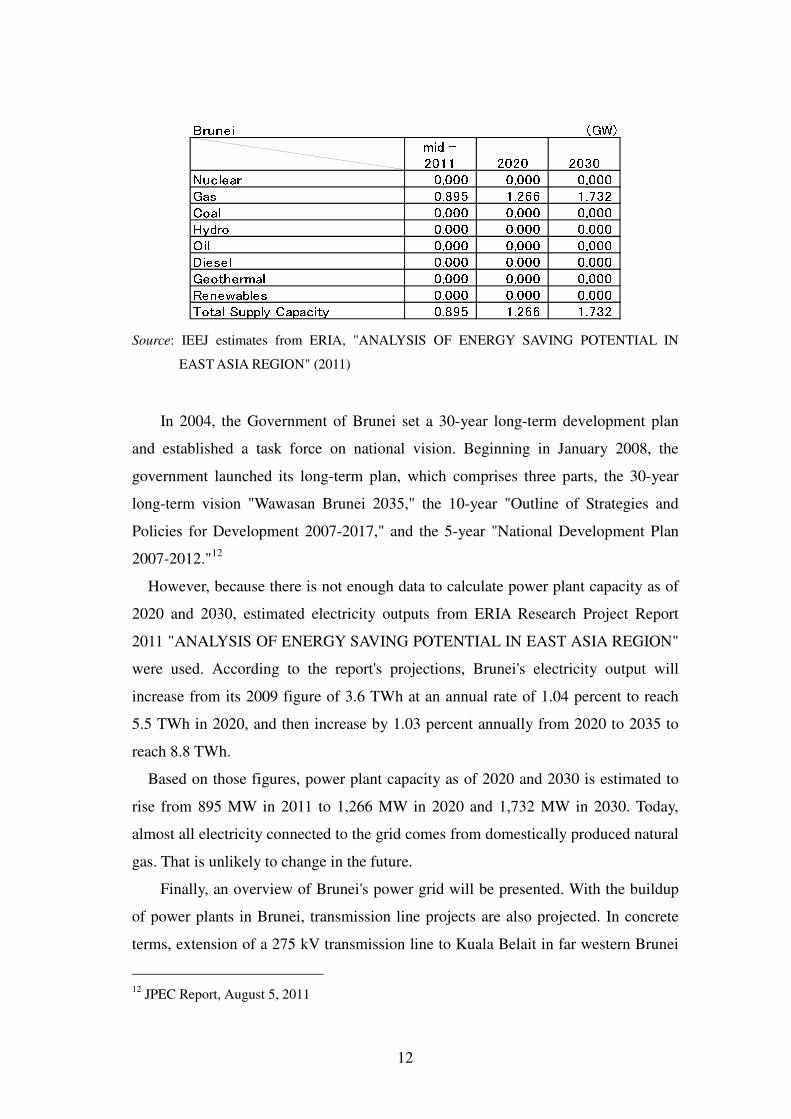
Figure 2-2: Power Development Plan toward 2020 and 2030 (Brunei)
0.000.200.400.600.801.001.201.401.601.802.00
mid - 2011 2020 2030
(GW) RenewablesGeothermalDieselOilHydroCoalGasNuclear
10
Temburong power plants are diesel power stations owned by the DES (facility capacity 6.0
MW). They are installed outside the power grid.
11 The BPC's primary purpose is to supply power to royal facilities, but it also sells excess power
to the DES.
12
Brunei (GW)mid -2011 2020 2030Nuclear 0.000 0.000 0.000Gas 0.895 1.266 1.732Coal 0.000 0.000 0.000Hydro 0.000 0.000 0.000Oil 0.000 0.000 0.000Diesel 0.000 0.000 0.000Geothermal 0.000 0.000 0.000Renewables 0.000 0.000 0.000Total Supply Capacity 0.895 1.266 1.732
Source: IEEJ estimates from ERIA, "ANALYSIS OF ENERGY SAVING POTENTIAL IN
EAST ASIA REGION" (2011)
In 2004, the Government of Brunei set a 30-year long-term development plan
and established a task force on national vision. Beginning in January 2008, the
government launched its long-term plan, which comprises three parts, the 30-year
long-term vision "Wawasan Brunei 2035," the 10-year "Outline of Strategies and
Policies for Development 2007-2017," and the 5-year "National Development Plan
2007-2012."12
However, because there is not enough data to calculate power plant capacity as of
2020 and 2030, estimated electricity outputs from ERIA Research Project Report
2011 "ANALYSIS OF ENERGY SAVING POTENTIAL IN EAST ASIA REGION"
were used. According to the report's projections, Brunei's electricity output will
increase from its 2009 figure of 3.6 TWh at an annual rate of 1.04 percent to reach
5.5 TWh in 2020, and then increase by 1.03 percent annually from 2020 to 2035 to
reach 8.8 TWh.
Based on those figures, power plant capacity as of 2020 and 2030 is estimated to
rise from 895 MW in 2011 to 1,266 MW in 2020 and 1,732 MW in 2030. Today,
almost all electricity connected to the grid comes from domestically produced natural
gas. That is unlikely to change in the future.
Finally, an overview of Brunei's power grid will be presented. With the buildup
of power plants in Brunei, transmission line projects are also projected. In concrete
terms, extension of a 275 kV transmission line to Kuala Belait in far western Brunei
12
JPEC Report, August 5, 2011

13
and interconnection with Sarawak Electricity Supply Corporation (SESCO) in
Malaysia is progressing.13
SESCO's 275 kV transmission line reaches the Tudan
substation just outside Brunei. Kuala Belait, Brunei, and Tudan are to be
interconnected. This interconnection project has been presented to a HAPUA
subcommittee. Future interconnection to Sabah, Malaysia, Kalimantan, Indonesia,
and the Philippines is being studied.
3. Cambodia's Power Development Plan
In Cambodia, in the national "Rectangular Strategy" for economic development,
development of power infrastructure is a high-priority strategy. Sustainable and
steady electricity sector development at accessible prices and economical and
environmentally-friendly power facility development are to be carried out.
Today, however, regions with an electricity supply are limited to the capital and
major cities. Electrification has yet to reach many areas. Nationally, about 20 percent
of households have electricity. In cities, about 80 percent have it, but in rural areas,
only about 10 percent do. Even in areas with a nominal electricity supply, many
factories, hotels, and so on get their power from their own generators. Thus, potential
power demand is likely to be quite large. It is therefore necessary to improve the
development situation for generation and distribution facilities to supply inexpensive,
stable power.14
Cambodia has hydropower, oil, natural gas, lignite, etc., but none of them have
been adequately developed. Over 90 percent of the country's electricity output is
generated using diesel, which has kept electricity charges high.
The impact of the civil war that started in 1970 and lasted about 20 years kept
both technical prowess and financial power low. The hydropower plants now
operating are O Chum 2 (1 MW) and Kirirom 1 (12 MW), and Kamchay Power
Station (195 MW), which went into operation on December 7, 2011. The Kamchay
Power Station, constructed on the Kamchay River in southern Cambodia, was
13
Japan Electric Power Information Center, "Electric utilities in other countries, vol. 2, 2010"
14 Japan Electric Power Information Center, January 2009

14
constructed at a total cost of 280 million US$. The Sinohydro Group, which also
built the Three Gorges Dam, the world's largest, carried out the construction.15
Cambodia is surrounded by highlands and has many rivers, including the
Mekong River. It therefore has high expectations for domestic hydropower
development, for which the potential is considered high. According to the Asian
Development Bank, Cambodian hydropower resources that can be economically
developed are approximately 8,600 MW. That includes 6,500 MW on the main
Mekong River, 1,100 MW on tributaries, and 1,000 MW not on the Mekong River.
The Ministry of Industry, Mines, Energy (MIME), on the other hand, estimates the
potential at 10,000 MW (5,000 MW on the main Mekong River, 4,000 MW on
tributaries, and 1,000 MW not on the Mekong River). The Electricity Authority of
Cambodia estimates the hydropower potential that it is technically possible to
develop at 6,700 MW (broken down the same as above at 3,580 MW, 1,770 MW, and
1,340 MW).
Figure 2-3: Power Development Plan toward 2020 and 2030 (Cambodia)
024681012
2011 2020 2030
(GW) RenewablesGeothermalDieselOilHydroCoalGasNuclear
15
Morningstar, December 8, 2011

15
Cambodia (GW)2011 2020 2030Nuclear - - -Gas - - -Coal 0.010 1.518 2.497Hydro 0.207 4.924 8.101Oil - - -Diesel 0.600 - -Geothermal - - -Renewables 0.002 0.002 0.002Total Supply Capacity 0.819 6.444 10.600
Source: Power Development Plan
Cambodia's power source development plan was set by Electricity Du Cambodia
(EDC) in 2008. It is progressing based on the country's long-term power supply
strategy through 2022, the "Master Plan on Power Sector Development of Kingdom
of Cambodia." The master plan sets forth the following goals.
1. Increase hydropower and coal-fired generation in addition to diesel
2. Develop a power grid interconnecting the nation
3. Electrification of outlying areas
4. Study frameworks for electricity trading with Vietnam, Thailand, Laos, and
other ASEAN nations
5. Promote commercialization and participation by private capital, and set up
electricity market competition and regulatory policy
The Ministry of Industry, Mines, Energy's (MIME) most recent "Power
Development Plan" calls for construction of 4,717 MW of hydropower and 1,508
MW of coal-fired power by 2020. If development proceeds according to plan, as of
2020 power plant capacity will be 4,924 MW hydropower and 1,518 MW coal-fired
power. Hydropower is thus projected to account for more than 75 percent of
Cambodia's total capacity. With that great improvement from the current power
source mix that heavily depends on diesel, the high electricity charges that are now
an issue are expected to fall.
On the other hand, because plans beyond 2020 are not clear, the power source mix
as of 2030 was estimated using estimated electricity output from the ERIA Research
16
Project Report 2011 "ANALYSIS OF ENERGY SAVING POTENTIAL IN EAST
ASIA REGION." According to the report, Cambodia's electricity output of 1.2 TWh
in 2009 is projected to increase to 8.2 TWh in 2020, and then increase at an annual
rate of 1.05 percent to reach 17.3 TWh in 2035. Estimation of Cambodia's power
plant capacity in 2030 based on this found an increase to 10,600 MW (with
hydropower major the main power source at 8,101 MW, and coal at 2,497 MW).
Today, Cambodia imports electricity from Thailand and Vietnam, but with the
increase in hydropower, it is projected to become an electricity exporting nation.
Finally, an overview of Cambodia's transmission grid will be touched on. Its
transmission lines are mainly in two grids only, around Phnom Penh and around
Siem Reap. Those grids are independent, unconnected to each other. The grid around
Phnom Penh is formed by a 230 kV transmission line from Vietnam via the Takeo
Substation and a 115 kV transmission line that brings power to the capital from the
Kirirom 1 hydropower plant. In 2007, a 115 kV transmission line from Thailand was
connected to the Siem Reap area, which has the nation's second highest power
demand. Other cities only have their own independent distribution grids. That is one
reason for the low rate of electrification in Cambodia.
As for international interconnection plans, the Ministry of Industry, Mines,
Energy (MIME) has set the following goals for electricity trading with neighboring
countries.
・ Cooperate on Cambodia's domestic generation and transmission plans in order
to trade electricity with neighboring countries
・ Coordinate electricity trading with neighboring countries in order to improve
supply reliability and ensure energy security
・ Facilitate power procurement in order to reduce poverty in mountainous and
border areas and to improve lives materially and psychologically
Thus, in light of estimated increases in power demand in Cambodia, it is
necessary to advance power source development plans for hydropower with its high
potential in particular, and at the same time advance plans for transmission line
expansion in terms of both domestic and international interconnection.
17
4. China's Power Development Plan
In Chinese energy policy, the National Energy Commission, which was
established in the first session of the 11th National People's Congress in March 2008,
is the decision-making body for national energy strategy. The National Energy
Administration absorbed the functions of the China Atomic Energy Authority, which
had been in charge of nuclear energy policy, and was upgraded to quasi-ministerial
status. Under the umbrella of the National Development and Reform Commission,
the National Energy Administration is in overall charge of energy administration as
the executive office of the National Energy Commission.
China's latest basic policy on energy is laid out in the "Medium- and long-term
plan for energy development (2005–2020)" (published June 2004). It is based on the
following eight policies.
1. Make energy conservation a highest priority measure and raise energy
efficiency.
2. Optimize the energy mix and adhere to an all-out development strategy for coal,
electricity, oil, natural gas, and new energy.
3. Rationally allocate energy resources development. Comprehensively consider
the rational allocation of energy production, transport, and consumption in
accordance with demand in the eastern, central, and western parts of the
country and in urban and rural areas.
4. Utilize both domestic and foreign resources.
5. Promote the progress and updating of science and technology and strengthen
scientific management.
6. Strengthen environmental protection and bear resource constraints and
environmental tolerance in mind.
7. Pay a high degree of attention to energy safety and proceed with the
diversification of the energy supply.
8. Set a security policy for energy development.
China's short- and medium-term policies are based on five-year plans that are reset
every five years. The latest (12th) plan period is 2011–2015.

18
In the "12th Five-Year Guideline on National Economic and Social
Development," announced in March 2011, the economic growth rate for the
following five years is set at 7.0 percent. By 2015, non-fossil energy is to account for
11.4 percent of primary consumption, energy consumption per GDP unit is to
decrease by 16 percent from the 2010 level, and CO2 emissions are to decrease by 17
percent from the 2010 level. The "12th Five-Year Plan for Energy Development," set
by the Managing Director Board of the State Council in October 2012, lists the
following seven items as priority areas.
① Enhancement of the exploration and development of domestic resources
② Promotion of a shift to highly efficient and clean energy
③ Promotion of reform of the means of supplying energy
④ Acceleration of the construction of facilities for energy storage and transport
and enhancement of reserves and ability to respond to emergencies
⑤ Implantation of civilian energy projects and promotion of the equalization of
urban and rural public energy services
⑥ Rational regulation of total energy consumption
⑦ Rationalization of frameworks for energy price formation in important sectors
such as electricity, coal, oil, and natural gas, and adherence to energy security
through the encouragement of private sector capital participation in the energy
sector and the deepening of international cooperation
As for projected power demand, the "12th Five-Year Plan for Energy
Development" projects that electricity consumption will rise at an average annual
growth rate of 8 percent from 4,200 TWh in 2010 to 6,150 TWh in 2015.
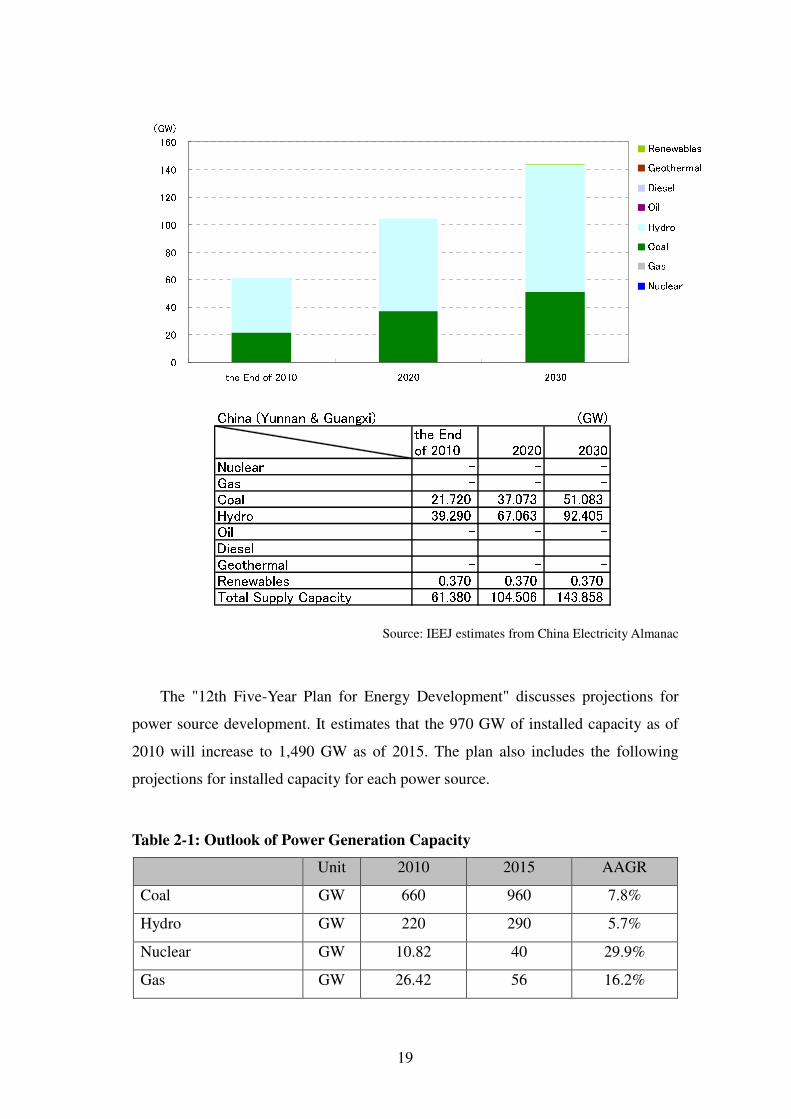
Figure 2-4: Power Development Plan toward 2020 and 2030
(China [Yunnan & Guangxi])
19
020406080100120140160
the End of 2010 2020 2030
(GW) RenewablesGeothermalDieselOilHydroCoalGasNuclear China (Yunnan & Guangxi) (GW)the Endof 2010 2020 2030Nuclear - - -Gas - - -Coal 21.720 37.073 51.083Hydro 39.290 67.063 92.405Oil - - -Diesel - - -Geothermal - - -Renewables 0.370 0.370 0.370Total Supply Capacity 61.380 104.506 143.858
Source: IEEJ estimates from China Electricity Almanac
The "12th Five-Year Plan for Energy Development" discusses projections for
power source development. It estimates that the 970 GW of installed capacity as of
2010 will increase to 1,490 GW as of 2015. The plan also includes the following
projections for installed capacity for each power source.
Table 2-1: Outlook of Power Generation Capacity
Unit 2010 2015 AAGR
Coal GW 660 960 7.8%
Hydro GW 220 290 5.7%
Nuclear GW 10.82 40 29.9%
Gas GW 26.42 56 16.2%

20
Wind GW 31.00 100 26.4%
Solar GW 0.86 21 89.5%
Total GW 970 1,490 9.0%
Source: 12th Five-Year Plan for Energy Development.
China has abundant domestic coal reserves, and generation cost is low, so coal-
fired power plants account for most power plant capacity (about 80 percent). Small
electric utilities hold about 40 percent of China's power plant capacity. Their thermal
power plants are aging and low in energy efficiency. In 2007, the National
Development and Reform Commission therefore pursued the closing of small units
and issued a "Notice of the promotion of the shutdown of small thermal power
generation" and a "Notice of the lowering of wholesale electricity rates for small
thermal power generation and the promotion of its shutdown." Additionally, 194
supercritical pressure units (as of the end of 2010) and 39 1-GW ultra-supercritical
pressure units (as of the end of 2011), which have greater generating efficiency, have
been installed. As a result of those measures, average thermal efficiency improved
from 33.3 percent in 2005 to 36.9 percent in 2010.
China has the most domestic hydropower resources of any country in the world,
with 541.64 GW technically capable of being developed. China has worked to build
small-scale hydropower plants since its founding. Today, it is proceeding with
medium- and large-scale plants, such as the Three Gorges Dam, which began
operating at its planned installed capacity (22.5 GW, the world's largest generating
capacity) in 2012. In addition, there are signs that full-fledged development may
begin on the Yarlung Tsangpo River in Tibet Autonomous Region, which has a
technically developable capacity of 67.85 GW, but where little work has been done.
China's hydropower resources are skewed towards the southwestern side of the
country. In order to transport electricity to the eastern coastal area where demand is
high, long-distance transmission lines of 1,000–2,700 km will be needed. Extra-high-
tension (800 kV) direct current transmission is therefore planned.
China is also working on the development of nuclear power. As of January 2013, it
had 16 reactors in operation and 29 under construction. Using technology from other
countries, i.e., Russia (Rosatom VVER light water reactor), the USA, (Westinghouse
21
AP1000 light water reactor), and France (AREVA EPR light water reactor), China is
rapidly proceeding with construction of nuclear facilities.
Following the Fukushima Daiichi nuclear accident in March 2011, new
construction permits for nuclear plants were frozen, but as of the end of 2012, permit
procedures had returned to normal. The "12th Five-Year Plan for Energy
Development" estimates 4,000 MW of installed capacity for nuclear power in 2015.
According to the "nuclear power medium- and long-term development plan"
announced in November 2007, installed capacity for nuclear power was to be
increased to 4,000 MW by 2020. The 12th Five-Year Plan does not address installed
capacity in 2020. Reuters and others have reported that there are plans for 58,000
MW of installed capacity as of 2020.
As for renewable energy, China has promoted the adoption of individual types,
as with the "Catch the Wind Plan" to nationalize wind power generation and the
"Lighting Process" that plans to bring electrification through wind and solar power to
non-electrified areas. The Renewable Energy Law passed in 2006 prepared basic
frameworks for development, installation, and dissemination. Under the law, 1) all
renewable energy power must be purchased, 2) wholesale electricity charges must be
approved by the government, and 3) costs are to be shifted to retail electricity
charges.
Additionally, China has adopted a renewables portfolio system (RPS) for power
producers. For producers with at least 5 GW eligible capacity (installed capacity at
wholly-owned power plants + invested power plants × investment ratio), installed
capacity of renewable energy (other than hydropower) must account for at least 3
percent of total capacity in 2010 and at least 8 percent in 2020.
The 12th five-year plan concerning the development of renewable energy,
published in August 2012, includes the following goals for renewables to be achieved
by 2015. 1) They are to account for at least 9.5 percent of primary energy demand,
and 2) 160 GW (hydropower 60 GW, wind power 70 GW, solar 20 GW, biomass 7.5
GW, etc.) of new power plant capacity is to be installed. According to the China
Wind Energy Association (CWEA), whose record on installing wind power is
remarkable, at least 10 GW of wind power generation facilities have been added
every year since 2008. At the end of 2012, there had been an increase of 14.049 GW,

22
to reach 76.413 GW. As of the end of 2012, solar power installed capacity was 7,000
MW, an increase of almost 5,000 MW since the end of 2011.
An overview of international collaboration follows below.
In addition to the Chinese territories of Hong Kong and Macao, China carries on
electricity trading with neighboring countries such as Russia, North Korea, Mongolia,
and Vietnam. However, because the scale was small, the central government was not
involved. Instead, each province's power companies carried it out on its own, and
often the objective was simply peak exchanges.
China annually imports about 300 GWh of electricity from Russia, but when the
planned direct current transmission line between the Amur River and Tianjin is
competed, power will be transmittable with small loss from Siberia's rich
hydropower resources to Beijing. In 2008, the government therefore approved a
construction project that will connect with Russia over a 500 kV transmission line.
Yunnan Province and other areas are connected with Vietnam via 220 kV and
110 kV transmission lines for electricity export. Since power demand in Yunnan is
not that high, the amount of electricity exported to Vietnam had been increasing.
However, along with the necessity of increasing transmission capacity to Guangdong
Province, balance within Yunnan has become an issue. Additionally, as will be
discussed in the Vietnam section, the Vietnamese side has been thinking that it would
like to curb electricity imports. For those reasons, it is unclear how long stable
transmission will continue.
On the other hand, China imports electricity from Myanmar over an
international collaboration line constructed between Myanmar's Shweli Hydropower
Plant and China's Dehong Substation. Under a September 2009 agreement, the
purchase price for electricity from the Shweli power plant is 0.184 yuan/kWh (about
2.9 yen/kWh).
5. India's Power Development Plan
Energy policy in India is set by the Ministry of Power based on energy five-year
plans. The Central Electricity Authority (CEA) sets detailed power source

23
development plans during each five-year period. The latest plans, published in
January 2012, are the "12th Five-Year Plan (2012-2017)"16
and the "National Energy
Plan."17
In the 12th Five Year Plan, during the 12th Period (2012-2017) and the 13th
Planning Period (2017-2022), in the base case scenario annual GDP growth is
assumed to be 9 percent, with 0.9 and 0.8 values of elasticity. In the final year of the
12th Planning Period, FY 2016 (April 2016 through March 2017, other fiscal years
below are the same), estimated total demand is 1,403 TWh. In the final year of the
13th Planning Period, FY 2021, estimated total demand is 1,993 TWh. In the base
case scenario, with load factors of 78 percent and 76 percent, peak demand values
are estimated at 197,686 MW in 2017 and 289,667 MW in 2022. For sensitivity
analysis, with the elasticity value set at 1, total demand in 2017 is estimated at 1,489
TWh, and peak demand value at 209,339 MW. These estimates are based on the 17th
Electric Power Survey (EPS), released in March 2007. According to a draft version
of the 18th EPS, total demand is 1,354 TWh, and peak demand is 199,540 MW, so
the demand estimate is about the same.
Additionally, according to the 12th Five Year Plan, for more than six years,
power demand will exceed generation capacity. In FY 2010, power fell short of total
demand by 73.236 TWh (8.5 percent) and of peak power by 12,031 MW (9.8
percent). Along with promotion of power source development, improvement of
energy efficiency and enhanced demand side management are noted as major issues.
The changes in power source development shown below are for Northeast India
(Assam, Nagaland, Meghalaya, Manipur, Tripura, Mizoram, and Arunachal Pradesh),
so the figures differ from those in the CEA plan discussed below.
16
Report of The Working Group on Power for Twelfth Plan(2012-2017), January 2012,
Government of India Ministry of Power
17 National Energy Plan, January 2012, CEA
24
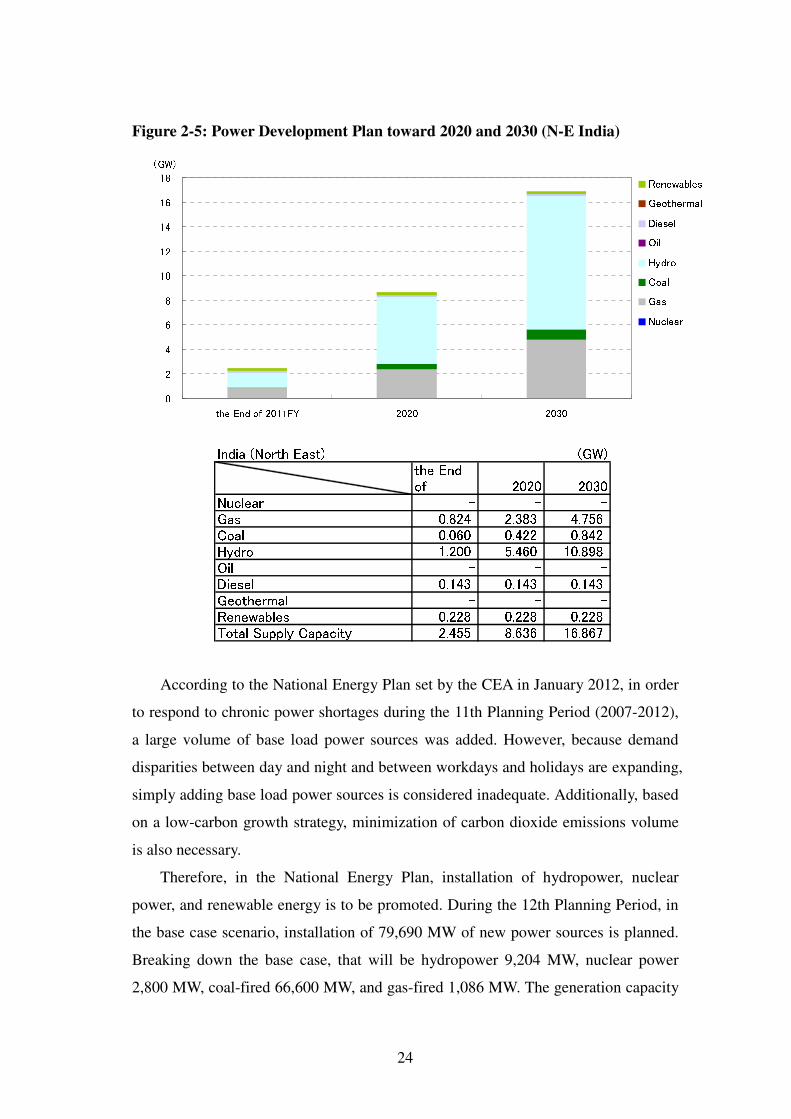
Figure 2-5: Power Development Plan toward 2020 and 2030 (N-E India)
024681012141618
the End of 2011FY 2020 2030
(GW) RenewablesGeothermalDieselOilHydroCoalGasNuclear India (North East) (GW)the End of 2020 2030Nuclear - - -Gas 0.824 2.383 4.756Coal 0.060 0.422 0.842Hydro 1.200 5.460 10.898Oil - - -Diesel 0.143 0.143 0.143Geothermal - - -Renewables 0.228 0.228 0.228Total Supply Capacity 2.455 8.636 16.867
According to the National Energy Plan set by the CEA in January 2012, in order
to respond to chronic power shortages during the 11th Planning Period (2007-2012),
a large volume of base load power sources was added. However, because demand
disparities between day and night and between workdays and holidays are expanding,
simply adding base load power sources is considered inadequate. Additionally, based
on a low-carbon growth strategy, minimization of carbon dioxide emissions volume
is also necessary.
Therefore, in the National Energy Plan, installation of hydropower, nuclear
power, and renewable energy is to be promoted. During the 12th Planning Period, in
the base case scenario, installation of 79,690 MW of new power sources is planned.
Breaking down the base case, that will be hydropower 9,204 MW, nuclear power
2,800 MW, coal-fired 66,600 MW, and gas-fired 1,086 MW. The generation capacity

25
for renewable energy is estimated separately from conventional power sources. In the
low installation case, it is 18,000 MW, and in the high installation case, it is 18,500
MW. Separately from that, 1,200 MW of electricity imports is also under
consideration, and 4,000 MW of power plant capacity will be shut down during the
period.
During the 13th Planning Period, in the base case scenario, 79,200 MW of power
sources will be installed. Broken down, that is hydropower 12,000 MW (not
including 8,040 MW imported from other countries), nuclear power 18,000 MW, and
coal-fired 49,200 MW. At least during the next 10 years, coal-fired power will be the
mainstay. Renewable energy in the low installation case will be 30,500 MW, and in
the high installation case, it will be 45,000 MW.
India is rich in domestic hydropower resources and is actively developing
hydropower plants. According to the CEA, there are 83 candidate sites that could
possibly begin operation during the 12th and 13th Planning Periods. Their total
development potential as hydropower plants is 22,011 MW. They include some on
which construction has already begun, and others where there are geographical or
environmental uncertainties. During the 12th Planning Period, 31 sites are projected
to begin operating, with an estimated 9,204 MW developed.
With no help from the international community since it carried out nuclear
testing, India has developed and installed its own heavy water reactors. Their output,
however, remains lower than that of the light water reactors in other countries. In
recent years, therefore, India has been proceeding with the construction of nuclear
power plants that adopt foreign technology. The CEA projects that four nuclear
power reactors, each a heavy water reactor with 700 MW of output and thus totaling
2,800 MW, will go into operation during the 12th Planning Period. They are
Rajasthan No. 7 and 8 and Kakrapar No. 3 and 4. No light water reactors are
projected to begin operating during the period.
In order to reduce CO2 emissions volume, the CEA intends to promote the
installation of combined cycle gas turbine (CCGT) coal-fired plants, which have a
high efficiency of about 55 percent versus the 38–40 percent efficiency of existing
coal-fired plants. In light of factors such as transmission efficiency, gas-fired power
plants should be built near demand areas.

26
During the 12th Planning Period, because of concerns over a tight coal supply
and in order to cut CO2 emissions volume, the CEA intends to install 12,000–15,000
MW of gas-fired power plants. However, of gas-fired power plants now under
construction, only 1,086 MW of them have a sure gas supply planned. That is the
estimate for the base case scenario. Of gas-fired power plants that are under
construction or completed, 13,184.5 MW of them do not have a gas supply specified
yet.
Regarding India's adoption of renewable energy, the Ministry of New and
Renewable Energy (MNRE) puts India's domestic wind power development potential
at 45,000 MW. Expectations are high. There are also other unconventional power
sources (biomass, small and micro hydropower, wave power, and solar). The MNRE
projects renewable energy to expand to a total of 183,000 MW in about 2032.
However, the CEA notes that renewable power sources cannot change output in
accordance with demand, so it is not responsive to peak power demand. In addition
to that problem, costs are higher than with conventional power sources, so (in order
to make them economically viable) their use for now should be limited to power
transmission to distant areas that would be very expensive to connect to the grid and
to the elimination of supply and demand gaps in isolated areas, etc. In order to
promote the dissemination of relatively expensive renewable energy, there are an FIT
system and subsidies for all renewable energy (wind power, small hydropower of 25
MW or less, solar, biomass, biogas, etc.).
Regarding the installation of renewable energy, the CEA estimates that in the
low installation case, during the 12th Planning Period, wind power 11,000 MW, solar
4,000 MW, and other 3,500 MW will be installed for a total of 18,500 MW, while
during the 13th Planning Period, wind power 11,000 MW, solar 16,000 MW, and
other 3,500 MW will be installed for a total of 30,500 MW. In the high installation
case, the estimate for the 12th Planning Period is wind power 15,000 MW, solar
10,000 MW, other 5,000 MW, total 30,000 MW, while for the 13th Planning Period,
it is wind power 20,000 MW, solar 20,000 MW, other 5,000 MW, total 45,000 MW.
27
An overview of international collaboration follows.
India has built good bilateral relations with Bhutan. India has constructed large
hydropower plants in Bhutan, which has abundant hydropower resources, and
imports electricity from that country. Today, Bhutan has hydropower plants in three
places (Chukha, Kurichu, and Tala), with a total output of 1,416 MW. India imports
electricity from them via international interconnection lines. Hydropower plants with
a total output of 2,940 MW are now under construction in three places
(Punatsangchhu Phases 1 and 2 and Mangdechu). The electricity generated by those
plants will also be imported by India over newly established international
interconnection lines. In addition, detailed project reports (DPRs) for six sites have
been approved or submitted, and another is being prepared. For the three competed
sites, 60 percent of the construction funds were provided by India, and the remaining
40 percent consisted of loans from India. For the projects now under construction,
60–70 percent of the funding is loans from India, and the remainder is to be provided
by India.18
Neighboring country Nepal is also projected to have abundant hydropower, and
there are plans for India to import electricity over interconnection lines. Construction
of a tie line between Dhalkebar, Nepal, and Muzaffarpur, India, is planned. The
project will cost 182.3 million dollars, with 99 million dollars to be borrowed from
international banks. According to a report from an international bank dated March
2013, a construction contract was to be signed in June 2012, but it still had not been
signed, and construction had not begun. With a transmission capacity of 1,000 MW,
operation is scheduled to begin in 2016.19
According to the CEA, in addition to the
four sites in Nepal where India is cooperating on hydropower plant construction
(Pokhra, Trisuli, Western Gandak, and Devighat), hydropower plant construction
through joint funding at four other sites is being considered.20
18
COOPERATION WITH BHUTAN, 2013/2/28, CEA
19 Nepal-India Electricity Transmission and Trade Project and South Asia - Nepal-India
Electricity Transmission and Trade Project : P115767 - Implementation Status Results Report :
Sequence 04 (2013/3/26), The World Bank
20 Indo- Nepal Cooperation in Hydro Power Sector, CEA, 2013/2/28
28
6. Indonesia's Power Development Plan
Indonesia's power development plan is the National Power General Plan
(RUKN) set by the Ministry of Energy and Mineral Resources (MEMR) for the
coming 20 years based on energy policy and environmental policy. Additionally, the
Indonesia State Electricity Company (PLN) sets the Electricity Power Supply
Business Plan (RUPTL), a detailed 10-year plan for the power supply based on the
RUKN.21
According to the "RUPTL 2011-2020," which is the power development plan for
2011 through 2020, power demand during the period is projected to grow at an
average annual rate of 8.5 percent, reaching 328.3 TWh in 2020. Maximum demand
as of 2020 is projected to be 55,053 MW, an average annual growth rate of 8.14
percent.
By region, projected demand for Java and Bali is 241.2 TWh in 2020, with an
average annual growth rate of 7.8 percent. Eastern and western Indonesia, where the
electrification rate has been low, are projected to grow at a faster rate than Java and
Bali are. Eastern Indonesia is predicted to grow at an average annual rate of 10.8
percent to 31.7 TWh in 2020. Western Indonesia is predicted to grow at an average
annual rate of 10.2 percent to 55.3 TWh in 2020.
In order to meet that demand, expansion and improvement of all facilities for
production, transmission, and distribution is essential.
21
Japan Electric Power Information Center, "FY 2010 Report on survey of electric power in
Indonesia"

29
Figure 2-6: Power development plan toward 2020 and 2030 (Indonesia)
020406080100120140160180
2011 2020 2030
(GW) RenewablesGeothermalDieselOilHydroCoalGasNuclear Indonesia (GW)2011 2020 2030Nuclear - - -Gas 18.399 18.668 33.632Coal 14.018 49.689 89.521Hydro 3.881 8.983 16.183Oil 2.250 2.250 2.250Diesel - 5.472 5.472Geothermal 1.209 7.502 13.516Renewables 0.129 0.758 0.758Total Supply Capacity 39.885 93.322 161.332
Source: Power Development Plan (MEMR)
In "RUPTL 2011-2020," a power development plan for 2011 through 2020 is
laid out in order to meet the above-mentioned power demand. Development of
53,700 MW of generating facilities by 2020 is projected. By producer, PLN accounts
for 31,376 MW (58.4 percent) and IPPs for 22,324 MW (41.6 percent).
Breaking down the power development plan through 2020 by type, coal-fired
power plants account for the majority of power plants to be built, with a total
capacity of 34,300 MW (not counting coal gasification) accounting for 63.8 percent
of the whole. Meanwhile, gas-fired power plants and combined cycle power plants
together are 7,400 MW (13.7 percent). As for renewable energy, geothermal has the
largest planned share at about 6,100 MW (11.3 percent), followed by hydropower at
around 5,700 MW (10.6 percent).
30
By producer, both PLN and IPPs will carry out development centered on coal-
fired power plants. National policy of moving away from oil and effectively utilizing
domestically produced coal is obviously reflected.
For changes in power plant capacity towards 2020 and 2030 in this study,
estimates were made based on information from the Ministry of Energy and Mineral
Resources (MEMR). According to this information, total power plant capacity as of
2020 will be 93,322 MW. Of this, the major power source of coal-fired thermal will
account for 49,689 MW. Total power plant capacity as of 2030 is projected at
161,332 MW, with coal-fired thermal increasing to 89,521 MW.
According to a 2010 report by the Ministry of Energy and Mineral Resources
(MEMR), Indonesia's coal reserves total 21.1 billion tons (9.9 billion tons in
Kalimantan and 11.2 billion in Sumatra). In light of increasing domestic demand and
the strength of inquiries from the international market, production capacity is
expected to rise. Because high-quality coal is being aggressively exported as a means
to acquire foreign currency, low-quality coal such as lignite and subbituminous coal
is the heart of the domestic supply. Therefore, if power source development is to
proceed according to plan with the focus on coal, ensuring supply and quality are
issues that must be addressed.
In terms of ensuring supply, the Indonesian government has developed a
domestic market obligation (DMO) policy. Coal producers are required to set aside a
portion of production for domestic use. Additionally, the need to improve supply
infrastructure so that the coal produced at mines can be transported to power plants
nationwide is recognized. In terms of quality, there are many issues. Low-quality
coal such as lignite and subbituminous coal has high moisture content and low heat
output, so generating efficiency is low, and CO2 emissions volume is high for the
amount of electricity generated. Expectations are therefore high for the establishment
and commercialization of clean coal technology for more efficient coal-fired power
plants.
Indonesia has abundant natural gas resources, with 164.99 Tscf. Large amounts
have been confirmed in the Natuna Islands, South Sumatra, and East Kalimantan.
However, most of those large gas fields have been tied up in export-oriented long-
term contracts. Moreover, because of booming domestic demand, an adequate supply

31
of natural gas for power plants is not projected. Expectations are therefore high for
ensuring supply capacity through steady progress on currently planned gas field
development projects and further development of gas pipelines.
The "Master plan survey on Indonesia's geothermal development" carried out by
West JEC in 2007 is a survey report on Indonesia's geothermal resources and
stockpile. According to the report, 50 sites with 9,000 MW can be developed in
Indonesia. The potential is at least 12,000 MW. In "RUPTL 2011-2020," many
geothermal power projects are included in Sumatra, Java, North Sulawesi, Nusa
Tenggara, and Maluku in particular. In Indonesia's remote areas, especially its
outlying islands, diesel generation is the most common power source. Because of
fuels costs and CO2 emissions as well, it is therefore planned to effectively utilize
what is said to be the world's greatest geothermal potential and develop geothermal
power plants as an alternative power source. For the power source plan to progress
steadily, it is expected that the government will contribute funds for development and
that CDM will be commercialized.
Indonesia also has high hydropower development potential. Nippon Koei's 2011
"Master plan survey for the development of hydropower in Indonesia" reported
finding a potential of 26,321 MW. On the so-called outer islands other than Java,
although development of large hydropower plants is possible, power demand is low
because of the population density distribution, and the cost of transmission to
demand areas is very high. Site selection for development is therefore very important.
Nuclear power is not included in the "RUPTL 2011-2020." Although nuclear
power plants are under consideration as a very promising power source to meet
Indonesia's power demand, lack of clarity on capital costs, spent fuel disposal and
storage costs, and reactor decommissioning costs is an issue. Detailed construction
plans that address multiple factors such as political issues, safety, and community
acceptance in addition to economic and energy issues have not been made clear.
Finally, an overview of international interconnection will be presented. At this
time, Indonesia has no record of electricity import/export with any neighboring
country. However, international interconnection plans with Malaysia and Singapore
are under study. As discussed above, Indonesia has a shortage of gas for domestic
consumption because of the need to maintain its gas exports to other countries.

32
Effective utilization of coal, for which abundant reserves have been confirmed, is
planned. On the other hand, most thermal power plants in Singapore burn gas
supplied by pipeline from Malaysia and Indonesia. Improvement of that skewing
towards gas firing has been raised as an issue in terms of energy security and fuel
costs. Indonesia exporting coal-fired power to Singapore is expected to optimize
power in the region. It would help Indonesia solve its domestic gas shortage because
of the export gas supply, and allow Singapore to diversify its energy sources and
lower electricity rates.
7. Laos's Power Development Plan
Laos's power development plan focuses on hydropower, except for small-scale
things not connected to the grid. Flowing out of China's Yunnan Province, the
Mekong River flows from north to south through Laos for 1,500 km. a number of
rivers flow into the Mekong from highlands such as the Annamite Range. Its
development potential is very high. It has been theoretically put at 26,000 MW or
30,000 MW, so there is enormous room left for development. As of the end of 2011,
installed capacity was 2,570 MW.
The Laotian government therefore considers hydropower projects to be an
important sector that contributes to economic growth and fighting poverty. It names
the objectives of such power source development as "ensuring a stable and adequate
power supply in the nation" and "acquisition of foreign currency through promotion
of the export of electricity from hydropower."
It is planning and attempting a basic policy of promoting IPP power source
development through the BOOT (Build, Own, Operate and Transfer) method22
is an
example of that.
As for the domestic electricity supply, in contrast, power demand areas are
scattered through mountainous land, and despite being surrounded by those abundant
water resources, many areas are geographically difficult to connect to the grid for
22
The method in which private-sector corporations undertake construction, including
procurement of funds, and, after completion, own the project for a fixed period of time, receiving
the profit from operation, and then transfer ownership.
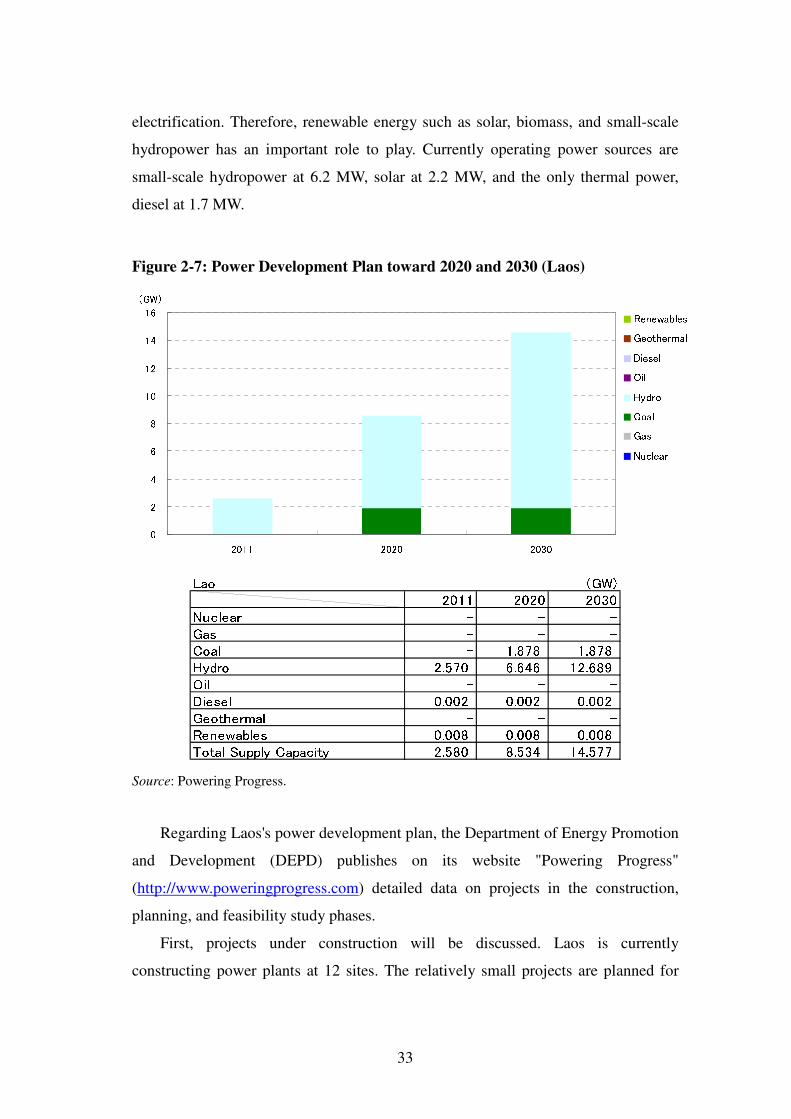
33
electrification. Therefore, renewable energy such as solar, biomass, and small-scale
hydropower has an important role to play. Currently operating power sources are
small-scale hydropower at 6.2 MW, solar at 2.2 MW, and the only thermal power,
diesel at 1.7 MW.
Figure 2-7: Power Development Plan toward 2020 and 2030 (Laos)
0246810
121416
2011 2020 2030
(GW) RenewablesGeothermalDieselOilHydroCoalGasNuclear Lao (GW)2011 2020 2030Nuclear - - -Gas - - -Coal - 1.878 1.878Hydro 2.570 6.646 12.689Oil - - -Diesel 0.002 0.002 0.002Geothermal - - -Renewables 0.008 0.008 0.008Total Supply Capacity 2.580 8.534 14.577
Source: Powering Progress.
Regarding Laos's power development plan, the Department of Energy Promotion
and Development (DEPD) publishes on its website "Powering Progress"
(http://www.poweringprogress.com) detailed data on projects in the construction,
planning, and feasibility study phases.
First, projects under construction will be discussed. Laos is currently
constructing power plants at 12 sites. The relatively small projects are planned for

34
domestic use, while the large ones are planned for electricity export. Hydropower
projects account for the majority, but the only project scheduled to be in operation in
2015 is the Hongsa Lignite power plant (1,878 MW), which will use lignite as its
energy source and become the nation's first large coal-fired power plant.
Against the background of the abundant water resources of the Mekong River
system, Laos has built hydropower generation. However, hydropower is
characterized by sharp fluctuations in output between rainy and dry seasons, so the
annual average operating rate is only 40–60 percent. If there is a dry season supply
and demand gap, Laos will have to import electricity from Thailand. Expectations are
therefore rising for the adoption of thermal-fired power as a stable base power source.
However, the Electricity Generating Authority of Thailand (EGAT) has a contract to
purchase up to 95 percent of the power plant's electricity output, so it will not be a
dramatic solution. The number one candidate for a base power source is coal-fired
thermal power using domestically produced lignite.
Regarding the Xayabouri hydropower plant (1,285 MW) under construction in
northern Laos, a ministerial-level meeting of the Mekong River Commission
(comprising Thailand, Vietnam, Cambodia, and Laos) held on December 8, 2011,
decided to postpone the construction plan and carry out environmental impact
assessment. It is now uncertain when the plant will go into operation.23
Power plant projects in the planning phase in Laos are all hydropower plants.
Twenty-five of them are listed. Construction of power plants at five sites (combined
output of 970–1,270 MW) as power sources for export to Vietnam and Thailand is in
the planning phase.
All the power plants currently in the feasibility study phase are also hydropower
plants. Including large power sources, over the medium- and long-term (from 2020
on), they will meet increases in domestic demand. At the same time, they are
expected to become an important means of foreign currency acquisition for Laos.
There are currently 35 power plant sites totaling about 7,750 MW undergoing
feasibility studies.
23
Asahi Shimbun, December 9, 2011
35
Finally, an overview of the transmission grid in Laos will be presented. Laos's
transmission lines to Thailand for electricity export include 500 kV transmission
lines from the Nam Ngum 3 and Nam Theun 2 hydropower plants, and 230 kV
transmission lines from the Thenm Hinboun and Houay Ho hydropower plants.
There are also transmission lines under 115 kV with Cambodia, China, Vietnam, and
Thailand, but none of these are interconnected to the domestic grid.
The domestic grid currently comprises only 115 kV transmission lines in the
vicinities of the capital, Vientiane, and cities in the south. According to the Ministry
of Energy and Mineral Resources (MEM), only 30–40 percent is interconnected, so
some areas have surplus electricity, while others rely on imports to supply their
power. A mix that can effectively utilize existing facilities has not been achieved.24
Laos has signed memoranda (MOUs) to sell electricity to Thailand (7,000 MW),
Cambodia (300–500 MW), and Vietnam (5,000 MW). In the future as well, against
the background of abundant water resources, electricity exports will be a pillar of
industrial policy. Export-oriented resources development through IPPs will be
promoted to acquire foreign currency. From the perspective of energy security, on the
other hand, facilitation of transmission line construction projects that can quickly
enable economical and efficient interconnection is necessary.
8. Malaysia's Power Development Plan
The energy division of the Economic Planning Unit (EPU), an organization
under the Prime Minister's Department, the highest decision-making body, is in
charge of Malaysian energy policy. The latest energy policy is the 10th
Malaysia Plan
2011-2015, announced in June 2010.25
The 10th Malaysia Plan emphasizes energy security and economic efficiency
along with environmental and social considerations. It has five strategic priorities on
energy: "Initiatives to Secure and Manage Reliable Energy Supply," "Measures to
24
Japan Electric Power Information Center, February 2009
25 The Tenth Malaysia Plan 2011-2015, Economic Planning Unit Prime Minister’s Department,
June 2011
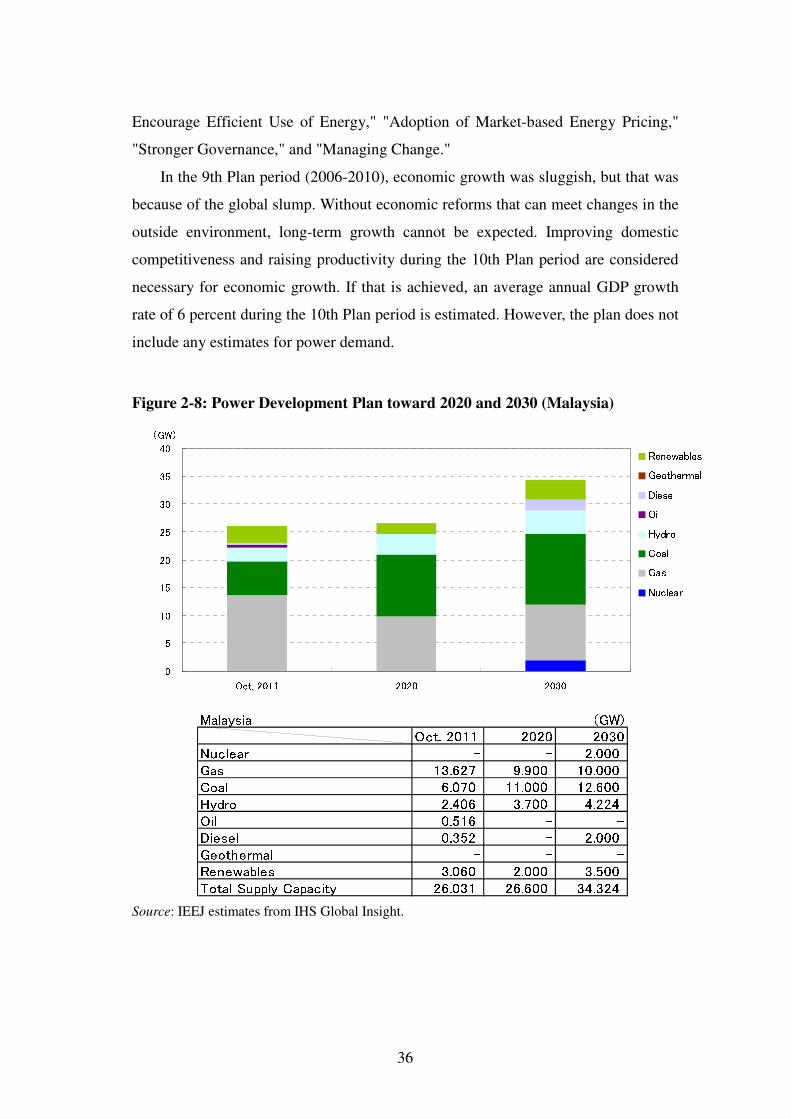
36
Encourage Efficient Use of Energy," "Adoption of Market-based Energy Pricing,"
"Stronger Governance," and "Managing Change."
In the 9th Plan period (2006-2010), economic growth was sluggish, but that was
because of the global slump. Without economic reforms that can meet changes in the
outside environment, long-term growth cannot be expected. Improving domestic
competitiveness and raising productivity during the 10th Plan period are considered
necessary for economic growth. If that is achieved, an average annual GDP growth
rate of 6 percent during the 10th Plan period is estimated. However, the plan does not
include any estimates for power demand.
Figure 2-8: Power Development Plan toward 2020 and 2030 (Malaysia)
0510152025303540
Oct. 2011 2020 2030
(GW) RenewablesGeothermalDieselOilHydroCoalGasNuclear Malaysia (GW)Oct. 2011 2020 2030Nuclear - - 2.000Gas 13.627 9.900 10.000Coal 6.070 11.000 12.600Hydro 2.406 3.700 4.224Oil 0.516 - -Diesel 0.352 - 2.000Geothermal - - -Renewables 3.060 2.000 3.500Total Supply Capacity 26.031 26.600 34.324
Source: IEEJ estimates from IHS Global Insight.

37
Regarding the development of generating facilities, the 10th Plan discusses
facilitating expanded use of existing coal and LNG-fired power plants as well as
hydropower. It also discusses construction of supercritical pressure coal-fired power
plants and beginning consideration of nuclear power. The detailed power source
development plan during the 10th Plan period is as follows.
As for hydropower, construction is progressing at Ulu Jelai and Hulu
Terengganu. Their combined output will be 662 MW. Tenaga Nasional Berhad
(TNB), the electric utility in charge of Peninsular Malaysia is carrying out the
construction. Construction of a 2,400 total MW hydropower plant at Bakun is also
progressing. Although the project was originally approved for construction in 1986, it
was temporarily halted in 1990, restarted in 1993, and then suspended again in 1997
during the Asian currency crisis. In 2002, construction restarted with Malaysia-China
Hydro (MCH) as the main construction contractor. In 2011, the generators first began
producing electricity. There has been much criticism of the project because many
residents were displaced and because of the claim that capacity is excessive in
comparison to power demand. (Power demand in Sarawak is currently about 1,000
MW.) It is reportedly planned to expand the generators to 2,400 MW in 2014.26
As for coal-fired power, TNB subsidiary TNB Janamanjung is constructing a
supercritical pressure coal-fired power plant in Janamanjung. With an electricity
output of 1,000 MW, it is scheduled to begin operating in 2015. Once it goes into
operation, it will become Southeast Asia's first 1 GW class supercritical pressure
coal-fired power plant. The main contractor is France's Alstom. According to that
company. Total project costs will be about 1 billion euros.27
As for gas-fired power, a subsidiary of the national oil company, Petronas, is
constructing the Kimanis power plant (300 MW, scheduled to begin operating in
2013), Malaysia SPR Energy is constructing the SPR power plant (100 MW,
scheduled to begin operating in 2013), and TNB is constructing the Lahad Datu
power plant (300 MW, scheduled to begin operating in 2016). All of those gas-fired
power plants are located in Sabah State.
26 Malaysia's Bakun dam online but criticisms persist, AFP, 2011/10/27
27 South East Asia’s first 1000 MW supercritical coal-fired power plant at Malaysia’s
Manjung for €1 billion, Alstom, 2011/4/4/

38
As for nuclear power, the 10th Plan clearly states it is to be considered a long-
term option. Development of nuclear power is assigned an important place in energy
security. The Malaysian government has announced that nuclear plants of 1,000 MW
each are scheduled to go online in December 2010, 2021, and 2022. In January 2013,
after the Fukushima Daiichi nuclear accident, Malaysia Nuclear Power Corporation
CEO Mohd Zamzam Jaafar stated that feasibility studies for power plant construction
would be six months late, and that construction of the first nuclear power plant in
Malaysia is expected to begin in 2021. It is unclear what effect the accident has had
on the plans.
Renewable energy is positioned as a "fifth fuel" to supplement conventional
energy resources (oil, natural gas, hydropower, and coal) and its use is promoted.
During the 9th Plan period, however, installation of renewable energy power plant
capacity fell well below targets. As of 2009, installed capacity was only 41.5 MW
(<1%). The 10th Plan therefore sets out a plan to bring renewable energy power plant
capacity up to 985 MW (5.5 percent). An FIT system has been operating since
December 2011. The government agency in charge of the FIT system, the
Sustainable Energy Development Authority (SEDA), has established a "renewable
energy fund" for the operation of the system and the collection of surcharges. The
fund is used to pay power companies the difference from their average generating
costs. The source of the fund is a 1 percent surcharge on the electric bills of
consumers who use more than 300 kWh in a month. The goals for renewable energy
adoption are 985 MW/5.4 GWh in 2015, 2,080 MW/11.3 GWh in 2020, 4,000
MW/17.2 GWh in 2030, and 21.4 GW/44.2 GWh in 2050.
An overview of international collaboration is as follows.
Malaysia has power tie lines with Thailand and Singapore. According to
Suruhanjaya Tenaga (Malaysian Energy Commission), the amount of power exported
in 2010 was 88 GWh, and the amount imported was 0.03 GWh. Compared with
exports in 2007 (2,477 GWh), the amount has been trending down year by year.28
This is probably because, with the opening of gas pipelines from Malaysia and
28
Industri Pembekalan Elektrik di Malaysia 2010, Suruhanjaya Tenaga
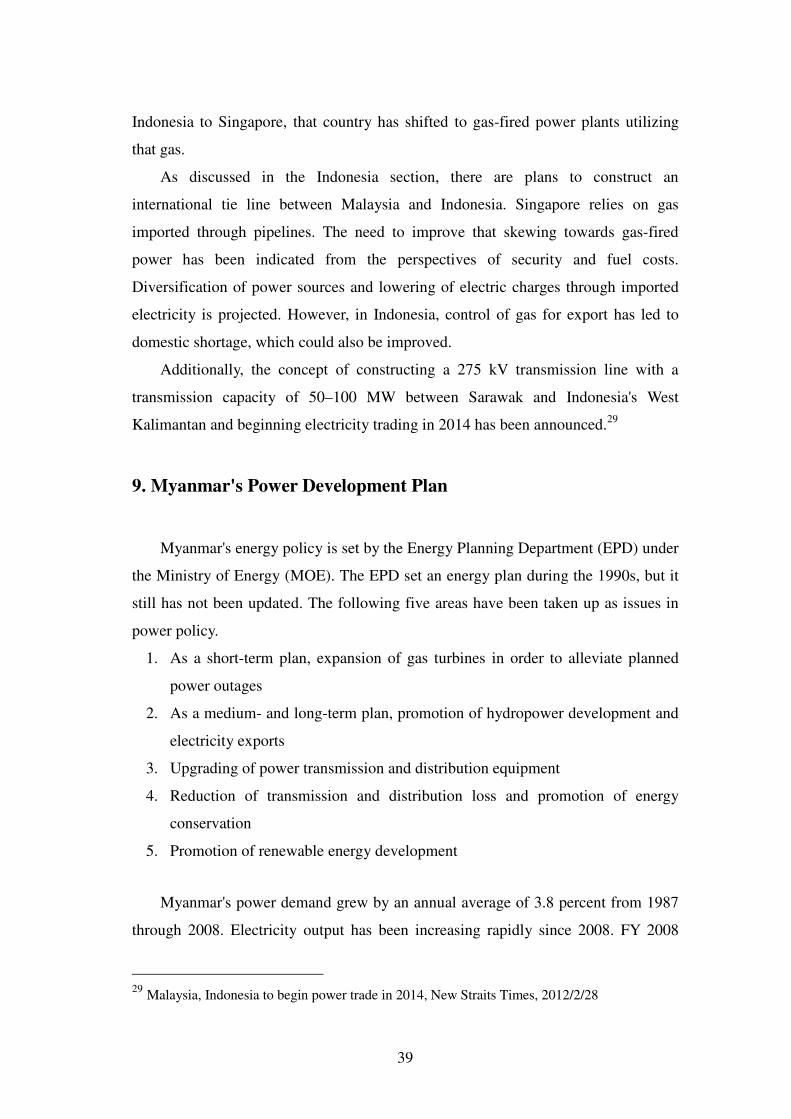
39
Indonesia to Singapore, that country has shifted to gas-fired power plants utilizing
that gas.
As discussed in the Indonesia section, there are plans to construct an
international tie line between Malaysia and Indonesia. Singapore relies on gas
imported through pipelines. The need to improve that skewing towards gas-fired
power has been indicated from the perspectives of security and fuel costs.
Diversification of power sources and lowering of electric charges through imported
electricity is projected. However, in Indonesia, control of gas for export has led to
domestic shortage, which could also be improved.
Additionally, the concept of constructing a 275 kV transmission line with a
transmission capacity of 50–100 MW between Sarawak and Indonesia's West
Kalimantan and beginning electricity trading in 2014 has been announced.29
9. Myanmar's Power Development Plan
Myanmar's energy policy is set by the Energy Planning Department (EPD) under
the Ministry of Energy (MOE). The EPD set an energy plan during the 1990s, but it
still has not been updated. The following five areas have been taken up as issues in
power policy.
1. As a short-term plan, expansion of gas turbines in order to alleviate planned
power outages
2. As a medium- and long-term plan, promotion of hydropower development and
electricity exports
3. Upgrading of power transmission and distribution equipment
4. Reduction of transmission and distribution loss and promotion of energy
conservation
5. Promotion of renewable energy development
Myanmar's power demand grew by an annual average of 3.8 percent from 1987
through 2008. Electricity output has been increasing rapidly since 2008. FY 2008
29
Malaysia, Indonesia to begin power trade in 2014, New Straits Times, 2012/2/28
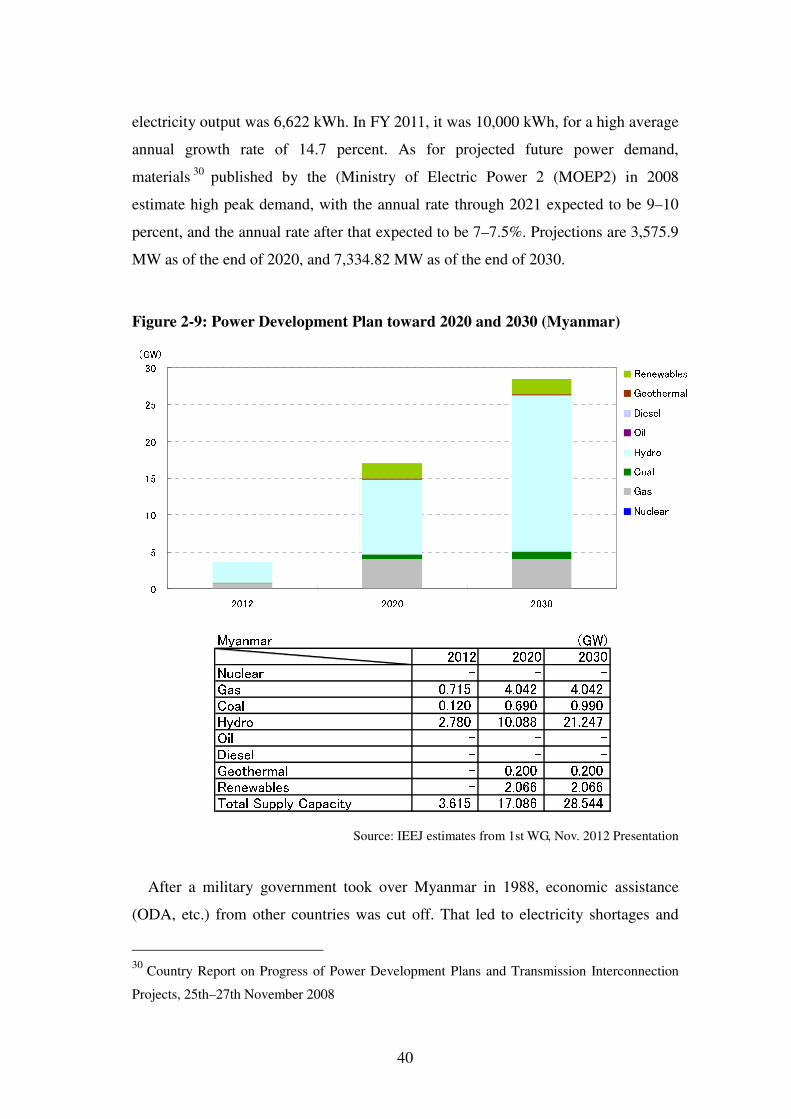
40
electricity output was 6,622 kWh. In FY 2011, it was 10,000 kWh, for a high average
annual growth rate of 14.7 percent. As for projected future power demand,
materials30
published by the (Ministry of Electric Power 2 (MOEP2) in 2008
estimate high peak demand, with the annual rate through 2021 expected to be 9–10
percent, and the annual rate after that expected to be 7–7.5%. Projections are 3,575.9
MW as of the end of 2020, and 7,334.82 MW as of the end of 2030.
Figure 2-9: Power Development Plan toward 2020 and 2030 (Myanmar)
051015202530
2012 2020 2030
(GW) RenewablesGeothermalDieselOilHydroCoalGasNuclear Myanmar (GW)2012 2020 2030Nuclear - - -Gas 0.715 4.042 4.042Coal 0.120 0.690 0.990Hydro 2.780 10.088 21.247Oil - - -Diesel - - -Geothermal - 0.200 0.200Renewables - 2.066 2.066Total Supply Capacity 3.615 17.086 28.544
Source: IEEJ estimates from 1st WG, Nov. 2012 Presentation
After a military government took over Myanmar in 1988, economic assistance
(ODA, etc.) from other countries was cut off. That led to electricity shortages and
30
Country Report on Progress of Power Development Plans and Transmission Interconnection
Projects, 25th–27th November 2008

41
ongoing supply restrictions. Efficient power source development is therefore
important. Since large gas fields were discovered in 1992, gas turbine power plants,
which require only short construction periods, have been built and subsequently
converted to combined cycle in an effort to shorten power outages. During that time,
development of hydropower plants was promoted with the aim of ending electricity
shortages. Today, natural gas exports are seen as an important means of foreign
currency acquisition, and effort is being put into hydropower development.
Myanmar's domestic hydropower resources are vast. Theoretical hydropower
plant development potential is estimated at 10.8 GW. Of that, economically
developable capacity is estimated to be about 43.45 GW., Development is promising
for the Thanlwin River, the Ayeyarwady River, the Chindwin River basin, the Shan
Highlands, the Arakan Mountains, and thee southern peninsula area.
With ODA cut off, development of hydropower resources stagnated. In recent
years, however, development has shifted into high gear through economic
cooperation and direct investment from China and Thailand. Including those based
on bilateral cooperation, development of hydropower plants is planned for 18 sites
(total output 31,059 MW). The largest plan, a joint venture with China Power
Investment Corp, is a project to put seven generators with a total output of 16,500
MW on the upper Ayeyarwady River. The first generator is expected to go into
operation around 2015. Additionally, joint development with China of hydropower
plants in Shweli and Dapein is planned. With a Thailand’s corporation and the
Ministry of Electric Power 1 (MOEP1) have formed a joint venture company that is
developing hydropower plants in Ta Sang and Taninthayi. In Hutgyi, a joint
feasibility study with Thailand was completed in 2007. With India, a memorandum
of understanding (MOU) on development of a hydropower plant in Tamanthi was
signed with the National Hydroelectric Power Corporation (NHPC) in 2008. The
plan calls for development of six 200 MW hydropower plants for a total of 1,200
MW. The objectives of constructing the Tamanthi power plants include flood
prevention and control. In addition, domestic IPPs have signed MOUs for
development of hydropower plants in Thaukyegat, Baluchaung, Saidin, and Upper
Baluchaung.

42
Inside Myanmar, exploration for oil fields on land began during the 1960s. No
major fields were discovered, however, and production volume from land-based oil
and gas fields is trending downwards. Exploration of offshore oil fields beginning in
the 1970s, however, led to the 1992 discovery of vast gas fields. Full-fledged gas
production began at the Yadana gas field in 1998 and at the Yetagun gas field in 2000.
The gas produced at those gas fields, in addition to being piped into the domestic
supply (Yadana gas field), is also exported to Thailand (Yadana/Yetagun gas fields).
It has become a means for Myanmar to acquire foreign currency. As discussed above,
in order to meet power demand, construction of gas-fired power plants has been
underway since 1992, but because gas exports are given priority, operation must be
coordinated depending on availability of fuel. No more power plants using natural
gas can be constructed.
The state of international collaboration on power lines is as follows.
There is a 188 km international tie line between Myanmar's Shweli power plant
and China's Dehong substation. Under a September 2009 agreement, the purchase
price for electricity from the Shweli power plant is 0.184 yuan/kWh (about 2.9
yen/kWh). In addition, there are small-scale electricity import lines from China and
Thailand. Electricity imported from China costs about 1.2–1.5 yuan/kWh (19–24
yen/kWh), and that from Thailand costs about 4.5–6.25 baht/kWh (15–21 yen/kWh).
Electricity exports to India re also planned. Electricity produced at the Tamanthi
power plant that is a joint venture with the NHPC, is to be exported to India via
international tie line. Construction of new transmission lines is therefore planned.
10. Philippines' Power Development Plan
In the Philippines, the Department of Energy (DOE) has overall jurisdiction over
energy policy. It is responsible for setting, implementing, and managing all plans in
the energy sector. It promotes exploration, development, and use of energy resources
and encourages energy conservation. The latest energy plan is the (2012-2030
Philippine Energy Plan (PEP 2012-2030). The latest power development plan is
Power Development Plan 2009-203031
(PDP 2009-2030).
31
Although it has not been published on the DOE website, a draft version of PDP 2010-2030
(Power Development Plan 2010-2030) was referred to as appropriate.
43
Major measures in the PEP 2012-2030 include "securing energy security"
through expanded use of renewable energy and development of oil and coal
resources, "expansion of energy supply access" through technology, and "promotion
of a low-carbon society" through efficient energy utilization and clean fuel
technology.
As for projected power demand, according to the PDP 2009-2030, the DOE
estimates electricity output at 55,417 GWh as of 2008, 86,809 GWh as of 2018, and
149,067 GWh as of 2030. By region, the DOE predicts power demand in the Luzon
islands (region) will grow at 4.53% annually to reach 109,477 GWh in 2030, demand
in the Visayas islands will have a slightly faster average annual growth rate of 5% to
reach 19,121 GWh in 2030, and demand in the Mindanao islands will grow at an
average of 4.62% annually to reach 20,470 GWh in 2030.
Figure 2-10: Power development plan toward 2020 and 2030 (Philippines)
05101520253035
2010 2020 2030
(GW) RenewablesGeothermalDieselOilHydroCoalGasNuclear Philippines (GW)2010 2020 2030Nuclear - - -Gas 2.861 4.961 7.061Coal 4.867 5.627 8.972Hydro 3.400 4.112 6.605Oil 0.650 0.650 0.650Diesel 2.543 3.443 5.943Geothermal 1.966 2.295 3.559Renewables 0.073 0.072 0.072Total Supply Capacity 16.360 21.160 32.862
Source: IEEJ estimates from Draft PDP 2010-2030.

44
According to the PDP 2009-2030, by running simulations based on the above
demand forecasts, the DOE calculates that 17 GW of power source development will
be necessary by 2030. However, the only power plants development plans to which
commitments have been made are two in the Luzon islands (600 MW), one in the
Visayas islands (100 MW), and three in the Mindanao islands (258 MW), for a total
of 958 MW. New plans are needed to make up the difference. The DOE calculates
that the capacity that must be installed is 11,900 MW in the Luzon islands, 2,150
MW in the Visayas islands, and 2,500 MW in the Mindanao islands.
In the past, the National Power Corporation (NPC) carried out power plant
development in the Philippines on an exclusive basis. Participation by independent
power producers (IPPs) has been permitted since 1993, and the NPC has been selling
off assets, so the NPC's share of electricity output has fallen sharply from 68.1% in
2001 to 14.5 percent in 2010. IPPs now handle most power source development as
well.
The DOE estimates hydropower potential in the Philippines at 13,100 MW.
However, a total of only 3,400 MW has been developed so far, so there is still much
development left. The government's policy is to develop hydropower as part of its
renewable energy development. It plans to increase hydropower to 7,530 MW by
2030. There are many issues in hydropower development. In the Luzon islands, the
division between the summer season and the rainy season makes it easy for droughts
to occur. In the Mindanao islands, which depend on hydropower for over 50 percent
of their power, abnormal weather in early 2010 forced daily power outages of 5–8
hours.
As of 2000, there were about 5,000 MW of oil-fired power plants (including
diesel). Through the closing of aging facilities and so on, that fell to about 2,000 MW
as of 2010.
For the sake of energy self-sufficiency, the government promotes the opening of
gas fields. Production volume as of 2009 was 35 billion cf; the plan is to increase that
to 2.694 trillion cf by 2030. Natural gas from the Malampaya gas fields has since
2001 been supplied via pipeline to gas-fired power plants in the Luzon islands and
Batangas State. Currently, 2,861 MW of gas-fired power plants are in operation. First
Gen Corp. plans to build a 500 MW (ultimately, 1,300 MW) gas-fired power plant in

45
San Gabriel.32
Additionally, Energy World Corp. plans to build an LNG terminal in
Pagbliao, along with a 300 MW gas-fired power plant.33
The Philippine government is pushing the development of coal resources as an
alternative to oil. It intends to increase annual production volume to 2.5 times as
much (about 1.2 million tons) by 2030. The installed capacity of coal-fired power
plants as of the end of 2000 was 3,963 MW. As of 2010, it had gradually increased to
4,867 MW. Development of coal-fired power plants continues. In 2012, GN Power
Ltd. began operating a 600 MW coal-fired plant in Bataan on Luzon.
The Philippines has an estimated 4,790 MW of geothermal resources.
Generating cost is the least expensive after hydropower, and utilization ratio is high,
so it is utilized an important base power source. As of 2010, there were geothermal
power plants at 10 locations in the Philippines, with total installed capacity of 1,996
MW, the second most in the world. The Philippine government plans to continue
developing geothermal power, to raise installed capacity to 3,450 MW by 2030.
The Philippines decided to build a nuclear plant in Bataan. Construction began
in 1976 and was completed in 1984. However, numerous defects were found, and in
light of the Chernobyl disaster, it was mothballed rather than going into operation. In
2010, however, although nuclear power itself was not abandoned, a final decision
was made to never use the Bataan nuclear power plant. How to use it, including
possible sale, is under consideration.
As for renewable energy, in 2008, the government set out the National
Renewable Energy Program (NREP) and passed the Renewable Energy Law.
According to NREP, installed capacity of renewable energy is to be doubled from its
5,300 MW in 2008 by 2030. Therefore, a corporate income tax exemption (7 years),
an exemption on duties on imported equipment (10 years), and a reduction of
property taxes have been adopted along with a feed-in tariff (FIT) system beginning
in 2010.
As for international collaboration, the Philippines is an island nation far from its
neighbors, so at this time it has no electric tie lines with any of them.
32
First Gen unveils $2.3-b expansion, Manila Standard Today, 2013/3/4
33 Under Development – Philippines, Energy World HP, http://www.energyworldcorp.com/ud-
phil.html
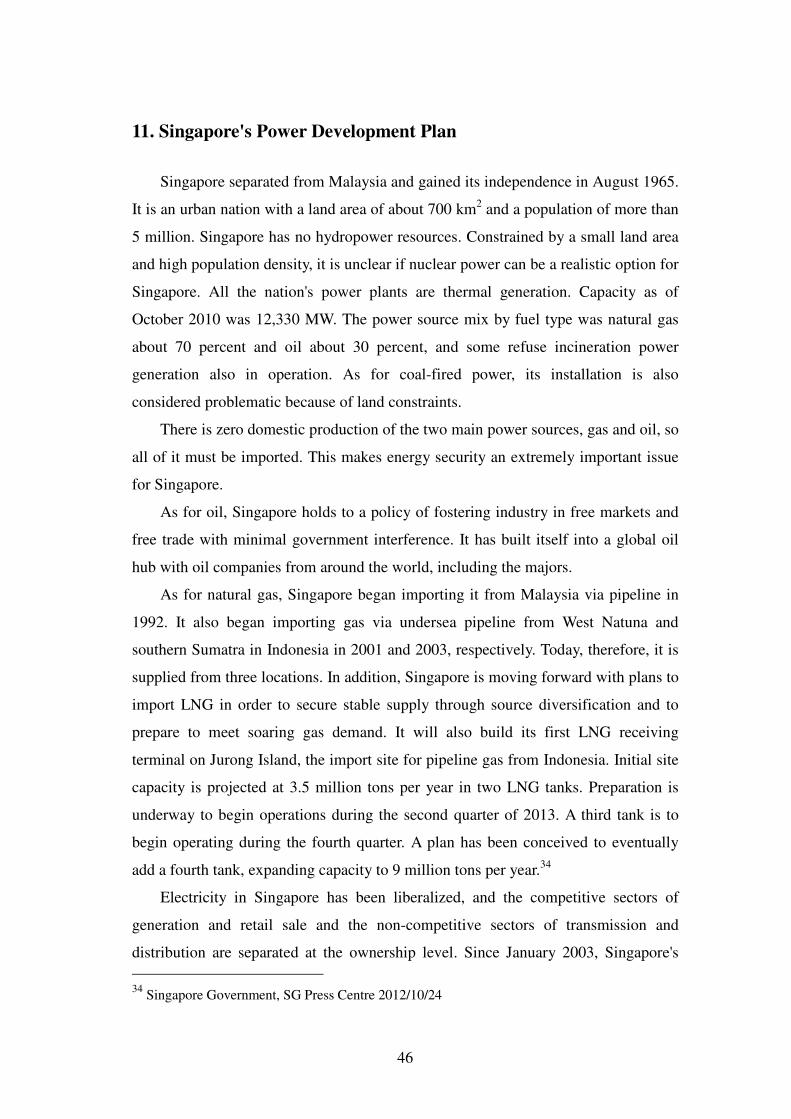
46
11. Singapore's Power Development Plan
Singapore separated from Malaysia and gained its independence in August 1965.
It is an urban nation with a land area of about 700 km2 and a population of more than
5 million. Singapore has no hydropower resources. Constrained by a small land area
and high population density, it is unclear if nuclear power can be a realistic option for
Singapore. All the nation's power plants are thermal generation. Capacity as of
October 2010 was 12,330 MW. The power source mix by fuel type was natural gas
about 70 percent and oil about 30 percent, and some refuse incineration power
generation also in operation. As for coal-fired power, its installation is also
considered problematic because of land constraints.
There is zero domestic production of the two main power sources, gas and oil, so
all of it must be imported. This makes energy security an extremely important issue
for Singapore.
As for oil, Singapore holds to a policy of fostering industry in free markets and
free trade with minimal government interference. It has built itself into a global oil
hub with oil companies from around the world, including the majors.
As for natural gas, Singapore began importing it from Malaysia via pipeline in
1992. It also began importing gas via undersea pipeline from West Natuna and
southern Sumatra in Indonesia in 2001 and 2003, respectively. Today, therefore, it is
supplied from three locations. In addition, Singapore is moving forward with plans to
import LNG in order to secure stable supply through source diversification and to
prepare to meet soaring gas demand. It will also build its first LNG receiving
terminal on Jurong Island, the import site for pipeline gas from Indonesia. Initial site
capacity is projected at 3.5 million tons per year in two LNG tanks. Preparation is
underway to begin operations during the second quarter of 2013. A third tank is to
begin operating during the fourth quarter. A plan has been conceived to eventually
add a fourth tank, expanding capacity to 9 million tons per year.34
Electricity in Singapore has been liberalized, and the competitive sectors of
generation and retail sale and the non-competitive sectors of transmission and
distribution are separated at the ownership level. Since January 2003, Singapore's
34
Singapore Government, SG Press Centre 2012/10/24
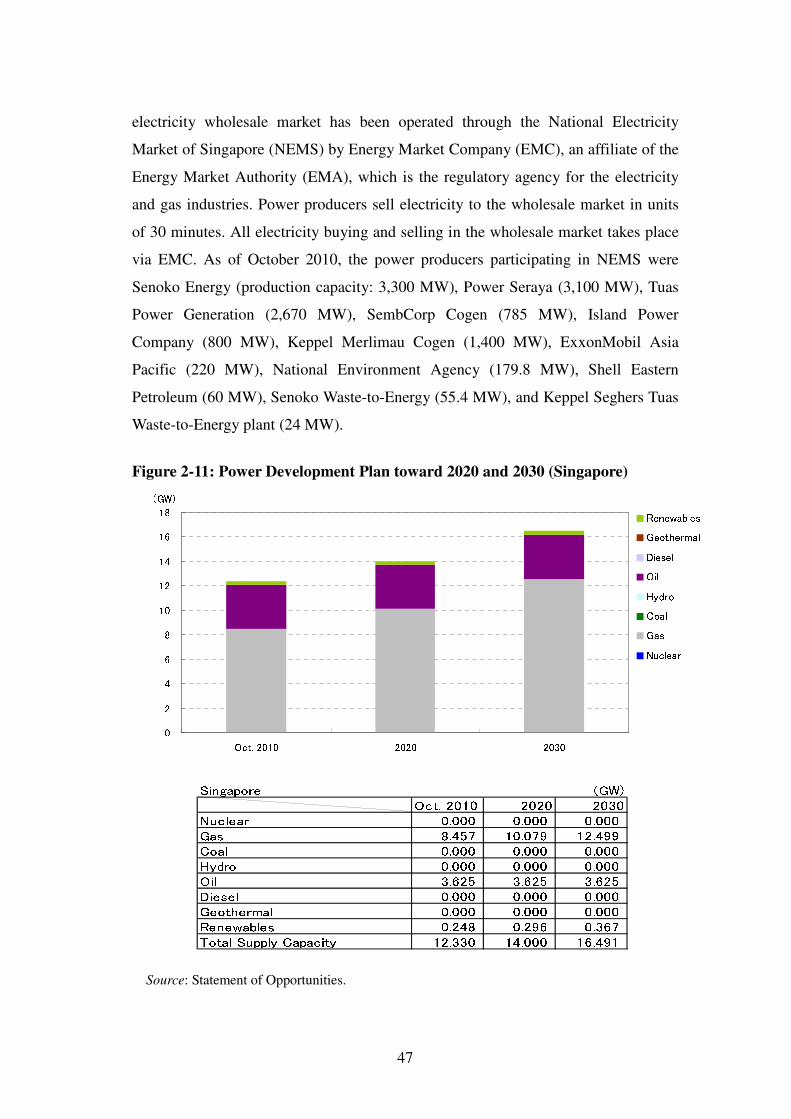
47
electricity wholesale market has been operated through the National Electricity
Market of Singapore (NEMS) by Energy Market Company (EMC), an affiliate of the
Energy Market Authority (EMA), which is the regulatory agency for the electricity
and gas industries. Power producers sell electricity to the wholesale market in units
of 30 minutes. All electricity buying and selling in the wholesale market takes place
via EMC. As of October 2010, the power producers participating in NEMS were
Senoko Energy (production capacity: 3,300 MW), Power Seraya (3,100 MW), Tuas
Power Generation (2,670 MW), SembCorp Cogen (785 MW), Island Power
Company (800 MW), Keppel Merlimau Cogen (1,400 MW), ExxonMobil Asia
Pacific (220 MW), National Environment Agency (179.8 MW), Shell Eastern
Petroleum (60 MW), Senoko Waste-to-Energy (55.4 MW), and Keppel Seghers Tuas
Waste-to-Energy plant (24 MW).
Figure 2-11: Power Development Plan toward 2020 and 2030 (Singapore)
024681012141618
Oct. 2010 2020 2030
(GW) RenewablesGeothermalDieselOilHydroCoalGasNuclear Singapore (GW)Oct. 2010 2020 2030Nuclear 0.000 0.000 0.000Gas 8.457 10.079 12.499Coal 0.000 0.000 0.000Hydro 0.000 0.000 0.000Oil 3.625 3.625 3.625Diesel 0.000 0.000 0.000Geothermal 0.000 0.000 0.000Renewables 0.248 0.296 0.367Total Supply Capacity 12.330 14.000 16.491
Source: Statement of Opportunities.
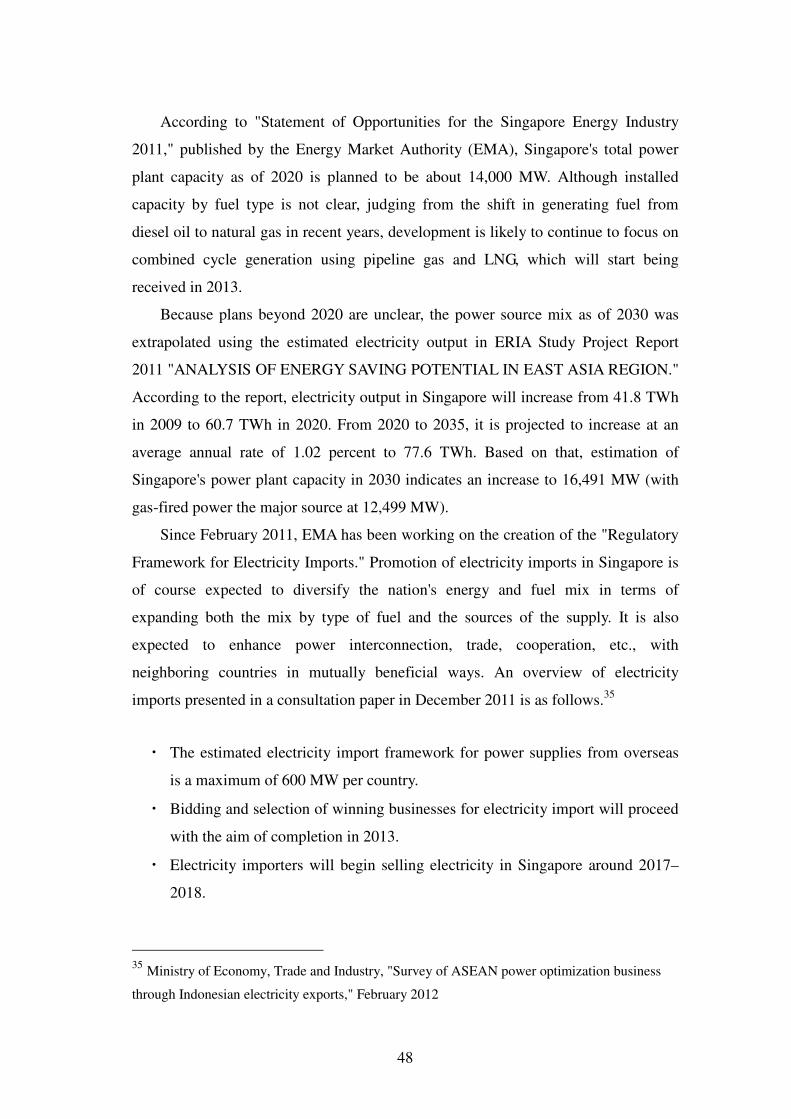
48
According to "Statement of Opportunities for the Singapore Energy Industry
2011," published by the Energy Market Authority (EMA), Singapore's total power
plant capacity as of 2020 is planned to be about 14,000 MW. Although installed
capacity by fuel type is not clear, judging from the shift in generating fuel from
diesel oil to natural gas in recent years, development is likely to continue to focus on
combined cycle generation using pipeline gas and LNG, which will start being
received in 2013.
Because plans beyond 2020 are unclear, the power source mix as of 2030 was
extrapolated using the estimated electricity output in ERIA Study Project Report
2011 "ANALYSIS OF ENERGY SAVING POTENTIAL IN EAST ASIA REGION."
According to the report, electricity output in Singapore will increase from 41.8 TWh
in 2009 to 60.7 TWh in 2020. From 2020 to 2035, it is projected to increase at an
average annual rate of 1.02 percent to 77.6 TWh. Based on that, estimation of
Singapore's power plant capacity in 2030 indicates an increase to 16,491 MW (with
gas-fired power the major source at 12,499 MW).
Since February 2011, EMA has been working on the creation of the "Regulatory
Framework for Electricity Imports." Promotion of electricity imports in Singapore is
of course expected to diversify the nation's energy and fuel mix in terms of
expanding both the mix by type of fuel and the sources of the supply. It is also
expected to enhance power interconnection, trade, cooperation, etc., with
neighboring countries in mutually beneficial ways. An overview of electricity
imports presented in a consultation paper in December 2011 is as follows.35
・ The estimated electricity import framework for power supplies from overseas
is a maximum of 600 MW per country.
・ Bidding and selection of winning businesses for electricity import will proceed
with the aim of completion in 2013.
・ Electricity importers will begin selling electricity in Singapore around 2017–
2018.
35
Ministry of Economy, Trade and Industry, "Survey of ASEAN power optimization business
through Indonesian electricity exports," February 2012

49
・ EMA will ask each bidder to bid on a contract-for-differences (CfD) price.
Imported electricity will be paid at the lower of the CfD Strike Price and the
general Pool Price.
・ The winning electricity importers will receive an electricity import license
permitting 600 MW of electricity import for 20 years.
The consultation paper expired March 30, 2012, and was made public in order to
gather comments and feedback. Preparation for bidding on electricity imports is
likely underway at this time.
12. Thailand's Power Development Plan
Against a background of steady economic growth, power demand in Thailand
has been growing at an annual average of around 5 percent. Peak demand in 2012
was about 26,000 MW, almost 10,000 MW higher than 10 years earlier. With this
growth expected to continue, ensuring supply capacity for the future is an urgent
issue. Furthermore, because of past air pollution problems, Thailand has a strong
aversion to coal-fired power. A power supply mix that is over-reliant on natural gas is
another concern. As of 2011, of Thailand's domestic power plant capacity of 30,246
MW, natural gas-fired power accounted for 21,474 MW, about 70 percent.
The Electricity Generating Authority of Thailand (EGAT) is in charge of creating
the nation's power source development plan. In April 2010, a new power source
development plan, the "SUMMARY OF THAILAND POWER DEVELOPMENT
PLAN 2010-2030 (PDP2010)," was released. Subsequently, in light of an opposition
movement by local residents, plans for development of coal-fired power were scaled
back. After the accident at Fukushima Daiichi nuclear power plant, the timing and
scale of the adoption of nuclear power were trimmed as well. Those changes were
reflected in the "SUMMARY OF THAILAND POWER DEVELOPMENT PLAN
2012-2030 (PDP2010: REVISION 3)" released in June 2012, which is now
Thailand's latest official power source development plan.
In power source development, in consideration of ensuring energy security and
clean power supply as well as addressing high fuel prices, adoption of nuclear power
50
as a new power source, fuel diversification, and increasing the volume of electricity
imports from neighboring countries are planned.
Figure 2-12: Power Development Plan toward 2020 and 2030 (Thailand)
010203040506070
2011 2020 2030
(GW) RenewablesGeothermalDieselOilHydroCoalGasNuclear Thailand (GW)2011 2020 2030Nuclear - - 2.000Gas 21.474 27.442 37.912Coal 3.955 5.886 7.387Hydro 3.436 4.086 4.130Oil 0.319 0.315 0.315Diesel 0.004 0.004 0.754Geothermal - - -Renewables 1.058 6.898 9.558Total Supply Capacity 30.246 44.631 62.056
Source: PDP2010 Revision 3
According to "PDP2010: REVISION 3," Thailand's domestic power plant
capacity exclusive of electricity imports, was 30,246 MW as of 2011. By 2020, it
will expand to 44,631 MW. The major power source mix will be natural gas 61.5
percent (vs. 71.0 percent in 2011), coal 13.2 percent (vs. 13.1 percent), hydropower
9.2 percent (vs. 11.4 percent), and renewable energy 15.5 percent (vs. 3.5 percent).
The plan is to attempt to use increased generation by renewable energy to reduce
dependence on natural gas. In 2030, total output exclusive of electricity imports will
be an estimated 62,056 MW. The major power source mix will be natural gas 61.1
percent, coal 11.9 percent, hydropower 6.7 percent, renewable energy 15.4 percent,

51
and nuclear power 3.2 percent. Plans for the construction of nuclear power plants are
incorporated.
By power source, a vision is sketched of natural gas power plant capacity rising
from 21,474 MW in 2011 to 27,442 MW in 2020 and 37,912 MW in 2030. In order
to avoid overdependence on natural gas, gas-fired facilities will not increase, but
expansion of combined cycle plants with high thermal efficiency is planned. EGAT
and IPPs expect to add new combined cycle plants. Installed capacity is projected to
expand to 18,495 MW (41.4 percent of the capacity mix) as of 2020 and to 31,119
MW (50.1 percent of the capacity mix) as of 2030. For the natural gas supply, in
order to diversify sources, in addition to domestically produced gas, and pipeline gas
from the neighboring country of Myanmar, the Map Ta Phut LNG Receiving
Terminal was operational in September 2011 and began receiving LNG.
As for coal-fired power plant, installed capacity of 3,955 MW as of 2011 is
projected to reach 5,886 MW in 2020 and 7,387 in MW 2030. In "PDP2010:
REVISION 3", domestically-produced lignite-fired 600 MW is planned to construct
in 2018. On the other hand, EGAT intends to construct new thermal power plants that
use imported coal as fuel. After bringing 800 MW coal-fired power plant online in
2019, it is projected to gradually build up to 3,200 MW in 2030.
As for hydropower, there is a plan to build a 500 MW pumped-storage power
plant in 2017, but there are no other large-scale hydropower development plans. As
noted above, therefore, hydropower's share of total power plant capacity is projected
to fall from 11.4 percent in 2011 to 6.7 percent in 2030.
As for nuclear power, in the first version of PDP2010, the plan was to begin
operating the first plant (1,000 MW) in 2020, and then install more reactors for a
total of five reactors (5,000 MW in total) by 2028. However, after the accident at
Fukushima Daiichi nuclear power plant caused by the Great East Japan Earthquake,
the installation date was extended and the scale was reduced. According to
"PDP2010: REVISION 3," installation of one 1,000 MW reactor in 2026 and another
1,000 MW reactor in 2027 is planned.
Lacking abundant fossil fuels such as oil and natural gas or hydropower
resources, and highly dependent on energy imports, in recent years Thailand has been
52
aggressively adopting renewable energy.36
Thailand has abundant renewable energy
resources, particularly biomass and solar power. In biomass, Thailand aims to utilize
agricultural residual and industrial waste products such as rice, sugar cane, palm oil,
and wood offcuts (residual). The northern and central parts of the country have good
sites for solar power. For wind power, there are suitable locations in the eastern
coastal area, on the Gulf of Thailand in the south, and in the mountains of the south
and west. Expectations for future use are high. Thus, to promoted renewable energy
usage in Thailand, the Ministry of Energy has planned for the Alternative Energy
Development Plan 2012-2021 (AEDP2012-2021); and that plan has already
approved by the Cabinet. Against this background, according to "PDP2010:
REVISION 3," power plant capacity from renewable energy will expand from 1,058
MW in 2011 to 6,898 MW in 2020 to 9,558 MW in 2030, inaccordance with the
AEDP2012-2021, surpassing coal-fired capacity. It is an ambitious plan.
Finally, an overview of international interconnections between Thailand and its
neighbors will be presented. International interconnection lines are 500 kV and 230
kV transmission lines to Laos and 132 kV and direct current ±300 kV transmission
lines to Malaysia. Electricity import capacity in 2011 was 2,184 MW (1,884 MW
from Laotian hydropower and 300 MW from Malaysia's Tenaga Nasional Berhad).
As for future electricity trading, power plant construction projects for electricity
exports to Thailand are planned in adjacent countries. Construction of associated
international interconnection lines is also planned. The following memoranda have
been signed by Thailand and adjacent countries. With Thailand's domestic power
demand increasing, the importance of electricity imports from neighbors will
probably also increase.
36
Japan Electric Power Information Center, "Electric utilities in other countries, vol. 1
supplement 2, energy and electricity in major Asian nations," 2011
53
Table 2-2: MOU for electricity trade with neighboring countries
Partner country Date of MOU Amount of power
China 1998.11.12 3,000 MW
Lao PDR 2007.12.22 7,000 MW
Myanmar 1997.07.04 1,500 MW
Cambodia 2000.02.03 Unspecified
Source: Created from various materials and interviews.
13. Vietnam's power development plan
In Vietnam, domestic energy demand accompanying economic growth in recent
years has grown steadily. Peak power grew at an annual rate of 12.3 percent from
2001 to 2010 increasing to 2.8 times as large over 10 years. In order to respond to
this booming power consumption, the "7th National Electricity Master Plan" was
created in July 2011. Vietnam's power development plan proceeds based on it.
According to the master plan, Vietnam's domestic power plant capacity
exclusive of electricity imports will expand from 22,785 MW as of October 2011 to
72,675 MW in 2020. The power source mix will be hydropower (including pumped-
storage) 26.3 percent, coal-fired power 49.5 percent, gas-fired power 17.0 percent,
nuclear power 1.4 percent, and renewable energy 5.8 percent. A policy of advancing
energy source diversification is presented. In 2030, total output exclusive of
electricity imports will be 132,608 MW. The projected power source mix is
hydropower (including pumped-storage) 16.7 percent, coal-fired power 54.8 percent,
gas-fired power 12.5 percent, nuclear power 6.0 percent, and renewable energy 10.0
percent.
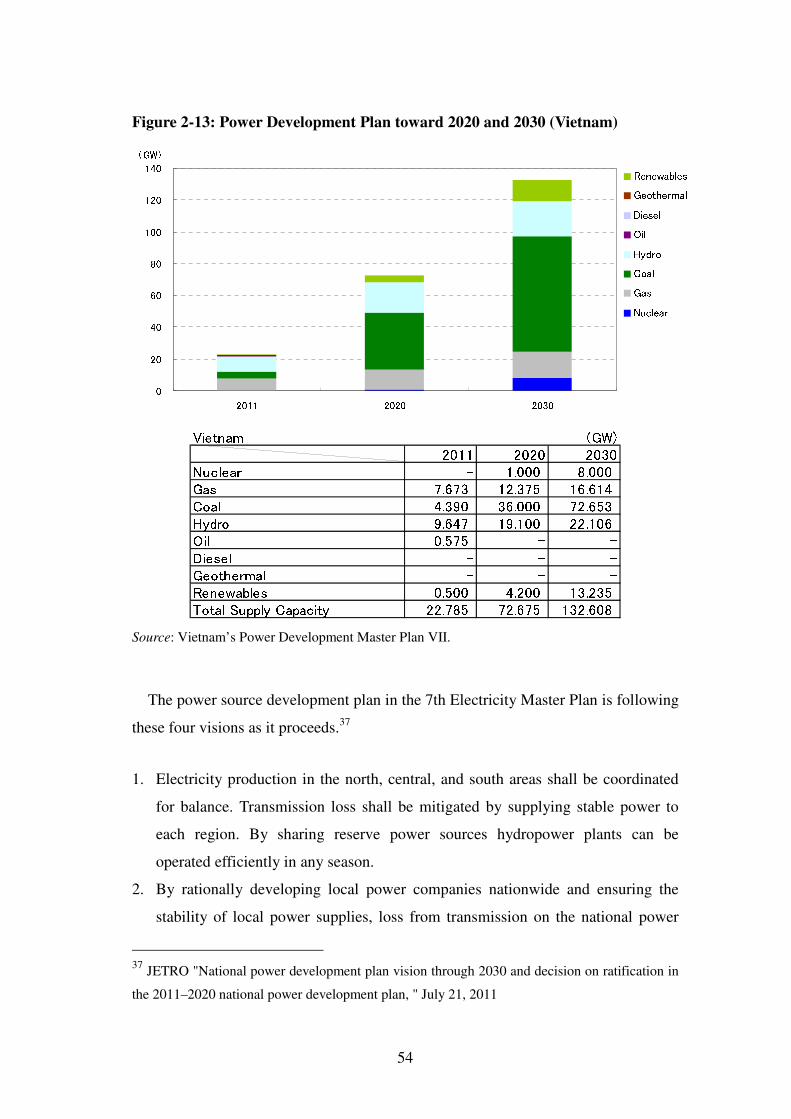
54
Figure 2-13: Power Development Plan toward 2020 and 2030 (Vietnam)
020406080100120140
2011 2020 2030
(GW) RenewablesGeothermalDieselOilHydroCoalGasNuclear Vietnam (GW)2011 2020 2030Nuclear - 1.000 8.000Gas 7.673 12.375 16.614Coal 4.390 36.000 72.653Hydro 9.647 19.100 22.106Oil 0.575 - -Diesel - - -Geothermal - - -Renewables 0.500 4.200 13.235Total Supply Capacity 22.785 72.675 132.608
Source: Vietnam’s Power Development Master Plan VII.
The power source development plan in the 7th Electricity Master Plan is following
these four visions as it proceeds.37
1. Electricity production in the north, central, and south areas shall be coordinated
for balance. Transmission loss shall be mitigated by supplying stable power to
each region. By sharing reserve power sources hydropower plants can be
operated efficiently in any season.
2. By rationally developing local power companies nationwide and ensuring the
stability of local power supplies, loss from transmission on the national power
37
JETRO "National power development plan vision through 2030 and decision on ratification in
the 2011–2020 national power development plan, " July 21, 2011

55
grid can be alleviated, ensuring the economy of power-related projects and
contributing to national and local socioeconomic development.
3. While developing new power sources, upgrade the technology of operating
power plants, and apply modern technology in new power plants to meet
environmental protection standards.
4. Diversify forms of investment in power development in accordance with
improvements in competitiveness and economy.
Next, future plans by power source type are presented.
For hydropower, the plan is to prioritize development as comprehensive projects
of power plants that have the objectives of flood control and irrigation. There is also
development of large-scale hydropower, but because such development is limited to
locations with good geographical conditions, small- and medium-scale hydropower
development is also scheduled in various areas. Under the plan, the installed capacity
of 9,647 MW in October 2011 shall be raised to 19,100 MW in 2020 and 22,106 MW
in 2030. Within this, pumped-storage power generation shall be researched and
developed from the perspective of efficient power grid operation. The plan shall
increase installed capacity to 1,800 MW in 2020 and 5,700 MW in 2030.
For thermal power generation, the plan is to carry out development in rational
ratios according to fuel supply locations, means, and capacities. A vision is sketched
of increasing installed capacity of gas-fired power from 7,673 MW in October 2011
to 12,375 MW in 2020 and 16,614 MW in 2030. Within this, development of power
plants that use LNG is planned. Installed capacity is to be 2,000 MW in 2020 and
6,000 MW in 2030. Securing LNG is one strategy for diversifying the sources of fuel
needed for electricity production.
For coal-fired power, the plan is to take installed capacity from 4,390 MW in
October 2011 to 36,000 MW in 2020 and 72,653 MW in 2030. Coal consumption in
those years is projected at 67.3 million tons and 107.1 million tons. The estimated
consumption amounts cannot be covered by domestic coal alone, so construction and
operation of power plants that use imported coal beginning in 2015 is considered. By
region, in power plants in the northern area, use of domestic coal is to be maximized
and prioritized to meet thee base load. In the south, on the other hand, much

56
development with thermal power from imported coal is planned. Coal could be
imported from Indonesia and Australia, but the south has many shoals, and there are
no large ports where large ships can dock, o tankers cannot be received.
Development of a coal center is therefore a major issue.38
With future depletion of domestic energy sources assumed, development of
nuclear power in order to ensure the stable supply of electricity is planned. In June
2008, the Nuclear Power Basic Law was passed. It set up the legal basis for the
promotion of nuclear power in Vietnam. Announcement of a master plan on nuclear
power in 2010 indicated the direction of nuclear power development planning
through 2030. Under the plan, the aim is for Vietnam's first nuclear power unit (1,000
MW) to go into operation in 2020. Installed capacity in 2030 is to be 10,700 MW,
with electricity output of 10.5 billion kWh (10.1 percent of total electricity output).
Even after the Fukushima Daiichi nuclear disaster, Vietnam showed no signs of
rethinking its nuclear power policy. Temporarily suspended talks between Japan and
Vietnam on cooperation on provision of nuclear technology and capital procurement
reopened in September 2011.39
However, as Ministry of Science and Technology
Vice-Minister Le Dinh Tien stated, if safety cannot be ensured, the dates of
construction and first operation of nuclear power could be delayed.40
As for renewable energy, wind power, solar, biomass, etc., are being quickly
developed on a priority basis, and the ratio of renewable energy in the power source
mix is being gradually increased. Generation through renewable energy is one
method of rural electrification in areas that are especially far from a power grid. That
role and its developmental potential are recognized. Although wind power currently
accounts for only a small percentage of the power source mix, coastal areas,
especially islands, have high potential, and foreign investment is increasing. In the
7th Electricity Master Plan, it is therefore planned to increase wind power to 1,000
MW in 2020 and 6,200 MW in 2030, and its share of electricity output to 0.7 percent
in 2020 and 2.4 percent in 2030. Biomass at this time is high-cost and difficult to
38
Japan Electric Power Information Center, "FY 2011 Report on survey of electric power in
Vietnam," March 2012
39 Jiji Press, September 9, 2011
40 NNA Asia Keizai Joho, August 17, 2011

57
make a commercial profit from, so it has not attracted attention from investors.
However, the Vietnamese government has indicated a policy of favorable treatment
of renewable energy development. The 7th Electricity Master Plan, in addition to
sugar factories that use sugarcane as a raw material for biomass power generation,
aims to develop other materials for biomass power and bring it to 500 MW in 2020
and 2,000 MW in 2030. That would be 0.6 percent of electricity output in 2020 and
1.1 percent in 2030.
Finally, an overview of international interconnections between Vietnam and
neighboring countries will be presented. Neighboring countries involved with
electricity trading and transmission line construction with Vietnam are China, Laos,
and Cambodia.
Currently, Vietnam imports electricity from China via a 220 kV transmission line.
However, Vietnam wants to curb it for two reasons, "an increase in the import price
in the latest contract renewal" and "security concerns regarding dependence on
China."
The political environment in Laos is extremely good. Vietnam wants electricity,
and Laos wants to acquire foreign currency through electricity exports. (With no
industry, next to resources export, electricity is Laos's best source of foreign
currency.). The two countries' interests match well, so they aim to improve relations.
Electricity rates are high in Cambodia, so Vietnam exports electricity to it.
Relations between the countries are stable.
In light of this background, the 7th Electricity Master Plan states, "carry out
efficient electricity import/export with countries in the region, ensure benefit to both
sides, exchange information with Laos, Cambodia, China, and other countries good
at hydropower, ensure a stable transmission grid, and enhance imports."
Implementation of cooperation on electricity trading and grid interconnection
programs with Southeast Asian (ASEAN) and Mekong sub-region (GMS) nations
can be expected.

57
CHAPTER 3
Existing Initiatives
This chapter will summarize existing initiatives by the Asian Development Bank
(ADB) and HAPUA (the Heads of ASEAN Power Utilities/Authorities) for the
stabilization of electricity supply in the East Asia region.
1. Initiatives in the GMS (Greater Mekong Sub-region)
1-1 GMS program
The GMS program is an international development plan with the ADB as its
secretariat. It was launched in October 1992 through a ministerial meeting of six
countries of the Mekong River basin, Thailand, Laos, Cambodia, Myanmar, Vietnam,
and China, at the ADB's Manila headquarters. Rather than seeking political and
security cooperation, it specializes in economic ties. As its secretariat, the ADB
facilitates dialog among the members and, when necessary, provides technical and
financial assistance.
In the program's operation, there are summit meetings held every three years,
annual ministerial meetings, annual meetings of senior officials, and annual working
group meetings. Institutions in each country coordinate development plans based on
the GMS program, with development items carried out individually by the countries.
A comprehensive framework for the program, the 10-Year Strategic Framework,
was formulated at the first GMS Summit Meeting, held in Phnom Penh in November
2002.41
With a vision of greater economic integration, prosperity, and fairness in the
Mekong region, the framework lays out four goals. They are 1) achieving accelerated
and sustained economic growth, 2) eradicating poverty and correcting income
disparities, 3) improving quality of life, and 4) protecting and conserving natural
resources and the environment. More concretely, it sets direction for intra-regional
41 ADB, Midterm Review of the Greater Mekong Sub-region Strategic Framework 2002 – 2012
http://beta.adb.org/sites/default/files/gms-sf-midterm-review.pdf

58
cooperation on development in terms of infrastructure improvement, enhancement
and promotion of border trade, investment, and tourism, promotion of private sector
participation and enhancement of its competitiveness, human resources development
and improvement of technical levels, and environmental conservation and
sustainable utilization of natural resources. Nine priority areas are listed: 1) the
transport sector, 2) the telecommunications sector, 3) the energy sector (see Chapter
7 below), 4) the environmental sector, 5) tourism, 6) trade systems, 7) the investment
environment, 8) human resources development, and 9) the agricultural sector.
Of the above nine sectors, the one that has seen the most active advancement has
been improvement of transport infrastructure. Development of transport
infrastructure, especially road improvement, is utilized not only to promote and
improve the movement of goods, but also for routes for the movement of people and
the flow of information and energy. Along with energizing economic activity, it is
expected to raise the incomes of regional residents, improve living environments, and
promote technology exchanges. A master plan was therefore created in 1995. At the
GMS program ministerial-level meeting in 1998, a priority program was set for three
"corridors," the North-South Economic Corridor, the East-West Economic Corridor,
and the Southern Economic Corridor.
The North-South Economic Corridor comprises a route from Bangkok, Thailand,
through Laos and Myanmar to Kunming in China's Yunnan Province, a route from
Kunming to Hanoi, Vietnam, and a route from Hanoi to Nanning in China's Guangxi
Zhuang Autonomous Region. The Hanoi-Nanning route in particular is expected to
form an important connection between the South China region including Hong Kong,
Shenzhen, Guangzhou, and the Pearl River and the industrial zone of northern
Vietnam. For the route from Bangkok through Laos to Kunming, the ADB and the
Chinese and Thai governments each provided one-third of the funding. With the
implementation of road improvement in Laos, the entire route was opened in March
2008. The Kunming-Hanoi-Nanning route is planned to be developed with funding
from the Chinese and Vietnamese governments.
The East-West Economic Corridor crosses Indochina from west to east, from
Myanmar through northeastern Thailand and southern Laos to Da Nang, Vietnam.
With the December 2006 completion through yen loans from Japan of the Second

59
Mekong International Bridge, spanning the Mekong River on the Thailand-Laos
border, the corridor was fully opened. It is expected to contribute to establishment of
international division of labor between Thailand and Vietnam, which produce auto
parts and electrical and mechanical products.
Development of the Southern Economic Corridor, the route linking Bangkok,
Phnom Penh, and Ho Chi Minh City, is lagging behind that of the other two
economic corridors described above. However, it is expected to establish optimal
international specialization as a major shipping base for the apparel manufacturing
industry, with textiles and fibers being manufactured in Thailand, sewing taking
place in Cambodia, and exporting from Hanoi.
Initiatives in the electric power sector within the GMS program have helped to
promote opportunities for each country's economic cooperation in the sector,
facilitate the implementation of major electric power projects, and clarify technical,
economic, financial, and institutional issues regarding the development of electric
power in the region. However, these have mainly been generalized unofficial efforts
focusing on principles and systems. Although they are just getting underway in
multiple concerned nations (China-Vietnam, Laos-Cambodia, Laos-Thailand,
Thailand-Cambodia, Vietnam-Cambodia, Vietnam-Laos), these power flows at
present are almost all one-way. Because they mainly comprise the buying and selling
of electricity from fixed power plants, they are considered power lines from specific
projects rather than interconnected grids. In the future, some goals of the GMS
countries are to establish international power trading in order to increase mutual
economic and technical benefits, and to have well-balanced power plants through
regional energy sources that enable power transport spanning countries throughout
the region. There are various initiatives and international agreements towards those
ends. The GMS Electric Power Forum (EPF) was established in 1995, and the
Experts’ Group on Power Interconnection and Trade (EGP) in 1998.
Major developments in power trade in the GMS are as follows.

60
Figure 3-1: Economic Corridor of GMS Program
南北経済回廊
東西経済回廊南部経済回廊
Source: ADB website
North-South Economic Corridor
East-West Economic Corridor
Southern Economic Corridor
61
1-2 Policy Statement on Regional Power Trade in the GMS (Jan 2000)
In light of the above developments in the GMS program, at the ninth ministerial
meeting in Manila in January 2000, representatives from Cambodia, China, Laos,
Myanmar, Thailand, and Vietnam signed a policy statement on regional power trade
in the Greater Mekong Sub-region. Its objectives were the following categories.
(a) Promotion of economic growth and efficient development of the electricity
sector in the GMS
(b) Promotion of opportunities to expand each country's economic cooperation
in the energy sector
(c) Promotion of prioritized implementation of power projects
(d) Clarification of technical, economic, financial, and institutional issues in
the development of electric power in the region
(e) Promotion of economic transactions in electricity
(f) Protection and improvement of the environment through the adoption of
appropriate technology and plans
1-3 Inter-governmental Agreement on Regional Power Trade in the GMS
(3 Nov 2002)
The intergovernmental agreement on regional power trade in the Greater
Mekong Sub-region is an agreement to implement the above-mentioned "policy
statement on regional power trade in the Greater Mekong Sub-region." It was signed
by national representatives in November 2002 at the first GMS summit meeting, in
Phnom Penh, Cambodia. The intergovernmental agreement covers the establishment
of the Regional Power Trade Coordination Committee (RPTCC), which is an
institution that coordinates each country's power trade and each country's initiatives
in response.
As its first step, the RPTCC is required to complete the final draft of the
Regional Power Trade Operating Agreement (RPTOA) and determine the first stage
of its implementation.

62
1-4 MOU on the Guidelines for the Implementation of the Regional Power
Trade Operating Sgreement Stage 1 (MOU-1) (5 Jul 2005)
MOU-1 is a memorandum of understanding intended to set out guidelines for
power trade during Stage 1 (when only bilateral power trade is possible). It covers
the institutional arrangements that each country and the RPTCC should follow in
relation to power trade during Stage 1.
1-5 MOU on the Road Map for Implementing the GMS Cross Border Power
Trading (MOU-2) (31 Mar 2008)
MOU-1 set forth institutional and other arrangements for Stage 1 power trade,
including the perspectives of transactions and operations related to international
interconnection and flow. This was linked to the establishment of i) the RPTCC
Focal Group (FG) to take charge of coordinating most RPTCC activities in each
country and ii) the Planning Working Group (PWG) to take charge of planning and
system research in order for the GMS countries to shift to everyday power trade
guidelines. However, the fact that the GMS countries had no clear schedule for
evaluating "promotion of power development programs," "coordination in power
trade development related to the goals of intergovernmental agreements," and so on
became an issue. Therefore, a schedule that would serve as benchmarks for the
completion of Stage 1 of regional international power trade during 2008–2012 and a
roadmap of methods of preparing for Stage 2 while Stage 1 was being implemented
were established.

63
Table 3-1: Regional Power Trade Roadmap 2008-2012 (to accomplish stage 1)
Milestone Activity Schedule
Completion of a power
interconnection master plan
with benchmarks, setting of
priorities for new
interconnection projects
related to feasibility studies
already underway
Completion of GMS master plan with
benchmarks for power development
2008
Setting of priorities for interconnection
projects shown in the master plan
2009–
2010
Advancement of feasibility studies on
projects selected as high priority
From 2009
Review of the master plan benchmarks Every 2
or 3 years
Completion of research on
GMS standard practices
Completion of research on GMS standard
practices, adoption of GMS standard
practices for proposed new regional
interconnections, and study of
synchronized operation of
interconnection grid
2010
Consideration of the adoption of
procedures for moving to achievement of
proposed GMS standard practices
2010
Completion of research on
regulations for
interconnection lines
Completion of research on regulations for
interconnection lines and consideration of
the adoption of research findings on
synchronous operation of interconnection
grids and coordinating flow control
2010
Completion of research on
regional measurement
methods in grid
interconnection and on rules
for power trade
Completion of research on regional
measurement methods in grid
interconnection for implementation
during Stage 1 and on
telecommunications system standards,
and consideration of the adoption of
research findings
2010
Completion of research on rules for
power trade for implementation during
Stage 1, including methods for resolving
disputes between parties other than
existing PPAs, and consideration of the
adoption of research findings.
2010

64
Table 3-2: Regional Power Trade Roadmap 2008-2012 (to prepare for stage 2)
Milestone Activity Schedule
Begin research on
confirming regulatory
barriers against power trade
and moving to the next stage
Completion of research on identifying
regulatory barriers to the development of
power trade and consideration of adoption
of institutional arrangements and methods
to deal with regulatory barriers
2012
Completion of research on
the GMS Grid Code
(operational procedures)
Completion of research on the GMS Grid
Code and consideration of adoption of the
following research findings
• GMS standard practices
• Procedures for grid operators to
coordinate management of deviations
from plans and control of
interconnection flow
• Measurement and communications
• Sharing of reserve power and support
during emergencies
2010-
2012
Completion of research on
Stage 2 rules on transmission
lines, which allow third-
party access to
interconnection, including
Stage 2 power trade rules
that give preference to
contracts and PPAs, and
dispute resolution
procedures
Completion of research on Stage 2 rules on
transmission lines and consideration of the
adoption of findings to compensate the
flows of sponsoring countries related to
third-party transactions, including
development of payment agreements and
duties for third-party use,
From
2012
Development of power trade rules for
short-term international transactions and
consideration of their adoption
Through
2012
Development of power trade rules for
paying for deviations from power trade
plans on the interconnection grid and
consideration of their adoption
Through
2012
1-6 Subsequent Movement
Through support from the ADB, a master plan was created in 2008. It is
summarized in Figure 7.1. (The plan was reportedly revised in 2010.)
Additionally, an RPTCC meeting was held in Ho Chi Minh City on November
2011. Two working groups (WG1: Examination of technical standards for power
distribution [System performance standards], WG2: Examination of how to eliminate
institutional issues [Registration barriers]) were started to facilitate power import-

65
export/grid interconnection. They are to complete their examination of issues by the
end of 2012.
Figure 3-2: Master Plan for Grid Interconnection
Source: “The GMS Road Map and Work Plan for Expanded Energy cooperation” (from materials
presented at the second Subregional Forum).
66
2. ASEAN Power Grid Concept
In ASEAN, the ASEAN Free Trade Area (AFTA), which has been in preparation
since the 1990s, aims not only to liberalize regional trade, but also to establish the
ASEAN Economic Community (AEC) in 2015. The goal of the AEC is high-quality
economic integration with the facilitation of trade, liberalization and facilitation of
trade in services, upgrading of infrastructure on a broad scale, movement to common
rules and standards, mutual recognition, and reduction of disparities. Against this
background, a variety of initiatives regarding improvement of energy infrastructure
have also been undertaken with the aim of stimulation and optimization within the
ASEAN region.
2-1 ASEAN Vision 2020
At the ASEAN summit held in Kuala Lumpur, Malaysia, in December 1997,
"ASEAN Vision 2020" was adopted in order to promote political, economic, security,
and cultural cooperation and exchanges in the nations of ASEAN. Against this
background, two plans were adopted to mutually connect each country's energy
infrastructure: the ASEAN Power Grid concept in the electric power sector and the
Trans-ASEAN Gas Pipeline concept in the natural gas sector. It was confirmed that
member countries can build and facilitate win-win relationships through international
energy deals. The secretariat of the ASEAN Power Grid is the Heads of ASEAN
Power Utilities/Authorities (HAPUA). It was confirmed that regional power
interconnection can be promoted through information exchange and technology
introduction for the planning, construction, and operation of power grids and through
basic research on power interchange.

67
Figure 3-3: Overview of ASEAN Power Grid
Source: The 27th Meeting of HAPUA Council.
2-2 ASEAN Ministers on Energy Meeting process
The ASEAN Ministers on Energy Meeting (AMEM) is hosted annually by
member countries on a rotating basis. It is the venue that authorized the ASEAN Plan
of Action on Energy Cooperation (APAEC) and checks on the state of its progress.
The ASEAN Center for Energy (ACE), which is operated by ASEAN energy
ministers and the ASEAN secretariat, handles the setting of the APAEC.
The APAEC for 1999 through 2004 was adopted at the 17th Ministers on Energy
Meeting, held in Bangkok in July 1999. The policy framework and means of
adoption of interconnection plans were set, and the aim of earlier realization of the
ASEAN Power Grid was confirmed. In conjunction with the adoption of the APAEC,
the ASEAN Center for Energy (ACE) was established as an intergovernmental
organization to focus on energy cooperation and coordinate with the individual
countries.
The APAEC for 2004 through 2009 was set at the 22nd Ministers on Energy
Meeting, held in Manila in 2004.
In 2007, at the 25th Ministers on Energy Meeting (in Singapore), a
memorandum on the ASEAN Power Grid was signed. Member countries agreed to
68
cooperate on research towards the end of a unified grid concept and to facilitate
public-private cooperation and capital investment. It was also decided to begin
research on harmonization of the differing technical standards, duties on power
import/export, contractual frameworks, etc., in the member countries.
At the 27th ASEAN Ministers on Energy Meeting, in Mandalay, Myanmar, on
July 29, 2009, APAEC 2010–2015, the latest version, was approved. The plan lays
out the following seven categories for regional energy strategy.
1) Development of the ASEAN Power Grid
- Promotion of the development of a unified power grid in ASEAN
- Optimization of power source mixes in accordance with each country's
power situation
- Promotion of the utilization of ASEAN's human and economic resources in
terms of financing for power generation, transmission, and distribution and
of expert advice
2) Development of a Trans-ASEAN Gas Pipeline
- Signing of a memorandum on a Trans-ASEAN gas pipeline network by
member countries
- Cooperation on the performance of a feasibility study on the development of
the East Natuna gas field by Pertamina and a PSC partner
3) Promotion of clean coal technology
- Design of systems and political frameworks for coal utilization
- Promotion of coal utilization and the adoption of clean coal technology
- Facilitation of coal import/export and development investment in ASEAN
- Enhancement of environmental standards and assessments for coal
development and use

69
4) Promotion of energy conservation and more efficient energy use
- Setting of policies on more efficient use of energy
- Improved dissemination of knowledge and information concerning energy
conservation
- Better and more thorough energy management in the industrial and business
sectors
- Enhanced financial support for investment in improving energy efficiency
5) Promotion of the adoption of renewable energy
- Set a goal of having 15 percent of the region's generated power come from
renewable energy
- Facilitation of and enhanced cooperation on use of renewable resources and
services among member countries
- Set up of schemes for financial support
- Promotion of biofuel development and commercial utilization
- etc.
6) Support and information sharing concerning the setting of energy policies and
development plans in each country
- Enhancement of Information sharing on energy policy and stable supply
- Support for the development of human resources related to energy and
environmental policy
- Implementation in each country of monitoring and assessment of progress on
the APAEC
- etc.

70
7) Development of an environment for the adoption of nuclear power
- Capacity building among ASEAN member countries for the adoption of
nuclear power
- Enhancement of information disclosure and education concerning nuclear
power
- Development of system designs and legal systems for the adoption of nuclear
power, and capacity building among regulatory authorities
Against this background, concrete initiatives on items related to the ASEAN
Power Grid concept are the following.
• Improvement of APG advisory committee initiatives on realization of
interconnection projects
• Research on issues such as international interconnection grid projects,
international power trade, and grid investment, on which study has advanced in
HAPUA working groups (on generation, transmission, distribution, power quality,
policy, private-sector business development, and human resources development)
• Review and renewal of the ASEAN Interconnection Master Plan (AIMS)
71
CHAPTER 4
Optimizing Power Infrastructure Development
This chapter will present in quantitative terms the optimal potential and
advantages for the entire power infrastructure (power plants and power grids) in 13
countries in East Asia (Bangladesh, Brunei Darussalam, Cambodia, China [Yunnan
& Guangxi], India [North-East], Indonesia, Lao PDR, Malaysia, Myanmar,
Philippines, Singapore, Thailand, and Vietnam).
Through this, the ingredients will be provided for East Asian nations in the
future to create trade in international power in order to mutually increase economic
and technical rewards and to achieve an energy mix for the realization of power
transport that spans nations throughout the region.
1. Optimal Inter-state Power Supply Model
A linear programming (LP) model was formulated in order to examine the
optimal inter-state power supply system in East Asia.
Power generation capacity and power generation costs by energy source for the
East Asian nations were estimated, and overall optimization of the power supply to
meet total demand in each country was attempted. The objective function in this case
was cost minimization.

72
Figure 4-1: Overview of LP Model
The following constraints were set in this model.
• Total regional power demand = Total regional power supply volume
• Total regional power supply volume <= Total regional power supply capacity
• Each country's import/export power volume <= Transmission line capacity (each
country's interchange capacity)
• Total regional CO2 emission volume <= Target value for total regional CO2
emission volume
• Each country's amount of power from renewable energy = Target value for each
country's adoption of renewable energy
Ordinarily, when considering optimal power supply, one must consider
numerous factors for each country, such as peak demand, wheeling charges, and the
construction costs of individual power plants and interconnection lines. In this model,
however, because of data limitations, such factors are not reflected.
Regional electricity supply capacity
by fuel [kWh]
Nuclear, Coal, Gas, Oil,
Regional total electricity demand
[kWh]
Linear Programming Model
Cost minimum optimization
Constraint conditions
CO2 emission allowance
Capacity of international trade
Input
Solver
Output
Cost minimum power generation mix
under the specific conditions [kWh]
Nuclear, Coal, Gas, Oil,

73
Moreover, in actual equipment planning, power source mixes and amounts of
power import/export are considered based on load curve data. In this model, however,
as a simplified method, the advantages of international grid interconnection are
analyzed by simulating each country's annual supply capacity and demand balance.
2. The Model's Preconditions
The preconditions in the linear programming (LP) model are each country's
power demand, the interchange capacities of international interconnection lines,
power supply capacity by source type, generating costs by power source, and CO2
emission factor by power source.
2-1 Power Demand
First, for each country's power demand in GWh as of 2020 and 2030, for countries
in which figures were made clear in power source development plans and so on,
those figures were used. For countries in which power source development plans are
not clear, estimates were calculated using power generation output figures for BAU
(Business as Usual) Cases in "ERIA Research Project Report 2011, No. 18
ANALYSIS ON ENERGY SAVING POTENTIAL IN EAST ASIA REGION." (See
Table 4-1.)
2-2 Transmission Capacity and Scenarios
In this model, projections for the interchange capacity (GWh) of international
interconnection lines were set in a Base Case and an Accelerated Case and compared
with the Status Quo Case (in which interchange capacity remains the same as now,
with no new increases or investment in current interchange capacity estimated).
The projected Base Case for each country's interchange capacity was set based on
the "AIMS II Report (ASEAN Interconnection Master Plan Study No. 2)," published
by the Heads of ASEAN Power Utilities/Authorities (HAPUA). However, for
Bangladesh, China (Yunnan Province and Guangxi Zhuang Autonomous Region),
and India (North-East), which are not covered by the "AIMS II Report," figures were
set based on each country or region's own power import/export plan.

74
Figures for the Accelerated Cases were set in order to analyze the result if each
country's interchange capacity in the Base Case were to be doubled. (See Table 4-2.)
Figure 4-2: Scenario for Interconnection
2020 2030
Status Quo Case Same international interchange capacity as today
Base Case International interchange capacity as planned in AIMS II
Accelerated Case - International interchange
capacity double that of AIMS
II
2-3 supply Capacity
In this model, each country's power supply capacity (GWH) by power source as of
2020 and 2030 refers to the maximum supply capacity of the generating equipment
in each country. In short, it is calculated based on an operation rate that keeps
downtime for periodic inspections and so on to a minimum. It does not necessarily
match the operation rates assumed in national power source development plans, etc.
This is because, in this model, the objective is to maximize utilization of
international interconnection and optimize the energy balance for the entire region,
so supply capacity distribution in accordance with peak power demand in each
country was minimized to the extent possible.
In concrete terms, each country's generating equipment capacity by power source
as discussed in Chapter 2 was multiplied by the following operation rates(= plant
factor) to set maximum supply capacity. (See Table 4-3.)
• Base power source: 80 percent
• Middle to peak power source: 60 percent (in light of interchange reduction to
ensure reserve power for fluctuations in power demand)
• Nuclear power: 60 percent in 2020 (in light of test operation periods after recent
introduction), 80 percent in 2030

75
• Hydropower: 45 percent (in light of seasonal fluctuations due to rainy and dry
seasons)
• Geothermal: 80 percent
• Other renewable energy: biomass 60 percent, wind power 20 percent, small
hydropower 40 percent, solar 12 percent
2-4 Generation Cost
For generation cost (US$/kWh) by power source, since data for each country
could not be obtained, in this model, the generation price by power source mainly in
Thailand and Indonesia was used as a base to set the value for each country.
As for the generation cost for coal-fired thermal power plant, it was set lower for
countries such as Indonesia and Vietnam that produce a great deal of coal
domestically and use it as fuel than it was for countries that use mainly imported coal.
In the same way, a price difference for the generation cost of gas-fired thermal
power plant was set between the gas producing nations of Bangladesh, Brunei,
Indonesia, and Myanmar and countries that rely on pipeline gas or LNG imports.
For the generation cost of nuclear, oil-fired, renewables of each country that
could not be obtained, in this model, they were set mainly based on the value of
Thailand. (See table 4-4.)
2-5 CO2 Emission Factor
Finally, CO2 emission factor (kt-CO2/GWh) by power source is affected by the
generating efficiency of each country's power plants. In this model, therefore, figures
for the thermal efficiency of thermal power plants found in "ERIA Research Project
Report 2011, No. 18 ANALYSIS ON ENERGY SAVING POTENTIAL IN EAST
ASIA REGION" were used. Additionally, the following values were used as the CO2
emission factors42
by energy source that formed the basis for calculations. (See Table
4-5.)
• Coal (fuel coal): 3.7927 Gg-CO2/1010
kcal (= 0.326 kt-CO2/GWh)
• Natural gas (LNG): 2.0675 Gg-CO2/1010
kcal (= 0.178 kt-CO2/GWh)
42 EDMC, "HANDBOOK OF ENERGY & ECONOMIC STATISTICS in JAPAN 2013"
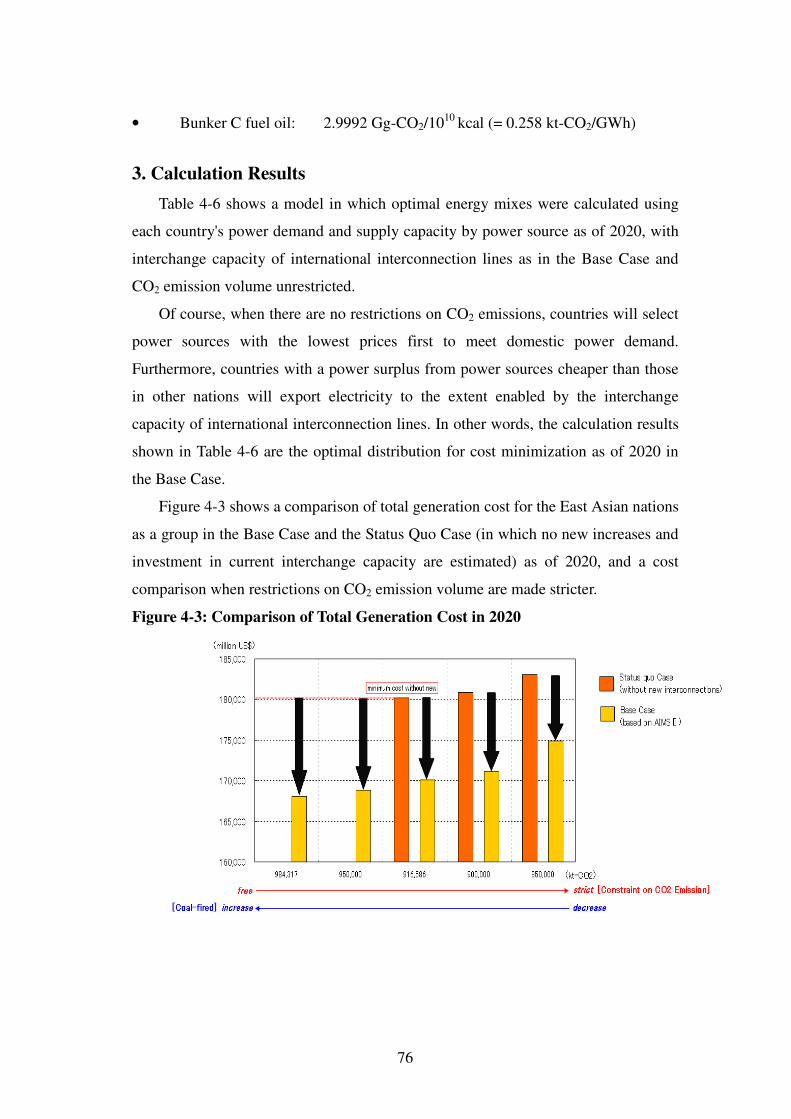
76
• Bunker C fuel oil: 2.9992 Gg-CO2/1010
kcal (= 0.258 kt-CO2/GWh)
3. Calculation Results
Table 4-6 shows a model in which optimal energy mixes were calculated using
each country's power demand and supply capacity by power source as of 2020, with
interchange capacity of international interconnection lines as in the Base Case and
CO2 emission volume unrestricted.
Of course, when there are no restrictions on CO2 emissions, countries will select
power sources with the lowest prices first to meet domestic power demand.
Furthermore, countries with a power surplus from power sources cheaper than those
in other nations will export electricity to the extent enabled by the interchange
capacity of international interconnection lines. In other words, the calculation results
shown in Table 4-6 are the optimal distribution for cost minimization as of 2020 in
the Base Case.
Figure 4-3 shows a comparison of total generation cost for the East Asian nations
as a group in the Base Case and the Status Quo Case (in which no new increases and
investment in current interchange capacity are estimated) as of 2020, and a cost
comparison when restrictions on CO2 emission volume are made stricter.
Figure 4-3: Comparison of Total Generation Cost in 2020

77
(million US$)Target of total CO2 emission 984,317* 950,000 916,586** 900,000 850,000Status quo Case[①](without new interconnections) 180,199 180,841 183,077Base Case[②](with new interconnections based on AIMSⅡ) 168,057 168,830 170,129 171,139 174,921Savings[=②-①] ▲ 12,142 ▲ 11,369 ▲ 10,070 ▲ 9,702 ▲ 8,156* 984,317kt-CO2 = Maximum CO2 emission in Base Case** 916,586kt-CO2 = Maximum CO2 emission in Status quo Case
In the Base Case, the calculation results with no restrictions on CO2 emission
volume applied and optimal distribution for cost minimization attempted found a
total generation cost of 168,057 million US$ and a total CO2 emission volume of
984,317 kt. In the Status Quo Case, if restrictions on CO2 emission volume are not
applied, the calculations obtained a total generation cost of 180,199 million US$ and
a total CO2 emission volume of 916,586 kt. Comparing the two cases, if the
international power grid is augmented to the degree seen in the Base Case, and if its
use is maximized, the East Asian nations as a group could reduce generation cost by
12,142 million US$.
Next, comparisons were carried out of total generation cost when restrictions on
CO2 emission volume were gradually made stricter, going from no limits to 850,000
kt. The calculation results use hydropower and nuclear power, which are clean and
have low generation costs, as base power sources. Since no further excess supply
exists, power supply from coal-fired thermal power with its high CO2 emission
volume is reduced, while the role of gas-fired thermal in the power supply is
increased.
Compared with the case when there are no restrictions on CO2 emission volume,
electricity trade volume decreases by 44,218 GWh, from 181,330 GWh to 137,112
GWh.
As a result, total generation cost in the Base Case increased by 6,864 million
US$ to 174,921 million US$. Total generation cost in the Status Quo Case increased
by 2,878 million US$ to 183,077 million US$. The cost reduction effect of utilizing
the international power grid shrunk to 8,156 million US$. This was because, in order
to lower CO2 emissions, use of coal-fired thermal power was reduced, while use of
gas-fired thermal power was increased, raising the average generation cost.

78
Next, the calculation results for 2030 will be analyzed.
Table 4-7 shows a model in which optimal energy mixes were calculated using
each country's power demand and supply capacity by power source as of 2030, with
interchange capacity of international interconnection lines as in the Accelerated Case
and CO2 emission volume unrestricted. Table 4-8 shows the result when interchange
capacity is kept in the Base Case scenario and all other conditions remain unchanged.
As discussed above, if CO2 emissions are not restricted, countries will select
power sources with the lowest prices first to meet domestic power demand.
Furthermore, countries with a power surplus from power sources cheaper than those
in other nations will export electricity to the extent enabled by the interchange
capacity of international interconnection lines. In other words, the calculation results
shown in Table 4-7 and Table 4-8 are the optimal distributions for cost minimization
as of 2030 in the different international interconnection scenarios.
Figure 4-4 shows a comparison of total generation cost for the East Asian
nations as a group as of 2030 if the interchange capacity of international
interconnection lines changes as in the Accelerated, Base, and Status Quo Cases, and
a cost comparison when restrictions on CO2 emission volume are made stricter.
Figure 4-4: Comparison of Total Generation Cost in 2030

79
(million US$)Target of total CO2 emission 1,803,713* 1,800,000 1,778,558** 1,750,000 1,745,580*** 1,700,000Status quo Case[①](without new interconnections) 408,281 413,542Base Case[②](with new interconnections based on AIMSⅡ) 393,446 396,336 396,894 402,785Accelerated Case[③](with double-capacity of AIMSⅡ) 390,871 391,025 392,880 395,999 396,575 402,516Savings[=③-②] ▲ 2,575 ▲ 2,421 ▲ 566 ▲ 337 ▲ 319 ▲ 269Savings[=③-①] ▲ 17,410 ▲ 17,256 ▲ 15,401 ▲ 12,282 ▲ 11,706 ▲ 11,026* 1,803,713kt-CO2 = Maximum CO2 emission in Accelerated Case** 1,778,558kt-CO2 = Maximum CO2 emission in Base Case*** 1,745,580kt-CO2 = Maximum CO2 emission in Status quo Case
In the Accelerated Case, with no restrictions on CO2 emission volume applied
and optimal distribution for cost minimization attempted, the calculation results
found a total generation cost of 390,871 million US$ and a total CO2 emission
volume of 1,803,713 kt. In the Base Case, with the same condition and optimal
distribution for cost minimization attempted, the calculation results were a total
generation cost of 393,446 million US$ and a total CO2 emission volume of
1,778,558 kt. In other words, if the transmission capacity between states is doubled
from the Base Case scenario and its use is maximized, the East Asian nations as a
group are projected to reduce generation cost by 2,575 million US$.
In the Status Quo Case, with no restrictions on CO2 emission volume applied,
total generation cost was calculated at 408,281 million US$ and total CO2 emission
volume at 1,745,580 kt. If CO2 emission volume is ignored, and only total generation
cost is compared, if international interconnection can be expanded to the Accelerated
Case, cost will be reduced by 17,410 million US$. Even if the comparison is the
Base Case scenario, a cost reduction of 14,835 million US$ can be expected.
Next, comparisons were carried out of total generation cost when restrictions on
CO2 emission volume were gradually made more strict, going from no limits to
1,700,000 kt. because hydropower and nuclear power, which are clean and have low
generation costs, are used as base power sources, no further excess power supply can
be projected. Therefore, in an environment in which restrictions on CO2 emissions
are applied, power supply from coal-fired thermal power with its high CO2 emission
volume will be reduced, while the role of gas-fired thermal in the power supply will
increase.
80
At that time, electricity trade volume in the Accelerated Case will shrink by
85,150 GWh, from 247,345 GWh to 162,195 GWh, compared to the case without
restrictions on CO2 emission volume.
An increase in the use of higher-priced gas-fired thermal power had the
following results. In the Accelerated Case, total generation cost rose by 11,645
million US$ to 402,516 million US$. In the Base Case, total generation cost rose by
9,339 million US$ to 402,785 million US$. In the Status Quo Case, total generation
cost rose by 5,261 million US$ to 413,542 million US$. Thus, in regard to the cost
reduction effect of the international interconnection grid, in the comparison with the
Accelerated Case and the Base Case it shrank by 269 million US$, and in
comparison with the Status Quo Case it shrank by 11,026 million US$.
4. Optimal Energy Mix
As became clear in the previous section, changing the constraints changes the
optimal distribution of each country's energy mix. Table 4-9 shows the changes in
countries' optimal energy mixes as of 2020 and 2030, with no restrictions on CO2
emission volume applied, when the interchange capacity of international
interconnection lines is increased from the Status Quo Case to the Base Case
scenario to the Accelerated Case scenario.
In almost every one of the East Asian nations that were the subject of this
research, a steady rise in power demand due to population increase and economic
growth is projected. On the other hand, these countries each have their own specific
energy resources and environmental constraints. Against this background, in order to
achieve the optimal energy mix in terms of factors such as supply stability, economy,
and lessening environmental impact, the calculation results in the previous section
suggest that considering the balance of the East Asian nations as a group would bring
greater benefits than attempting to build up the power grids of individual countries.
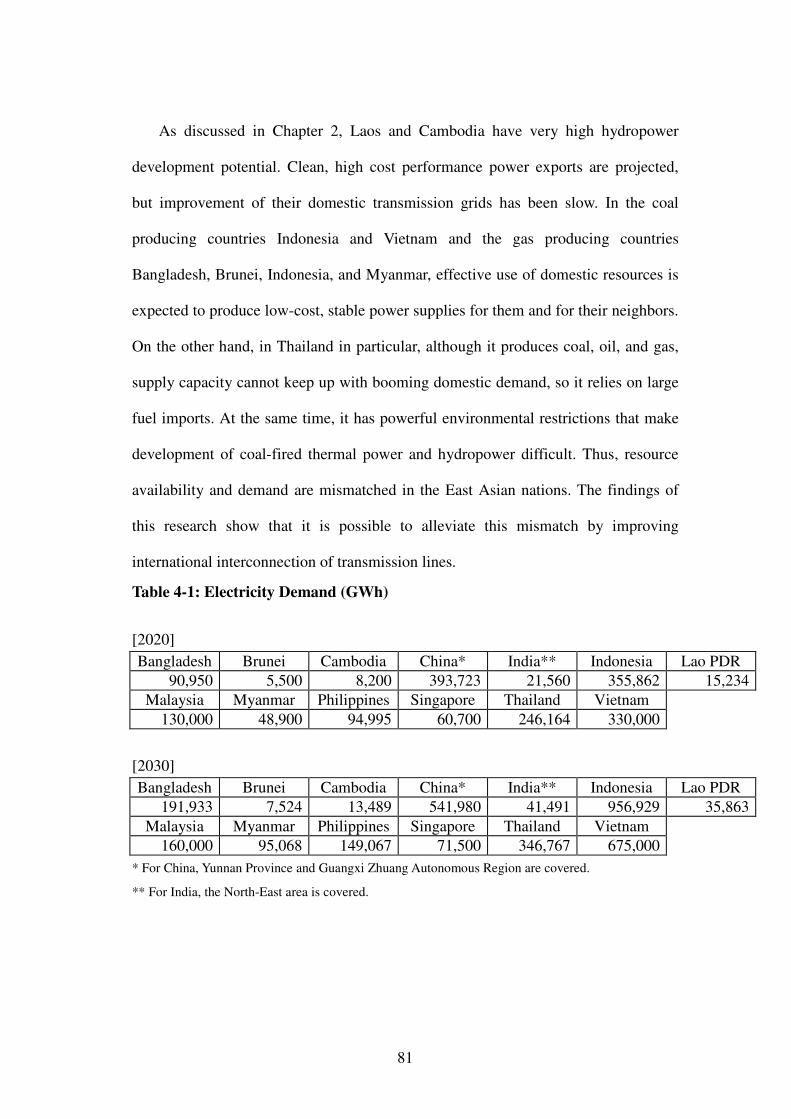
81
As discussed in Chapter 2, Laos and Cambodia have very high hydropower
development potential. Clean, high cost performance power exports are projected,
but improvement of their domestic transmission grids has been slow. In the coal
producing countries Indonesia and Vietnam and the gas producing countries
Bangladesh, Brunei, Indonesia, and Myanmar, effective use of domestic resources is
expected to produce low-cost, stable power supplies for them and for their neighbors.
On the other hand, in Thailand in particular, although it produces coal, oil, and gas,
supply capacity cannot keep up with booming domestic demand, so it relies on large
fuel imports. At the same time, it has powerful environmental restrictions that make
development of coal-fired thermal power and hydropower difficult. Thus, resource
availability and demand are mismatched in the East Asian nations. The findings of
this research show that it is possible to alleviate this mismatch by improving
international interconnection of transmission lines.
Table 4-1: Electricity Demand (GWh)
[2020]
Bangladesh Brunei Cambodia China* India** Indonesia Lao PDR
90,950 5,500 8,200 393,723 21,560 355,862 15,234
Malaysia Myanmar Philippines Singapore Thailand Vietnam
130,000 48,900 94,995 60,700 246,164 330,000
[2030]
Bangladesh Brunei Cambodia China* India** Indonesia Lao PDR
191,933 7,524 13,489 541,980 41,491 956,929 35,863
Malaysia Myanmar Philippines Singapore Thailand Vietnam
160,000 95,068 149,067 71,500 346,767 675,000
* For China, Yunnan Province and Guangxi Zhuang Autonomous Region are covered.
** For India, the North-East area is covered.

82
Table 4-2: International Interconnection Transmission Capacity (GWh)
[Base Case scenario]
Bangladesh Brunei Cambodia China* India** Indonesia Lao PDR
8,760 1,752 35,890 76,825 8,760 33,288 99,198
Malaysia Myanmar Philippines Singapore Thailand Vietnam
41,172 46,682 8,760 31,536 141,036 26,254
[Accelerated Case scenario]
Bangladesh Brunei Cambodia China* India** Indonesia Lao PDR
17,520 3,504 71,780 153,650 17,520 66,576 198,396
Malaysia Myanmar Philippines Singapore Thailand Vietnam
82,344 93,364 17,520 63,072 282,072 52,508
* For China, Yunnan Province and Guangxi Zhuang Autonomous Region are covered.
** For India, the North-East area is covered.
Table 4-3: Capability of Electricity Supply (GWh)
Bangladesh (2020)
Nuclear Gas Coal Hydro Oil Diesel Geothermal Renewable
10,512 28,524 84,446 1,301 3,863 3,774 - -
Bangladesh (2030)
Nuclear Gas Coal Hydro Oil Diesel Geothermal Renewable
28,032 46,516 137,707 1,301 6,302 6,155 - -
Brunei (2020)
Nuclear Gas Coal Hydro Oil Diesel Geothermal Renewable
- 8,872 - - - - - -
Brunei (2030)
Nuclear Gas Coal Hydro Oil Diesel Geothermal Renewable
- 12,138 - - - - - -
Cambodia (2020)
Nuclear Gas Coal Hydro Oil Diesel Geothermal Renewable
- - 7,979 19,410 - - - 11
Cambodia (2030)
Nuclear Gas Coal Hydro Oil Diesel Geothermal Renewable
- - 13,124 31,934 - - - 11
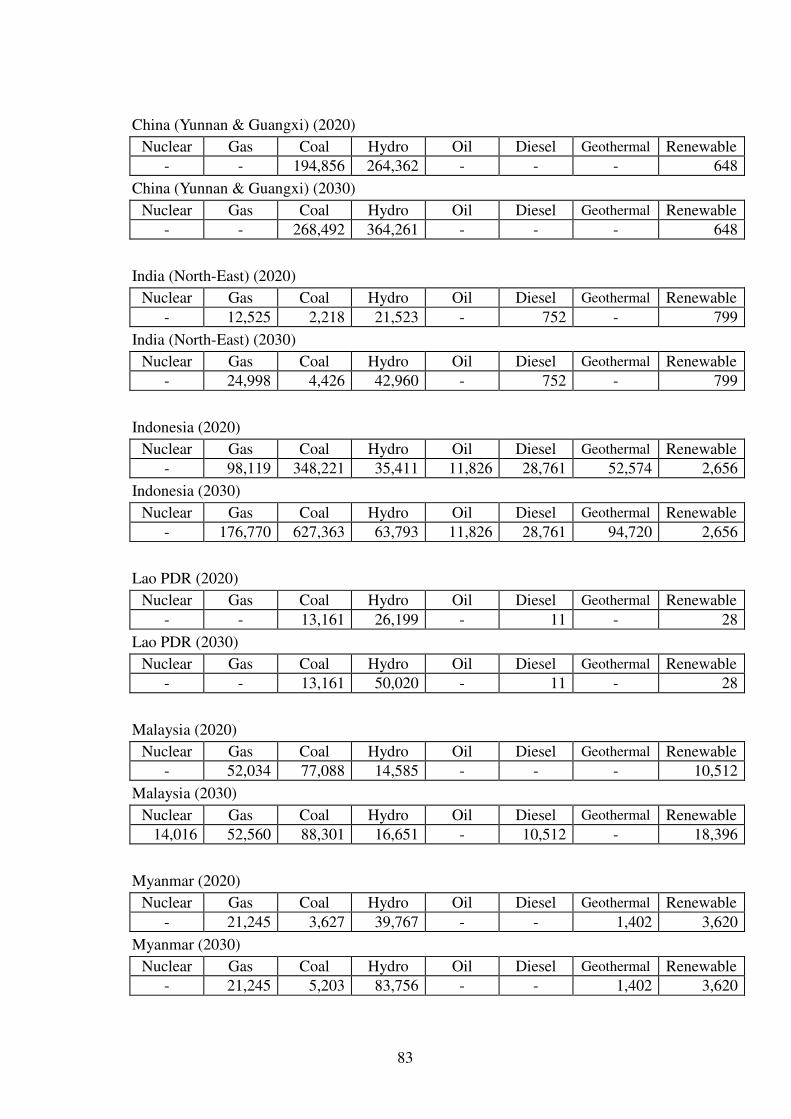
83
China (Yunnan & Guangxi) (2020)
Nuclear Gas Coal Hydro Oil Diesel Geothermal Renewable
- - 194,856 264,362 - - - 648
China (Yunnan & Guangxi) (2030)
Nuclear Gas Coal Hydro Oil Diesel Geothermal Renewable
- - 268,492 364,261 - - - 648
India (North-East) (2020)
Nuclear Gas Coal Hydro Oil Diesel Geothermal Renewable
- 12,525 2,218 21,523 - 752 - 799
India (North-East) (2030)
Nuclear Gas Coal Hydro Oil Diesel Geothermal Renewable
- 24,998 4,426 42,960 - 752 - 799
Indonesia (2020)
Nuclear Gas Coal Hydro Oil Diesel Geothermal Renewable
- 98,119 348,221 35,411 11,826 28,761 52,574 2,656
Indonesia (2030)
Nuclear Gas Coal Hydro Oil Diesel Geothermal Renewable
- 176,770 627,363 63,793 11,826 28,761 94,720 2,656
Lao PDR (2020)
Nuclear Gas Coal Hydro Oil Diesel Geothermal Renewable
- - 13,161 26,199 - 11 - 28
Lao PDR (2030)
Nuclear Gas Coal Hydro Oil Diesel Geothermal Renewable
- - 13,161 50,020 - 11 - 28
Malaysia (2020)
Nuclear Gas Coal Hydro Oil Diesel Geothermal Renewable
- 52,034 77,088 14,585 - - - 10,512
Malaysia (2030)
Nuclear Gas Coal Hydro Oil Diesel Geothermal Renewable
14,016 52,560 88,301 16,651 - 10,512 - 18,396
Myanmar (2020)
Nuclear Gas Coal Hydro Oil Diesel Geothermal Renewable
- 21,245 3,627 39,767 - - 1,402 3,620
Myanmar (2030)
Nuclear Gas Coal Hydro Oil Diesel Geothermal Renewable
- 21,245 5,203 83,756 - - 1,402 3,620
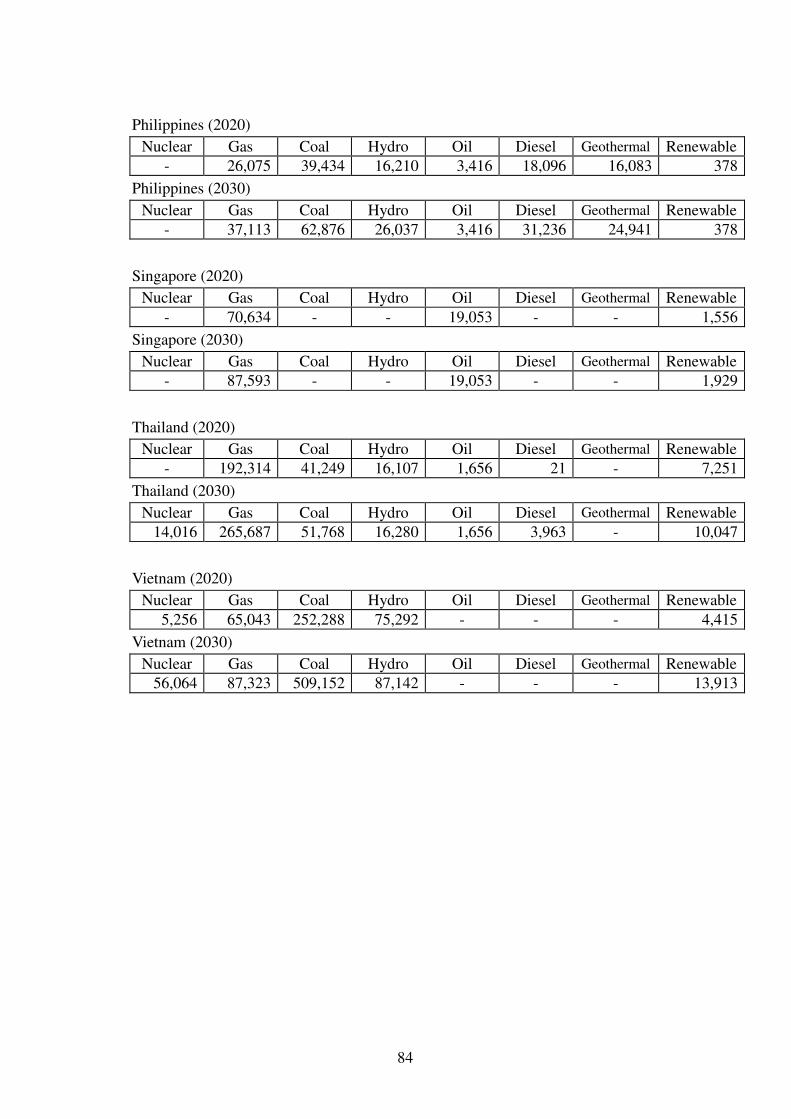
84
Philippines (2020)
Nuclear Gas Coal Hydro Oil Diesel Geothermal Renewable
- 26,075 39,434 16,210 3,416 18,096 16,083 378
Philippines (2030)
Nuclear Gas Coal Hydro Oil Diesel Geothermal Renewable
- 37,113 62,876 26,037 3,416 31,236 24,941 378
Singapore (2020)
Nuclear Gas Coal Hydro Oil Diesel Geothermal Renewable
- 70,634 - - 19,053 - - 1,556
Singapore (2030)
Nuclear Gas Coal Hydro Oil Diesel Geothermal Renewable
- 87,593 - - 19,053 - - 1,929
Thailand (2020)
Nuclear Gas Coal Hydro Oil Diesel Geothermal Renewable
- 192,314 41,249 16,107 1,656 21 - 7,251
Thailand (2030)
Nuclear Gas Coal Hydro Oil Diesel Geothermal Renewable
14,016 265,687 51,768 16,280 1,656 3,963 - 10,047
Vietnam (2020)
Nuclear Gas Coal Hydro Oil Diesel Geothermal Renewable
5,256 65,043 252,288 75,292 - - - 4,415
Vietnam (2030)
Nuclear Gas Coal Hydro Oil Diesel Geothermal Renewable
56,064 87,323 509,152 87,142 - - - 13,913
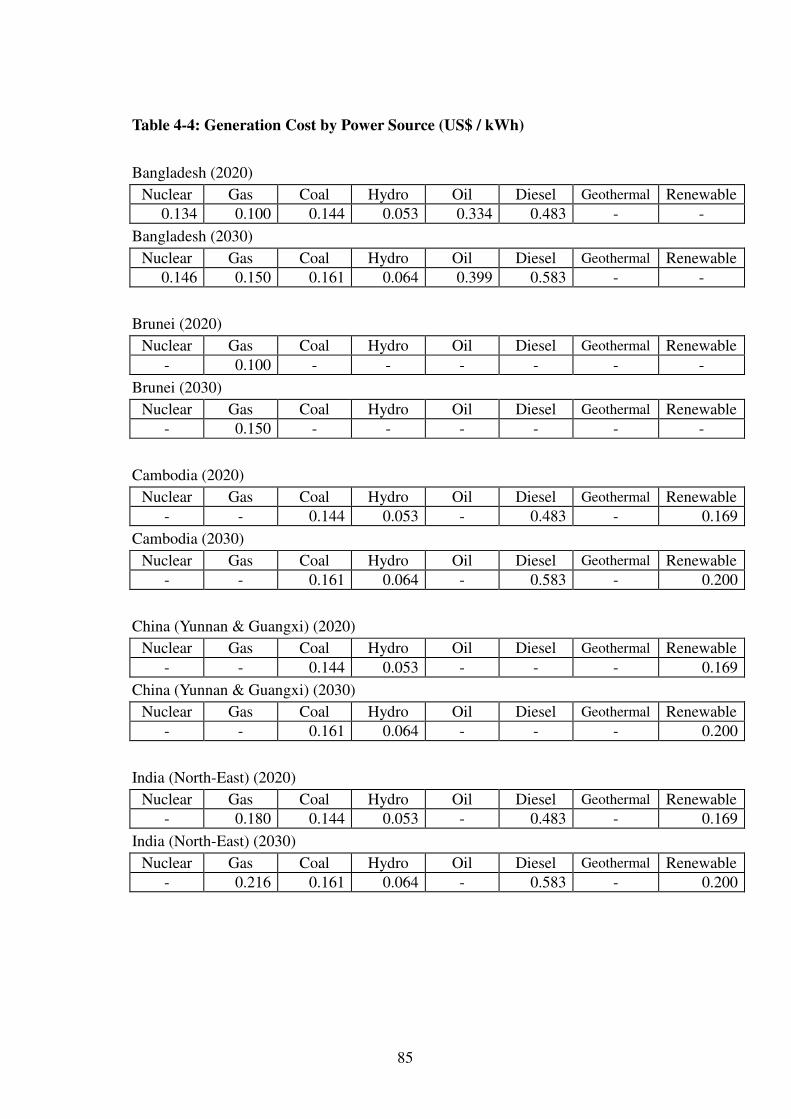
85
Table 4-4: Generation Cost by Power Source (US$ / kWh)
Bangladesh (2020)
Nuclear Gas Coal Hydro Oil Diesel Geothermal Renewable
0.134 0.100 0.144 0.053 0.334 0.483 - -
Bangladesh (2030)
Nuclear Gas Coal Hydro Oil Diesel Geothermal Renewable
0.146 0.150 0.161 0.064 0.399 0.583 - -
Brunei (2020)
Nuclear Gas Coal Hydro Oil Diesel Geothermal Renewable
- 0.100 - - - - - -
Brunei (2030)
Nuclear Gas Coal Hydro Oil Diesel Geothermal Renewable
- 0.150 - - - - - -
Cambodia (2020)
Nuclear Gas Coal Hydro Oil Diesel Geothermal Renewable
- - 0.144 0.053 - 0.483 - 0.169
Cambodia (2030)
Nuclear Gas Coal Hydro Oil Diesel Geothermal Renewable
- - 0.161 0.064 - 0.583 - 0.200
China (Yunnan & Guangxi) (2020)
Nuclear Gas Coal Hydro Oil Diesel Geothermal Renewable
- - 0.144 0.053 - - - 0.169
China (Yunnan & Guangxi) (2030)
Nuclear Gas Coal Hydro Oil Diesel Geothermal Renewable
- - 0.161 0.064 - - - 0.200
India (North-East) (2020)
Nuclear Gas Coal Hydro Oil Diesel Geothermal Renewable
- 0.180 0.144 0.053 - 0.483 - 0.169
India (North-East) (2030)
Nuclear Gas Coal Hydro Oil Diesel Geothermal Renewable
- 0.216 0.161 0.064 - 0.583 - 0.200
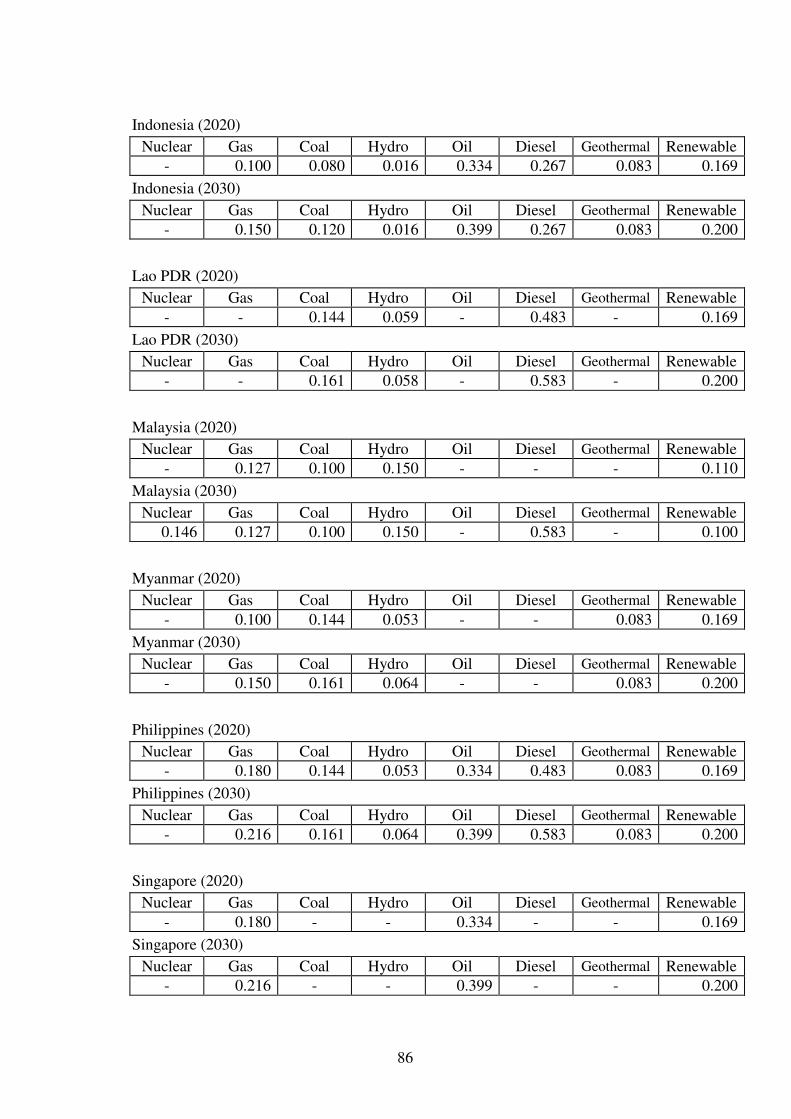
86
Indonesia (2020)
Nuclear Gas Coal Hydro Oil Diesel Geothermal Renewable
- 0.100 0.080 0.016 0.334 0.267 0.083 0.169
Indonesia (2030)
Nuclear Gas Coal Hydro Oil Diesel Geothermal Renewable
- 0.150 0.120 0.016 0.399 0.267 0.083 0.200
Lao PDR (2020)
Nuclear Gas Coal Hydro Oil Diesel Geothermal Renewable
- - 0.144 0.059 - 0.483 - 0.169
Lao PDR (2030)
Nuclear Gas Coal Hydro Oil Diesel Geothermal Renewable
- - 0.161 0.058 - 0.583 - 0.200
Malaysia (2020)
Nuclear Gas Coal Hydro Oil Diesel Geothermal Renewable
- 0.127 0.100 0.150 - - - 0.110
Malaysia (2030)
Nuclear Gas Coal Hydro Oil Diesel Geothermal Renewable
0.146 0.127 0.100 0.150 - 0.583 - 0.100
Myanmar (2020)
Nuclear Gas Coal Hydro Oil Diesel Geothermal Renewable
- 0.100 0.144 0.053 - - 0.083 0.169
Myanmar (2030)
Nuclear Gas Coal Hydro Oil Diesel Geothermal Renewable
- 0.150 0.161 0.064 - - 0.083 0.200
Philippines (2020)
Nuclear Gas Coal Hydro Oil Diesel Geothermal Renewable
- 0.180 0.144 0.053 0.334 0.483 0.083 0.169
Philippines (2030)
Nuclear Gas Coal Hydro Oil Diesel Geothermal Renewable
- 0.216 0.161 0.064 0.399 0.583 0.083 0.200
Singapore (2020)
Nuclear Gas Coal Hydro Oil Diesel Geothermal Renewable
- 0.180 - - 0.334 - - 0.169
Singapore (2030)
Nuclear Gas Coal Hydro Oil Diesel Geothermal Renewable
- 0.216 - - 0.399 - - 0.200

87
Thailand (2020)
Nuclear Gas Coal Hydro Oil Diesel Geothermal Renewable
- 0.180 0.144 0.053 0.334 0.483 - 0.169
Thailand (2030)
Nuclear Gas Coal Hydro Oil Diesel Geothermal Renewable
0.146 0.216 0.161 0.064 0.399 0.583 - 0.200
Vietnam (2020)
Nuclear Gas Coal Hydro Oil Diesel Geothermal Renewable
0.134 0.180 0.080 0.053 - - - 0.169
Vietnam (2030)
Nuclear Gas Coal Hydro Oil Diesel Geothermal Renewable
0.146 0.216 0.120 0.064 - - - 0.200
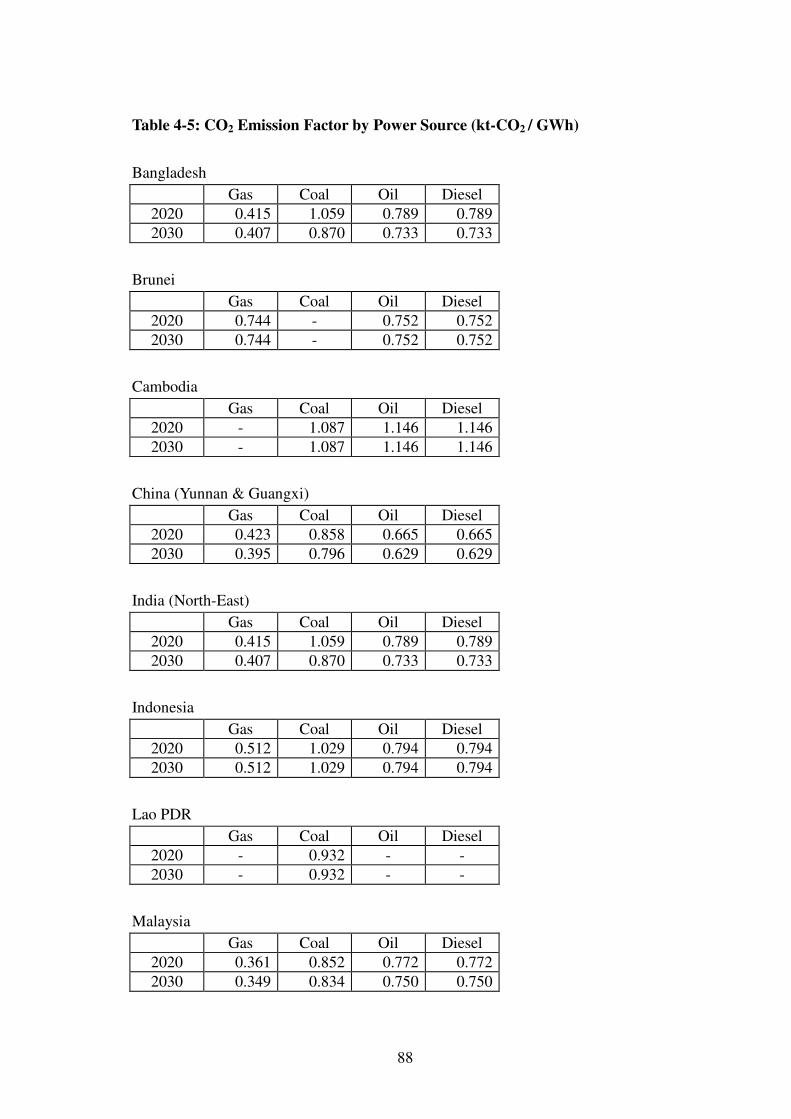
88
Table 4-5: CO2 Emission Factor by Power Source (kt-CO2 / GWh)
Bangladesh
Gas Coal Oil Diesel
2020 0.415 1.059 0.789 0.789
2030 0.407 0.870 0.733 0.733
Brunei
Gas Coal Oil Diesel
2020 0.744 - 0.752 0.752
2030 0.744 - 0.752 0.752
Cambodia
Gas Coal Oil Diesel
2020 - 1.087 1.146 1.146
2030 - 1.087 1.146 1.146
China (Yunnan & Guangxi)
Gas Coal Oil Diesel
2020 0.423 0.858 0.665 0.665
2030 0.395 0.796 0.629 0.629
India (North-East)
Gas Coal Oil Diesel
2020 0.415 1.059 0.789 0.789
2030 0.407 0.870 0.733 0.733
Indonesia
Gas Coal Oil Diesel
2020 0.512 1.029 0.794 0.794
2030 0.512 1.029 0.794 0.794
Lao PDR
Gas Coal Oil Diesel
2020 - 0.932 - -
2030 - 0.932 - -
Malaysia
Gas Coal Oil Diesel
2020 0.361 0.852 0.772 0.772
2030 0.349 0.834 0.750 0.750
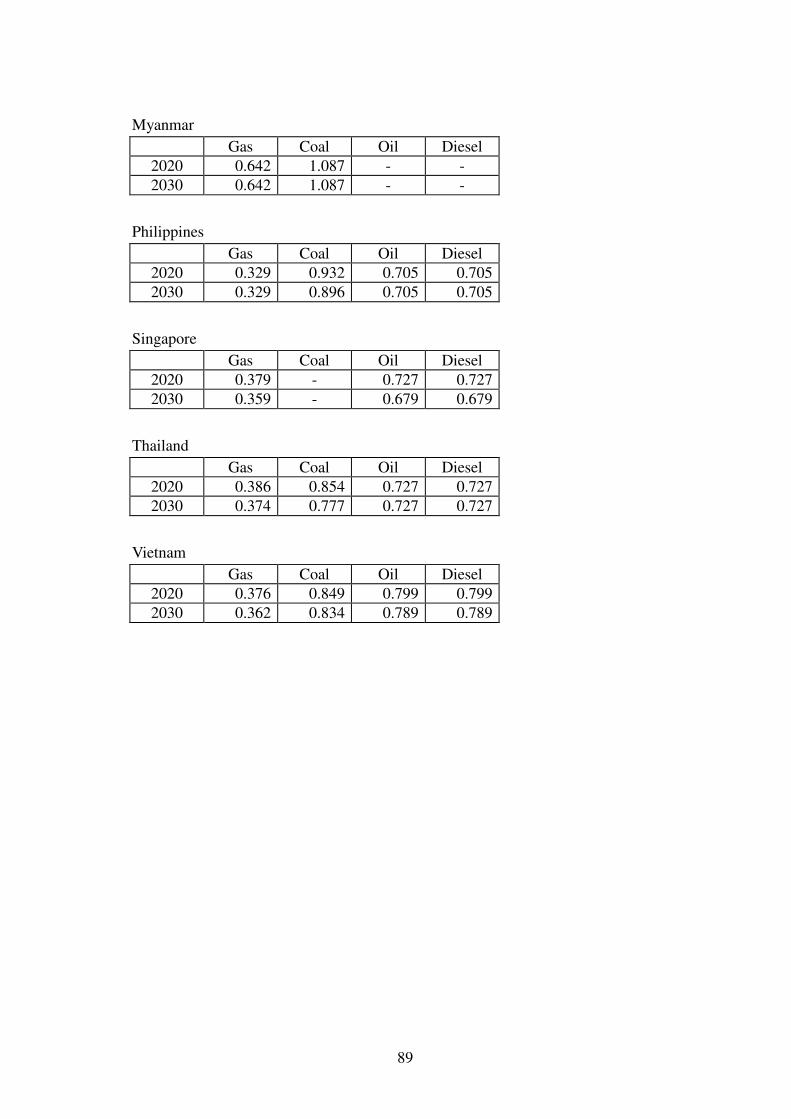
89
Myanmar
Gas Coal Oil Diesel
2020 0.642 1.087 - -
2030 0.642 1.087 - -
Philippines
Gas Coal Oil Diesel
2020 0.329 0.932 0.705 0.705
2030 0.329 0.896 0.705 0.705
Singapore
Gas Coal Oil Diesel
2020 0.379 - 0.727 0.727
2030 0.359 - 0.679 0.679
Thailand
Gas Coal Oil Diesel
2020 0.386 0.854 0.727 0.727
2030 0.374 0.777 0.727 0.727
Vietnam
Gas Coal Oil Diesel
2020 0.376 0.849 0.799 0.799
2030 0.362 0.834 0.789 0.789

90
Table 4-6: Calculation Results (Base Case in 2020)
[CO2 emission volume not restricted]

91
Table 4-7: Calculation results (Accelerated Case in 2030)
[CO2 emission volume not restricted]
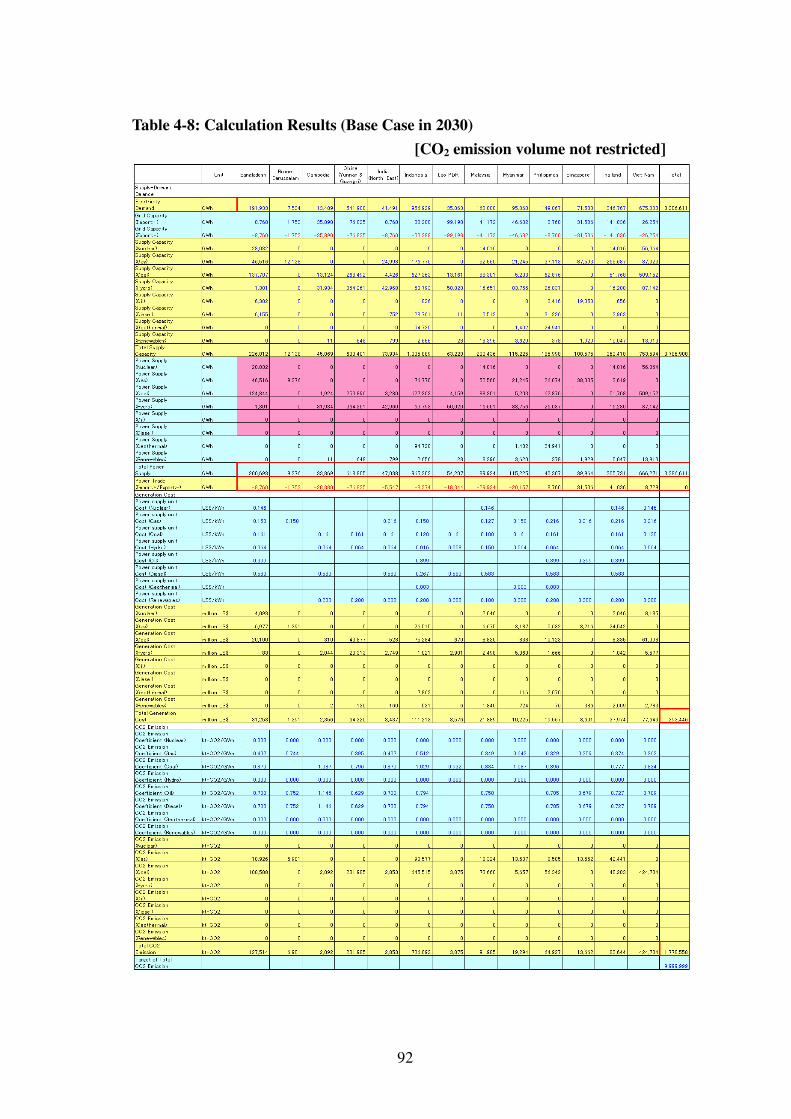
92
Table 4-8: Calculation Results (Base Case in 2030)
[CO2 emission volume not restricted]
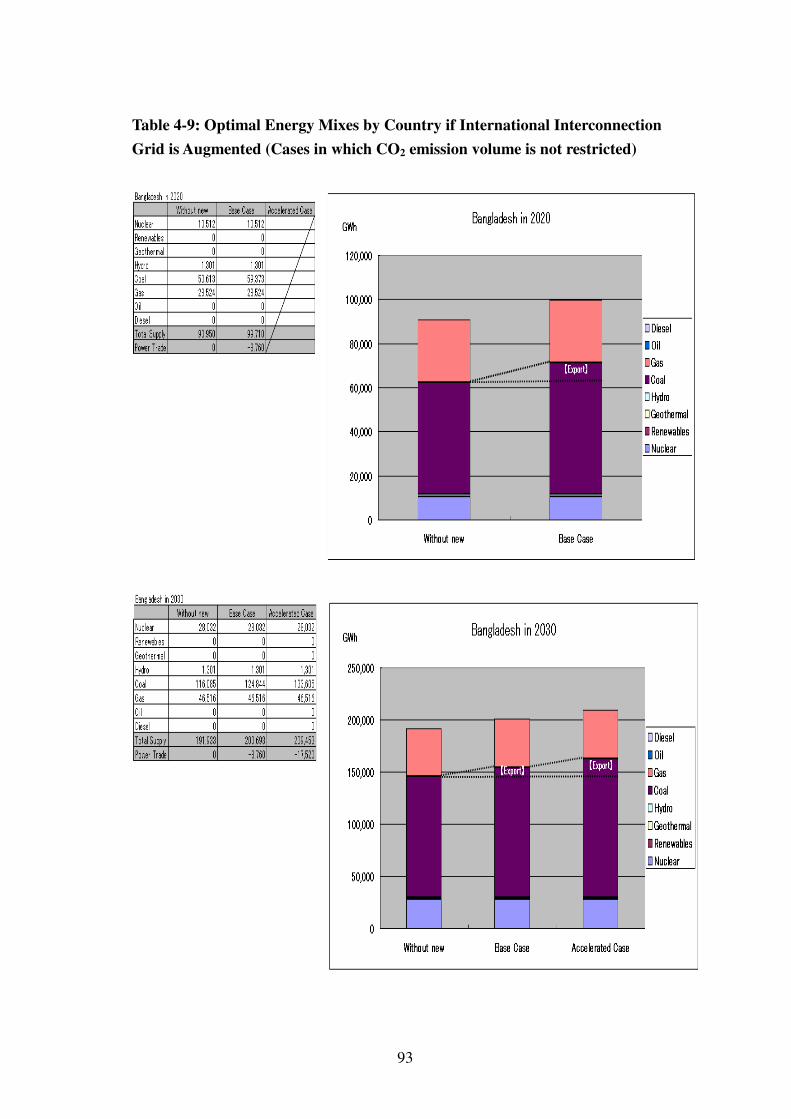
93
Table 4-9: Optimal Energy Mixes by Country if International Interconnection
Grid is Augmented (Cases in which CO2 emission volume is not restricted)

94

95

96

97

98

99
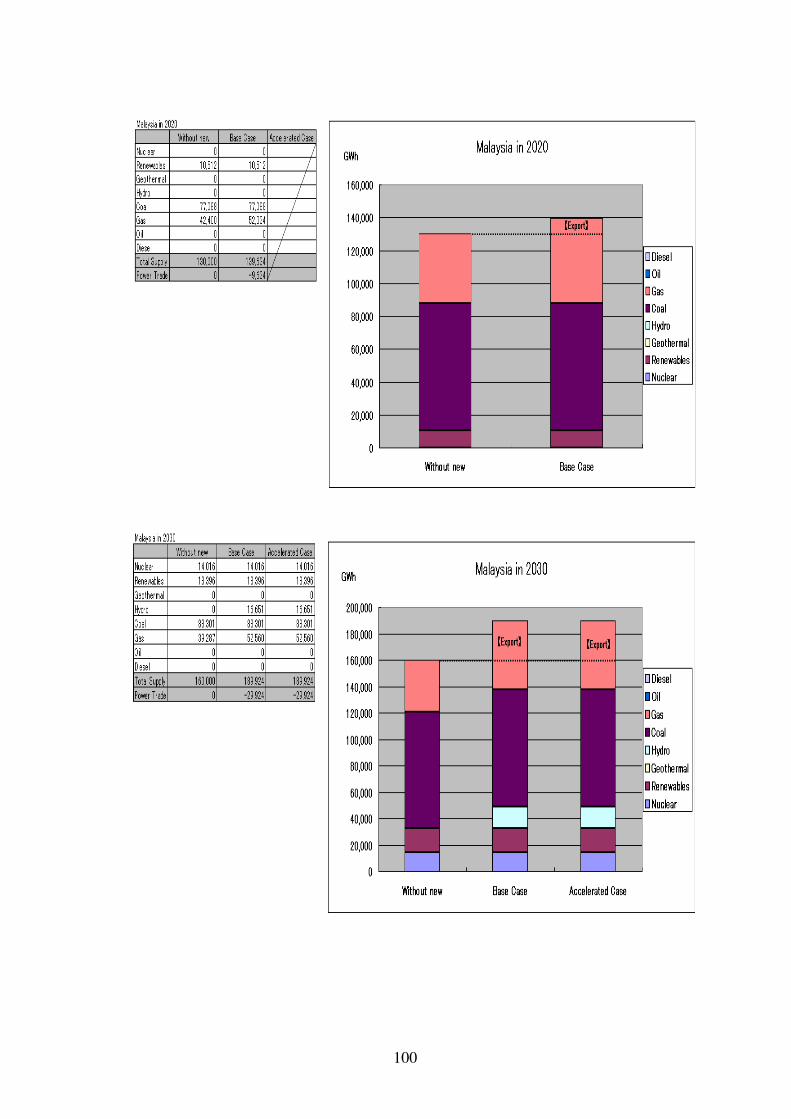
100
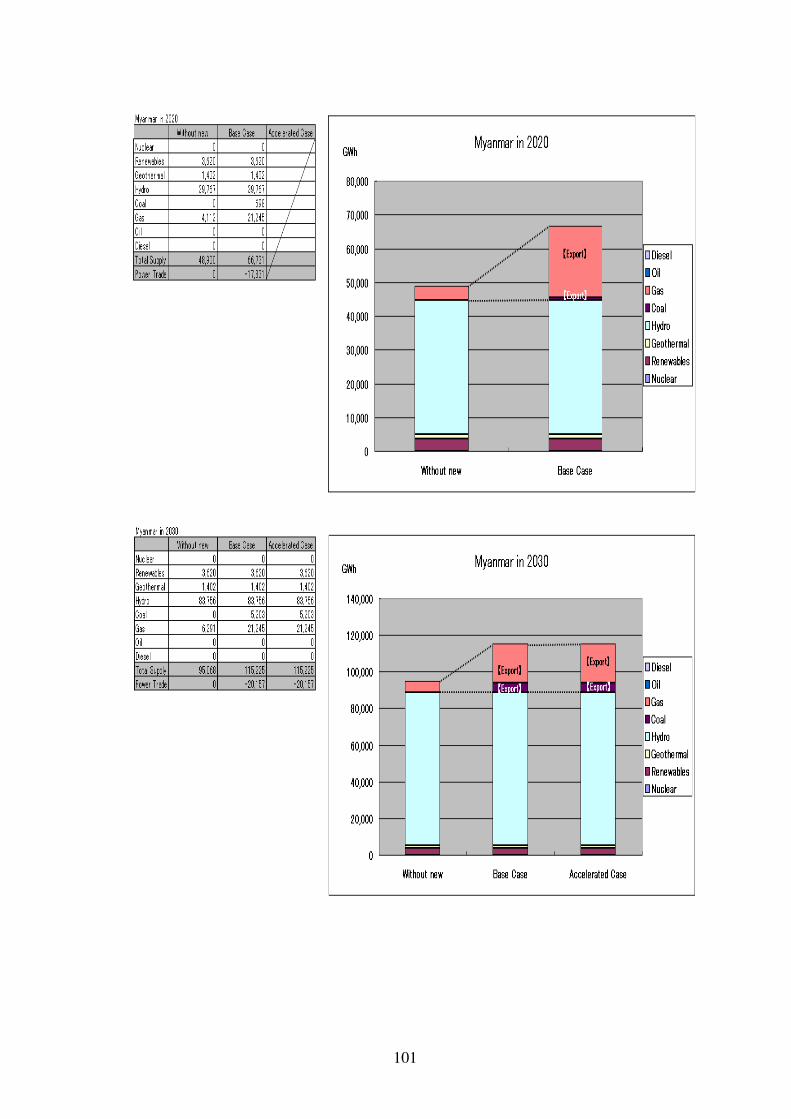
101
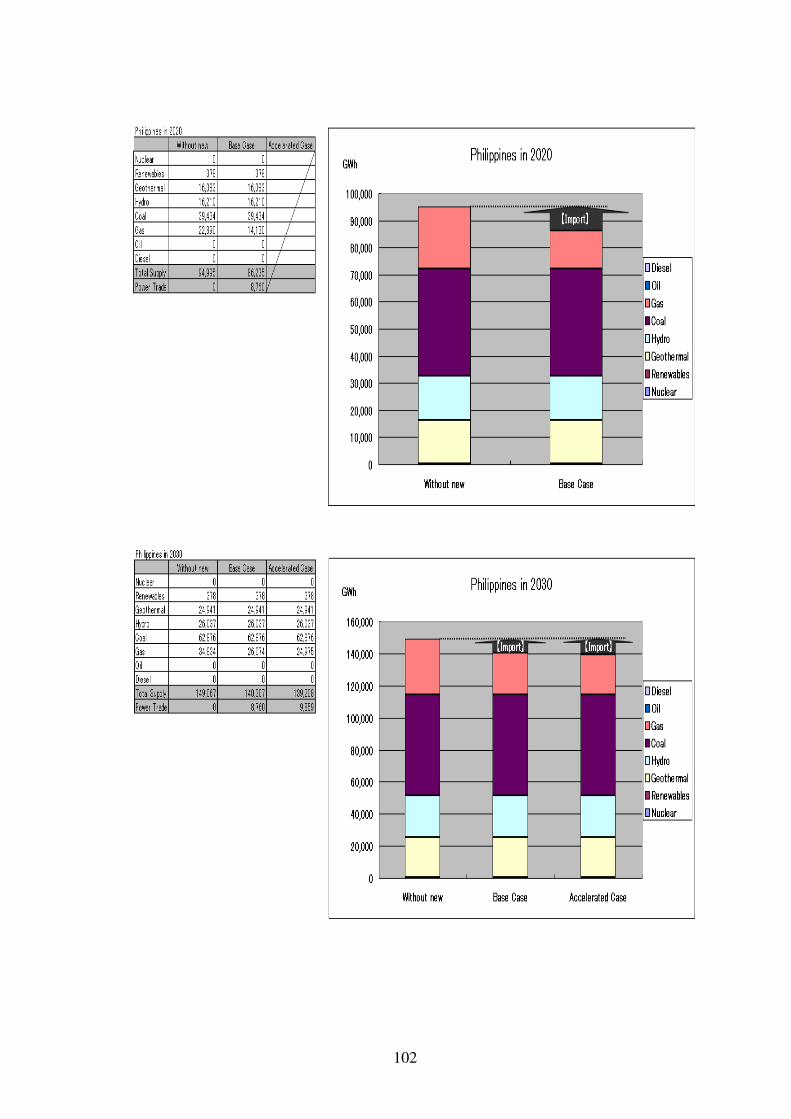
102

103

104

105
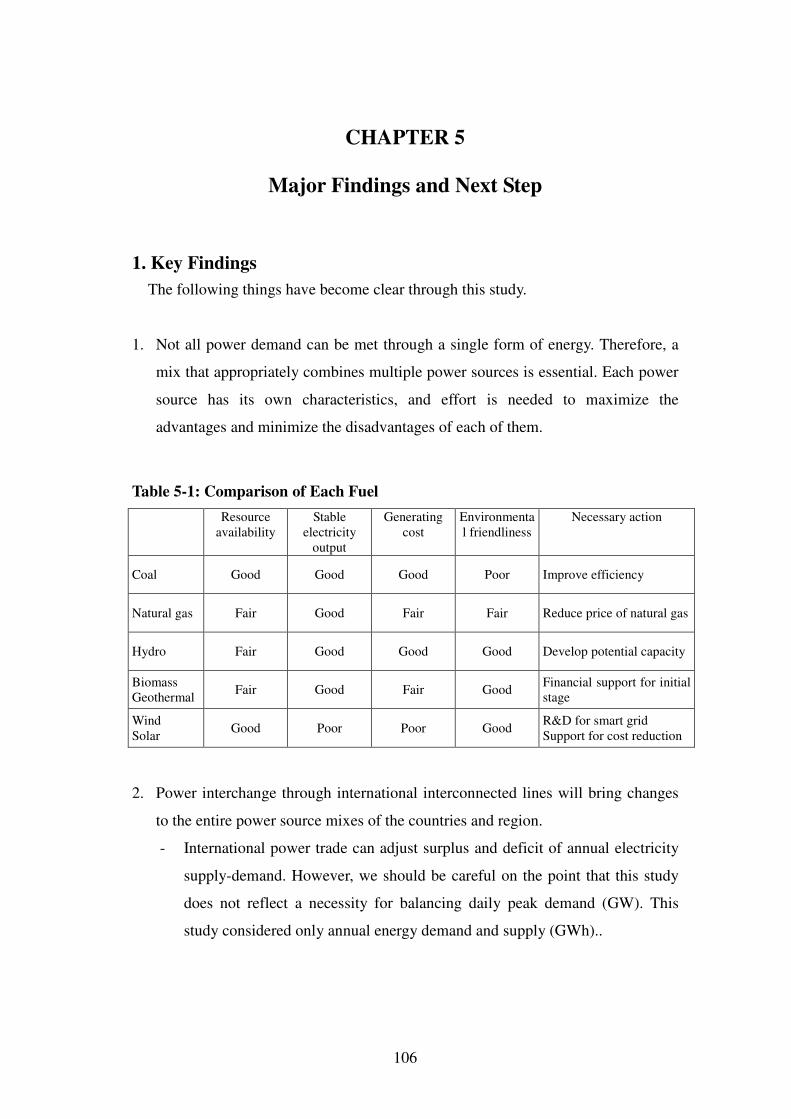
106
CHAPTER 5
Major Findings and Next Step
1. Key Findings
The following things have become clear through this study.
1. Not all power demand can be met through a single form of energy. Therefore, a
mix that appropriately combines multiple power sources is essential. Each power
source has its own characteristics, and effort is needed to maximize the
advantages and minimize the disadvantages of each of them.
Table 5-1: Comparison of Each Fuel
Resource
availability
Stable
electricity
output
Generating
cost
Environmenta
l friendliness
Necessary action
Coal Good Good Good Poor Improve efficiency
Natural gas Fair Good Fair Fair Reduce price of natural gas
Hydro Fair Good Good Good Develop potential capacity
Biomass
Geothermal Fair Good Fair Good
Financial support for initial
stage
Wind
Solar Good Poor Poor Good
R&D for smart grid
Support for cost reduction
2. Power interchange through international interconnected lines will bring changes
to the entire power source mixes of the countries and region.
- International power trade can adjust surplus and deficit of annual electricity
supply-demand. However, we should be careful on the point that this study
does not reflect a necessity for balancing daily peak demand (GW). This
study considered only annual energy demand and supply (GWh)..

107
- Utilization of low-cost power sources available in the region can be
maximized. Namely, total power generating cost can be reduced by
expanding the interchange capacity of international interconnected lines.
- Emissions of air pollutants including carbon dioxide can be reduced by
maximizing utilization of hydropower generation and renewable energy. It is,
however, depending on hydropower and renewables potential in the region.
3. Total investment in power sources can be reduced for the entire region through
power interchange via international interconnected grid networks. The total
investment reduction effect will be largest under lax regulations for carbon
dioxide emissions. On the other hand, as regulations on carbon dioxide emissions
are tightened, use of relatively inexpensive coal-fired thermal power will fall,
while supplying of more expensive but cleaner gas-fired thermal power will
increase, diminishing the total investment reduction effect. In short, there is a
tradeoff relationship between the reduction effect on total investment in power
infrastructure and the strength of carbon dioxide emission regulations. In other
words, the strength of environmental regulations has a significant impact on the
selection of fuels for power generation.
4. Through power interchange, countries can alleviate discrepancies between power
demand and energy resources for power generation. Expanding the interchange
capacity of international interconnected grid networks enables stabilization of
power supply throughout an entire region and reduction of dependence on
imported fuels. This contributes to greater energy security throughout the region.
5. In countries and regions where domestic power grids themselves are insufficient,
international interconnected grid networks can be expected to supplement them.
On the other hand, it is conceivable that in some cases, upgrading the domestic
power grid is necessary in order to maximize utilization of the energy resources
that exist in a region. Therefore, domestic power grids should be upgraded at the
same time international interconnected grid networks are improved.

108
In light of the above outcomes, the following points should be borne in mind for
future power source development.
• Development of potential resources for power generation shall be quick. In a
development, it is necessary to consider the roles of each power source for the
base, middle, and peak load purpose and to combine them appropriately.
- Develop hydropower, which is economical and environmentally-friendly
(except during construction), and for which there is still much untapped
resources in the region.
- Develop coal-fired power plant, which is outstanding in terms of economy
and amount of resources, especially in China, Indonesia and Vietnam.
- Develop renewable energy that is relatively economical, such as geothermal
and biomass, except solar power.
• Energy utilization that ignores environmental impact is impossible. For power
generation as well, initiatives that move towards cleaner energy utilization
should be strengthened.
- Promote higher efficiency in coal-fired power generation. Reducing the
emission in flue gas through higher efficiency will alleviate the sole
disadvantage of coal utilization.
- Expanded use of natural gas with its outstanding environmental
performances is desirable from the perspective of reducing environmental
impact, but natural-gas-fired power plant is less economical than coal-fired.
It is, therefore, necessary to mitigate the economic disadvantage of natural-
gas-fired power plant by working to lower the procurement cost as well as
price of natural gas.
Along with power source development, in order to maximize cross border power
trading, improvement and expansion of international grid networks are necessary. As
noted above, the ADB's GMS program and HAPUA's ASEAN Power Grid are
underway. However, there seem remains some barriers to the realization of those

109
plans. It is necessary to recognize those barriers and steadily undertake measures to
eliminate them. Initiatives such as the following are necessary for their elimination.
• First, it is necessary to clarify the degree to which integration of the intra-
regional electricity market is ultimately to be carried. If the goal is a single
electricity market transcending national boundaries, such as that for which the
European Union aims, a highly-independent regulatory body with powerful legal
authority must be organized. On the other hand, if integration of the electricity
market for the entire region is not a goal, and if national electricity markets are
to be the rule, there are options for carrying out power interchange within
rational political and economic parameters.
Clearly, if the advantages of an international power grid as shown by this study
are to be brought out fully, creation of a single electricity market transcending
national borders is necessary.
• Although they will vary depending on the degree of market integration that is the
goal, in any case, a coordinator that can balance interests in the region and set
direction is necessary. The coordinator (organization) should have the following
functions. If integration is to be deepened, the coordinating organization will
need to concentrate on more functions; and it will need to be given the necessary
authority.
- The ability to establish systems and technical standards for the creation of a
regional electricity market
- The ability to make future plans related to power source development and the
international power grid connections
- Monitoring and guidance of plan implementation in each country
- The ability to coordinate daily supply and demand
• Integration of systems and technical standards related to power interchange must
be advanced. More concretely, that might include the following.
- Standard connection conditions for transmission equipment (connection
methods, measurement methods, division of ownership/management)
110
- Quality standards for power that is interchanged (voltage, frequency, and
acceptable variation)
- Operating rules (load-dispatch instructions, contact methods)
- Rules for handling and responding to emergencies
- Standard contractual conditions for interchange contracts (standard contract)
- Standards for calculating rates for power that is interchanged
- Taxes that apply to power that is interchanged
• Schemes to procure the funds needed for power source development and grid
interconnection project investment are required. Whether financing can be
provided is an important key to materialize international grid interconnection
plan. When considering the possibility of loans and their conditions, it should
probably be remembered that the benefits of international grid interconnection
will spread to multiple countries and will contribute to improve energy security.
However, it would be somewhat unreasonable to ask private-sector financial
institutions to evaluate the benefits, which are difficult to quantify. Governments
and international financial institutions should undertake some initiatives.
- Loan guarantees from governments in the countries concerned
- Creation of a regional fund for power infrastructure improvement, with loan
or loan guarantee functions. East Asian governments would finance the fund.
- Loans from international financial institutions such as the ADB
- Loans from development banks in developed countries (however, that will be
conditioned on benefit to the lending country)
2. Next Step
This year's study obtained the above knowledge and findings, but there are still
areas where analysis remains insufficient or deeper inquiry is needed. Those are
subjects for study in the coming fiscal year and beyond.
• For the optimal power source mix for the entire region's power supply, if one
does not consider carbon dioxide emission volume, resettlement due to
hydropower development, or environmental issues such as NOx and SOx from
111
coal-fired power plants, then the answer one obtains is to begin developing the
cheapest power sources. However, each country has its own energy policy,
which of course affects the choice of power sources. If such policy factors can be
incorporated into a model's constraints, then more realistic results can be
obtained.
• The analytical model in this study focuses on optimal power supply for the
region as a whole. It is constructed from a macro perspective that simulates
balanced electricity supply and demand throughout the year. Therefore, elements
related to each country's load curve data and state of domestic power grid,
transmission loss and transmission costs accompanying international grid
interconnection are not incorporated. In addition, in actual equipment planning,
it is important to consider the roles of each power source in the base, middle, and
peak and to combine them appropriately. If such micro elements can be reflected
in the models, more exact results can be obtained.
• The cost effectiveness of international grid interconnection will likely vary by
route. Since budget funds that can be devoted to international grid
interconnection are limited, development of those routes with higher investment
efficiency should be prioritized. If this study is able to identify which routes
offer such investment efficiency, then it will contribute to real-world
improvements rather than just being a subject for academic debate.
• Interconnection grid network cost should be taken into account in the model for
optimal solution of electricity import-export for balancing electricity demand
and supply.