icici bank uk · pdf fileicici bank uk plc offers retail and corporate banking ... expansion...
TRANSCRIPT

ICICI BANK UK PLCStrategic report, Directors’ report and financial statements
March 31, 2014Registered number 4663024

2
Strategic report 3
Directors’ report 12
Statement of Directors’ responsibilities 14
Report of the independent auditor 15
Profit and loss account 16
Balance sheet 17
Statement of total recognised gains and losses 18
Reconciliation of movements in shareholders’ funds 19
Notes 21
Contents
ICICI Bank UK PLC, Strategic reportDirectors’ report and financial statements
March 31, 2014

3
ICICI Bank UK PLC, Strategic reportDirectors’ report and financial statements
March 31, 2014
Strategic report
The Directors present their strategic report for the year ended March 31, 2014 (FY2014) for ICICI Bank UK PLC (“the Bank”).
Nature of Business
ICICI Bank UK PLC offers retail and corporate banking services. The Bank is authorised by the Prudential Regulation Authority (PRA) and regulated by the PRA and the Financial Conduct Authority (FCA). The Bank is a wholly owned subsidiary of ICICI Bank Limited (“the Parent Bank”) which is India’s largest private sector bank. The key business areas include retail banking, corporate banking, commercial banking and treasury.
The Bank was incorporated in England and Wales as a private company with limited liability on February 11, 2003 and was converted to a public limited company, assuming the name ICICI Bank UK PLC, on October 30, 2006. As a public limited company, the Bank is able to access the capital markets.
The Bank has a senior debt rating of Baa3 from Moody’s Investors Service Limited (Moody’s).
Business Review
The Bank delivers its corporate, commercial and retail banking products and services through nine branches located in the UK and two branches in mainland Europe, located in Antwerp (Belgium) and Frankfurt (Germany) as well as through online banking.
The Bank’s corporate business includes banking services for Indian corporations seeking to develop their overall business, including in the UK and Europe, for Europe based multinational corporations which have active trade and investment flows with India and for large businesses owned by persons of Indian origin. The business strategy of the Bank has mainly been driven by the increased globalisation of the Indian economy, the growing trend of Indian corporates expanding overseas, the large population of non-resident Indians and persons of Indian origin across the globe and overseas companies looking to invest in India.
The Bank provides retail banking services to UK consumers with a varied product suite including current accounts, savings accounts, online banking, debit cards, money transfers and travel solutions. Additionally, the Bank offers interest based savings accounts and fixed rate term accounts to UK and German consumers which are supported over internet and phone enabled channels.
During the course of FY2014, the Bank remained focused on its key strategic objectives of diversification of the business profile, expanding non-interest income streams, continued focus on proactive risk management, effective liquidity and capital management and meeting the requirements of the changing regulatory environment. The Bank’s focus is to build a sustainable business model with a strong and robust corporate governance and control environment.
The Bank has been managed as a single business. For the purposes of the business review, however, management has described activity within the individual business segments.
The financial information in the following sections have also been presented in Indian Rupee (INR) currency for convenience using closing exchange rate of USD/INR 59.915 which has been applied across both FY2014 and FY20131.
Key strategic highlights: FY2014
During FY2014, the Bank continued with its key strategic objectives of diversification of its asset and liability portfolio, development of non-interest income streams, improvements in operating efficiencies and further strengthening of the control and governance framework including a conduct risk
1The numbers in INR are proforma only and should not be regarded as being in compliance with UK GAAP.

4
ICICI Bank UK PLC, Strategic reportDirectors’ report and financial statements
March 31, 2014
management framework. The Bank selectively grew its asset portfolio within the established risk appetite, whilst selectively tapping the market opportunities in specific business segments, which are aligned with its core competencies and strengths. During the year, the Bank further enhanced its risk appetite framework, recovery and resolution planning and monitoring arrangements to meet regulatory expectations. The Bank is well capitalized and is already in compliance with the fully-phased in capital requirements under the new CRD IV and Basel III capital standards.
The improved financial performance during the year is a result of selective growth in the loan book within the risk appetite, reduction in cost of funds, expansion of non-interest revenues and reduction in provisions. The change in strategic direction first introduced in FY2011 and further embedded during FY2014 through continuing diversification of the assets and liabilities as well as growth in fee generating businesses.
The total balance sheet increased by 25% in FY2014 to USD 4,471 million (INR 267,889 million), primarily due to growth in loans and advances to customers. The loans and advances to customers increased by 20%, mainly on account of corporate loans and loans against Foreign Currency Non Residents (FCNR) deposits held by customers with Indian banks, a new retail product category of loans to high net worth individuals, launched during the year. The Bank selectively grew its corporate loan portfolio within the risk appetite framework. During the year, the focus was maintained on balancing geographical and industrial concentration as well as further improving the rating profile of its corporate loan portfolio. In continuation of its key strategic objective of diversification of the asset portfolio, the Bank further strengthened the trade and commercial banking business.
On the funding side, the Bank rebalanced its funding sources and raised customers’ deposits through savings and term deposit products. Following the launch of different variants of the existing online savings product and targeted marketing campaigns, the total customer deposit balances grew by 41% during the year, of which the institutional in the Frankfurt branch grew by 96% compared to the previous year. The Bank successfully diversified and broadened its funding profile and reduced the cost of funds by leveraging the retail and wholesale funding channel along with other funding sources such as banker’s acceptances and repurchase agreements.
Specific focus was given to enhancing the granular income streams by building scale in several non-interest income generating businesses. Significant growth was seen in revenue streams, such as the “Money to India (M2I) Europe” remittance platform and commercial banking business revenues which contributed to enhancing the non-interest income as well as to the diversification of the overall income streams of the Bank.
Overall provisions reduced during the year from USD 27.2 million (INR 1,631 million) to USD 20.2 million (INR 1,211 million), reduction of 26%. The Bank continued to remain focused on enhancing operating efficiencies without compromising the control environment. Several initiatives were taken such as renegotiations with vendors and rationalisation of operations to optimise the expense base. Expenses remained at similar levels compared to the previous financial year. The Bank remains committed to maintaining a strong control framework to meet the increasing regulatory and reporting obligations and has continued to invest in people and technology to further strengthen the control framework. The cost to income ratio2 fell markedly to 39% for FY2014 compared with 44% for FY2013.
In view of the ongoing extensive changes in regulatory landscape as well as the Bank’s strategy, resulting in the growth in business, considerable attention was given to further enhancing the Conduct Risk Framework and improving the customer experience. Further, increased focus on management of complaints ensured that all complaints were closed well within the regulatory stipulated timeframes.The capital and liquidity position remained healthy throughout FY2014. The Bank’s approach to managing capital and liquidity is designed to ensure that current and expected regulatory capital and liquidity requirements are met. The capital ratio at 21.8% remained strong as at March 31, 2014 with a
2Income includes profit/(Loss) on debt securities
Strategic report (continued)

5
ICICI Bank UK PLC, Strategic reportDirectors’ report and financial statements
March 31, 2014
Tier 1 capital ratio of 16.7% which is above the regulatory requirements. The Bank paid USD 25 million (INR 1,499 million) of equity dividend during the financial year. The Bank continues to comply with and maintains Liquid Assets Buffer (LAB) balances in line with the Individual Liquidity Guidance (ILG).
In June 2013, the European Commission published the final Regulation and Directive, known collectively as CRD IV, to give effect to the Basel III framework in the EU. This came into effect on January 01, 2014. The Bank successfully implemented the CRD vIV liquidity and capital reporting requirements along with complying with the other requirements of the directive.
Corporate and Commercial Banking
The Corporate Banking division continued to grow selectively the loan portfolio targeting client segments and offering products which are core to the Bank’s competencies and strategy, its clients’ needs and in line with the risk appetite. The corporate loan book grew moderately by 8% to USD 2,460 million compared with USD 2,283 million in the previous year. In the course of the year, the Bank targeted its strategic customer segments which included subsidiaries of select Indian companies and large multinational companies, including global trading houses and large businesses owned by persons of Indian origin and successfully built new relationships. The Bank made an encouraging start in successfully consummating local syndication and secondary market deals. The team focused on increasing the wallet share of the customers through cross selling which led to increase in the non lending revenues for Corporate Banking. Emphasis was placed on expanding commercial banking volumes by offering new products as well as enhancing existing market penetration for secondary market deals, trade structuring and trade finance volumes.
The Bank’s business in Frankfurt, Germany also grew during the year, leveraging on the local market as well as growing Europe-India business opportunities. During FY2014, new corporate banking relationships were established in the European market and the corporate loan portfolio increased compared with the previous year. Given the large volumes of trade between India and Germany, the Bank remained focused on participating in lending opportunities emanating from such trade activities. As part of its strategy, the Bank continues to diversify its asset base and improve its asset quality by increasing the proportion of higher rated loans to customers (internally rated A- and above).
Retail Banking
In line with the strategy of diversification of funding sources, the retail banking group remained one of the key funding source for the Bank. During the year, the Bank launched variants of its existing saving product which led to an increase in the retail deposit balances. The retail customer account balances increased to USD 1,959 million (INR 117,373 million) as at March 31, 2014 compared with USD 1,445 million (INR 86,577 million) in the previous year. This focus on rebalancing the retail and wholesale funding mix continued during the year in alignment with the Bank’s funding strategy. The balanced mix of retail and wholesale funding helped in reducing the cost of funds.
Retail fee income grew significantly during the year, primarily driven by an increase in the remittance volumes from UK and Continental Europe to India. Remittance related revenues showed a strong growth of 30% compared to last year mainly from the Money 2 India Europe remittance platform. The Bank expanded the product offering in remittances and also added new markets/countries in Europe during the year. Other products such as travel solutions and business foreign exchange also grew during the year. The Bank’s travel money service was commended in the travel money provider category by Consumer Moneyfacts Awards. During the year, the Bank closed two branches in the UK. There was negligible impact on customers, who were able to manage their accounts at neighbouring branches of the Bank, as well as over the internet and phone banking.
Strategic report (continued)

6
ICICI Bank UK PLC, Strategic reportDirectors’ report and financial statements
March 31, 2014
During the year, the Bank also entered into the secured retail assets category by offering a new product of loans against FCNR deposits. The product was offered during October 2013, when the Reserve Bank of India opened a window to the Indian banks to swap fresh FCNR dollar funds at competitive rates. The swap window was available until November 2013. The Bank offered loans against FCNR deposits to a select set of customers. During this period, the Bank deployed USD 289 million (INR 17,321 million) into loans against FCNR deposits which are fully cash collateralised.
The Bank remains focused on strengthening its service delivery platform to ensure excellent customer service and monitors customer service quality through using clearly defined comprehensive metrics. The Bank reviews the conduct risk parameters impacting the business on an ongoing basis.
Treasury
The Treasury Group of the Bank manages the balance sheet of the Bank, supporting the capital needs and managing the market and liquidity risk of the Bank. The Bank continues to comply with and maintain Liquid Assets Buffer (LAB) balances in line with the Individual Liquidity Guidance (ILG). The Bank reviews the asset/liability maturity mismatches and interest rate positions, and maintains liquidity gaps and interest rate positions within prescribed limits, which are monitored by the Asset and Liability Management Committee (ALCO) of the Bank. In line with the strategy of diversification of funding sources and to minimize the cost of funds, the Bank continues to focus on exploring alternative funding sources. The Bank has leveraged opportunities in the wholesale market by raising bilateral loans and borrowings under the MTN program at competitive cost. During the year, the Bank had successfully enhanced the capability of the repo platform and regularly raises funds through the repo market. The Bank had also developed and increased the Institutional deposit book in Germany. These activities have led to a reduction in the overall cost of funds for the Bank.
The investment portfolio of the Bank is also managed by the Treasury Group. The treasury activities are carried out through the Balance Sheet Management Group, Investment desk, Global Markets Group and FCCB Group.
Strategic report (continued)

7
ICICI Bank UK PLC, Strategic reportDirectors’ report and financial statements
March 31, 2014
Financial Highlights
The financial performance for the financial year 2014 is summarised in the following table
Capital3
Profit and loss account Financial 2014 Financial 2013 % Change Financial 2014 Financial 2013
USD 000s USD 000s INR million INR million
Net interest income 55,232 50,892 9% 3,309 3,050
Non interest income 36,214 29,173 24% 2,170 1,748
Income/(Loss) on financial instruments at fair value through profit and loss
(1,291) 4,508 -129% (77) 270
Total operating income 90,155 84,573 7% 5,402 5,068
Operating expenses (36,790) (36,999) -1% (2,204) (2,216)
Profit before provisions, charges and taxes
53,365 47,574 12% 3,198 2,852
Impairment provision and charges (20,222) (27,224) -26% (1,211) (1,631)
Profit/(Loss) on sale of debt securities
2,974 (1,192) 349% 178 (71)
Profit before tax 36,117 19,158 89% 2,165 1,150
Profit after tax 25,224 14,383 75% 1,512 864
Balance sheet Financial 2014 Financial 2013 % Change Financial 2014 Financial 2013
USD 000s USD 000s INR million INR million
Balances at central banks 1,008,407 583,227 73% 60,419 34,944
Loans and advances to banks 79,079 78,657 1% 4,738 4,713
Loans and advances to customers 2,749,136 2,282,972 20% 164,714 136,784
Investments 498,885 525,655 -5% 29,890 31,495
Total assets 4,471,154 3,587,306 25% 267,889 214,934
Customer accounts 2,533,259 1,799,281 41% 151,780 107,804
Shareholders’ funds 629,049 622,172 1% 37,690 37,279
Capital Ratios Under CRDIVMarch 31, 2014
Under Basel IIMarch 31, 2013
Decrease
Core Tier 1 ratio 16.7% 19.3% 2.6%
Tier 1 ratio 16.7% 19.3% 2.6%
Total ratio 21.8% 30.8% 9.0%
Risk weighted assets Financial 2014 Financial 2013 % Change Financial 2014 Financial 2013
USD 000s USD 000s INR million INR million
Risk weighted 3,737,618 3,215,879 16% 223,939 192,679
3Pillar 3 disclosures are available online on the Bank’s website: http://icicibank.co.uk/personal/basel_disclosures.html
Strategic report (continued)
8
ICICI Bank UK PLC, Strategic reportDirectors’ report and financial statements
March 31, 2014
Key Financial highlights: FY2014
As at March 31, 2014, the Bank had total assets of USD 4,471 million (INR 267,889 million) compared with USD 3,587 million (INR 214,934 million) as at March 31, 2013, a growth of 25%. The balance sheet growth was primarily due to increase in loans and advances to customers and an increase in balances at central banks. The loans and advances to customers increased by 20% mainly driven by selective growth in the corporate loans portfolio and USD 289 million (INR 17,321 million) of loans against FCNR deposits. During the year, the Bank remained focused on balancing geographical and industrial concentration as well as improving the rating profile of its corporate asset portfolio. Selective credits were extended during the year within the risk appetite of the Bank. The Bank also remained focused on further strengthening the trade and commercial banking business. The balances at central banks increased from USD 583 million (INR 34,944 million) to USD 1,008 million (INR 60,419 million) in FY2014 due to higher balances with Bank of England Reserve account in part, to meet increased LAB requirement. Customer deposit balances increased by 41% during the year mainly on account of retail deposits inflows in online savings, fixed deposits and institutional deposits raised through the Frankfurt branch.
Profit before tax in FY2014 was USD 36.1 million (INR 2,165 million) compared with USD 19.2 million (INR 1,150 million) previous year. The Profit after tax of USD 25.2 million (INR 1,512 million) represents an increase of 75% compared to previous year. The growth in profits was mainly contributed by higher income and lower impairment charges compared with last year. The Net Interest Income grew during the year by 9% and Net Interest Margins (NIM) remained strong at 1.39% (FY2013 1.38%). The cost of funds reduced due to rebalancing of retail and wholesale deposits mix and raising institutional deposits in Frankfurt branch at a lower cost of funds offset by a reduction in yield on assets as some of the higher yielding assets matured during the year.
The non interest income grew by 24% during the year mainly driven by higher corporate and commercial banking income and retail fees. In line with the strategic objective of enhancing granular income streams, the non-interest income contributed 40% of total income during the year compared to 34% in the previous year. The growth in non-interest income was achieved primarily from corporate banking structuring and other fees, commercial banking fees and revenues from M2I Europe remittance platform.
Operating expenses at USD 36.8 million (INR 2,204 million) remained constant compared to the previous year. The cost to income ratio4 at 39% in FY2014 improved compared with 44% in FY2013. Expenses increased during the year primarily due to appreciation of GBP-USD FX rates, offset by a reduction in Financial Services Compensation Scheme (FSCS) levy expenses. Pursuant to the adoption of revised Industry standards, the Bank was not required to provide for the FSCS levy for the scheme year 2014-2015 which led to a reversal of approximately USD 1.0 million (INR 59.9 million) in expenses.
The provisions made during the year were USD 20.2 million (INR 1,211 million) compared to USD 27.2 million (INR 1,631 million) in the previous year. The increase in specific impairment provisions on corporate loans at USD 23.3 million (INR 1,397 million) for FY2014 compared to USD 19.3 million (INR 1,158 million) in FY2013, was offset by a collective provision write back of USD 8.7 million (INR 523 million). The increase in specific provisions reflects the challenges in the credit and market environment in India and Europe during the year, while the write back of collective provision was primarily due to movement of a few loans from standard to impaired assets and included collective provision on specific segments made in prior years which were transferred to specific provisions. The impaired assets coverage ratio was maintained at 35%, similar to previous year.
4Income includes profit/(Loss) on debt securities
Strategic report (continued)

9
ICICI Bank UK PLC, Strategic reportDirectors’ report and financial statements
March 31, 2014
Key economic and business outlook5Global activity has broadly strengthened and is expected to improve further in 2014–15 with much of the impetus coming from the advanced economies. Global growth is now projected to strengthen from 3 percent in 2013 to 3.6 percent in 2014, rising to 3.9 percent in 2015. Growth is projected to be strongest in the United States at about 2.8 percent in 2014. In the advanced economies, growth is projected to be positive but varied in the euro area: stronger in the core but weaker in countries with high debt (both private and public) and financial fragmentation, which will both weigh on domestic demand. Growth has rebounded more strongly than anticipated in the United Kingdom on easier credit conditions and increased confidence. The global recovery is still fragile despite improved prospects, and significant downside risks remain.
India’s growth is expected to recover from 4.4 percent in 2013 to 5.4 percent in 2014, supported by slightly stronger global growth, improving export competitiveness, some improvement in investment activity and assuming a normal monsoon.
In consideration of the ongoing uncertainty in the market and economic environment, the Bank will continue on its journey of balancing its asset and liability portfolio. The efforts to enhance the non-interest revenue streams will continue along with discipline over cost management and efficient capital and liquidity management. The Bank will continue to monitor the economic environment in India and Europe and strive to tap the market opportunities in line with the risk framework and appetite.
Key risks
The Bank’s business is subject to inherent risks concerning borrower credit quality as well as general global economic conditions. The Bank’s funding is composed of medium to long term deposits, term borrowings and a proportion of short term savings balances. If depositors and/or lenders do not roll over invested funds upon maturity, the Bank’s business could be adversely affected. Strong controls around measurement of risks through effective risk management of the Bank helps in mitigating such risks. The Bank will continue to work within the risk framework as set out by the Board. The increased supervisory and compliance environment in the financial sector leads to increased risks of regulatory action. The Bank’s continued focus on ensuring compliance with all the regulatory requirements mitigates the risk of regulatory action. The Bank’s Management reviews the risk appetite on a regular basis and continues to include any regulatory changes as appropriate to ensure regulatory compliance. The detail around the Bank’s risks and management is given in Note 33.
Corporate Governance and Risk Management
Corporate Governance
The Bank’s corporate governance framework is based on an effective independent Board, the separation of the Board’s supervisory role from the executive management of the Bank and the constitution of Board committees to oversee critical areas and functions of executive management. The Board is committed to maintaining high standards of corporate governance. The Bank remained focused on maintaining strong governance and controls structure. During the year, the Bank appointed Mr. Vijay Chandok as an additional Non-Executive Director (representative of ICICI Bank Limited), bringing the total number of Non-Executive Directors on the Board to seven, of whom three are representatives of the Bank’s Parent, ICICI Bank Limited and four are independent.
The Bank operates a first, second and third line of defence model including independent control groups such as Compliance, Risk, Internal Audit, Finance and Legal to facilitate independent evaluation, monitoring and reporting of various risks. These support groups function independently of the business groups and are represented at the various committees.
5As per the International Monetary fund World Economic Outlook (WEO) Update-April 2014
Strategic report (continued)
10
ICICI Bank UK PLC, Strategic reportDirectors’ report and financial statements
March 31, 2014
Effective corporate governance and compliance is a prerequisite to achieving the Bank’s strategic objectives. The Bank has maintained its focus on controls, governance, compliance and risk management to provide a sound foundation for the business and it continues to ensure embedding of a controls and compliance culture throughout the organization. This is achieved through appropriate training, maintaining adequate resources within the control groups commensurate with the Bank’s operations, continuous strengthening of internal systems and processes and effective deployment of technology. Information technology is used as a strategic tool for the Bank’s business operations, to gain a competitive advantage and to improve its overall productivity and efficiency.
During FY2014, the Bank completed a board effectiveness review the outcome of which was reviewed by an external consultant. The review concluded that the Board and Board committees are operating effectively.
The Bank has remained focused on enhancing its conduct risk appetite framework and conduct risk philosophy. The Bank’s conduct risk philosophy is to look to develop and maintain long term relationships with its customers, based on openness, trust and fairness. The conduct risk philosophy builds on the work undertaken by the Bank on its Treating Customers Fairly (TCF) commitments. The Bank evaluates the impact of the changing regulatory requirements on an ongoing basis and is fully committed to establishing controls to deliver fair and appropriate outcomes for its customers.
Risk Management
The Bank has a centralised Risk Management Group with a mandate to identify, assess and monitor
all its principal risks in accordance with defined policies and procedures. The Risk Management Group is independent of the business units and the Head of Risk reports directly to the Managing Director and Chief Executive Officer, and also lines to the Risk Management Group of the Parent Bank and the Chairman of the Board Risk Committee.
The Bank has developed a risk appetite framework articulated within the broader context of the nature, scope, scale and complexity of the Bank’s activities. The anchors on which the framework has been based include quantitative parameters such as capital, liquidity and earnings volatility as well as qualitative parameters such as conduct and reputational risk. The risk appetite statement has been further drilled down into portfolio-level limits, which include limits on country of risk and credit ratings of loans. The risk appetite framework and related limits are approved by the Board of Directors. The Risk Management Group of the Bank monitors adherence to the risk appetite framework and reports on it to the Board Risk Committee on a quarterly basis. The Bank’s future business strategy takes cognisance of the risk appetite framework, so that the Bank will continue to operate within its risk appetite limits at all times.
The Bank has developed a comprehensive risk management framework, covering all relevant risks in order to ensure that the key risks facing the Bank are clearly identified, understood, measured and monitored and that the policies and procedures established to address and control these risks are strictly adhered to. The outcomes of each of these risk management processes have been used to identify the material risks that the Bank is exposed to. The Bank is primarily exposed to credit risk, market risk (predominantly interest and exchange rate risk), liquidity risk and operational risk (including compliance, conduct and reputational risk). The Bank’s largest regulatory capital requirements arise from credit risk in its lending operations.
Strategic report (continued)

11
ICICI Bank UK PLC, Strategic reportDirectors’ report and financial statements
March 31, 2014
Details of the Bank’s governance arrangements, financial risk management objectives and policies, including those in respect of financial instruments, and details of the Bank’s indicative exposure to risks are given in Note 33.
By order of the Board
Sudhir Dole Aarti SharmaManaging Director & Chief Executive Officer Chief Financial Officer & Company Secretary
April 24, 2014Registered address:
One Thomas More SquareLondon E1W 1YN
Strategic report (continued)

12
ICICI Bank UK PLC, Strategic reportDirectors’ report and financial statements
March 31, 2014
Director’s Report
The Directors have pleasure in presenting the eleventh annual report of ICICI Bank UK PLC, together with the audited financial statements for the year ended March 31, 2014.
Financial Results
The financial statements for the reporting year ended March 31, 2014 are shown on pages 16 to 72.
Directors
Mrs. Chanda Kochhar Chairperson of the BoardMr. N.S. Kannan Non Executive DirectorMr. Vijay Chandok* Non Executive Director (Effective July 19, 2013)Mr. Richard Banks** Independent Non Executive DirectorMr. Jonathan Britton Independent Non Executive DirectorMr. John Burbidge Independent Non Executive DirectorSir Alan Collins Independent Non Executive DirectorSudhir Dole Managing Director & CEO
*During the financial year, Mr. Vijay Chandok was appointed as the Non Executive Director of the Bank at the Board meeting on July 19, 2013 subject to regulatory approvals. Mr. Chandok’s appointment was approved by the UK regulators on January 07, 2014.
** Mr. Richard Banks has expressed his desire to retire from the Non Executive Director position of the Bank. Mr. Banks has tendered his resignation but to ensure an orderly handover has agreed to remain on the Board until, at the latest, the end of June 2014.The Bank would like to thank Mr. Banks for his counsel and guidance which has been invaluable to the Board and very importantly in leading the Board Risk Committee. The Bank is working on a transition plan and is in the process of recruiting Mr. Banks replacement.
Company Secretary
The name of the Company Secretary at the date of the report and who served during the year is as follows: Ms Aarti Sharma
Going concern
The Bank’s business activities and financial position; the factors likely to affect its future development and performance; and its objectives and policies in managing the financial risks to which it is exposed and its capital are discussed in the Business Review and Risk Management section.
The Directors have assessed, in the light of current and anticipated economic conditions, the Bank’s ability to continue as a going concern. The Directors confirm they are satisfied that the Bank has adequate resources to continue in business for the foreseeable future. For this reason, they continue to adopt the ‘going concern’ basis for preparing accounts.
Share Capital
As at March 31, 2014, the issued and fully paid share capital amounted to USD 495 million (INR 29,664 million).

13
ICICI Bank UK PLC, Strategic reportDirectors’ report and financial statements
March 31, 2014
Employees
As at March 31, 2014 the Bank had 201 employees. The Bank encourages the involvement of all employees in the Bank’s overall performance and profitability. The Bank has a pension scheme operating in the UK in which the employees are entitled to a maximum of five percent contribution of their basic salary. All employees have life insurance cover to the extent of four times their base salary. The Bank also has a private medical insurance plan, which covers employees and their dependents.
The Bank is committed to employment practices and policies which recognise the diversity of its workforce and ensures equality for employees regardless of sex, race, disability, age, sexual orientation or religious belief. Employees are kept closely involved in major changes affecting them through such measures as team meetings, briefings, internal communications and opinion surveys. The Bank has adopted a Code of Conduct, which sets out the core values and behaviours expected of senior management and other employees. The requirements of the Code are for all employees to act with integrity and maintain the right culture at all times. It also reinforces the Bank’s commitment to maintaining high standards in management of our relationship with customers, employees and suppliers.
The Bank recognises its social and statutory duty to employ disabled persons and has followed a policy of providing the same employment opportunities for disabled persons as for others.
The Bank follows a conservative and comprehensive approach towards rewards management. The Bank has adopted and implemented a Remuneration Policy which has been approved by the Board Governance and Ethics Committee. The Bank ensures that it adheres to the Remuneration Code guidelines published by the Financial Services Authority. The Bank’s remuneration policy disclosures are made available on the Bank’s website: http://www.icicibank.co.uk/personal/basel_disclosures.html
Disclosure of information to the Auditor
The Directors who held office at the date of approval of this Directors’ report confirm that, so far as they are each aware, there is no relevant audit information of which the Bank’s Auditor is unaware; and each Director has taken all the steps that he/she ought to have taken as a Director to make himself/herself aware of any relevant audit information and to establish that the Bank’s auditor is aware of that information.
Auditor
KPMG LLP was appointed as the auditor of the Bank at its Annual General Meeting on July 19, 2013 for a year. In accordance with Section 489 of the Companies Act of 2006, a resolution for the re-appointment of KPMG LLP as auditor of the Bank is to be proposed at the forthcoming Annual General Meeting.
By order of the Board
Sudhir Dole Aarti SharmaManaging Director & Chief Executive Officer Chief Financial Officer & Company Secretary
April 24, 2014Registered address:
One Thomas More SquareLondon E1W 1YN
Director’s report (continued)
14
ICICI Bank UK PLC, Strategic reportDirectors’ report and financial statements
March 31, 2014
Statement of Directors’ responsibilities in respect of the Strategic Report, Directors’ Report and the financial statements
The Directors are responsible for preparing the Strategic Report, Directors’ Report and the financial statements in accordance with applicable law and regulations. Company law requires the directors to prepare financial statements for each financial year. Under that law they have elected to prepare the financial statements in accordance with UK Accounting Standards and applicable law (UK Generally Accepted Accounting Practice).
Under company law the directors must not approve the financial statements unless they are satisfied that they give a true and fair view of the state of affairs of the company and of the profit or loss of the company for that period. In preparing these financial statements, the directors are required to:
•selectsuitableaccountingpoliciesandthenapplythemconsistently; •makejudgementsandestimatesthatarereasonableandprudent; •statewhethertheyhavebeenpreparedinaccordancewithUKAccountingStandardsandapplicable law; and •preparethefinancialstatementsonthegoingconcernbasisunlessitisinappropriatetopresume that the company will continue in business.
The directors are responsible for keeping adequate accounting records that are sufficient to show and explain the company’s transactions and disclose with reasonable accuracy at any time the financial position of the company and enable them to ensure that the financial statements comply with the Companies Act 2006. They are responsible to report a fair review of the development and performance of the business and the position of the company together with a description of the principal risks and uncertainties faced by the company. They have general responsibility for taking such steps as are reasonably open to them to safeguard the assets of the company and to prevent and detect fraud and other irregularities.
The Directors are responsible for the maintenance and integrity of the corporate and financial information included on the Bank’s website. Legislation in the UK governing the preparation and dissemination of financial statements may differ from legislation in other jurisdictions.
By order of the Board
Sudhir Dole Aarti SharmaManaging Director & Chief Executive Officer Chief Financial Officer & Company Secretary
April 24, 2014

15
ICICI Bank UK PLC, Strategic reportDirectors’ report and financial statements
March 31, 2014
Report of the independent auditor to the members of ICICI Bank UK PLC
We have audited the financial statements of ICICI Bank UK PLC (“the Bank”) for the year ended March 31, 2014 set out on pages 16 to 72. The financial reporting framework that has been applied in their preparation is applicable law and UK Accounting Standards (UK Generally Accepted Accounting Practice).
This report is made solely to the Bank’s members, as a body, in accordance with Chapter 3 of Part 16 of the Companies Act 2006. Our audit work has been undertaken so that we might state to the Bank’s members we are required to state to them in an auditor’s report and for no other purpose. To the fullest extent permitted by law, we do not accept or assume responsibility to anyone other than the Bank and the Bank’s members, as a body, for our audit work, for this report, or for the opinions we have formed.
Respective responsibilities of Directors and Auditors
As explained more fully in the Directors’ Responsibilities Statement set out on page 14, the Directors are responsible for the preparation of the financial statements and for being satisfied that they give a true and fair view. Our responsibility is to audit the financial statements in accordance with applicable law and International Standards on Auditing (UK and Ireland). Those standards require us to comply with the Auditing Practices Board’s (APB’s) Ethical Standards for Auditors.
Scope of the audit of the financial statements
A description of the scope of an audit of financial statements is provided on the Financial Reporting Council’s web-site at www.frc.org.uk/auditscopeukprivate.
Opinion on financial statements
In our opinion the financial statements:
•giveatrueandfairviewofthestateoftheBank’saffairsasatMarch31,2014andofitsprofitfor the year then ended; •havebeenproperlypreparedinaccordancewithUKGenerallyAcceptedAccountingPractice;and •havebeenpreparedinaccordancewiththerequirementsoftheCompaniesAct2006.
Opinion on other matter prescribed by the Companies Act 2006
In our opinion the information given in the Strategic Report and Directors’ Report for the financial year for which the financial statements are prepared is consistent with the financial statements.
Matters on which we are required to report by exception
We have nothing to report in respect of the following matters where the Companies Act 2006 requires us to report to you if, in our opinion: •adequateaccountingrecordshavenotbeenkept,orreturnsadequateforouraudithavenotbeen received from branches not visited by us; or •thefinancialstatementsarenotinagreementwiththeaccountingrecordsandreturns;or •certaindisclosuresofDirectors’remunerationspecifiedbylawarenotmade;or •wehavenotreceivedalltheinformationandexplanationswerequireforouraudit.
Jonathan BinghamSenior Statutory Auditorfor and on behalf of KPMG LLP, Statutory AuditorChartered Accountants15 Canada SquareLondon E14 5GL
April 24, 2014
16
ICICI Bank UK PLC, Strategic reportDirectors’ report and financial statements
March 31, 2014
Note Year endedMarch 31,
2014
Year endedMarch 31,
2013
Year endedMarch 31,
2014
Year endedMarch 31, 2013
USD 000s USD 000s INR Million INR Million
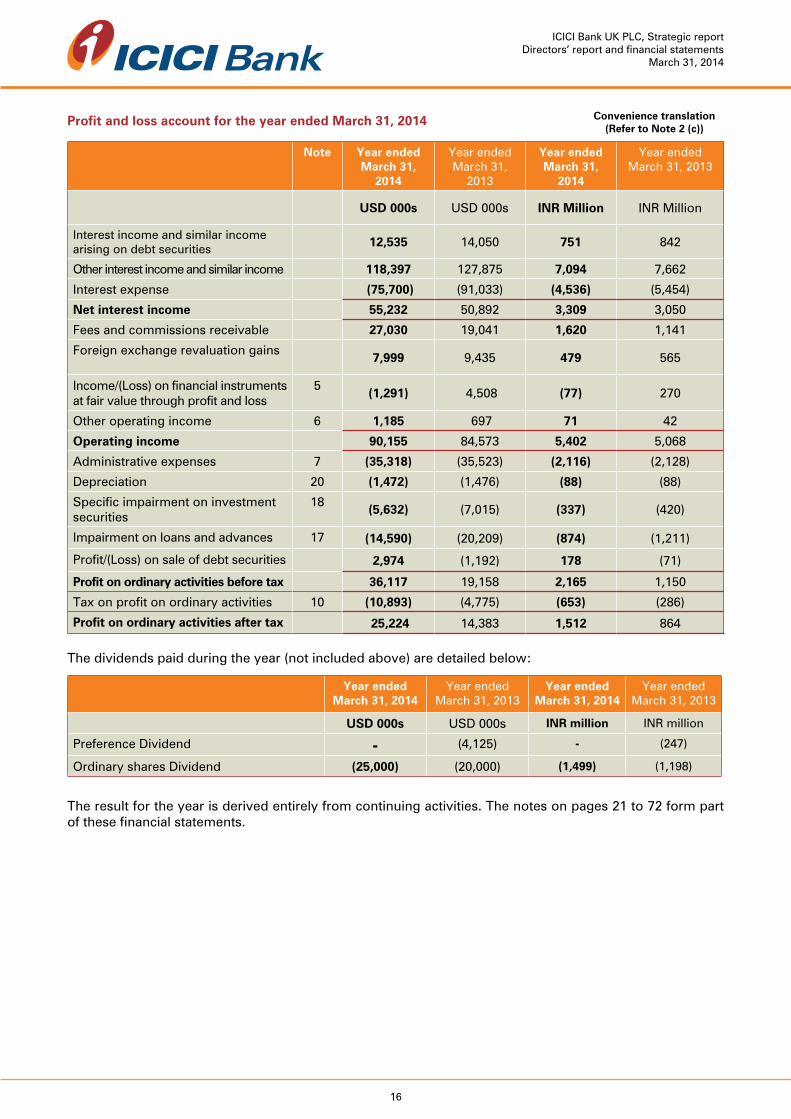
Interest income and similar income arising on debt securities 12,535 14,050 751 842
Other interest income and similar income 118,397 127,875 7,094 7,662
Interest expense (75,700) (91,033) (4,536) (5,454)
Net interest income 55,232 50,892 3,309 3,050
Fees and commissions receivable 27,030 19,041 1,620 1,141
Foreign exchange revaluation gains7,999 9,435 479 565
Income/(Loss) on financial instruments at fair value through profit and loss
5(1,291) 4,508 (77) 270
Other operating income 6 1,185 697 71 42
Operating income 90,155 84,573 5,402 5,068
Administrative expenses 7 (35,318) (35,523) (2,116) (2,128)
Depreciation 20 (1,472) (1,476) (88) (88)
Specific impairment on investment securities
18(5,632) (7,015) (337) (420)
Impairment on loans and advances 17 (14,590) (20,209) (874) (1,211)
Profit/(Loss) on sale of debt securities 2,974 (1,192) 178 (71)
Profit on ordinary activities before tax 36,117 19,158 2,165 1,150
Tax on profit on ordinary activities 10 (10,893) (4,775) (653) (286)
Profit on ordinary activities after tax 25,224 14,383 1,512 864
The dividends paid during the year (not included above) are detailed below:
Year ended March 31, 2014
Year endedMarch 31, 2013
Year ended March 31, 2014
Year endedMarch 31, 2013
USD 000s USD 000s INR million INR million
Preference Dividend - (4,125) - (247)
Ordinary shares Dividend (25,000) (20,000) (1,499) (1,198)
Profit and loss account for the year ended March 31, 2014
The result for the year is derived entirely from continuing activities. The notes on pages 21 to 72 form part of these financial statements.
Convenience translation (Refer to Note 2 (c))
17
ICICI Bank UK PLC, Strategic reportDirectors’ report and financial statements
March 31, 2014
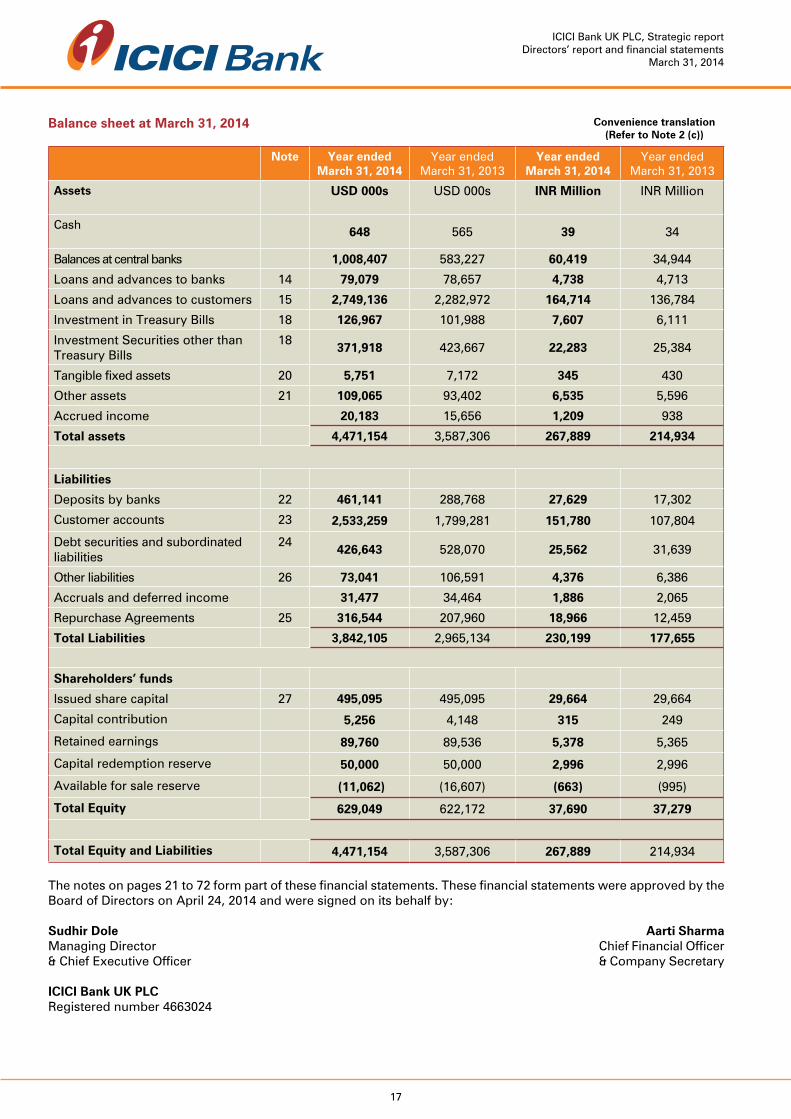
Balance sheet at March 31, 2014
Note Year endedMarch 31, 2014
Year endedMarch 31, 2013
Year endedMarch 31, 2014
Year endedMarch 31, 2013
Assets USD 000s USD 000s INR Million INR Million
Cash 648 565 39 34
Balances at central banks 1,008,407 583,227 60,419 34,944
Loans and advances to banks 14 79,079 78,657 4,738 4,713
Loans and advances to customers 15 2,749,136 2,282,972 164,714 136,784
Investment in Treasury Bills 18 126,967 101,988 7,607 6,111
Investment Securities other than Treasury Bills
18371,918 423,667 22,283 25,384
Tangible fixed assets 20 5,751 7,172 345 430
Other assets 21 109,065 93,402 6,535 5,596
Accrued income 20,183 15,656 1,209 938
Total assets 4,471,154 3,587,306 267,889 214,934
Liabilities
Deposits by banks 22 461,141 288,768 27,629 17,302
Customer accounts 23 2,533,259 1,799,281 151,780 107,804
Debt securities and subordinated liabilities
24426,643 528,070 25,562 31,639
Other liabilities 26 73,041 106,591 4,376 6,386
Accruals and deferred income 31,477 34,464 1,886 2,065
Repurchase Agreements 25 316,544 207,960 18,966 12,459
Total Liabilities 3,842,105 2,965,134 230,199 177,655
Shareholders’ funds
Issued share capital 27 495,095 495,095 29,664 29,664
Capital contribution 5,256 4,148 315 249
Retained earnings 89,760 89,536 5,378 5,365
Capital redemption reserve 50,000 50,000 2,996 2,996
Available for sale reserve (11,062) (16,607) (663) (995)
Total Equity 629,049 622,172 37,690 37,279
Total Equity and Liabilities 4,471,154 3,587,306 267,889 214,934
The notes on pages 21 to 72 form part of these financial statements. These financial statements were approved by the Board of Directors on April 24, 2014 and were signed on its behalf by:
Sudhir Dole Aarti SharmaManaging Director Chief Financial Officer& Chief Executive Officer & Company Secretary ICICI Bank UK PLCRegistered number 4663024
Convenience translation (Refer to Note 2 (c))
18
ICICI Bank UK PLC, Strategic reportDirectors’ report and financial statements
March 31, 2014
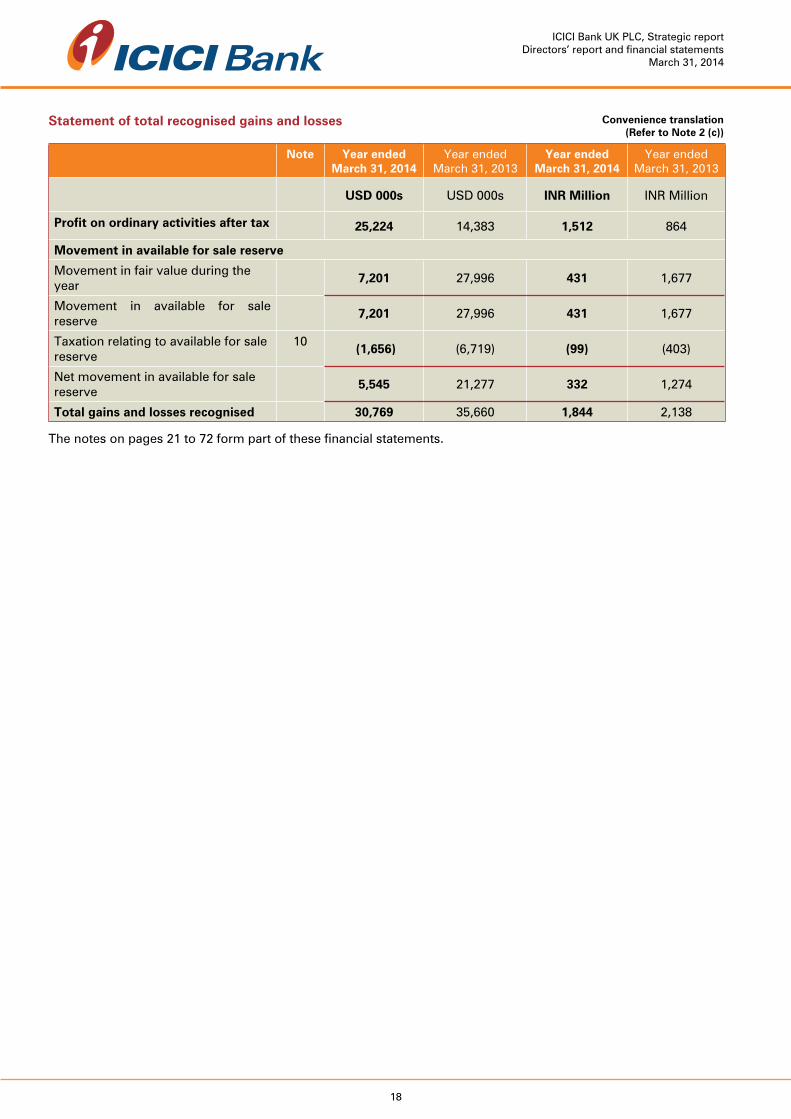
Statement of total recognised gains and losses
Note Year endedMarch 31, 2014
Year endedMarch 31, 2013
Year endedMarch 31, 2014
Year endedMarch 31, 2013
USD 000s USD 000s INR Million INR Million
Profit on ordinary activities after tax 25,224 14,383 1,512 864
Movement in available for sale reserve
Movement in fair value during the year
7,201 27,996 431 1,677
Movement in available for sale reserve
7,201 27,996 431 1,677
Taxation relating to available for sale reserve
10 (1,656) (6,719) (99) (403)
Net movement in available for sale reserve
5,545 21,277 332 1,274
Total gains and losses recognised 30,769 35,660 1,844 2,138
The notes on pages 21 to 72 form part of these financial statements.
Convenience translation (Refer to Note 2 (c))

19
ICICI Bank UK PLC, Strategic reportDirectors’ report and financial statements
March 31, 2014
Issued Share Capital
Retained earnings
Capital Redemption
Reserve
Available for Sale Reserve
Other Total
USD 000s USD 000s
USD 000s USD 000s USD 000s
USD 000s
As at April 1, 2012 595,095 149,278 - (37,884) 3,151 709,640
Capital Contribution (Share based payments) - - - - 997 997
Redemption of Preference share capital
(50,000) (50,000) 50,000 - - (50,000)
Reduction in Equity share capital (50,000) - - - - (50,000)
Unrealised gain on available for sale securities
- - - 27,996 - 27,996
Tax impact - - - (6,719) - (6,719)
Profit on ordinary activities after tax - 14,383 - - - 14,383
Dividends paid during the year - (24,125) - - - (24,125)
As at April 1, 2013 495,095 89,536 50,000 (16,607) 4,148 622,172
Capital Contribution (Share based payments)
- - - - 1,108 1,108
Unrealised gain on available for sale securities
- - - 7,201 - 7,201
Tax impact - - - (1,656) - (1,656)
Profit on ordinary activities after tax - 25,224 - - - 25,224
Equity dividend paid during the year
- (25,000) - - - (25,000)
Closing shareholders’ funds as at March 31, 2014
495,095 89,760 50,000 (11,062) 5,256 629,049
Reconciliation of movements in shareholders’ funds for the year ended March 31, 2014

20
ICICI Bank UK PLC, Strategic reportDirectors’ report and financial statements
March 31, 2014
Issued Share
Capital
Retained earnings
Capital Redemption
Reserve
Available for Sale Reserve
Other Total
INR million
INR million
INR million INR million INR million
INR million
As at April 1, 2012 35,656 8,942 - (2,269) 189 42,518
Capital Contribution (Share based payments) - - - - 60 60
Redemption of Preference share capital
(2,996) (2,996) 2,996 - - (2,996)
Reduction in Equity share capital (2,996) - - - - (2,996)
Unrealised gain on available for sale securities
- - - 1,677 - 1,677
Tax impact - - - (403) - (403)
Profit on ordinary activities after tax - 864 - - - 864
Dividends paid during the year - (1,445) - - - (1,445)
As at April 1, 2013 29,664 5,365 2,996 (995) 249 37,279
Capital Contribution (Share based payments)
- - - - 66 66
Unrealised gain on available for sale securities
- - - 431 - 431
Tax impact - - - (99) - (99)
Profit on ordinary activities after tax - 1,512 - - - 1,512
Equity dividend paid during the year
- (1,499) - - - (1,499)
Closing shareholders’ funds as at March 31, 2014
29,664 5,378 2,996 (663) 315 37,690
The notes on pages 21 to 72 form part of these financial statements.
Convenience translation (Refer to Note 2 (c))
21
ICICI Bank UK PLC, Strategic reportDirectors’ report and financial statements
March 31, 2014
Notes(Forming part of the financial statements)
1. Reporting entity
ICICI Bank UK PLC (“ICICI Bank” or “the Bank”), is a Company incorporated in the United Kingdom. The Bank’s registered address is - One Thomas More Square, London E1W 1YN. The Bank is primarily involved in providing a wide range of banking and financial services including retail banking, corporate and commercial banking, trade finance and treasury services.
2. Basis of preparation
(a) Statement of Compliance
The financial statements of the Bank have been prepared in accordance with the UK GAAP as issued by the Accounting Standards Board (including FRS 26 Financial instruments Recognition and measurement and FRS 29 Financial Instruments Disclosures).
(b) Basis of preparation
The financial statements have been prepared under the historical cost convention in accordance with the special provisions of Part XV of the Companies Act 2006 relating to banking companies and applicable accounting standards except for derivative financial instruments, financial instruments at fair value through profit or loss and available for sale financial assets which are valued at fair value.
During FY2014, the Bank has early adopted IFRIC 21 ‘Levies’, on the basis that there is no equivalent guidance within UK GAAP and FRS 18 (Accounting Policies) allows the use of alternative accounting frameworks where this is the case. Comparatives have not been re-stated on the grounds of immateriality.
(c) Functional and presentation currency and convenience translation
The financial statements are prepared and presented in US Dollars, which is the functional currency of the Bank as it represents the currency of the primary economic environment in which the Bank operates. A significant proportion of the Bank’s assets and revenues are transacted in US Dollars.
The financials are also presented in Indian Rupee (INR) currency for convenience using closing exchange rate. These numbers are proforma only and should not be regarded as being in compliance with UK GAAP.
(d) Cash flow exemptions
Under FRS 1 the Bank is exempted from the requirement to prepare a cash flow statement on the grounds that a parent undertaking includes the Bank in its own published consolidated financial statements (see Note 39).
(e) Related party exemptions
As the Bank is a wholly owned subsidiary of ICICI Bank Limited, the Bank has taken advantage of the exemption contained in FRS 8 and has therefore not disclosed transactions or balances with wholly owned subsidiaries which form part of ICICI Bank Limited (see Note 39).
(f) Going concern
The financial statements are prepared on a going concern basis as the Bank is satisfied that it has the resources to continue in business for the foreseeable future. The Bank meets its liquidity requirements through managing both retail and wholesale funding sources and meets the regulatory liquidity requirements through maintaining a liquid asset buffer (LAB). With regard to Capital, the Bank maintains a capital buffer over regulatory capital requirements. The Bank’s risk management policies and procedures are outlined in Note 33.
22
ICICI Bank UK PLC, Strategic reportDirectors’ report and financial statements
March 31, 2014
The Bank is a wholly owned subsidiary of ICICI Bank Limited. The Parent Bank has issued a letter of comfort to the Bank’s regulators, the Financial Services Authority (FSA), now PRA, stating that the Parent Bank intends to financially support the Bank in ensuring that it meets all of its financial obligations as they fall due. In addition, the Bank’s forecasts and projections, taking account of possible changes in its business model in subsequent years, including stress testing and scenario analysis, show that the Bank will be able to operate at adequate levels of both liquidity and capital for the foreseeable future. In making their assessment, the Directors have also considered future projections of profitability, cash flows and capital resources as well as the strategic review of the business model which is conducted on a periodic basis. The Bank has been maintaining a strong Capital adequacy and Tier 1 capital ratio. The Directors are satisfied that the Bank has adequate resources to continue in business for the foreseeable future and therefore it is appropriate to prepare the Annual Accounts on a going concern basis.
3. Significant accounting policies
The following accounting policies have been applied consistently in dealing with items which are considered material in relation to the financial statements.
(a) Interest income and expense
Interest income and expense are recognised in profit and loss using the effective interest rate method. The effective interest rate is the rate that exactly discounts the estimated future cash payments and receipts through the expected life of the financial asset or liability (or where appropriate, a shorter period) to the carrying amount of the financial asset or liability. When calculating the effective interest rate, the Bank estimates the future cash flows considering all contractual terms of the financial instruments but not the credit losses. The effective interest rate is established on initial recognition (or upon reclassification) of the financial asset and liability and is not revised subsequently.
(b) Fees and commissions income and expense
Fees and commission are recognised in the profit and loss account when the service has been rendered, except when those fees are an adjustment to the yield on the related asset, in which case they are amortised over the expected maturity of the asset using the effective interest rate method. Fees and commissions payable on borrowings raised are expensed to the profit and loss account over the life of the borrowing raised using the effective interest rate method and are included in interest expense.
(c) Foreign Currencies
Monetary assets and liabilities denominated in foreign currencies are translated into US Dollars at the exchange rates ruling at the balance sheet date and the gains or losses on translation are included in the profit and loss account. Income and expenses denominated in foreign currencies are converted into US Dollars at the rate of exchange ruling at the date of the transaction.
(d) Investment securities
Investment securities are initially measured at fair value plus, in case of investment securities not classified as at fair value through profit or loss, incremental direct transaction costs. Subsequently accounted for, depending on their classification, as either held to maturity, loans and receivable, fair value through profit or loss, or available for sale.
(e) Financial assets and financial liabilities
The Bank initially recognises loans and advances, deposits, debt securities issued and subordinated liabilities on the date of origination.
The Bank classifies its financial assets in the following categories: financial instruments at fair value through profit and loss; loans and receivables; available for sale financial assets and held to maturity investments. The management determines the classification of financial assets at initial recognition.

23
ICICI Bank UK PLC, Strategic reportDirectors’ report and financial statements
March 31, 2014
The financial assets are de-recognised when the rights to receive cash flows have expired or the Bank has transferred substantially all the risks and rewards of ownership. Financial instruments are recognised at trade date, being the date on which the Bank commits to purchase or sell the instruments.
Financial liabilities (other than derivatives) are measured at amortised cost and are recognised at value date (or settlement date). They are de-recognised when liabilities are extinguished.
(f) Loans and receivables
Loans and receivables, which include loans and advances and other receivables, are non-derivative financial assets with fixed or determinable payments that are not quoted in an active market and which are not classified as held for trading, designated at fair value through profit and loss, available for sale or held to maturity. Loans and receivables are initially recognised at fair value including direct and incremental transaction costs. They are subsequently valued at amortised cost using effective interest rate method. Loans and receivables are stated at amortised cost after deduction of amounts which are required as impairment provisions. Where loans have been acquired at a premium or discount, these premiums and discounts are amortised through the profit and loss account from the date of acquisition to the expected date of maturity using the effective interest rate method.
Policy in relation to write-offs: The Bank considers exposure for write off when the prospect of recovery over the next 12 month is remote and interest has not been serviced for the past 12 months. Any amount written off is in the first instance applied against specific provision for the exposure. In the normal course of business the loss to be written off will already have been fully provided. Any decision for a write-off is approved by the Board Credit Committee of the Bank.
Policy in relation to write back: If, in a subsequent period, the amount of the impairment loss decreases and the decrease can be related objectively to an event occurring after the impairment was recognised (such as an improvement in the debtor’s credit rating), the previously recognised impairment loss is reversed either directly or by adjusting an allowance account. The reversal shall not result in a carrying amount of the financial asset that exceeds what the amortised cost would have been had the impairment not been recognised at the date the impairment is reversed. The amount of the reversal shall be recognised in profit or loss. Any recovery related to a written off asset is recognised in the profit and loss.
(g) Fair value measurement
Fair value is the amount for which an asset could be exchanged, or a liability settled, between knowledgeable, willing parties in an arm’s length transaction, on the measurement date. This is determined by reference to the quoted bid price or asking price (as appropriate) in an active market wherever possible.
When independent prices are not available or if the market for a financial instrument is not active, fair values are determined by using valuation techniques which refer to observable market data. These include comparison with similar instruments where market observable prices exist, discounted cash flow analysis, option pricing models and other valuation techniques commonly used by market participants. Fair values of financial instruments may be determined in whole or in part using valuation techniques based on assumptions that are not supported by prices from current market transactions or observable market data.
In case of unobservable inputs or in case of unlisted entities, the inputs into valuations based on unobservable data are inherently uncertain because there is little or no current market data available from which the level at which an arm’s length transaction would occur under normal business conditions could be determined. In such cases, estimates are made in the valuation technique to reflect uncertainties in fair values resulting from a lack of market data inputs. These include most recent arm’s length transaction between knowledgeable, willing parties; reference to fair value of a similar instrument; discounted cash flow; or option pricing models.

24
ICICI Bank UK PLC, Strategic reportDirectors’ report and financial statements
March 31, 2014
However, the valuation techniques incorporate all factors that market participants have considered in setting a price; and have been consistent with accepted economic methodologies for pricing financial instruments.
Note 18 provide a detailed disclosure regarding classification and Fair value of instruments held by the Bank.
(h) Financial instruments at fair value through profit and loss
Financial instruments are classified in this category if they are held for trading. Instruments are classified as held for trading if they are:
i) Acquired/incurred principally for the purposes of selling or repurchasing in the near term; or
ii) Part of a portfolio of identified financial instruments that are managed together and for which there is evidence of a recent actual pattern of short-term profit-taking.
iii) It is a derivative (except for derivative that is a financial guarantee contract or a designated as effective hedging instrument).
Financial instruments cannot be transferred into or out of this category after inception except certain assets on reclassification. Financial instruments included in this category are recognised initially at fair value and transaction costs are taken directly to the profit and loss account. Financial instruments at fair value through profit and loss include debt securities which are held for trading and valued at fair value.
Derivatives are carried at fair value in the balance sheet within ‘Other assets’ and ‘Other liabilities’. Valuation adjustments to cover credit and market liquidity risks are made with gains and losses taken directly to the profit and loss account and reported within income/(loss) on financial instruments at fair value through profit and loss. The credit valuation adjustment is an adjustment to the valuation of Over the Counter (OTC) derivative contracts to reflect within fair value the possibility that the counterparty may default and that the Bank may not receive the full market value of the transactions. The debit valuation adjustment is an adjustment to the valuation of OTC derivative contracts to reflect within fair value the possibility that the Bank may default, and that the Bank may not pay full market value of the transactions.
Positive and negative fair values of derivatives are offset where the contracts have been entered into under netting agreements or other arrangements that represent a legally enforceable right of set-off, which will survive the liquidation of either party, and there is the intention to settle net.
(i) Held to maturity financial assets
Held-to-maturity investments are non-derivative assets with fixed or determinable payments and fixed maturity that the Bank has the positive intent and ability to hold to maturity, and which are not designated at fair value through profit or loss or as available for sale. Held-to-maturity investments are carried at amortised cost using the effective interest method.
(j) Available for sale financial assets
Available for sale financial assets are those non-derivative financial assets that are designated as available for sale and are not categorised into any of the other categories described above. They are initially recognised at fair value including direct and incremental transaction costs. They are subsequently held at fair value. Gains and losses arising from changes in fair value are included in the available for sale securities reserve until sale/derecognition, when the cumulative gain or loss is transferred to the profit and loss account.
Impairment losses on available for sale investment securities are recognised by transferring the cumulative loss that has been recognised directly in equity to profit and loss. The cumulative loss that is removed from equity and recognised in profit and loss is the difference between the acquisition cost, net of any principal repayment and amortisation, and the current fair value, less any impairment loss previously recognised in profit or loss.

25
ICICI Bank UK PLC, Strategic reportDirectors’ report and financial statements
March 31, 2014
If, in a subsequent period, the fair value of an impaired available for sale debt security increases and the increase can be objectively related to an event occurring after the impairment loss was recognised in profit or loss, the impairment loss is reversed, with the amount of the reversal recognised in profit or loss. However, any subsequent recovery in the fair value of an impaired available for sale equity investment is recognised directly in equity since it cannot be reversed through the profit and loss account.
(k) Reclassification of financial assets
The amendment to FRS 26 issued on October 10, 2008 permits an entity to reclassify non-derivative financial assets (other than those designated at fair value through profit or loss by the Bank upon initial recognition) out of the fair value through profit and loss category in rare circumstances. The amendment also permits an entity to transfer from the available for sale category to the loans and receivables category a financial asset that would have met the definition of loans and receivables and if the entity has the intention and ability to hold that financial asset for the foreseeable future.
When a financial asset is reclassified, it is reclassified at its fair value on the date of reclassification. Any gain or loss already recognized in the profit and loss account or shareholder equity, as appropriate, is not reversed. The fair value of the financial asset on the date of reclassification becomes its fair value or amortised cost, as applicable.
(l) Derivatives held for risk management purposes and hedge accounting instruments and hedging activities
Transactions are undertaken in derivative financial instruments (derivatives), which include interest rate swaps, futures, forward rate agreements, currency swaps, options and similar instruments, for trading and non-trading purposes. The Bank may designate a derivative as either a hedge of the fair value of a recognised fixed rate asset or liability or an unrecognised firm commitment (fair value hedge), a hedge of a forecasted transaction or the variability of future cash flows of a floating rate asset or liability (cash flow hedge) or a foreign-currency fair value or cash flow hedge (foreign currency hedge). All derivatives are recorded as assets or liabilities on the balance sheet at their respective fair values with unrealised gains and losses recorded either in reserves or in the profit and loss account, depending on the purpose for which the derivative is held. Derivatives that do not meet the criteria for designation as a hedge under FRS 26 at inception, or fail to meet the criteria thereafter, are accounted for in other assets with changes in fair value recorded in the profit and loss account.
Changes in the fair value of a derivative that is designated and qualifies as a fair value hedge, along with the gain or loss on the hedged asset or liability that is attributable to the hedged risk are recorded in the profit and loss account as other non-interest income. To the extent of the effectiveness of a hedge, changes in the fair value of a derivative that is designated and qualifies as a cash flow hedge, are recorded in reserves. For all hedging relationships, ineffectiveness resulting from differences between the changes in fair value or cash flows of the hedged item and changes in the fair value of the derivative are recognised in the profit and loss account as other non-interest income.
At the inception of a hedge transaction, the Bank formally documents the hedging relationship and the risk management objective and strategy for undertaking the hedge. This process includes identification of the hedging instrument, hedged item, risk being hedged and the methodology for measuring effectiveness. In addition, the Bank assesses both at the inception of the hedge and on an ongoing quarterly basis, whether the derivative used in the hedging transaction has been highly effective in offsetting changes in fair value or cash flows of the hedged item, and whether the derivative is expected to continue to be highly effective.
The Bank discontinues hedge accounting prospectively when it is either determined that the derivative is no longer highly effective in offsetting changes in the fair value or cash flows of a hedged item; the derivative expires or is sold, terminated or exercised; the derivative is de-designated because it is unlikely that a forecasted transaction will occur; or management determines that designation of the derivative as a hedging instrument is no longer appropriate.

26
ICICI Bank UK PLC, Strategic reportDirectors’ report and financial statements
March 31, 2014
When a fair value hedge is discontinued, the hedged asset or liability is no longer adjusted for changes in fair value and the existing basis adjustment is amortised or accreted over the remaining life of the asset or liability. When a cash flow hedge is discontinued but the hedged cash flow or forecasted transaction is still expected to occur, gains and losses that were accumulated in reserves are amortised or accreted into the profit and loss account. Gains and losses are recognised in the profit and loss account immediately if the cash flow hedge was discontinued because a forecasted transaction did not occur.
The Bank may occasionally enter into a contract (host contract) that contains a derivative that is embedded in the financial instrument. If applicable, an embedded derivative is separated from the host contract and can be designated as a hedge; otherwise, the derivative is recorded as a freestanding derivative. Such financial instruments stand extinguished at the time of conversion (debt into equity), sale and maturity.
(m) Sale and repurchase agreements
When securities are sold subject to a commitment to repurchase them at a predetermined price (‘repos’), they remain on the balance sheet as, in substance, these transactions are in the nature of secured borrowings. As a result of these transactions, the Bank is unable to use, sell or pledge the transferred assets for the duration of the transaction. Similarly, securities purchased under commitments to sell (‘reverse repos’) are not recognised on the balance sheet.
(n) Identification and measurement of impairment
Impairment provisions/charges are made where there is objective evidence of impairment as a result of one or more events that occurred after the initial recognition of the asset and that loss event (or events) has an impact on the estimated future cash flows from the asset that can be reliably estimated. Losses expected as a result of future events are not recognised. Evidence of impairment is considered on both individual and portfolio basis.
Refer Note 4 (a) and Note 4 (b) for the detailed policy guidance.
(o) Tangible assets and software
Fixed assets are stated at cost less accumulated depreciation and impairment. Cost includes expenditures that are directly attributable to the acquisition of the asset.
Depreciation is provided to write off the cost less the estimated residual value of tangible fixed assets and software on a straight-line basis over their estimated useful economic life as follows:
Leasehold improvements Over the lease periodOffice equipment 6 – 7 yearsFurniture, fixtures and fittings 6 – 7 yearsComputer hardware 3 – 4 yearsSoftware Over the estimated useful life1
1The useful life is on an average is currently between 1-5 years
Depreciation methods, useful life and residual values are reviewed at each balance sheet date.
(p) Provisions
Provisions are recognised when it is probable that an outflow of economic benefits will be required to settle a present, legal or constructive obligation, which has arisen as a result of a past event and for which a reliable estimate can be made of the amount of the obligation. All significant provisions have been discounted for current market assessments and the time value of money.
(q) Deposits, debt securities issued and subordinated liabilities
Deposits, debt securities issued and subordinated liabilities are the sources of debt funding. These are initially measured at fair value plus directly attributable transaction costs, and subsequently measured at their amortised cost using the effective interest method.
27
ICICI Bank UK PLC, Strategic reportDirectors’ report and financial statements
March 31, 2014
(r) Income tax expense
Income tax expense comprises current and deferred tax. Income tax and deferred tax expense is recognised in the profit and loss statement except to the extent that it relates to items recognised directly in equity, in which case it is recognised in equity.
Current tax is the expected tax payable or receivable on the taxable income or loss for the year, using tax rates enacted or substantially enacted at the reporting date and includes any adjustment to tax payable in respect of previous years.
Deferred tax is recognised, in respect of all timing differences between the carrying amounts of assets and liabilities for financial reporting purposes and the amounts used for taxation purposes. As required by FRS 19 “Deferred Tax”, deferred tax is measured at the tax rates expected to be applied to the temporary difference when they reverse, based on the tax laws that have been enacted or substantially enacted by the reporting date. Deferred tax assets are recognised to the extent that, on the basis of all available evidence, it can be regarded as more likely than not that there will be sufficient future taxable profits from which the future reversal of the underlying timing differences can be deducted.
A deferred tax asset is recognised only to the extent that it is probable that future taxable profits will be available against which the asset can be utilised. Deferred tax assets are reviewed at each reporting date and are reduced to the extent that it is no longer probable that the related tax benefit will be realised.
(s) Employee benefits
The Bank operates a stakeholder defined contribution pension scheme. Contributions to the scheme are charged to the profit and loss account as incurred.
(t) Leases
Operating lease rentals are charged to the profit and loss account on a straight line basis over the non-cancellable lease term provided the same is ascertainable unless another basis is more appropriate.
(u) Share based payments
The Parent Bank (ICICI Bank Limited) has issued share options to the employees of ICICI Bank UK PLC. These transactions are recognised as equity-settled share based payments. The expense is recognised over the vesting period based on the market value of shares as on the date of grant of shares, adjusted for the number of the employees leaving the Bank. A capital contribution from the Parent Bank is recognised in the books over the vesting period in the shareholders’ funds. Under the requirements of UITF Abstract 44, a subsidiary should recognise an expense in its profit and loss account to reflect the effective remuneration paid to employees in respect of share awards granted by the Parent Company. The corresponding entry is to equity as the amounts are considered to be capital contributions by the Parent Company.
(v) Cash and cash equivalents
Cash and cash equivalents include notes and coins on hand, unrestricted balances held with central banks and highly liquid financial assets with original maturities of less than three months, which are subject to insignificant risk of changes in their fair value, and are used by the Bank in the management of its short-term commitments.
(w) Share Capital
Shares are classified as equity when there is no contractual obligation to transfer cash or other financial assets. Incremental costs directly attributable to the issue of equity instruments are shown in equity as a deduction from proceeds, net of tax.

28
ICICI Bank UK PLC, Strategic reportDirectors’ report and financial statements
March 31, 2014
4. Significant judgements and estimates
The preparation of financial statements requires management to make judgements, estimates and assumptions that affect the reported amounts of assets, liabilities, income and expenses. Estimates, judgements and assumptions are continually evaluated and are based on historical experience and other factors, including expectations of future events that are believed to be reasonable under the circumstances. Revisions to accounting estimates are recognised in the period in which the estimate is revised and in any future periods affected. The accounting policies deemed critical to the Bank’s results and financial position, based upon significant judgements and estimates, are discussed below.
(a) Allowances for credit losses
The Bank regularly reviews its loan portfolio to assess for impairment. Provisions are established to recognise incurred losses in the loan portfolio carried at amortised cost. In determining whether an impairment has occurred at the balance sheet date, the Bank assesses if there is objective evidence of impairment as a result of one or more events that occurred after the initial recognition of the asset (a ‘loss event’) and that loss event (or events) has an impact on the estimated future cash flows of the financial asset or group of financial assets that can be reliably estimated. It may not be possible to identify a single, discrete event that caused the impairment rather the combined effect of several events may have caused the impairment.
The Bank’s policies governing specific impairment, restructuring/renegotiation and collective provision are detailed below:
i) Specific impairment: In accordance with the Bank’s Credit Risk Management Policy (CRMP), the Bank identifies on a monthly basis, cases that are internally rated ‘B’ or below and/or significantly in breach of any covenants, including delays in debt servicing and/or where there is an expectation of significant credit deterioration.
Borrower’s financial difficulty/credit deterioration/trigger event: The Bank assesses an asset for specific impairment if it becomes probable that the borrower is facing significant financial difficulty. The Bank also assesses for specific impairment and makes specific provision if necessary, if there is evidence of any significant credit deterioration or any event which indicates a reduced ability for the borrower to repay its interest and principal. The indicators of impairment can include, among other things:
a) Net worth of the risk counterparty/borrower turning negative.
b) Delay in interest and or principal repayments.
c) Breach in financial covenants.
d) Likelihood of borrower entering bankruptcy/financial reorganization.
e) Rating downgrade by external credit rating agencies.
f) National or local economic conditions that correlate with defaults on the assets in the borrower group (e.g. an increase in the unemployment rate in the geographical area of the borrowers, a decrease in oil prices for loan assets to oil producers, or adverse changes in industry conditions that affect the borrowers in the group).
g) Substantial decline in value of security provided to the Bank, especially when security is prime consideration for the lending. The unsecured portion of the exposure may be subjected to impairment testing.
h) Invocation of contractual comfort by the Bank such as corporate guarantee/put option which is not honoured by the counterparty.
The Bank’s policy is to identify and recognize impairment in a loan when it is probable that the Bank will not be able to collect, or there is no longer a reasonable certainty that the Bank will collect all amounts due according to the contractual terms of the loan agreement. The Bank considers past due cases as impaired if the principal or interest on a loan is ninety days overdue as at the end of the quarter and the Bank does not have a realistic prospect of recovery of the amounts outstanding. The objective of the policy is to maintain a prudent level of provision reflective of the risk profile of the loan portfolio. It is not the Bank’s policy to systematically over-provide or under-provide for its Credit Risk.

29
ICICI Bank UK PLC, Strategic reportDirectors’ report and financial statements
March 31, 2014
The provision weightings included in the policy document are continually monitored against the lending experience of the Bank and are periodically adjusted to reflect such experience.
The Bank’s policy is predicated on the premise that regardless of the quality of a lending institution and of its systems and procedures and of its client base the business of extending credit carries the intrinsic risk of such credit not being repaid and monies advanced proving to be irrecoverable. In accordance with the guidelines of FRS 26, an impairment loss for financial assets measured at amortized cost is the difference between the asset’s carrying amount and the present value of the estimated future cash flows discounted at the asset’s original effective interest rate. The estimated future cash flows take into account only the credit losses that have been incurred at the time of the impairment loss calculation. In case the expected cash flows are not available, the breakup value of security/collateral for respective facilities under watch is calculated in accordance with the Bank’s collateral valuation policy. In line with accounting guidelines, the Bank recognises an impairment loss equal to the best estimate within the range of reasonably possibly outcomes, taking into account all relevant information available about conditions existing at the end of the reporting period.
ii) Restructured/renegotiated cases: A restructured account is one where the Bank, for economic or legal reasons relating to the borrower’s difficulty, grants to the borrower concessions that the Bank would not otherwise consider. Restructuring would normally involve modification of the terms of advances/securities which could include alteration of repayment period/repayable amount/the amount of instalments/rate of interest (due to reasons other than competition). The restructuring of an asset is only granted in situations where the customer has showed a willingness to repay the borrowing and is expected to be able to meet the revised terms of the restructuring. The Bank measures a restructured troubled loan by reducing its recorded value to its net realisable value, taking into account the cost of all concessions at the date of the restructuring. The reduction in the carrying value is recorded as a charge to the profit and loss statement in the period in which the loan is restructured.
In relation to loans and advances, the modifications of terms and conditions related to security and collateral arrangements or the waiver of certain covenants which do not affect payment arrangements, are not regarded as sufficient indicators of impairment or restructuring, as such changes do not necessarily indicate credit issues affecting the borrower’s payment ability.
The Bank charges penal interest to the borrower for any delay in interest/principal payment unless a waiver has been approved by the Bank’s relevant authority. As per the Bank’s practice, such waivers are given in exceptional circumstances which could be mainly related to procedural delays in receiving the interest/principal payment by the due date.
The Bank derecognises a loan when there are substantial modifications to the terms of the loan on restructuring.
iii) Collective provision: Collectively assessed impairment allowances cover credit losses inherent in portfolios with similar economic characteristics, when there is objective evidence to suggest that they contain impaired claims, but, the individual impaired items cannot yet be identified. In assessing the need for collective impairment allowances, management considers factors such as historical loss trends, credit quality of the portfolio, portfolio size, concentrations, and economic factors. The aggregate amount of specific and collective provisions is intended to be sufficient to absorb estimated credit losses generated in the loan portfolio.
The collective impairment policy as defined in the CRMP stipulates that collective provision, based on the credit rating of the exposures, needs to be provided in respect of the entire performing loan and receivables portfolio. The Bank has followed FRS 26 guidelines for defining its collective impairment policy wherein the provisioning is determined by the extent of the underlying credit risk in the portfolio of the Bank. This is also the direction provided by the Basel Accord. The exposures that are individually assessed for impairment and for which an impairment loss is orcontinues to be recognised, are not included in the collective assessment of impairment.

30
ICICI Bank UK PLC, Strategic reportDirectors’ report and financial statements
March 31, 2014
In line with market practice, the Bank has been using a representative set of Probability of Default (PD)/Loss Given Default (LGD) data to determine the extent of provisioning required to be made by the Bank in respect of its performing loan portfolio on a collective basis. The aggregate provisioning requirement is arrived at by multiplying the outstanding amounts under each portfolio type (internally rated and externally rated exposures) on the relevant date with the corresponding PD and LGD.
In the absence of adequate internal default history and on account of a similar internal credit rating scale, the Bank has used Probability of Default (PD) data of its Parent (ICICI Bank Limited) for estimating the collective provisioning on its internally rated India country of exposure portfolio. For the internally rated non-India country of exposure portfolio, the Bank has used PD data from Moody’s, corresponding to the geographies which make up the majority of its non-India exposures. On the India exposures, the Bank has used the average one year PDs of the Parent from FY 2006 onwards, while the Moody’s data covers a period from the year 2003 onwards. For the externally rated Asset Backed Securities (ABS) portfolio, the average one year PD data for structured finance transactions, published by Standard and Poor (S&P) for the period 1978-2012 has been used to calculate the collective provision. The LGD has been assumed at 50.0% based on S&P’s experience of recovery rates. For the internally rated portfolio, the LGD has been calculated based on the collateral available with the Bank. LGD and haircuts applicable for each collateral as prescribed in Basel II guidelines have been considered. The historical average PD data being used covers a full economic cycle and captures periods of low economic activity when relatively higher default rates were observed.
(b) Impairment of available for sale financial assets
The Bank regularly reviews its available for sale securities portfolio to assess for impairment. The Bank considers all available evidence, including observable market data or information about events specifically relating to the securities which may result in a shortfall in recovery of future cash flows. These events may include a significant financial difficulty of the issuer, a breach of contract such as a default, bankruptcy or other financial reorganisation, or the disappearance of an active market for the debt security because of financial difficulties relating to the issuer, information about the issuer’s liquidity, business and financial risk exposures, level of and trends in default for similar financial assets, national and local economic conditions. While assessing ABS for objective evidence of impairment, the Bank considers the performance of the underlying collateral, changes in credit rating, credit enhancements, default events etc. Once impairment has been identified, the amount of impairment is measured based on the difference between the acquisition cost (net of any principal repayment and amortisation) and current fair value, less any impairment loss previously recognised in profit or loss. In determining whether an impairment event has occurred at the balance sheet date, the Bank considers whether there is any observable data which comprises evidence of the occurrence of a loss event, and evidence that the loss event results in a decrease in estimated future cash flows or their timings. Such observable data includes any adverse change in the payment status of borrowers or changes in economic conditions that correlate with defaults on loan repayment obligations. A significant or prolonged decline in the fair value of an available for sale equity investment below its cost is evidence of impairment considered by the Bank.
The negative mark to market (MTM) on the AFS portfolio is monitored by the Bank on a regular basis. The Bank follows its valuation policy for valuing its AFS portfolio (refer point (c) relating to ‘Valuation of financial instruments’ below). (c) Valuation of financial instruments
The Bank values its available for sale and held for trading investment securities at fair market value. The best evidence of fair value is a quoted price in an actively traded market. If the market for a financial instrument is not active, or the financial instruments are traded infrequently and have littleprice transparency or the fair value is less objective, and requires varying degrees of judgment, the Bank uses valuation techniques to arrive at the fair value.

31
ICICI Bank UK PLC, Strategic reportDirectors’ report and financial statements
March 31, 2014
The valuation techniques employ observable market data to calculate fair values, including comparisons with similar financial instruments for which market observable prices exist. When valuing instruments by reference to comparable instruments, management takes into account the maturity, structure and rating of the instrument with which the position held is being compared.
5. Income/(Loss) on financial instruments at fair value through profit and loss
Income/(Loss) on financial instruments at fair value through profit and loss consists of unrealised and realised gains or losses on transactions in securities and derivatives.
Year ended March 31, 2014
Year endedMarch 31, 2013
Year ended March 31, 2014
Year endedMarch 31, 2013
USD 000s USD 000s INR million INR million
Income on other financial assets 199 436 12 26
Realised/unrealized gains/(losses) on derivative instruments
(1,490) 4,072 (89) 244
Total (1,291) 4,508 (77) 270
Other financial assets include credit linked notes, derivative instruments include currency spot, forwards and option contracts including the equity option component of foreign currency convertible bonds (FCCB) and interest rate swaps and futures. Gains and losses on derivatives are presented on a net basis as it is not practical to split the same, although derivative assets and liabilities are grossed up within other assets and other liabilities on the balance sheet. Current year includes realised losses on hedge instruments for which the underlying assets were sold during the year.
6. Other operating income
Other operating income primarily consists of retail branch related fees and other corporate banking related income.
7. Administrative expenses
Year ended March 31, 2014
Year endedMarch 31, 2013
Year ended March 31, 2014
Year endedMarch 31, 2013
USD 000s USD 000s INR million INR million
Staff costs (including Directors’ emoluments):
Wages and salaries 19,873 19,184 1,191 1,149
Social security costs 1,845 1,982 111 119
Other administrative expenses 13,600 14,357 814 860
Total 35,318 35,523 2,116 2,128

32
ICICI Bank UK PLC, Strategic reportDirectors’ report and financial statements
March 31, 2014
8. Profit on ordinary activities before tax is stated after charging
9. Segmental reporting
The Bank centrally manages its banking activities as a single business from its offices in the UK, Germany and Belgium.
10. Taxation
(a) Analysis of charge in the year
The number of persons employed by the Bank (including Directors) during the year was as follows:
Year ended March 31, 2014
Year endedMarch 31, 2013
No. of employees No. of employees
Management 42 43
Non management 159 160
Total 201 203
Year ended March 31, 2014
Year endedMarch 31, 2013
Year ended March 31, 2014
Year endedMarch 31, 2013
USD 000s USD 000s INR million INR million
Auditor’s remuneration
Fees payable to the Bank's statutory auditors and their associates for the audit of Bank’s annual accounts
495 452 30 27
Fees payable to the Bank’s statutory auditors and their associates for other services:
Audit related assurance services 439 437 26 26
Tax compliance services 42 47 3 3
Total 976 936 59 56
Year ended March 31, 2014
Year endedMarch 31, 2013
Year ended March 31, 2014
Year endedMarch 31, 2013
USD 000s USD 000s INR million INR million
Current tax
UK Corporation tax1 at 23% (2013: 24%) on the taxable profit for the year 4,479 3,198 268 192
Overseas corporation charge 5,879 1,457 353 87
10,358 4,655 621 279
Adjustments for prior years 134 (320) 8 (19)
10,492 4,335 629 260

33
ICICI Bank UK PLC, Strategic reportDirectors’ report and financial statements
March 31, 2014
Year ended March 31, 2014
Year endedMarch 31, 2013
Year ended March 31, 2014
Year endedMarch 31, 2013
USD 000s USD 000s INR million INR million
Deferred tax
Origination and reversal of timing differences
401 440 24 26
Tax on profit on ordinary activities 10,893 4,775 653 286
(b) Factors affecting the tax charge for the current year
(c) The movements in deferred tax asset during the year were:
Year ended March 31, 2014
Year endedMarch 31, 2013
Year ended March 31, 2014
Year endedMarch 31, 2013
USD 000s USD 000s INR million INR million
Current tax reconciliation
Profit on ordinary activities before tax 36,117 19,158 2,165 1,150
Current tax at 23% (2013: 24%) 8,307 4,598 498 276
Add effects of:
Expenses not deductible for tax purposes 257 241 15 14
Other timing differences (FRS 26 Impact) (275) (287) (16) (17)
Timing difference on movement of collective provisions for bad and doubtful debts
(49) (51) (3) (3)
Depreciation less than capital allowances for the year
182 154 11 9
Overseas taxes (net of overseas tax credit relief)
1,936 - 116 -
Adjustment for prior year 134 (320) 8 (19)
Total current tax charge (see 10 (a) above)
10,492 4,335 629 260
Year ended March 31, 2014
Year endedMarch 31, 2013
Year ended March 31, 2014
Year endedMarch 31, 2013
USD 000s USD 000s INR million INR million
Balance as at March 31 1,180 1,620 71 97
Debit to profit and loss account :
Reversal of Deferred tax asset (327) (389) (20) (23)
Debit to available for sale reserves :
Rate differential from 23% to 21% (74) (51) (4) (3)
Adjustments for prior year - - - -
Balance as at March 31 779 1,180 47 71

34
ICICI Bank UK PLC, Strategic reportDirectors’ report and financial statements
March 31, 2014
(d) Deferred tax is composed of the tax impact of the following items:
(e) Taxation relating to available for sale reserve
11. Emoluments of Directors
Year ended March 31, 2014
Year endedMarch 31, 2013
Year ended March 31, 2014
Year endedMarch 31, 2013
USD 000s USD 000s INR million INR million
Collective provision 90 147 5 9
Effect of FRS 26
- Fees Income amortisation 364 597 23 36
- Recognition of fair value of derivatives 140 231 8 14
Excess of tax written down value over book value of tangible fixed assets
185 205 11 12
Total 779 1,180 47 71
Year ended March 31, 2014
Year endedMarch 31, 2013
Year ended March 31, 2014
Year endedMarch 31, 2013
USD 000s USD 000s INR million INR million
Provision for tax for current year (1,656) (6,719) (99) (403)
(1,656) (6,719) (99) (403)
Year ended March 31, 2014
Year endedMarch 31, 2013
Year ended March 31, 2014
Year endedMarch 31, 2013
USD 000s USD 000s INR million INR million
Directors’ fees and gross emoluments 972 809 58 48
The gross emoluments1 of the highest paid director were USD 572,203 (INR 34,283,543) (2013: USD 444,465; INR 26,630,120) excluding share based payments. Contributions on behalf of a director under a money purchase pension scheme amounted to USD 25,359 (INR 1,519,384) (2013: USD 21,230; INR 1,271,995). The number of stock options2 granted to the highest paid director during the year was 40,000 (2013: NIL).
1Gross emoluments include base salary and performance bonus2 Refer to note 12 for the details of the stock option scheme.
12. Share-based payments
During the year, USD 1.11 million (INR 66.4 million) was charged to the profit and loss account in respect of equity-settled share-based payment transactions (2013: USD 0.99 million; INR 59.7 million). This expense, which was computed from the fair values of the share-based payment transactions when granted, arose under employee share awards made in accordance with the ICICI Bank Limited group’s reward structures.

35
ICICI Bank UK PLC, Strategic reportDirectors’ report and financial statements
March 31, 2014
Stock Option Scheme
In terms of an Employee Stock Option Scheme (ESOS), of the parent Bank, options are granted to eligible employees and Directors of the Bank and its subsidiaries. As per the ESOS as amended from time to time, the maximum number of options granted to any employee/Director in a year is limited to 0.05% of the Parent Bank’s issued equity shares at the time of the grant, and the aggregate of all such options is limited to 10% of Parent Bank’s issued equity shares on the date of the grant. Options granted vest in a graded manner over a four year period, with 20%, 20%, 30% and 30% of the grants vesting in each year, commencing from the end of 12 months from the date of grant. Options granted in April 2009 vest in a graded manner over a five-year period, with 20%, 20%, 30% and 30% of the grants vesting in each year, commencing from the end of 24 months from the date of grant. The options can be exercised within 10 years from the date of grant or five years from the date of vesting, whichever is later.
Particulars of options granted to employees of ICICI Bank UK PLC up to March 31, 2014 are given below:
March 31, 2014 March 31, 2013
Number (000s) Number (000s)
Outstanding at the beginning of the year 898 801
Additions during the year 119 97
Outstanding at the end of the year 1,017 898
Calculation of fair values
Fair values of stock options/awards, measured at the date of grant of the option/award, are calculated using a binomial tree model. The expected life of options depends on the behaviour of option holders, which is incorporated into the option model on the basis of historic observable data. The fair values calculated are inherently subjective and uncertain due to the assumptions made and the limitations of the model used. Expected dividends are incorporated into the valuation model for stock options/awards, where applicable. The significant weighted average assumptions used to estimate the fair value of the options granted were as follows:
Year ended March 31, 2014
Year endedMarch 31, 2013
Range Range
Risk-free interest rate1 (%) 7.6-7.69 8.01-8.87
Expected term2 (years) 6.35 6.35
Expected volatility3 (%) 48.70 49.55
Expected dividend yield (%) 1.70 1.96
Share price at grant date (INR) 1,177.35 841.45
1 Risk free interest rates over the expected term of the option are based on the Indian government securities yield in effect at the time of the grant.2 Expected term is not a single input parameter but a function of various behavioural assumptions. The expected term of an option is estimated based on the vesting term as well as expected exercise behaviour of the employees who receive the option. Expected term is determined based on simplified method of vesting for grants.3 Expected volatility during the estimated expected term of the option is based on historical volatility determined based on observed market prices of the Bank’s publicly traded equity shares.
13. Financial Services Compensation Scheme
The Financial Services Compensation Scheme (‘FSCS’) has provided compensation to consumers following the collapse during 2008 of a number of deposit takers such as Bradford & Bingley plc, Heritable Bank plc, Kaupthing Singer & Friedlander Limited, Landsbanki ‘Icesave’, Dunfermline Building Society and London Scottish Bank plc.

36
ICICI Bank UK PLC, Strategic reportDirectors’ report and financial statements
March 31, 2014
The protection of consumer deposits is currently funded through loans from the Bank of England and HM Treasury. The Bank could be liable to pay a proportion of the outstanding borrowings that the FSCS has borrowed from HM Treasury which is currently at GBP 16.6 billion as per the FSCS Plan and Budget for 2014/2015. The Bank is also obligated to pay its share of forecast management expenses based on the Bank’s market share of deposits protected under the FSCS. This levy is called the specified deposit defaults (SDD) levy. During FY2014, FSCS recovered GBP 791 million of the SDD levies from the deposit taking sector (GBP 363 million capital Levy and GBP 428 million interest levy). As per the FSCS Plan and Budget for 2014/2015, FSCS expects to levy the deposit taking sector the second instalment of the principal on the non Bradford & Bingley loans for GBP 399 million and loan interest cost of GBP 439 million, making a total levy of GBP 838 million for 2014/15.
The Bank has recognized an expense of USD 1.8 million (INR 107.8 million) during FY2014 (FY2013: USD 1.0 million; INR 59.9 million), in respect of all statutory levies. This mainly includes the Bank’s share of the SDD levy management expense, including interest costs and principal. Until FY2014, the Bank had been accruing for the SDD levy based on its estimated share of total market protected deposits as at December 31 in the financial year, in addition to maintaining accruals for the levies due for the preceding December 31 deposit base. The accrual was based on the December trigger date for obligation to pay the levy.
The Bank has adopted IFRIC 21 ‘Levies’, on the basis that there is no equivalent guidance within UK GAAP and FRS 18 (Accounting Policies) allows the use of alternative accounting frameworks where this is the case. As IFRIC amends the trigger for recognition from December to the start of the FSCS scheme year in April, this has led to a reversal USD 1.0 million (INR 59.9 million) of accruals for 2014/15 scheme year during FY2014. Comparatives have not been re-stated on the grounds of immateriality.
14. Loans and advances to banks
(a) Residual Maturity
Year ended March 31, 2014
Year endedMarch 31, 2013
Year ended March 31, 2014
Year endedMarch 31, 2013
USD 000s USD 000s INR million INR million
Banks
Repayable on demand 63,402 34,838 3,799 2,087
Other loans and advances
Remaining Maturity :
Over 5 years 3 1,732 0 104
5 year or less but over 1 year 750 750 45 45
1 year or less but over 3 months 6,745 16,793 404 1,006
3 months or less 5,275 19,997 316 1,198
76,175 74,110 4,564 4,440
Parent and Group Companies
Repayable on demand 2,910 3,268 174 196
Other loans and advances
Remaining Maturity :
1 year or less but over 3 months - 244 - 15
3 months or less - 1,129 - 68
2,910 4,641 174 279
Sub Total 79,085 78,751 4,738 4,719
Collective provision (6) (94) 0 (6)
Specific impairment allowance - - - -
Total 79,079 78,657 4,738 4,713

37
ICICI Bank UK PLC, Strategic reportDirectors’ report and financial statements
March 31, 2014
(b) Concentration of exposure
The Bank has the following concentrations of gross loans and advances to banks:
As at March 31, 2014, the Bank had no direct exposure to banks in Portugal, Italy, Ireland, Greece, Spain, Cyprus, Ukraine or Russia (2013: NIL).
Geographical concentration represents the country of risk exposure. Generally, the risk domicile of an exposure is identified as the country of residence of the borrower provided that the cash flows of the borrower and/or the value of the security adequately covers the loan exposure of the Bank.
Year ended March 31, 2014
Year endedMarch 31, 2013
Year ended March 31, 2014
Year endedMarch 31, 2013
USD 000s USD 000s INR million INR million
Total gross advances to banks located in:
UK 50,305 39,070 3,014 2,340
Europe 6,813 8,220 408 493
North America 1,807 2,048 108 123
India 16,872 27,181 1,011 1,629
Rest of the World 3,288 2,232 197 134
Total 79,085 78,751 4,738 4,719
15. Loans and advances to customers
(a) Residual Maturity
(b) Concentration of exposure
Geographical concentrations of loans and advances to customers:
Year ended March 31, 2014
Year endedMarch 31, 2013
Year ended March 31, 2014
Year endedMarch 31, 2013
USD 000s USD 000s INR million INR million
Repayable on demand or at short notice 50,312 36,461 3,014 2,185
Other loans and advances
Remaining Maturity :
Over 5 years 251,937 230,399 15,095 13,804
5 years or less but over 1 year 1,319,947 1,144,832 79,085 68,593
1 year or less but over 3 months 466,285 241,858 27,937 14,491
3 months or less 721,822 677,159 43,248 40,571
Sub total 2,810,303 2,330,709 168,379 139,644
Collective provision (8,494) (17,129) (509) (1,026)
Specific impairment allowance (52,673) (30,608) (3,156) (1,834)
Total 2,749,136 2,282,972 164,714 136,784
Year ended March 31, 2014
Year endedMarch 31, 2013
Year ended March 31, 2014
Year endedMarch 31, 2013
USD 000s USD 000s INR million INR million
UK 540,238 598,901 32,368 35,883
Europe 681,574 740,955 40,837 44,394
North America 27,015 - 1,619 -
India 1,101,251 906,814 65,981 54,332
Rest of the World 171,124 84,039 10,253 5,035

38
ICICI Bank UK PLC, Strategic reportDirectors’ report and financial statements
March 31, 2014
Total 2,521,202 2,330,709 151,058 139,644
India (Retail loans against FCNR deposits) 289,101 - 17,321 -
Total 2,810,303 2,330,709 168,379 139,644
As at March 31, 2014, the outstanding exposure to customers in Ireland was USD 17.9 million (INR 1,072.5 million) (2013: USD 24.6 million; INR 1,473.9 million) and to Spain was USD 38.6 million (INR 2,312.7 million) (2013: NIL) . As at March 31, 2014, the Bank had no direct exposure to customers in Portugal, Italy, Greece, Cyprus, Ukraine or Russia. (2013: NIL).
Geographical concentration represents the country of risk exposure. Generally, the risk domicile of an exposure is identified as the country of residence of the borrower provided that the cash flows of the borrower and/or the value of the security adequately covers the loan exposure of the Bank.
16. Potential credit risk on financial instruments
March 31, 2014 USD 000s
March 31, 2014 INR Million
Neither past due nor impaired
Past due not impaired
Impaired Impairment allowances
Total
Cash 648 - - - 648
Balances at central banks 1,008,407 - - - 1,008,407
Loans and advances to banks 79,085 - - (6) 79,079
Loans and advances to customers 2,476,441 123,112 210,750 (61,167) 2,749,136
Investment securities 493,448 - 39,988 (34,551) 498,885
Other assets*:
- Cheques in clearing 188 - - - 188
- Deposits receivable 5,308 - - - 5,308
- Derivative financial instruments 86,028 - - - 86,028
- Unsettled securities 3,172 - - - 3,172
Accrued income and other receivables 28,672 - - - 28,672
Total financial instruments 4,181,397 123,112 250,738 (95,724) 4,459,523
Neither past due nor impaired
Past due not impaired
Impaired Impairment allowances
Total
Cash 39 - - - 39
Balances at central banks 60,419 - - - 60,419
Loans and advances to banks 4,738 - - 0 4,738
Loans and advances to customers 148,376 7,376 12,627 (3,665) 164,714
Investment securities 29,564 - 2,396 (2,070) 29,890
Other assets*:
- Cheques in clearing 11 - - - 11
- Deposits receivable 318 - - - 318
- Derivative financial instruments 5,154 - - - 5,154
- Unsettled securities 190 - - - 190
Accrued income and other receivables 1,718 - - - 1,718
Total financial instruments 250,527 7,376 15,023 (5,735) 267,191
* excludes deferred tax assets, prepaid expenses and fixed assets
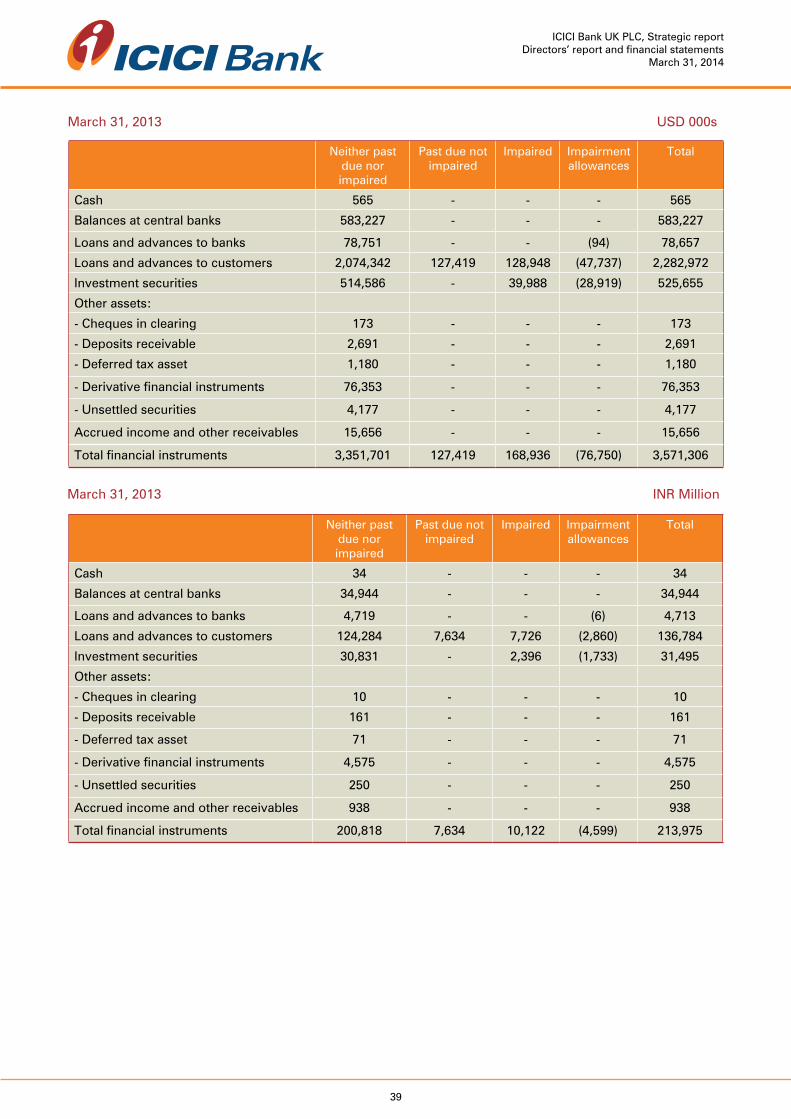
39
ICICI Bank UK PLC, Strategic reportDirectors’ report and financial statements
March 31, 2014
March 31, 2013 USD 000s
March 31, 2013 INR Million
Neither past due nor impaired
Past due not impaired
Impaired Impairment allowances
Total
Cash 565 - - - 565
Balances at central banks 583,227 - - - 583,227
Loans and advances to banks 78,751 - - (94) 78,657
Loans and advances to customers 2,074,342 127,419 128,948 (47,737) 2,282,972
Investment securities 514,586 - 39,988 (28,919) 525,655
Other assets:
- Cheques in clearing 173 - - - 173
- Deposits receivable 2,691 - - - 2,691
- Deferred tax asset 1,180 - - - 1,180
- Derivative financial instruments 76,353 - - - 76,353
- Unsettled securities 4,177 - - - 4,177
Accrued income and other receivables 15,656 - - - 15,656
Total financial instruments 3,351,701 127,419 168,936 (76,750) 3,571,306
Neither past due nor impaired
Past due not impaired
Impaired Impairment allowances
Total
Cash 34 - - - 34
Balances at central banks 34,944 - - - 34,944
Loans and advances to banks 4,719 - - (6) 4,713
Loans and advances to customers 124,284 7,634 7,726 (2,860) 136,784
Investment securities 30,831 - 2,396 (1,733) 31,495
Other assets:
- Cheques in clearing 10 - - - 10
- Deposits receivable 161 - - - 161
- Deferred tax asset 71 - - - 71
- Derivative financial instruments 4,575 - - - 4,575
- Unsettled securities 250 - - - 250
Accrued income and other receivables 938 - - - 938
Total financial instruments 200,818 7,634 10,122 (4,599) 213,975

40
ICICI Bank UK PLC, Strategic reportDirectors’ report and financial statements
March 31, 2014
Loans and advances to customers
March 31, 2014
March 31, 2013
March 31, 2014
March 31, 2013
USD 000s USD 000s INR million INR million
Loans contractually overdue as to principal or interest
- Less than 60 days - 9,217 - 552
- 61 to 90 days - 3,099 - 186
- more than 90 days 304,636 213,068 18,252 12,766
Total 304,636 225,384 18,252 13,504
Concentration of overdue exposure
United Kingdom 8,230 5,000 493 300
Europe 78,171 17,608 4,684 1,055
India 218,235 202,776 13,075 12,149
Total 304,636 225,384 18,252 13,504
Past due whether impaired or not
Past due not impaired 123,112 127,419 7,376 7,634
Past due impaired 181,524 97,965 10,876 5,870
Total 304,636 225,384 18,252 13,504
Past due not impaired*
- Less than 60 days - 3,099 - 186
- 61 to 90 days - 2,298 - 138
- more than 90 days 123,112 122,022 7,376 7,310
Total 123,112 127,419 7,376 7,634
*Past due not impaired are stated at the total value of the exposure. The total overdue contractual payments of principal or interest are USD 31.6 million (INR 1,893.3 million). All overdue cases are assessed for impairment as per the Bank’s policy. As on the reporting date, the Bank has reasonable certainty of repayment of the outstanding or there is adequate collateral cover. Hence these exposures have not been classified as impaired.
During the year ended March 31, 2014 the Bank had renegotiated/restructured loan amounting to USD 39.2 million (INR 2,348.7 million). As on March 31, 2014, included in the impaired loans was loan restructured in previous years of USD 29.2 million (INR 1,749.5 million) (2013: USD 26.6 million; INR 1,593.7 million).
17. Impairment on loans and advances
Net loan impairment charge to profit and loss account
March 31, 2014
March 31, 2013
March 31, 2014
March 31, 2013
USD 000s USD 000s INR million INR million
New charges (22,007) (23,062) (1,319) (1,382)
Release of allowance 8,723 2,853 523 171
Write off directly to profit and loss (1,306) - (78) -
(14,590) (20,209) (874) (1,211)
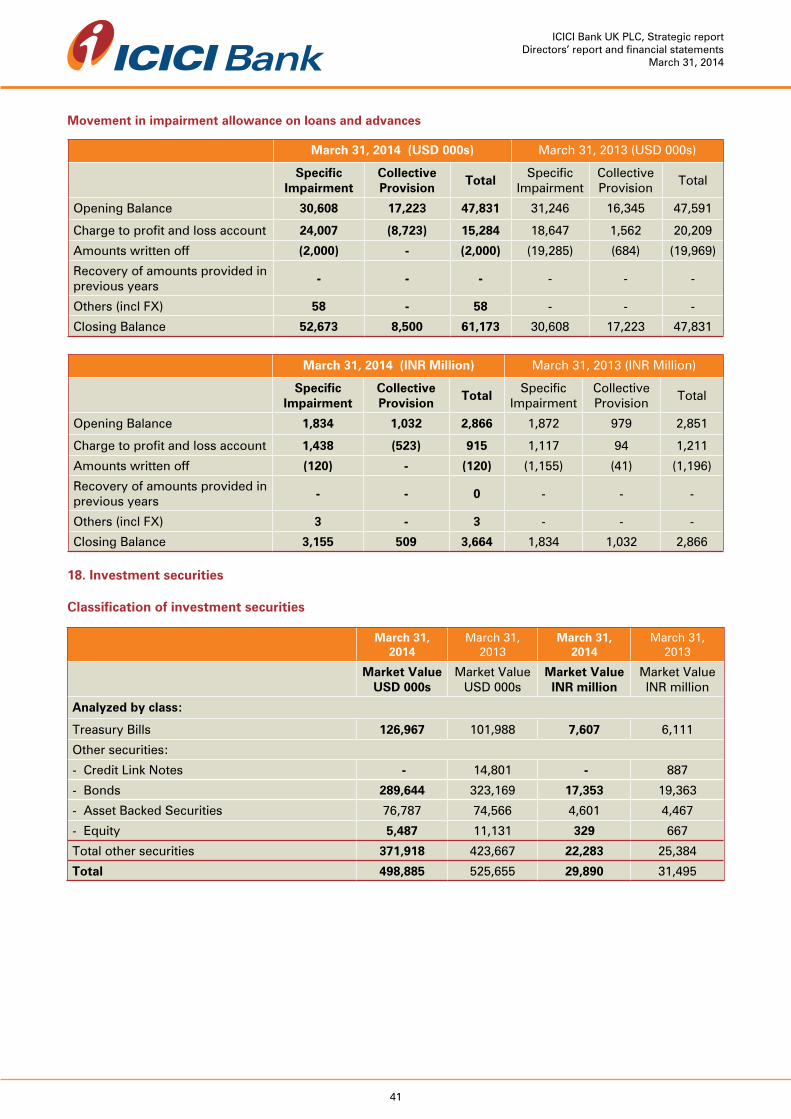
41
ICICI Bank UK PLC, Strategic reportDirectors’ report and financial statements
March 31, 2014
Movement in impairment allowance on loans and advances
March 31, 2014 (USD 000s) March 31, 2013 (USD 000s)
Specific Impairment
Collective Provision
TotalSpecific
ImpairmentCollective Provision
Total
Opening Balance 30,608 17,223 47,831 31,246 16,345 47,591
Charge to profit and loss account 24,007 (8,723) 15,284 18,647 1,562 20,209
Amounts written off (2,000) - (2,000) (19,285) (684) (19,969)
Recovery of amounts provided in previous years
- - - - - -
Others (incl FX) 58 - 58 - - -
Closing Balance 52,673 8,500 61,173 30,608 17,223 47,831
March 31, 2014 (INR Million) March 31, 2013 (INR Million)
Specific Impairment
Collective Provision
TotalSpecific
ImpairmentCollective Provision
Total
Opening Balance 1,834 1,032 2,866 1,872 979 2,851
Charge to profit and loss account 1,438 (523) 915 1,117 94 1,211
Amounts written off (120) - (120) (1,155) (41) (1,196)
Recovery of amounts provided in previous years
- - 0 - - -
Others (incl FX) 3 - 3 - - -
Closing Balance 3,155 509 3,664 1,834 1,032 2,866
18. Investment securities
Classification of investment securities
March 31, 2014
March 31, 2013
March 31, 2014
March 31, 2013
Market ValueUSD 000s
Market ValueUSD 000s
Market ValueINR million
Market ValueINR million
Analyzed by class:
Treasury Bills 126,967 101,988 7,607 6,111
Other securities:
- Credit Link Notes - 14,801 - 887
- Bonds 289,644 323,169 17,353 19,363
- Asset Backed Securities 76,787 74,566 4,601 4,467
- Equity 5,487 11,131 329 667
Total other securities 371,918 423,667 22,283 25,384
Total 498,885 525,655 29,890 31,495
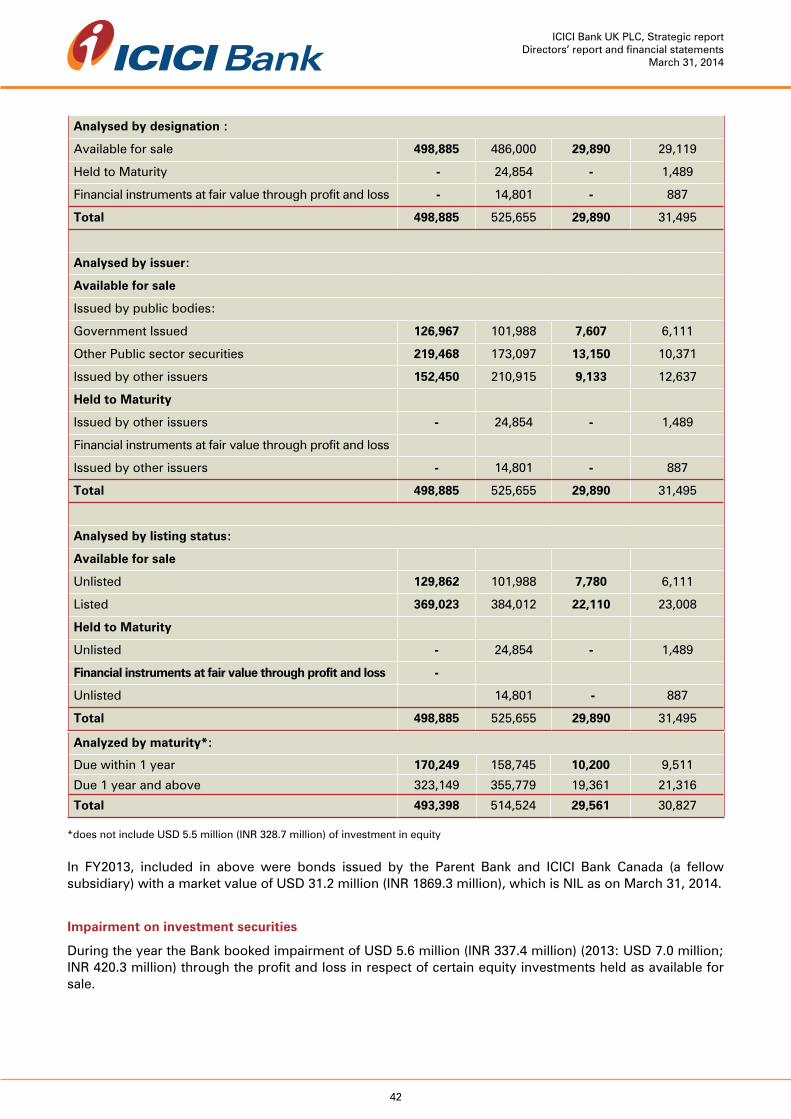
42
ICICI Bank UK PLC, Strategic reportDirectors’ report and financial statements
March 31, 2014
Analysed by designation :
Available for sale 498,885 486,000 29,890 29,119
Held to Maturity - 24,854 - 1,489
Financial instruments at fair value through profit and loss - 14,801 - 887
Total 498,885 525,655 29,890 31,495
Analysed by issuer:
Available for sale
Issued by public bodies:
Government Issued 126,967 101,988 7,607 6,111
Other Public sector securities 219,468 173,097 13,150 10,371
Issued by other issuers 152,450 210,915 9,133 12,637
Held to Maturity
Issued by other issuers - 24,854 - 1,489
Financial instruments at fair value through profit and loss
Issued by other issuers - 14,801 - 887
Total 498,885 525,655 29,890 31,495
Analysed by listing status:
Available for sale
Unlisted 129,862 101,988 7,780 6,111
Listed 369,023 384,012 22,110 23,008
Held to Maturity
Unlisted - 24,854 - 1,489
Financial instruments at fair value through profit and loss -
Unlisted 14,801 - 887
Total 498,885 525,655 29,890 31,495
Analyzed by maturity*:
Due within 1 year 170,249 158,745 10,200 9,511
Due 1 year and above 323,149 355,779 19,361 21,316
Total 493,398 514,524 29,561 30,827
*does not include USD 5.5 million (INR 328.7 million) of investment in equity
In FY2013, included in above were bonds issued by the Parent Bank and ICICI Bank Canada (a fellow subsidiary) with a market value of USD 31.2 million (INR 1869.3 million), which is NIL as on March 31, 2014.
Impairment on investment securities
During the year the Bank booked impairment of USD 5.6 million (INR 337.4 million) (2013: USD 7.0 million; INR 420.3 million) through the profit and loss in respect of certain equity investments held as available for sale.

43
ICICI Bank UK PLC, Strategic reportDirectors’ report and financial statements
March 31, 2014
Level 1 Level 2 Level 3 Total
Treasury Bills 126,967 - - 126,967
Credit Link Notes - - - -
Bonds 289,644 - - 289,644
Asset Backed Securities 76,787 - - 76,787
Equity 5,487 - - 5,487
Total 498,885 - - 498,885
Level 1 Level 2 Level 3 Total
Treasury Bills 101,988 - - 101,988
Credit Link Notes - 14,801 - 14,801
Bonds 290,541 7,774 - 298,315
Asset Backed Securities 74,566 - - 74,566
Equity 11,131 - - 11,131
Total 478,226 22,575 - 500,801
Level 1 Level 2 Level 3 Total
Treasury Bills 7,607 - - 7,607
Credit Link Notes - - - -
Bonds 17,353 - - 17,353
Asset Backed Securities 4,601 - - 4,601
Equity 329 - - 329
Total 29,890 - - 29,890
USD 000s
USD 000s
INR Million
Investments held at fair value at March 31, 2013, by valuation method:
Investments held at fair value at March 31, 2014, by valuation method:
Level 1 Level 2 Level 3 Total
Treasury Bills 6,111 - - 6,111
Credit Link Notes - 887 - 887
Bonds 17,408 466 - 17,874
Asset Backed Securities 4,468 - - 4,468
Equity 667 - - 667
Total 28,654 1,353 - 30,007
INR Million
Valuation Hierarchy
The valuation hierarchy is set out below:Level 1: Investments valued using unadjusted quoted prices in active markets for identical assets.Level 2: Investments valued using valuation techniques based on observable market data for instruments where markets are considered less than active. Instruments in this category are valued using: (a) Quoted prices for similar assets, or identical assets in markets which are considered to be less than active; or (b) Valuation techniques where all the inputs that have a significant effect on the valuation are directly or indirectly based on observable market data.Level 3: Investments valued using valuation model based on significant non market observable inputs.

44
ICICI Bank UK PLC, Strategic reportDirectors’ report and financial statements
March 31, 2014
19. Reclassification of Financial Assets
In October 2008, the Accounting Standard Board’s issued amendments to FRS 26 ‘Financial Instruments: Recognition and Measurement’ and FRS 29 ‘Financial Instruments: Disclosures’ which permits an entity to reclassify certain financial assets out of the held for trading category. The amendment also permits an entity to transfer from the available for sale category to the loans and receivable category in certain circumstances.
The reclassifications were made as a result of significant reductions in market liquidity for these assets, and a change in the intention to hold the assets for the foreseeable future or to maturity. These circumstances formed part of the wider context of market turmoil and are considered a rare event and, as such, the reclassification was permitted under the amendments to FRS 26. On the date of reclassification, the fair value of the asset was deemed to be the asset’s new amortized cost, and the assets have been tested for impairment since reclassification.
March 31, 2014 March 31, 2013
Carrying amount Fair value Carrying amount Fair value
From held for trading to available for sale
-Corporate Bonds 8,462 8,462 8,749 8,749
-Asset Backed Securities 1,963 1,963 2,343 2,343
From available for sale to loans and receivables
-Foreign Currency Convertible bonds 7,689 7,689 13,054 13,054
-Asset Backed Securities 87,072 95,431 85,571 86,144
Total 105,186 113,545 109,717 110,290
USD 000s
INR Million
Carrying amount and fair value of reclassified assets
Carrying amount and fair value of reclassified assets
March 31, 2014 March 31, 2013
Carrying amount Fair value Carrying amount Fair value
From held for trading to available for sale
-Corporate Bonds 507 507 524 524
-Asset Backed Securities 118 118 140 140
From available for sale to loans and receivables
-Foreign Currency Convertible bonds 461 461 782 782
-Asset Backed Securities 5,217 5,718 5,127 5,161
Total 6,303 6,804 6,573 6,607
The amount reclassified was based on the fair value of the financial assets as at the date of reclassification. The following table sets forth, for the periods indicated, the fair value gains and losses, income and expense recognized in the profit and loss account both before and after the date of reclassification:
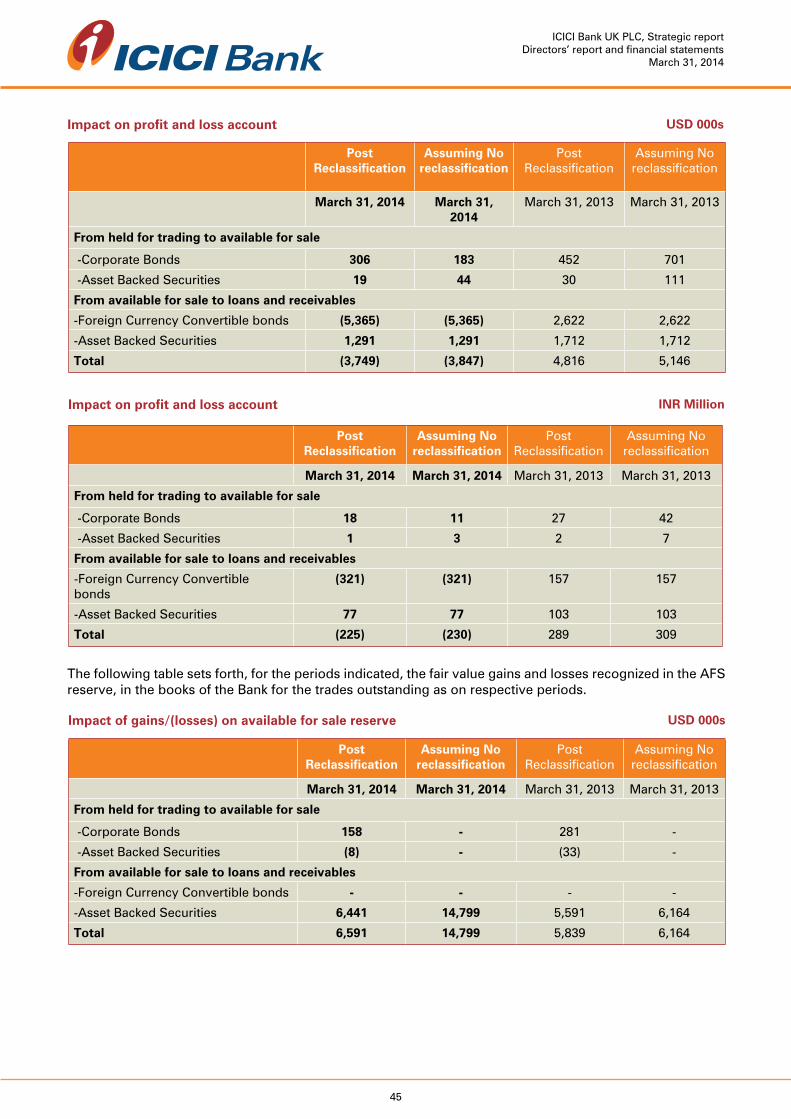
45
ICICI Bank UK PLC, Strategic reportDirectors’ report and financial statements
March 31, 2014
Impact on profit and loss account
Post Reclassification
Assuming No reclassification
Post Reclassification
Assuming No reclassification
March 31, 2014 March 31, 2014
March 31, 2013 March 31, 2013
From held for trading to available for sale
-Corporate Bonds 306 183 452 701
-Asset Backed Securities 19 44 30 111
From available for sale to loans and receivables
-Foreign Currency Convertible bonds (5,365) (5,365) 2,622 2,622
-Asset Backed Securities 1,291 1,291 1,712 1,712
Total (3,749) (3,847) 4,816 5,146
Post Reclassification
Assuming No reclassification
Post Reclassification
Assuming No reclassification
March 31, 2014 March 31, 2014 March 31, 2013 March 31, 2013
From held for trading to available for sale
-Corporate Bonds 18 11 27 42
-Asset Backed Securities 1 3 2 7
From available for sale to loans and receivables
-Foreign Currency Convertible bonds
(321) (321) 157 157
-Asset Backed Securities 77 77 103 103
Total (225) (230) 289 309
The following table sets forth, for the periods indicated, the fair value gains and losses recognized in the AFS reserve, in the books of the Bank for the trades outstanding as on respective periods.
USD 000s
INR Million
Post Reclassification
Assuming No reclassification
Post Reclassification
Assuming No reclassification
March 31, 2014 March 31, 2014 March 31, 2013 March 31, 2013
From held for trading to available for sale
-Corporate Bonds 158 - 281 -
-Asset Backed Securities (8) - (33) -
From available for sale to loans and receivables
-Foreign Currency Convertible bonds - - - -
-Asset Backed Securities 6,441 14,799 5,591 6,164
Total 6,591 14,799 5,839 6,164
Impact on profit and loss account
Impact of gains/(losses) on available for sale reserve USD 000s
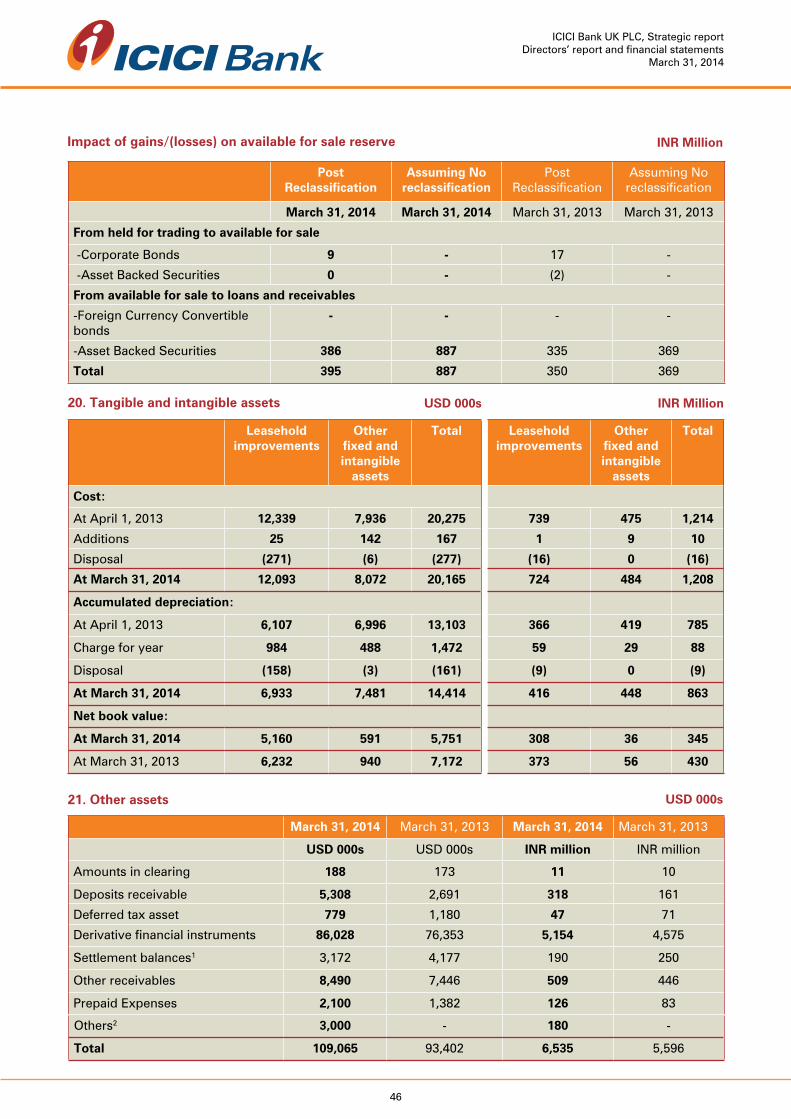
46
ICICI Bank UK PLC, Strategic reportDirectors’ report and financial statements
March 31, 2014
Post Reclassification
Assuming No reclassification
Post Reclassification
Assuming No reclassification
March 31, 2014 March 31, 2014 March 31, 2013 March 31, 2013
From held for trading to available for sale
-Corporate Bonds 9 - 17 -
-Asset Backed Securities 0 - (2) -
From available for sale to loans and receivables
-Foreign Currency Convertible bonds
- - - -
-Asset Backed Securities 386 887 335 369
Total 395 887 350 369
INR MillionImpact of gains/(losses) on available for sale reserve
Leasehold improvements
Other fixed and intangible
assets
Total
Cost:
At April 1, 2013 12,339 7,936 20,275
Additions 25 142 167
Disposal (271) (6) (277)
At March 31, 2014 12,093 8,072 20,165
Accumulated depreciation:
At April 1, 2013 6,107 6,996 13,103
Charge for year 984 488 1,472
Disposal (158) (3) (161)
At March 31, 2014 6,933 7,481 14,414
Net book value:
At March 31, 2014 5,160 591 5,751
At March 31, 2013 6,232 940 7,172
USD 000s20. Tangible and intangible assets
Leasehold improvements
Other fixed and intangible
assets
Total
739 475 1,214
1 9 10
(16) 0 (16)
724 484 1,208
366 419 785
59 29 88
(9) 0 (9)
416 448 863
308 36 345
373 56 430
INR Million
March 31, 2014 March 31, 2013 March 31, 2014 March 31, 2013
USD 000s USD 000s INR million INR million
Amounts in clearing 188 173 11 10
Deposits receivable 5,308 2,691 318 161
Deferred tax asset 779 1,180 47 71
Derivative financial instruments 86,028 76,353 5,154 4,575
Settlement balances1 3,172 4,177 190 250
Other receivables 8,490 7,446 509 446
Prepaid Expenses 2,100 1,382 126 83
USD 000s21. Other assets
Others2 3,000 - 180 -
Total 109,065 93,402 6,535 5,596
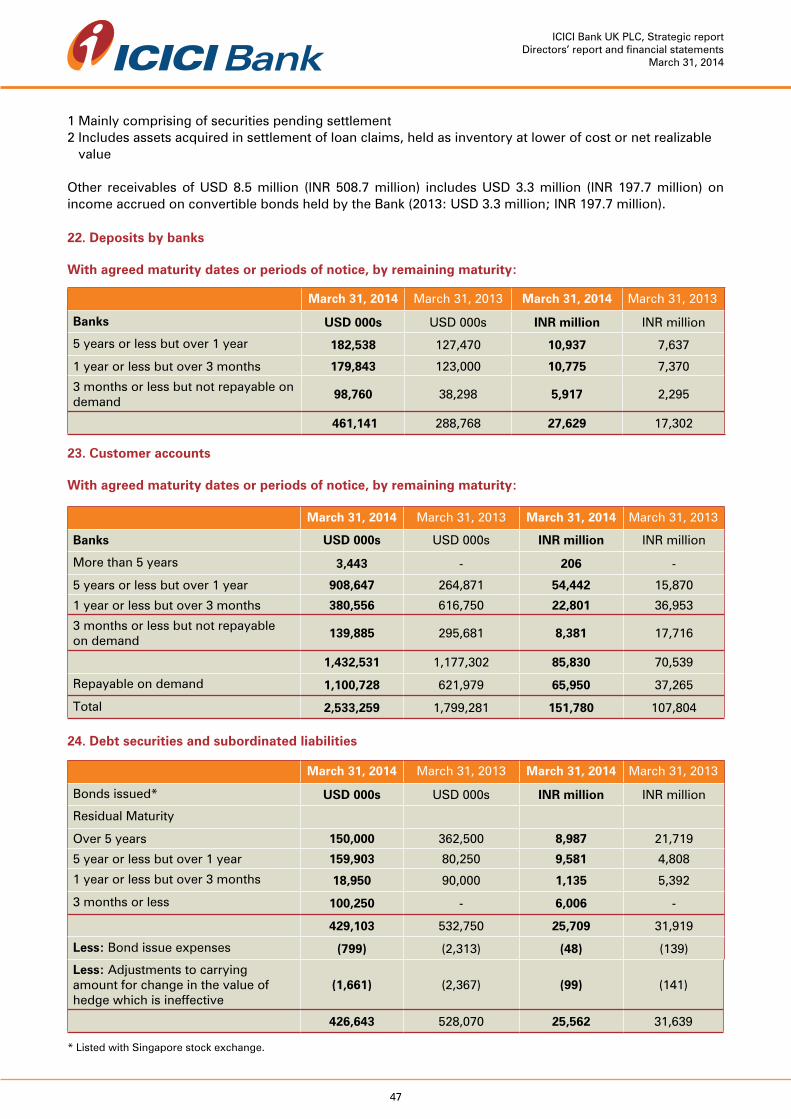
47
ICICI Bank UK PLC, Strategic reportDirectors’ report and financial statements
March 31, 2014
1 Mainly comprising of securities pending settlement2 Includes assets acquired in settlement of loan claims, held as inventory at lower of cost or net realizable value
Other receivables of USD 8.5 million (INR 508.7 million) includes USD 3.3 million (INR 197.7 million) on income accrued on convertible bonds held by the Bank (2013: USD 3.3 million; INR 197.7 million).
22. Deposits by banks
With agreed maturity dates or periods of notice, by remaining maturity:
March 31, 2014 March 31, 2013 March 31, 2014 March 31, 2013
Banks USD 000s USD 000s INR million INR million
5 years or less but over 1 year 182,538 127,470 10,937 7,637
1 year or less but over 3 months 179,843 123,000 10,775 7,370
3 months or less but not repayable on demand
98,760 38,298 5,917 2,295
461,141 288,768 27,629 17,302
March 31, 2014 March 31, 2013 March 31, 2014 March 31, 2013
Banks USD 000s USD 000s INR million INR million
More than 5 years 3,443 - 206 -
5 years or less but over 1 year 908,647 264,871 54,442 15,870
1 year or less but over 3 months 380,556 616,750 22,801 36,953
3 months or less but not repayable on demand
139,885 295,681 8,381 17,716
1,432,531 1,177,302 85,830 70,539
Repayable on demand 1,100,728 621,979 65,950 37,265
Total 2,533,259 1,799,281 151,780 107,804
March 31, 2014 March 31, 2013 March 31, 2014 March 31, 2013
Bonds issued* USD 000s USD 000s INR million INR million
Residual Maturity
Over 5 years 150,000 362,500 8,987 21,719
5 year or less but over 1 year 159,903 80,250 9,581 4,808
1 year or less but over 3 months 18,950 90,000 1,135 5,392
3 months or less 100,250 - 6,006 -
429,103 532,750 25,709 31,919
Less: Bond issue expenses (799) (2,313) (48) (139)
23. Customer accounts
With agreed maturity dates or periods of notice, by remaining maturity:
24. Debt securities and subordinated liabilities
Less: Adjustments to carrying amount for change in the value of hedge which is ineffective
(1,661) (2,367) (99) (141)
426,643 528,070 25,562 31,639
* Listed with Singapore stock exchange.

48
ICICI Bank UK PLC, Strategic reportDirectors’ report and financial statements
March 31, 2014
Details of various bonds and notes under the medium term notes programmes issued by the Bank at March 31, 2014 are as follows:
Date of Issue Nature of Issue Interest Rate
Interest frequency
Maturity USD 000s INR million
12-Dec-06Perpetual junior
subordinated notes
6.38% Semi-annuallyCallable by issuer at par in 2016; no
maturity85,000 5,093
23-Nov-10
Unsecured subordinated
fixed rate notes due 2020
7.00% Semi annuallyBullet payment in November 2020
150,000 8,987
26-Oct-12Senior
unsecured bonds
2.34% Semi annuallyBullet payment in
April 201410,000 599
08-Feb-13Senior
unsecured bonds
1.75%Bullet payment
in April 2014Bullet payment in
April 201450,000 2,996
20-Nov-12Senior
unsecured bonds
Libor + 180 bps
QuarterlyBullet payment in
May 201420,250 1,213
14-Jun-13Senior
unsecured bonds
1.35% AnnuallyBullet payment in
June 2014.20,000 1,198
10-Dec-13Senior
unsecured bonds
1.85% At maturity Bullet payment in December 2014.
18,950 1,135
27-Mar-13Senior
unsecured bonds
2.32% QuarterlyBullet payment in
April 2016.74,903 4,488
Total 429,103 25,709
Less: Bond issue expenses (799) (48)
Less: Adjustments to carrying amount for change in the value of hedge which is ineffective
(1,661) (99)
426,643 25,562
For all the subordinated notes, the notes and coupons are direct, unsecured and subordinated obligations of the Bank, and rank pari passu without any preference among themselves.
25. Repurchase agreements
March 31, 2014 March 31, 2013
USD 000s USD 000s
Carrying amount of transferred
liabilities
Carrying amount of transferred
liabilities
Carrying amount of transferred
liabilities
Carrying amount of transferred
liabilities
Repurchase agreements 316,544 414,340 207,960 245,171
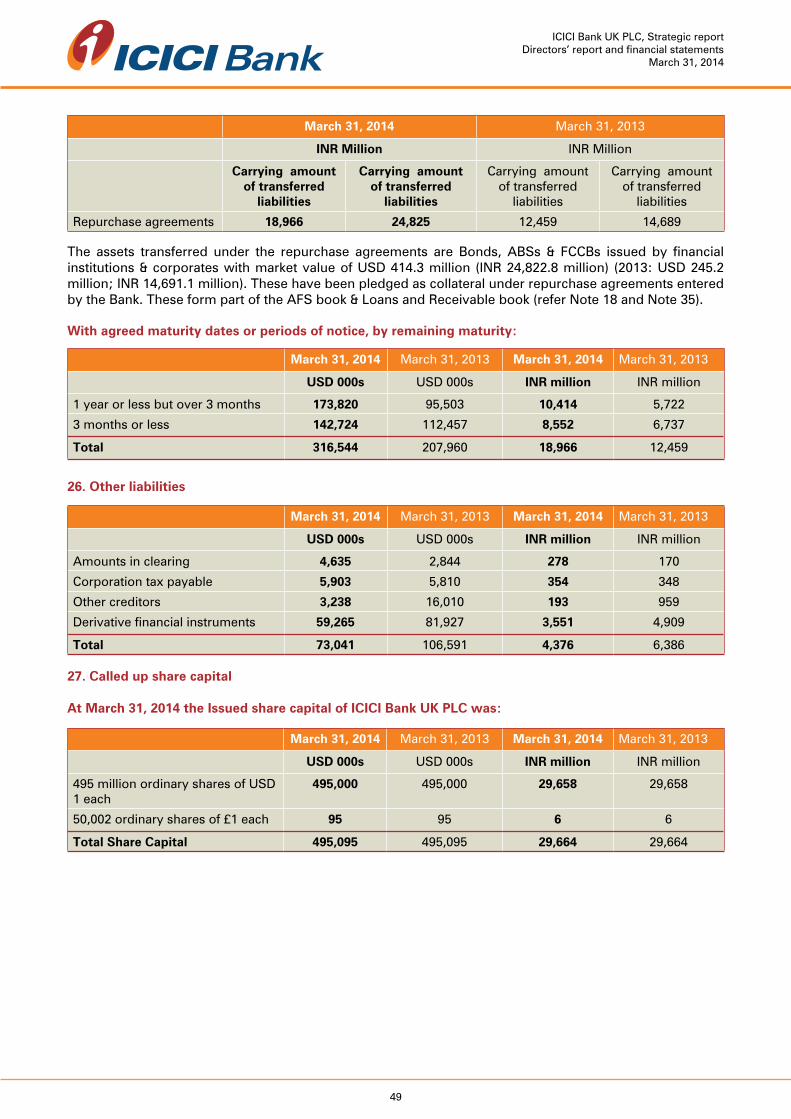
49
ICICI Bank UK PLC, Strategic reportDirectors’ report and financial statements
March 31, 2014
The assets transferred under the repurchase agreements are Bonds, ABSs & FCCBs issued by financial institutions & corporates with market value of USD 414.3 million (INR 24,822.8 million) (2013: USD 245.2 million; INR 14,691.1 million). These have been pledged as collateral under repurchase agreements entered by the Bank. These form part of the AFS book & Loans and Receivable book (refer Note 18 and Note 35).
March 31, 2014 March 31, 2013
INR Million INR Million
Carrying amount of transferred
liabilities
Carrying amount of transferred
liabilities
Carrying amount of transferred
liabilities
Carrying amount of transferred
liabilities
Repurchase agreements 18,966 24,825 12,459 14,689
March 31, 2014 March 31, 2013 March 31, 2014 March 31, 2013
USD 000s USD 000s INR million INR million
1 year or less but over 3 months 173,820 95,503 10,414 5,722
3 months or less 142,724 112,457 8,552 6,737
Total 316,544 207,960 18,966 12,459
March 31, 2014 March 31, 2013 March 31, 2014 March 31, 2013
USD 000s USD 000s INR million INR million
Amounts in clearing 4,635 2,844 278 170
Corporation tax payable 5,903 5,810 354 348
Other creditors 3,238 16,010 193 959
Derivative financial instruments 59,265 81,927 3,551 4,909
Total 73,041 106,591 4,376 6,386
With agreed maturity dates or periods of notice, by remaining maturity:
26. Other liabilities
27. Called up share capital
At March 31, 2014 the Issued share capital of ICICI Bank UK PLC was:
March 31, 2014 March 31, 2013 March 31, 2014 March 31, 2013
USD 000s USD 000s INR million INR million
495 million ordinary shares of USD 1 each
495,000 495,000 29,658 29,658
50,002 ordinary shares of £1 each 95 95 6 6
Total Share Capital 495,095 495,095 29,664 29,664
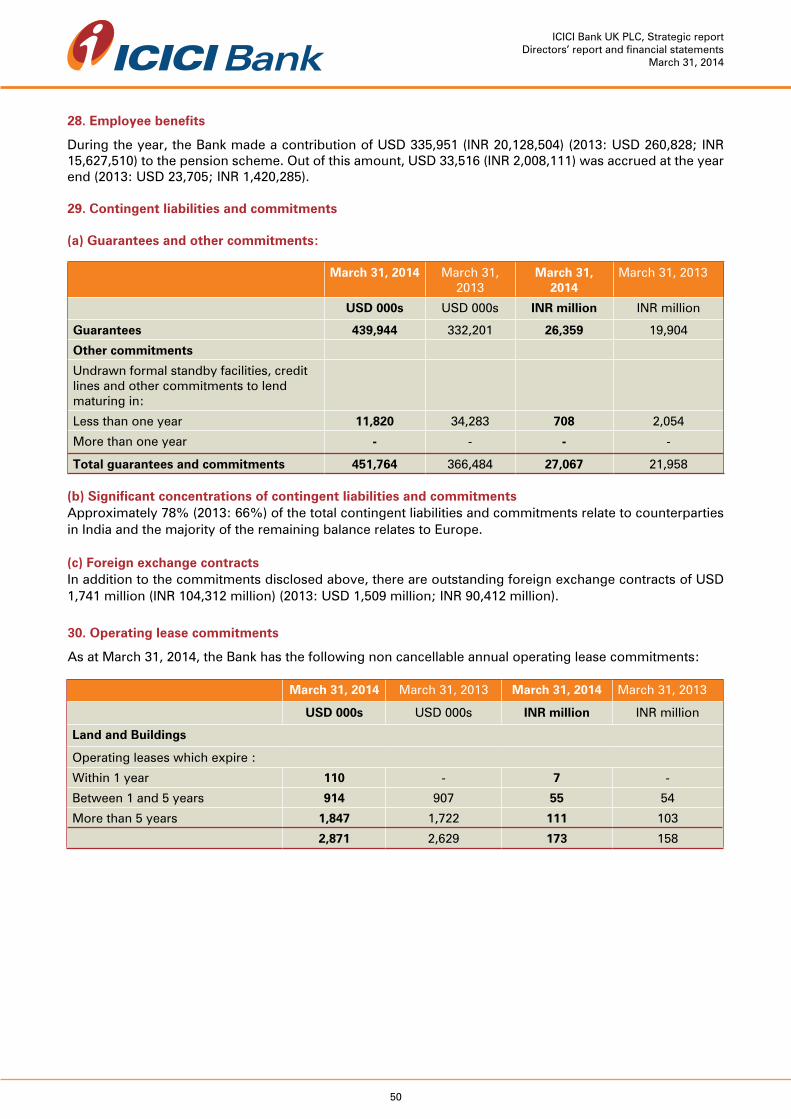
50
ICICI Bank UK PLC, Strategic reportDirectors’ report and financial statements
March 31, 2014
March 31, 2014 March 31, 2013
March 31, 2014
March 31, 2013
USD 000s USD 000s INR million INR million
Guarantees 439,944 332,201 26,359 19,904
Other commitments
Undrawn formal standby facilities, credit lines and other commitments to lend maturing in:
Less than one year 11,820 34,283 708 2,054
More than one year - - - -
Total guarantees and commitments 451,764 366,484 27,067 21,958
28. Employee benefits
During the year, the Bank made a contribution of USD 335,951 (INR 20,128,504) (2013: USD 260,828; INR 15,627,510) to the pension scheme. Out of this amount, USD 33,516 (INR 2,008,111) was accrued at the year end (2013: USD 23,705; INR 1,420,285).
29. Contingent liabilities and commitments
(a) Guarantees and other commitments:
(b) Significant concentrations of contingent liabilities and commitmentsApproximately 78% (2013: 66%) of the total contingent liabilities and commitments relate to counterparties in India and the majority of the remaining balance relates to Europe.
(c) Foreign exchange contractsIn addition to the commitments disclosed above, there are outstanding foreign exchange contracts of USD 1,741 million (INR 104,312 million) (2013: USD 1,509 million; INR 90,412 million).
March 31, 2014 March 31, 2013 March 31, 2014 March 31, 2013
USD 000s USD 000s INR million INR million
Land and Buildings
Operating leases which expire :
Within 1 year 110 - 7 -
Between 1 and 5 years 914 907 55 54
More than 5 years 1,847 1,722 111 103
2,871 2,629 173 158
30. Operating lease commitments
As at March 31, 2014, the Bank has the following non cancellable annual operating lease commitments:

51
ICICI Bank UK PLC, Strategic reportDirectors’ report and financial statements
March 31, 2014
31. Categories and classes of Financial Instruments Assets:
As at March 31, 2014
Fair value though P&L
Available for Sale
Loans & Receivables
Held to maturity
Total
Cash - - 648 - 648
Balances at central banks - - 1,008,407 - 1,008,407
Loans and advances to banks - - 79,079 - 79,079
Loans and advances to customers - - 2,749,136 - 2,749,136
Investment Securities - 498,885 - - 498,885
Other assets* 86,028 - 17,157 - 103,185
Accrued income - - 20,183 - 20,183
Total financial assets 86,028 498,885 3,874,610 - 4,459,523
Fair value though P&L
Available for Sale
Loans & Receivables
Held to maturity
Total
Cash - - 39 - 39
Balances at central banks - - 60,419 - 60,419
Loans and advances to banks - - 4,738 - 4,738
Loans and advances to customers - - 164,714 - 164,714
Investment Securities - 29,890 - - 29,890
Other assets* 5,154 - 1,028 - 6,182
Accrued income - - 1,209 - 1,209
Total financial assets 5,154 29,890 232,147 - 267,191
USD 000s
INR MillionAs at March 31, 2014
As at March 31, 2013
Fair value though P&L
Available for Sale
Loans & Receivables
Held to maturity
Total
Cash - - 565 565
Balances at central banks - - 583,227 - 583,227
Loans and advances to banks - - 78,657 - 78,657
Loans and advances to customers - - 2,282,972 - 2,282,972
Investment Securities 14,801 486,000 - 24,854 525,655
Other assets* 76,353 - 14,487 - 90,840
Accrued income - - 15,656 15,656
Total financial assets 91,154 486,000 2,975,564 24,854 3,577,572
USD 000s
Fair value though P&L
Available for Sale
Loans & Receivables
Held to maturity
Total
Cash - - 34 - 34
Balances at central banks - - 34,944 - 34,944
Loans and advances to banks - - 4,713 - 4,713
Loans and advances to customers - - 136,784 - 136,784
Investment Securities 887 29,119 - 1,489 31,495
Other assets* 4,575 - 868 - 5,443
Accrued income - - 938 - 938
Total financial assets 5,462 29,119 178,281 1,489 214,351
INR MillionAs at March 31,2013
* excludes deferred tax assets, prepaid expenses and fixed assets

52
ICICI Bank UK PLC, Strategic reportDirectors’ report and financial statements
March 31, 2014
Fair value though P&L Non trading liability Total
Deposits by banks - 461,141 461,141
Customer accounts - 2,533,259 2,533,259
Debt securities in issue - 426,643 426,643
Other liabilities 59,265 13,776 73,041
Accruals and deferred income - 31,477 31,477
Repurchase agreements - 316,544 316,544
Total financial liabilities 59,265 3,782,840 3,842,105
Fair value though P&L Non trading liability Total
Deposits by banks - 27,629 27,629
Customer accounts - 151,780 151,780
Debt securities in issue - 25,562 25,562
Other liabilities 3,551 825 4,376
Accruals and deferred income - 1,886 1,886
Repurchase agreements - 18,966 18,966
Total financial liabilities 3,551 226,648 230,199
USD 000s
INR Million
Liablities:
As at March 31, 2014
As at March 31, 2014
Fair value though P&L Non trading liability Total
Deposits by banks - 288,768 288,768
Customer accounts - 1,799,281 1,799,281
Debt securities in issue - 528,070 528,070
Other liabilities 81,927 24,664 106,591
Accruals and deferred income - 34,464 34,464
Repurchase agreements - 207,960 207,960
Total financial liabilities 81,927 2,883,207 2,965,134
USD 000sAs at March 31, 2013
Accruals and deferred income - 2,065 2,065
Repurchase agreements - 12,459 12,459
Total financial liabilities 4,909 172,746 177,655
Fair value though P&L Non trading liability Total
Deposits by banks - 17,302 17,302
Customer accounts - 107,804 107,804
Debt securities in issue - 31,639 31,639
Other liabilities 4,909 1,477 6,386
INR MillionAs at March 31, 2013
Refer to Note 3 for descriptions of categories of assets and liabilities

53
ICICI Bank UK PLC, Strategic reportDirectors’ report and financial statements
March 31, 2014
32. Capital Management
The Bank’s regulatory capital requirements are set and monitored by the PRA. The Bank implemented the Basel II framework for calculating minimum capital requirements, with effect from January 1, 2008.
The Bank’s regulatory capital is categorised into two tiers:
Tier 1 capital, which includes ordinary share capital, capital redemption reserve and retained earnings.
Tier 2 capital, which includes qualifying subordinated liabilities, collective provision and other allowances.
Various limits are applied to the elements of the capital base. Qualifying Tier 2 capital cannot exceed Tier 1 capital; and qualifying term subordinated loan capital may not exceed 50% of Tier 1 capital. There are also restrictions on the amount of collective provision that may be included in Tier 1 capital.
Under Basel II, the Bank calculates requirements for market risk in its trading portfolios based on Standardised model.
Banking operations are categorized as either trading or banking book, and risk-weighted assets are determined according to specified requirements that seek to reflect the varying levels of risk attached to assets and exposures not recognized in the balance sheet.
The Bank uses regulatory capital ratios in order to monitor its capital base and these capital ratios remain the international standards for measuring capital adequacy. The PRA’s approach to such measurement based upon Basel II is now primarily based on monitoring the Capital Resource Requirement to available capital resources. The PRA also sets individual capital guidance (ICG) for the Bank that sets capital requirements in excess of the minimum Capital Resource Requirement. A key input to the ICG setting process is the Bank’s Internal Capital Adequacy Assessment Process (ICAAP). The Bank submitted its last ICAAP document to the PRA in July 2013.
In June 2013, the European Commission published the final Regulation and Directive, known as CRD IV, to give effect to the Basel III framework in the EU. In December 2013, the PRA issued its final rules on CRD IV in a Policy Statement PS 7/13. In its final rules, the PRA opted for an acceleration of the CRD IV end point definition of CET1. More clarity is expected on quantification and interaction of capital buffers and Pillar 2, where further PRA consultations are due in 2014.
The Bank’s policy is to maintain a strong capital base so as to maintain investor, creditor and market confidence and to sustain future development of the business. The impact of the level of capital on shareholders’ return is also recognized and the Bank recognizes the need to maintain a balance between the higher returns that might be possible with greater gearing and the advantages and security afforded by a sound capital position. The Bank has complied with all regulatory capital requirements throughout the year.
Under CRDIVMarch 31, 2014
Under Basel IIMarch 31, 2013
Under CRDIVMarch 31, 2014
Under Basel IIMarch 31, 2013
USD 000s USD 000s INR million INR million
Total capital 814.4 989.8 48,795 59,304
Tier I 623.8 619.3 37,375 37,105
Tier II 190.6 370.5 11,420 22,199
The Bank’s regulatory capital resources as follows:
54
ICICI Bank UK PLC, Strategic reportDirectors’ report and financial statements
March 31, 2014
33. Risk Management Framework
ICICI Bank UK PLC has adopted the governance framework in line with the corporate governance practices adopted by other UK financial institutions. The Board is assisted by its sub-committees, the Audit Committee, the Board Governance and Ethics Committee (BGEC), the Board Risk Committee (BRC), and the Board Credit Committee (BCC), and follows ICICI Group’s overall risk management framework. The Board has delegated responsibility for the day-to-day management of the Bank to the Managing Director and Chief Executive Officer. In this role, the Managing Director and Chief Executive Officer is supported by the Management Committee, which he chairs. The Management Committee is supported by various other committees, which include the Executive Credit and Risk Committee (ECRC), the Asset Liability Management Committee (ALCO), the Operational Risk Management Committee (ORMC), Conduct Risk Forum and the Product and Process Approval Committee (PAC).
As a financial institution, the Bank is exposed to various types of risks. The objective of the risk management framework of the Bank is to ensure that the key risks facing the Bank are identified, understood, measured and monitored; and that the policies and procedures established to address these risks are strictly adhered to.
The key principles underlying the risk management framework of the Bank are as follows: 1. The Board of Directors has oversight over the risks assumed by the Bank. Specific Board committees have been constituted to facilitate focused oversight of various risks. 2. Policies approved from time to time by the Board of Directors/Committees of the Board form the governing framework for each type of risk. The business activities are undertaken within this policy framework. 3. Independent groups and sub-groups have been constituted across the Bank to facilitate independent evaluation, monitoring and reporting of risks. These groups function independently of the business groups/sub-groups.
As part of implementation of an Enterprise Risk Management framework, the Bank has developed a risk appetite framework based on an examination of best practices and the risk appetite statement of the Parent. The risk appetite statement has been further drilled down into portfolio-level limits.
The Bank has a risk register which documents the material risks faced by the Bank and categorises them as High/Medium or Low risk based on likelihood and severity of impact. The key material risks to which the Bank is exposed include credit risk (including concentration risk and political risk), market risk (including interest rate and credit spread risks), liquidity risk and operational risk (including ‘compliance and legal risk’ and ‘conduct risks’).
The approach adopted by management to manage the key risks facing the Bank is outlined below.
Credit Risk
Credit risk is the risk that unexpected losses may arise as a result of the Bank’s borrowers or market counterparties failing to meet obligations under a contract. All credit risk related aspects are governed by the Credit Risk Management Policy (CRMP), which is approved and reviewed annually by the Board Credit Committee. The CRMP describes the principles which underpin and drive the Bank’s approach to credit risk management together with the systems and processes through which they are implemented and administered.
The Bank ensures that there is independent challenge of credit proposals by adopting a two stage process whereby a commercial officer assesses and proposes a transaction or limit and this proposal is then reviewed independently assessed by a credit officer within the risk team.
55
ICICI Bank UK PLC, Strategic reportDirectors’ report and financial statements
March 31, 2014
The CRMP lays down a structured credit approval process, which includes the procedure for independent credit risk assessment and the assignment of an internal risk rating (IRR) to the borrower. The risk rating is a critical input in the credit approval process and is used as an input in arriving at the risk premium for the proposal.
The Bank uses credit rating software through which it assesses a variety of risks relating to the borrower and the relevant industry while assigning an internal rating. Borrower risk is evaluated by considering, inter alia:
•Thefinancialpositionoftheborrower,byanalysingthequalityofitsfinancialstatements,itspast financial performance, its financial flexibility in terms of ability to raise capital and its cash flow adequacy; •Theborrower’srelativemarketpositionandoperatingefficiency;and •Thequalityofmanagementbyanalysingitstrackrecord,paymentrecordandfinancialconservatism.Industry risk is evaluated by considering, inter alia: •Certainindustrycharacteristics,suchastheimportanceoftheindustrytotheeconomy,itsgrowth outlook, cyclicality and government policies relating to the industry; •Thecompetitivenessoftheindustry;and •Certainindustryfinancials,includingreturnoncapitalemployed,operatingmargins,andearnings stability.
After conducting an analysis of a specific borrower’s risk, the Bank assigns an internal risk rating to the borrower. The Bank has a rating scale ranging from ‘AAA’ to ‘D’ (AAA signifying the highest level of credit worthiness and D signifying default). AAA through to BBB are considered ‘Investment Grade’ while BB and below are considered ‘Non-Investment Grade’.
Credit approval
The delegation structure for approval of credit limits is approved by the Board. Credit proposals are approved by the Executive Credit and Risk Committee (ECRC) or the Board Credit Committee (BCC) based on, inter alia, the amount and internal risk rating of the facility. All credit proposals put up to the BCC are passed through the ECRC.
The Credit Risk team is also responsible for the following with respect to managing the Bank’s credit risk:
•DevelopingcreditpoliciesinconsultationwiththeCorporateBankingGroupwhichcovercollateral management, the credit rating framework, provisioning, etc. •Establishingthedelegationofsanctioningpowersavailabletoindividuals,singlyorjointly,andthe credit committees which are documented in the Credit Approval Authorisation Manual. •Limitingandmonitoringconcentrationsofexposuretocounterparties,geographies,industrial sectors, internal rating categories, etc. •PerformingperiodiccreditstresstestsontheBank’sportfolioandcommunicatingtheresultstothe BCC.
The credit middle office function is responsible for credit administration which includes monitoring compliance with the terms and conditions prior to disbursement. It also reviews the completeness of documentation and creation of security.
Concentration risk
Concentration risk arises from significant exposures to groups of counterparties whose likelihood of default is driven by common underlying factors, e.g. sector, economy, geographical location,instrument type. The concentration risk in the Bank’s portfolio is governed by the risk appetite framework which stipulates various limits to manage exposure concentrations within the Bank. The key parameters of risk concentrations measured in the Bank include sectoral, country, rating category based, product specific exposures, counterparty and large exposures.

56
ICICI Bank UK PLC, Strategic reportDirectors’ report and financial statements
March 31, 2014
Credit Monitoring
Credit quality is monitored on an ongoing basis but can also be triggered by any material credit event coming to the Bank’s notice through either primary or secondary sources. The Bank has established a credit forum, which is comprised of Heads of Businesses and the Head of Risk. The credit forum focuses on management & monitoring of impaired and watchlist assets/investments and also monitors developments in the Bank’s portfolio through the Early Warning Indicators (EWI) framework to identify potential vulnerabilities. It is the Bank’s policy to review borrower accounts at least on an annual basis or in a shorter interval if recommended by the credit officer or the relevant sanctioning committee. A risk based asset review framework has been put in place wherein the frequency of asset review would be higher for cases with higher exposure and/or lower credit rating. The Bank has established a list of assets under watch as an additional tool for monitoring exposures which show or are expected to show signs of weakness. The assets under watch are reviewed on a quarterly basis by the BCC, in addition to review and monitoring by the credit forum. The Bank documents the ‘lessons learned’ from its experiences of exposures against which specific provisions have been raised. These are presented to the BCC and circulated to the commercial officers.
Credit risk is also managed at the portfolio level by monitoring and reporting risk dashboards to the BCC. The credit risk dashboard is constructed using key risk indicators for underlying portfolio rating, counterparty concentration, geographical concentration, stressed assets, sectoral concentration, recovery risk and documentation risk.
The segregation of responsibilities and oversight by groups external to the business groups ensure adequate checks and balances.
March 31, 2014 March 31, 2013 March 31, 2014 March 31, 2013
USD 000s USD 000s INR million INR million
AAA 166,400 168,707 9,970 10,108
AA+ 29,421 - 1,763 -
AA 5,053 3,929 303 235
AA- 31,594 46,614 1,893 2,793
A 5 - 0 -
A- 13,680 55,977 820 3,354
BBB- 227,854 214,300 13,652 12,840
BB+ and below 19,391 - 1,162 -
Non rated 5,487 36,128 327 2,165
Total 498,885 525,655 29,890 31,495
An analysis of the Bank’s investment portfolio based on credit ratings provided by external rating agencies is as follows:
Credit quality of loan portfolio
The definition of internal risk rating for the loans and advances are given below:
AAA to AA- : Highest safetyA+ to A- : Adequate safetyBBB+ to BBB- : Moderate safetyBB and below : Inadequate safety/High risk
The Bank’s internal risk rating scale is a measure of relative credit worthiness and does not map exactly with that of external rating agencies.
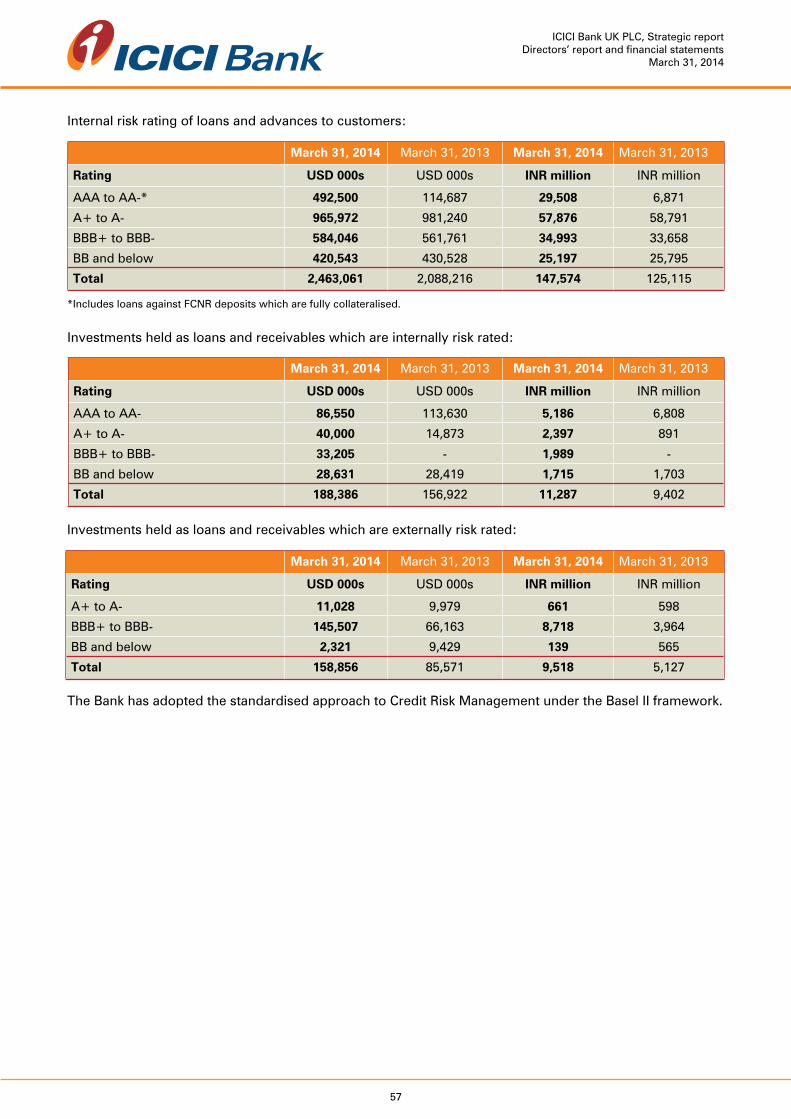
57
ICICI Bank UK PLC, Strategic reportDirectors’ report and financial statements
March 31, 2014
Internal risk rating of loans and advances to customers:
Investments held as loans and receivables which are internally risk rated:
Investments held as loans and receivables which are externally risk rated:
The Bank has adopted the standardised approach to Credit Risk Management under the Basel II framework.
March 31, 2014 March 31, 2013 March 31, 2014 March 31, 2013
Rating USD 000s USD 000s INR million INR million
AAA to AA-* 492,500 114,687 29,508 6,871
A+ to A- 965,972 981,240 57,876 58,791
BBB+ to BBB- 584,046 561,761 34,993 33,658
BB and below 420,543 430,528 25,197 25,795
Total 2,463,061 2,088,216 147,574 125,115
March 31, 2014 March 31, 2013 March 31, 2014 March 31, 2013
Rating USD 000s USD 000s INR million INR million
AAA to AA- 86,550 113,630 5,186 6,808
A+ to A- 40,000 14,873 2,397 891
BBB+ to BBB- 33,205 - 1,989 -
BB and below 28,631 28,419 1,715 1,703
Total 188,386 156,922 11,287 9,402
March 31, 2014 March 31, 2013 March 31, 2014 March 31, 2013
Rating USD 000s USD 000s INR million INR million
A+ to A- 11,028 9,979 661 598
BBB+ to BBB- 145,507 66,163 8,718 3,964
BB and below 2,321 9,429 139 565
Total 158,856 85,571 9,518 5,127
*Includes loans against FCNR deposits which are fully collateralised.
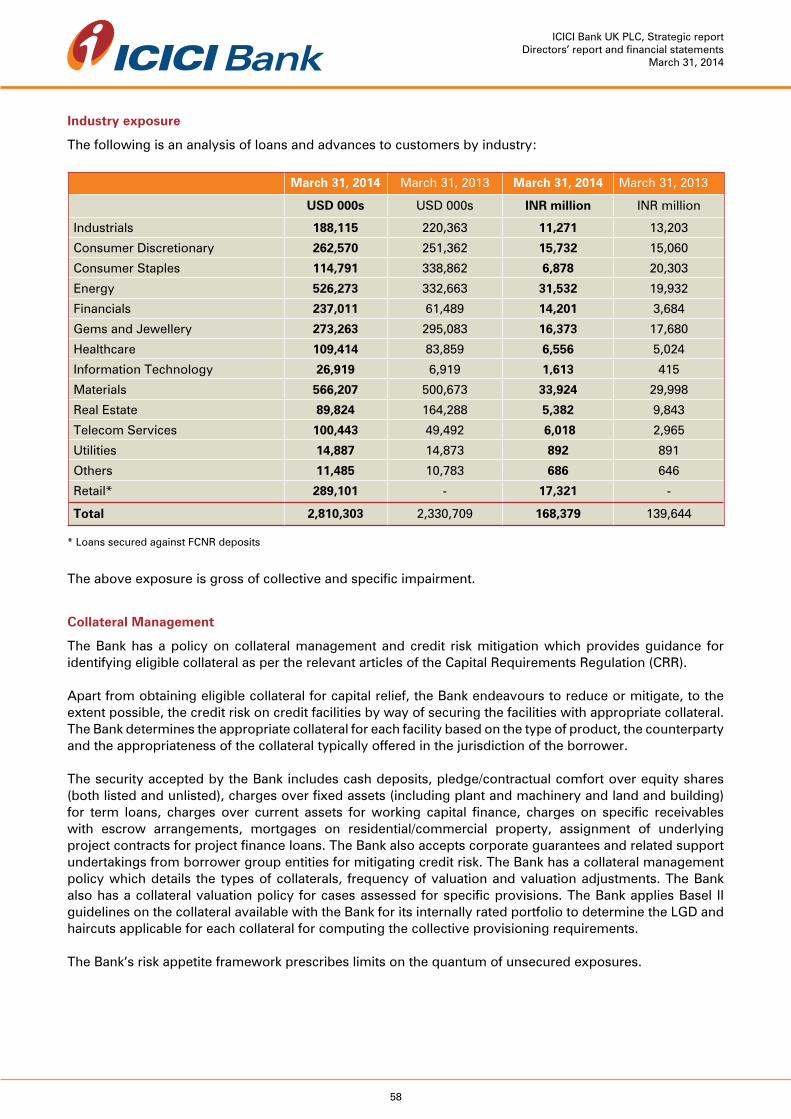
58
ICICI Bank UK PLC, Strategic reportDirectors’ report and financial statements
March 31, 2014
Industry exposure
The following is an analysis of loans and advances to customers by industry:
March 31, 2014 March 31, 2013 March 31, 2014 March 31, 2013
USD 000s USD 000s INR million INR million
Industrials 188,115 220,363 11,271 13,203
Consumer Discretionary 262,570 251,362 15,732 15,060
Consumer Staples 114,791 338,862 6,878 20,303
Energy 526,273 332,663 31,532 19,932
Financials 237,011 61,489 14,201 3,684
Gems and Jewellery 273,263 295,083 16,373 17,680
Healthcare 109,414 83,859 6,556 5,024
Information Technology 26,919 6,919 1,613 415
Materials 566,207 500,673 33,924 29,998
Real Estate 89,824 164,288 5,382 9,843
Telecom Services 100,443 49,492 6,018 2,965
Utilities 14,887 14,873 892 891
Others 11,485 10,783 686 646
Retail* 289,101 - 17,321 -
Total 2,810,303 2,330,709 168,379 139,644
* Loans secured against FCNR deposits
The above exposure is gross of collective and specific impairment.
Collateral Management
The Bank has a policy on collateral management and credit risk mitigation which provides guidance for identifying eligible collateral as per the relevant articles of the Capital Requirements Regulation (CRR).
Apart from obtaining eligible collateral for capital relief, the Bank endeavours to reduce or mitigate, to the extent possible, the credit risk on credit facilities by way of securing the facilities with appropriate collateral. The Bank determines the appropriate collateral for each facility based on the type of product, the counterparty and the appropriateness of the collateral typically offered in the jurisdiction of the borrower.
The security accepted by the Bank includes cash deposits, pledge/contractual comfort over equity shares (both listed and unlisted), charges over fixed assets (including plant and machinery and land and building) for term loans, charges over current assets for working capital finance, charges on specific receivables with escrow arrangements, mortgages on residential/commercial property, assignment of underlying project contracts for project finance loans. The Bank also accepts corporate guarantees and related support undertakings from borrower group entities for mitigating credit risk. The Bank has a collateral management policy which details the types of collaterals, frequency of valuation and valuation adjustments. The Bank also has a collateral valuation policy for cases assessed for specific provisions. The Bank applies Basel II guidelines on the collateral available with the Bank for its internally rated portfolio to determine the LGD and haircuts applicable for each collateral for computing the collective provisioning requirements.
The Bank’s risk appetite framework prescribes limits on the quantum of unsecured exposures.
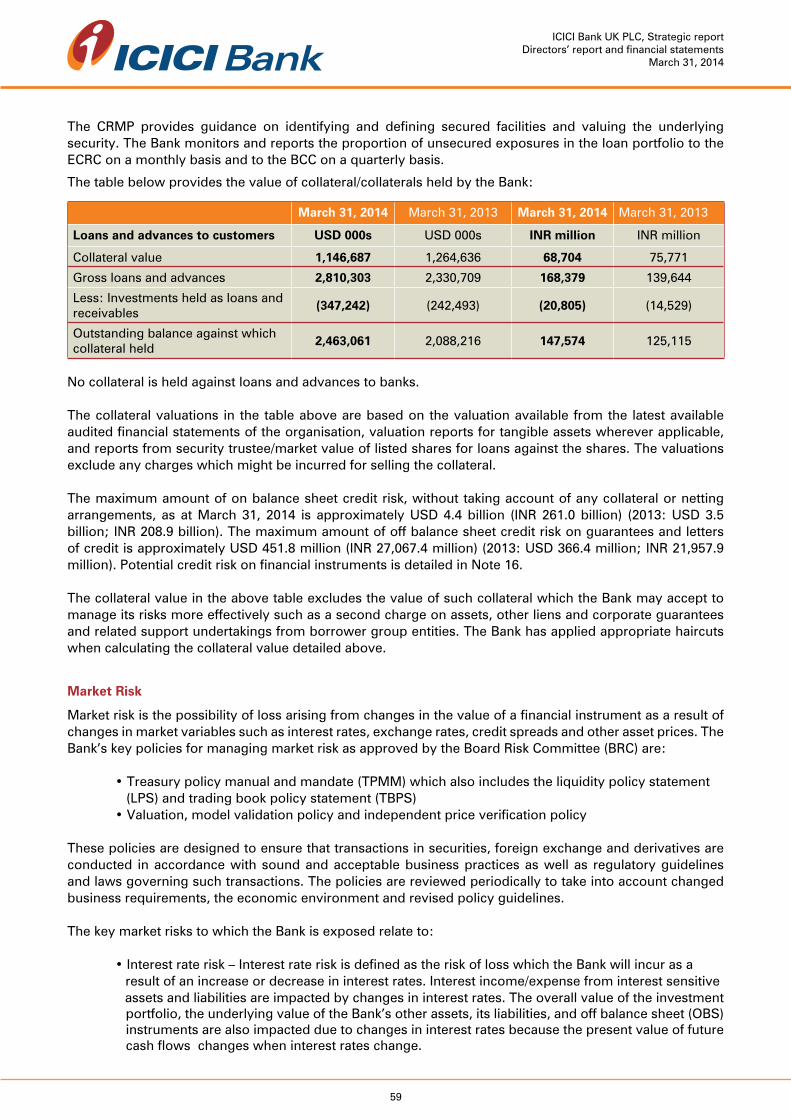
59
ICICI Bank UK PLC, Strategic reportDirectors’ report and financial statements
March 31, 2014
The CRMP provides guidance on identifying and defining secured facilities and valuing the underlying security. The Bank monitors and reports the proportion of unsecured exposures in the loan portfolio to the ECRC on a monthly basis and to the BCC on a quarterly basis.
The table below provides the value of collateral/collaterals held by the Bank:
March 31, 2014 March 31, 2013 March 31, 2014 March 31, 2013
Loans and advances to customers USD 000s USD 000s INR million INR million
Collateral value 1,146,687 1,264,636 68,704 75,771
Gross loans and advances 2,810,303 2,330,709 168,379 139,644
Less: Investments held as loans and receivables
(347,242) (242,493) (20,805) (14,529)
Outstanding balance against which collateral held
2,463,061 2,088,216 147,574 125,115
No collateral is held against loans and advances to banks.
The collateral valuations in the table above are based on the valuation available from the latest available audited financial statements of the organisation, valuation reports for tangible assets wherever applicable, and reports from security trustee/market value of listed shares for loans against the shares. The valuations exclude any charges which might be incurred for selling the collateral.
The maximum amount of on balance sheet credit risk, without taking account of any collateral or netting arrangements, as at March 31, 2014 is approximately USD 4.4 billion (INR 261.0 billion) (2013: USD 3.5 billion; INR 208.9 billion). The maximum amount of off balance sheet credit risk on guarantees and letters of credit is approximately USD 451.8 million (INR 27,067.4 million) (2013: USD 366.4 million; INR 21,957.9 million). Potential credit risk on financial instruments is detailed in Note 16.
The collateral value in the above table excludes the value of such collateral which the Bank may accept to manage its risks more effectively such as a second charge on assets, other liens and corporate guarantees and related support undertakings from borrower group entities. The Bank has applied appropriate haircuts when calculating the collateral value detailed above.
Market Risk
Market risk is the possibility of loss arising from changes in the value of a financial instrument as a result of changes in market variables such as interest rates, exchange rates, credit spreads and other asset prices. The Bank’s key policies for managing market risk as approved by the Board Risk Committee (BRC) are:
•Treasurypolicymanualandmandate(TPMM)whichalsoincludestheliquiditypolicystatement (LPS) and trading book policy statement (TBPS) •Valuation,modelvalidationpolicyandindependentpriceverificationpolicy
These policies are designed to ensure that transactions in securities, foreign exchange and derivatives are conducted in accordance with sound and acceptable business practices as well as regulatory guidelines and laws governing such transactions. The policies are reviewed periodically to take into account changed business requirements, the economic environment and revised policy guidelines.
The key market risks to which the Bank is exposed relate to:
•Interestraterisk–InterestrateriskisdefinedastheriskoflosswhichtheBankwillincurasa result of an increase or decrease in interest rates. Interest income/expense from interest sensitive assets and liabilities are impacted by changes in interest rates. The overall value of the investment portfolio, the underlying value of the Bank’s other assets, its liabilities, and off balance sheet (OBS)
instruments are also impacted due to changes in interest rates because the present value of future cash flows changes when interest rates change.
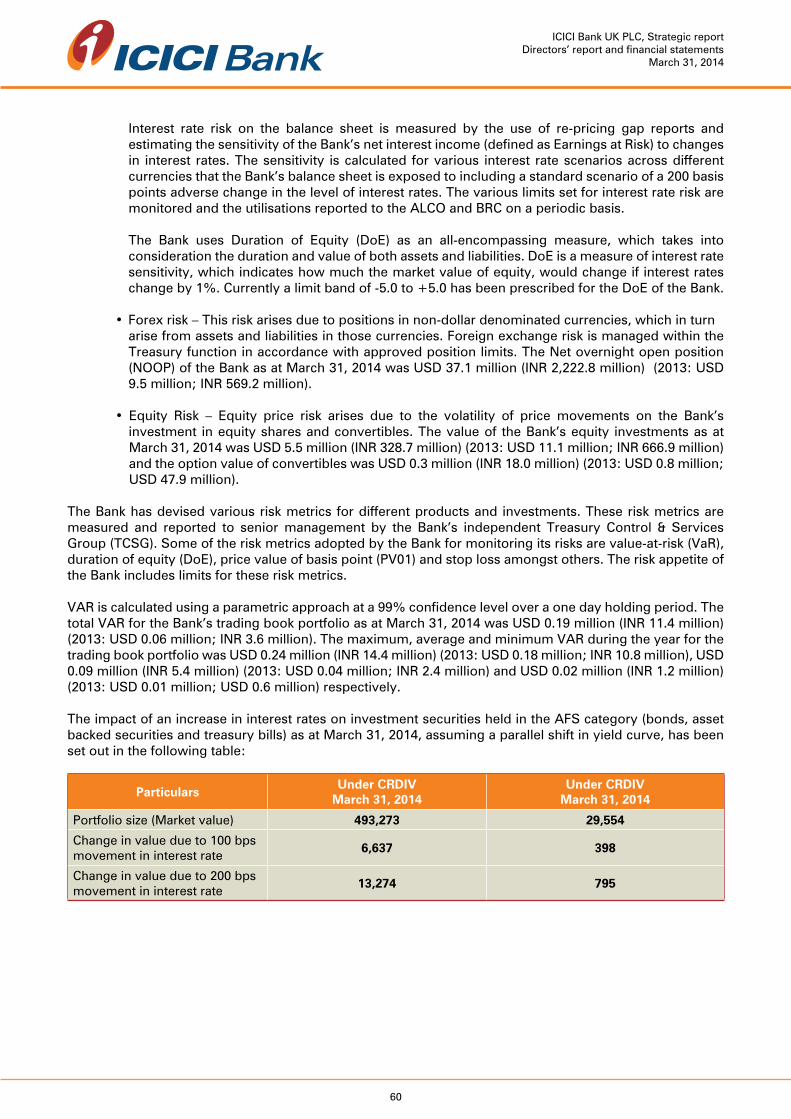
60
ICICI Bank UK PLC, Strategic reportDirectors’ report and financial statements
March 31, 2014
Interest rate risk on the balance sheet is measured by the use of re-pricing gap reports and estimating the sensitivity of the Bank’s net interest income (defined as Earnings at Risk) to changes in interest rates. The sensitivity is calculated for various interest rate scenarios across different currencies that the Bank’s balance sheet is exposed to including a standard scenario of a 200 basis points adverse change in the level of interest rates. The various limits set for interest rate risk are monitored and the utilisations reported to the ALCO and BRC on a periodic basis.
The Bank uses Duration of Equity (DoE) as an all-encompassing measure, which takes into consideration the duration and value of both assets and liabilities. DoE is a measure of interest rate sensitivity, which indicates how much the market value of equity, would change if interest rates change by 1%. Currently a limit band of -5.0 to +5.0 has been prescribed for the DoE of the Bank.
•Forexrisk–Thisriskarisesduetopositionsinnon-dollardenominatedcurrencies,whichinturnarise from assets and liabilities in those currencies. Foreign exchange risk is managed within the Treasury function in accordance with approved position limits. The Net overnight open position (NOOP) of the Bank as at March 31, 2014 was USD 37.1 million (INR 2,222.8 million) (2013: USD 9.5 million; INR 569.2 million).
• Equity Risk – Equity price risk arises due to the volatility of price movements on the Bank’s investment in equity shares and convertibles. The value of the Bank’s equity investments as at March 31, 2014 was USD 5.5 million (INR 328.7 million) (2013: USD 11.1 million; INR 666.9 million) and the option value of convertibles was USD 0.3 million (INR 18.0 million) (2013: USD 0.8 million; USD 47.9 million).
The Bank has devised various risk metrics for different products and investments. These risk metrics are measured and reported to senior management by the Bank’s independent Treasury Control & Services Group (TCSG). Some of the risk metrics adopted by the Bank for monitoring its risks are value-at-risk (VaR), duration of equity (DoE), price value of basis point (PV01) and stop loss amongst others. The risk appetite of the Bank includes limits for these risk metrics.
VAR is calculated using a parametric approach at a 99% confidence level over a one day holding period. The total VAR for the Bank’s trading book portfolio as at March 31, 2014 was USD 0.19 million (INR 11.4 million) (2013: USD 0.06 million; INR 3.6 million). The maximum, average and minimum VAR during the year for the trading book portfolio was USD 0.24 million (INR 14.4 million) (2013: USD 0.18 million; INR 10.8 million), USD 0.09 million (INR 5.4 million) (2013: USD 0.04 million; INR 2.4 million) and USD 0.02 million (INR 1.2 million) (2013: USD 0.01 million; USD 0.6 million) respectively.
The impact of an increase in interest rates on investment securities held in the AFS category (bonds, asset backed securities and treasury bills) as at March 31, 2014, assuming a parallel shift in yield curve, has been set out in the following table:
ParticularsUnder CRDIV
March 31, 2014Under CRDIV
March 31, 2014
Portfolio size (Market value) 493,273 29,554
Change in value due to 100 bps movement in interest rate
6,637 398
Change in value due to 200 bps movement in interest rate
13,274 795

61
ICICI Bank UK PLC, Strategic reportDirectors’ report and financial statements
March 31, 2014
The impact of an increase in interest rates on bonds and asset backed securities) as at March 31, 2013, assuming a parallel shift in yield curve, has been set out in the following table:
ParticularsUnder CRDIV
March 31, 2014Under CRDIV
March 31, 2014
Portfolio size (Market value) 474,725 28,443
Change in value due to 100 bps movement in interest rate
7,604 456
Change in value due to 200 bps movement in interest rate
15,208 911
Volatility in interest rates has an impact on an entity’s interest earnings. The impact of an increase in interest rates on the Bank’s net interest income as at March 31, 2014, assuming a parallel shift in the yield curve, has been set out in the following table:
Equivalent in USD Million Equivalent in INR Million
CurrencyImpact on Net Interest Income over
a one year horizonImpact on Net Interest Income over
a one year horizon
Increase in interest rates by 100 bps
Increase in interest rates by 200 bps
Increase in interest rates by 100 bps
Increase in interest rates by 200 bps
EUR 1.99 3.99 119 239
USD 5.02 10.04 301 602
GBP 2.44 4.88 146 292
Other currencies (0.02) (0.05) (1) (3)
Total 9.43 18.86 565 1,130
The impact of an increase in interest rates on the Bank’s net interest income as at March 31, 2013, assuming a parallel shift in the yield curve, has been set out in the following table:
Equivalent in USD Million Equivalent in INR Million
CurrencyImpact on Net Interest Income over
a one year horizonImpact on Net Interest Income over
a one year horizon
Increase in interest rates by 100 bps
Increase in interest rates by 200 bps
Increase in interest rates by 100 bps
Increase in interest rates by 200 bps
EUR 1.04 2.08 62 125
USD 5.86 11.71 351 702
GBP 1.87 3.73 112 223
Other currencies (0.86) (1.71) (52) (102)
Total 7.91 15.81 473 948
An increase in interest rates results in a positive impact on NII on account of positive re-pricing gaps on the balance sheet i.e. more assets re-price within a 1 year horizon than liabilities.
Liquidity risk
Liquidity risk arises due to insufficient available cash flows including the potential difficulty of resorting to the financial markets in order to meet payment obligations. The Bank differentiates liquidity risk between funding liquidity risk and market liquidity risk.

62
ICICI Bank UK PLC, Strategic reportDirectors’ report and financial statements
March 31, 2014
Funding liquidity risk is the risk that the Bank will not be able to efficiently meet cash flow requirements in a timely manner for its payment obligations including liability repayments, even under adverse conditions, and to fund all investment/lending opportunities, even under adverse conditions. Market liquidity refers to a Bank’s ability to execute its transactions and to close out its positions at a fair market price. This may become difficult in certain market conditions either because of the underlying product itself or because of the Bank’s own creditworthiness.
The Bank’s liquidity risk management philosophy is to be able, even under adverse conditions, to meet all liability repayments on time and to fund all investment opportunities by raising sufficient funds either by increasing liabilities or by converting assets into cash expeditiously and at reasonable cost.
The Bank maintains a diversified funding base comprising retail, corporate customer deposits and institutional balances. These deposits are augmented by wholesale deposits, borrowings and through issuance of bonds and subordinated debt from time to time. Loan maturities and sale of investments also provide liquidity. Further, the Bank holds unencumbered, high quality liquid assets to protect against stress conditions.
The Bank monitors and manages its overall liquidity risk appetite by ensuring that it maintains adequate liquid assets for projected stressed outflows under various scenarios and also ensures that its liquidity gap position is within the approved limit for the various time buckets. This framework is further augmented by defining risk limits for individual liquidity risk drivers. ALCO and BRC review these parameters on monthly and quarterly bases respectively.
The Bank mitigates the risk of a liquidity mismatch in excess of its risk appetite by managing the liquidity profile of the balance sheet through both short-term liquidity management and a long-term funding strategy. Short-term liquidity management is considered from two perspectives; firstly, business as usual and secondly, stressed conditions, both of which relate to funding in the less than one year time horizon. Longer term funding is used to manage the Bank’s strategic liquidity profile which is determined by the Bank’s balance sheet structure.
The Bank uses various tools for measurement of liquidity risk including the statement of structural liquidity (SSL), dynamic liquidity gap reports, liquidity ratios and stress testing through scenario analysis. The SSL is used as a standard tool for measuring and managing net funding requirements and for assessing the surplus or shortfall of funds in various maturity buckets in the future. The Bank also prepares dynamic liquidity gap reports, which in addition to scheduled cash flows, also consider the liquidity requirements pertaining to incremental business and the funding thereof.
As part of the stock and flow approach of monitoring liquidity, the Bank monitors certain liquidity ratios covering various liquidity risk drivers inter-alia short-term liquidity risk, structural mismatch risk, wholesale funding risk, off balance sheet risk and non-marketable assets risk. The Bank places particular emphasis on the withdrawable funding ratio and the customer advances to total assets ratio. The withdrawable funding ratio indicates the proportion of deposits that can be withdrawn by customers without providing notice to total funding resources. The ratio as at March 31, 2014 was 0.25 (0.17 as at March 31, 2013). The customer advances to total assets ratio provides a measure of the structural liquidity of the Bank’s asset portfolio. The ratio as at March 31, 2014 was 0.54 (0.56 as at March 31, 2013).
The Bank has implemented the PRA’s Individual Liquidity Adequacy Assessment (ILAA) framework. The ILAA summarises the level of liquidity required by the Bank to meet UK regulatory requirements and the liquidity commensurate with the risks identified in the Bank’s portfolio and strategic plans. The ILAA sets out the framework used to ensure that the Bank maintains sufficient liquidity at all times, including periods of stress. This has been done through the quantification of outflows and inflows associated with material risks identified using scenarios – themselves a combination of historic data, external events and seasoned judgment. Based on the scenarios defined in the ILAA framework, the Bank carries out stress testing of its liquidity position weekly and reports the results of the stress test to the ALCO and BRC & Board on a monthly and quarterly basis respectively.
63
ICICI Bank UK PLC, Strategic reportDirectors’ report and financial statements
March 31, 2014
The Bank also has a liquidity contingency plan (LCP) which details the overall approach and actions the Bank would undertake in order to manage the Bank’s liquidity position during stressed conditions. The LCP addresses both the funding and operational requirements of the Bank and sets-out a funding, operational and communication plan to enable the Bank to deal with a liquidity crisis. In summary, the Bank seeks to follow a conservative approach in its management of liquidity and has in place, a robust governance structure, policy framework and review mechanism to ensure availability of adequate liquidity even under stressed market conditions.
Refer to Note 34 for details on the cash flow payable under contractual maturity.
Operational Risk
Operational risk is the risk of loss resulting from inadequate or failed internal processes, people, and systems or from external events. ‘Compliance and legal’ risk which is defined as the risk that arises from a failure or inability to comply with the laws, regulations or voluntary codes applicable to the financial services industry and ‘conduct’ risk, which includes risks arising from unfair treatment and delivering inappropriate outcomes to its customers, are also considered within the ambit of operational risk.
The management of operational risk within the Bank is governed by the Operational Risk Management Policy (ORMP) which is reviewed and approved by the Board Risk Committee (BRC) on an annual basis. It covers the aspects pertaining to minimizing losses due to process failures including inadequate training to staff, flaws in product designs that can expose the Bank to losses due to fraud, impact of failures in technology/systems and continuity in the Bank’s operations. Operational risk elements covered in the ORMP include operational risk incident management including reporting, techniques for risk identification, assessment and measurement, monitoring through key risk indicators and risk mitigation techniques.
An Operational Risk Management Committee (ORMC) comprising of the senior management is responsible for the mitigation of operational risk including fraud risk within the Bank by the creation and maintenance of an explicit operational risk management process. The ORMC meets at least on a monthly basis to track and monitor the progress of the implementation of various elements of the ORMP. A report on the activities of the various ORMC meetings held is presented to the BRC on a semi-annual basis. The ORMC is additionally responsible for reviewing and monitoring the financial crime prevention performance of the Bank. It approves the Bank’s fraud governance framework and fraud compensation proposals and monitors the progress of reported fraudulent transactions. A report on fraud loss incidences is separately presented to the Board on a quarterly basis by the Fraud Crime Prevention Team.
The Bank has determined and articulated Operational Risk Appetite (ORA) which has been defined as the acceptable maximum level of Operational Risk (OR) that the Bank is willing to accept in pursuit of its business objectives and business plan, taking into account of its stakeholders as well as regulatory requirements. It has been expressed both in quantitative and qualitative terms. The Bank has expressed its ORA as a percentage of a financial parameter of the Bank i.e. operating income and operating expenses based on the average level of losses for the previous years and has also taken into account the existing controls and expected future developments/ initiatives. The Bank has also identified ORA at a business unit/Risk and Control Self Assessment (RCSA) entity level and at Bank wide key risk level thus using combination of both top down and bottom up approach.
In order to further strengthen and proactively monitor its compliance to the ‘Conduct Risk (CR)’, the Bank has also defined its ‘Conduct Risk Appetite (CRA)’ as per the guidelines issued by the regulator and has established both quantitative and qualitative measures of the Conduct Risk. The Bank has defined CRA as the maximum level of conduct risk that the Bank is willing to accept in pursuit of its business objectives. A conduct risk appetite framework balances the need of all stakeholders by acting as both a governor of risk and driver of current and future business strategy.

64
ICICI Bank UK PLC, Strategic reportDirectors’ report and financial statements
March 31, 2014
The objective of a Conduct Risk Appetite framework of the Bank is to identify key conduct risks faced by the Bank and the steps to be taken to mitigate these risks; articulate the governance mechanisms, systems and controls which are in place to mitigate these risks; and review the exposure of the Bank to conduct risks and assist the Board in ensuring that the risk appetite is not breached.
The Bank has established a Conduct Risk Policy which aims to deliver fair and appropriate outcomes as per the Bank’s Conduct Risk philosophy. It also articulates the responsibilities of various stakeholders, i.e. the Board, Senior Management and employees towards conduct risks. The Conduct Risk Appetite framework is reviewed at least on an annual basis, in line with the review of strategy of the Bank. The framework will be updated as per changes in the business strategy of the Bank and/or the changing external regulatory developments/expectations. The CRA has been carved out or is the subset of the ORA determined for the identified Bank wide risk categories/areas mapped to Retail Banking group risk entities. quantity and timing of management information, these were embedded during the course of the year.
The Operational Risk Management Group (ORMG) is responsible for coordinating all the operational risk related activities of the Bank including implementing tools for managing operational risk and maintenance of the ORMP.
The Bank has implemented its RCSA approach to identify and ensure effective control of its operational risks. The RCSAs are reviewed periodically as per BRC approved plan in consultation with the business groups and the results of the RCSA exercise are presented to BRC semi-annually. The Bank manages and monitors level of operational risks for the Bank as a whole and within the various business group by establishing Key Risk Indicators (KRIs) at Bank level and RCSA entity level respectively. Both the KRIs are monitored on a monthly basis and the results are presented to the ORMC on a quarterly basis. Additionally, the results of Bank level KRIs are presented to BRC on a quarterly basis. In order to further strengthen and enhance RCSA tool, the entities/groups also self test the effectiveness of the controls emanating from the RCSAs at least once in a year. The test is sample based and the results are shared with the BRC on a semi-annual basis.
The Bank has implemented a loss data collection, analysis and reporting process for all operational risk loss data (including internal and external fraud) and near miss events. The data is collected from all business and support units in the UK as well as those outsourced to India. Analysis of such data is reported to the ORMC and the BRC on a quarterly basis.
The Bank has adopted the Basic Indicator Approach for the purposes of calculating its operational risk capital charge as per Basel II. The Bank carries out an operational risk scenario analysis and stress testing exercise for assessing the adequacy of the operational risk capital charge. Various operational risk events based on existing and external loss data, risks identified in RCSAs and internal audit reports, have been assessed which are further used to create seven operational risk scenarios. Each of these scenarios is assessed for its probability and financial impact and compared with the operational risk capital charge. The detailed process is mentioned in “quantitative assessment of operational risk drivers” which is reviewed and the results shared with the ORMC and BRC on an annual basis.
To identify operational risks in new products/processes, all such proposals are required to be approved by the Product and Process Approval Committee (PAC), comprising of senior management after obtaining inputs from all the relevant groups and control functions in the Bank. The ORMG reviews the notes to ensure control, design and operating effectiveness and recommends a risk rating. The existing product/ process notes are also reviewed periodically based on the operational risk rating assigned to the note.
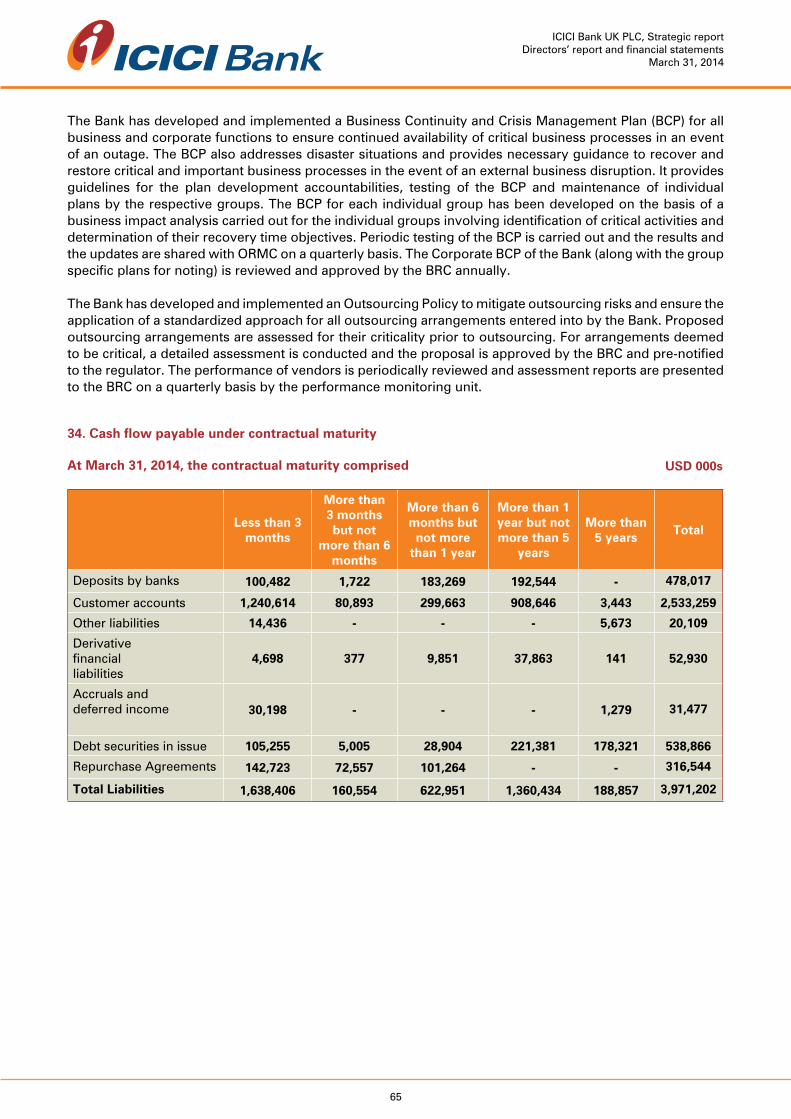
65
ICICI Bank UK PLC, Strategic reportDirectors’ report and financial statements
March 31, 2014
The Bank has developed and implemented a Business Continuity and Crisis Management Plan (BCP) for all business and corporate functions to ensure continued availability of critical business processes in an event of an outage. The BCP also addresses disaster situations and provides necessary guidance to recover and restore critical and important business processes in the event of an external business disruption. It provides guidelines for the plan development accountabilities, testing of the BCP and maintenance of individual plans by the respective groups. The BCP for each individual group has been developed on the basis of a business impact analysis carried out for the individual groups involving identification of critical activities and determination of their recovery time objectives. Periodic testing of the BCP is carried out and the results and the updates are shared with ORMC on a quarterly basis. The Corporate BCP of the Bank (along with the group specific plans for noting) is reviewed and approved by the BRC annually.
The Bank has developed and implemented an Outsourcing Policy to mitigate outsourcing risks and ensure the application of a standardized approach for all outsourcing arrangements entered into by the Bank. Proposed outsourcing arrangements are assessed for their criticality prior to outsourcing. For arrangements deemed to be critical, a detailed assessment is conducted and the proposal is approved by the BRC and pre-notified to the regulator. The performance of vendors is periodically reviewed and assessment reports are presented to the BRC on a quarterly basis by the performance monitoring unit.
Less than 3 months
More than 3 months but not
more than 6 months
More than 6 months but
not more than 1 year
More than 1 year but not more than 5
years
More than 5 years
Total
Deposits by banks 100,482 1,722 183,269 192,544 - 478,017
Customer accounts 1,240,614 80,893 299,663 908,646 3,443 2,533,259
Other liabilities 14,436 - - - 5,673 20,109
Derivativefinancialliabilities
4,698 377 9,851 37,863 141 52,930
Accruals and deferred income 30,198 - - - 1,279 31,477
Debt securities in issue 105,255 5,005 28,904 221,381 178,321 538,866
Repurchase Agreements 142,723 72,557 101,264 - - 316,544
Total Liabilities 1,638,406 160,554 622,951 1,360,434 188,857 3,971,202
USD 000s
34. Cash flow payable under contractual maturity
At March 31, 2014, the contractual maturity comprised

66
ICICI Bank UK PLC, Strategic reportDirectors’ report and financial statements
March 31, 2014
Less than 3 months
More than 3 months but not
more than 6 months
More than 6 months but
not more than 1 year
More than 1 year but not more than 5
years
More than 5 years
Total
Deposits by banks 6,020 103 10,981 11,536 - 28,640
Customer accounts 74,331 4,847 17,954 54,442 206 151,780
Other liabilities 865 - - - 340 1,205
Derivative financial liabilities 281 23 590 2,269 8 3,171
Accruals and deferred income
1,809 - - - 77 1,886
Debt securities in issue 6,306 300 1,732 13,264 10,684 32,286
Repurchase Agreements 8,550 4,347 6,067 - - 18,964
Total Liabilities 98,162 9,620 37,324 81,511 11,315 237,932
INR MillionAt March 31, 2014, the contractual maturity comprised
Less than 3 months
More than 3 months but not
more than 6 months
More than 6 months but not more
than 1 year
More than 1 year but not more than 5
years
More than 5 years
Total
Deposits by banks 38,958 40,567 84,140 130,306 - 293,971
Customer accounts 917,660 238,757 377,993 264,871 - 1,799,281
Other liabilities 36,865 - - - 6,910 43,775
Derivative financial liabilities 9,163 4,846 4,191 44,501 115 62,816
Accruals and deferred income
27,354 1,920 3,040 2,130 20 34,464
Debt securities in issue 7,140 62,140 49,202 273,194 292,395 684,071
Repurchase Agreements 112,457 56,744 38,759 - - 207,960
Total Liabilities 1,149,597 404,974 557,325 715,002 299,440 3,126,338
USD 000sAt March 31, 2013, the contractual maturity comprised

67
ICICI Bank UK PLC, Strategic reportDirectors’ report and financial statements
March 31, 2014
Less than 3 months
More than 3 months but not
more than 6 months
More than 6 months but not more
than 1 year
More than 1 year but not more than 5
years
More than 5 years
Total
Deposits by banks 2,334 2,431 5,041 7,807 - 17,613
Customer accounts 54,982 14,305 22,647 15,870 - 107,804
Other liabilities 2,209 - - - 414 2,623
Derivative financial liabilities 549 290 251 2,667 7 3,764
Accruals and deferred income
1,639 115 182 128 1 2,065
Debt securities in issue 428 3,723 2,948 16,368 17,519 40,986
Repurchase Agreements 6,737 3,400 2,322 - - 12,459
Total Liabilities 68,878 24,264 33,391 42,840 17,941 187,314
INR Million
The balances as noted above incorporate all cash flows on an undiscounted basis which relates to the principal and future coupon payments (except for trading liabilities and trading derivatives).
35. Fair values of financial assets and financial liabilities
Set out below is a comparison by category of book values and fair values of the Bank’s trading and non trading financial assets and financial liabilities as at the year end.
March 31, 2014 March 31, 2014 March 31, 2013 March 31, 2013
Fair value Book value Fair value Book value
Non trading book financial assets and liabilities
Assets:
Cash 648 648 565 565
Balances at central banks 1,008,407 1,008,407 583,227 583,227
Loans and advances to banks 79,076 79,079 78,675 78,657
Loans and advances to customers 2,738,396 2,749,136 2,310,793 2,282,972
Investment securities 498,885 498,885 510,750 510,854
Liabilities:
Deposits by banks and customer accounts
2,990,797 2,994,400 2,086,602 2,088,049
Debt securities in issue 435,650 426,643 545,130 528,070
Repurchase agreements 316,544 316,544 207,960 207,960
Financial assets and liabilities at fair value through profit and loss
Assets:
Derivative financial instruments 86,028 86,028 76,353 76,353
Credit linked notes - - 14,801 14,801
Liabilities:
Derivative financial instruments 59,265 59,265 81,927 81,927
USD 000s
At March 31, 2013, the contractual maturity comprised
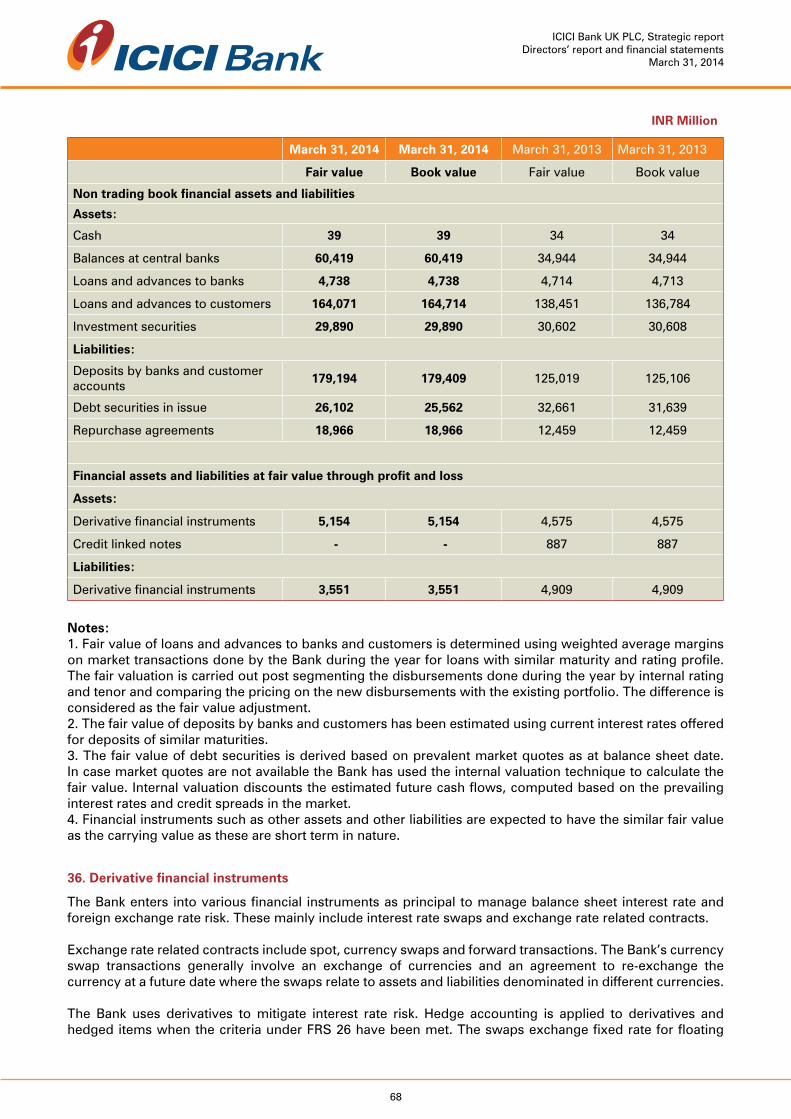
68
ICICI Bank UK PLC, Strategic reportDirectors’ report and financial statements
March 31, 2014
March 31, 2014 March 31, 2014 March 31, 2013 March 31, 2013
Fair value Book value Fair value Book value
Non trading book financial assets and liabilities
Assets:
Cash 39 39 34 34
Balances at central banks 60,419 60,419 34,944 34,944
Loans and advances to banks 4,738 4,738 4,714 4,713
Loans and advances to customers 164,071 164,714 138,451 136,784
Investment securities 29,890 29,890 30,602 30,608
Liabilities:
Deposits by banks and customer accounts
179,194 179,409 125,019 125,106
Debt securities in issue 26,102 25,562 32,661 31,639
Repurchase agreements 18,966 18,966 12,459 12,459
Financial assets and liabilities at fair value through profit and loss
Assets:
Derivative financial instruments 5,154 5,154 4,575 4,575
Credit linked notes - - 887 887
Liabilities:
Derivative financial instruments 3,551 3,551 4,909 4,909
INR Million
Notes:1. Fair value of loans and advances to banks and customers is determined using weighted average margins on market transactions done by the Bank during the year for loans with similar maturity and rating profile. The fair valuation is carried out post segmenting the disbursements done during the year by internal rating and tenor and comparing the pricing on the new disbursements with the existing portfolio. The difference is considered as the fair value adjustment.2. The fair value of deposits by banks and customers has been estimated using current interest rates offered for deposits of similar maturities. 3. The fair value of debt securities is derived based on prevalent market quotes as at balance sheet date. In case market quotes are not available the Bank has used the internal valuation technique to calculate the fair value. Internal valuation discounts the estimated future cash flows, computed based on the prevailing interest rates and credit spreads in the market.4. Financial instruments such as other assets and other liabilities are expected to have the similar fair value as the carrying value as these are short term in nature.
36. Derivative financial instruments
The Bank enters into various financial instruments as principal to manage balance sheet interest rate and foreign exchange rate risk. These mainly include interest rate swaps and exchange rate related contracts.
Exchange rate related contracts include spot, currency swaps and forward transactions. The Bank’s currency swap transactions generally involve an exchange of currencies and an agreement to re-exchange the currency at a future date where the swaps relate to assets and liabilities denominated in different currencies. The Bank uses derivatives to mitigate interest rate risk. Hedge accounting is applied to derivatives and hedged items when the criteria under FRS 26 have been met. The swaps exchange fixed rate for floating

69
ICICI Bank UK PLC, Strategic reportDirectors’ report and financial statements
March 31, 2014
rate on assets/liabilities to match the floating rates paid/received on funding or exchanges fixed rates on funding to match the floating rates received/paid on assets/liabilities. For qualifying hedges, the fair value changes of the derivative are substantially matched by corresponding fair value changes of the hedged item, both of which are recognised in profit and loss. As at March 31, 2014, the notional amounts of interest rate swaps and foreign exchange contract designated as fair value hedges were USD 1,491 million (INR 89,363 million) (2013: USD 834 million; INR 49,956 million) and these contracts had a positive fair value of USD 29.0 million (INR 1,737.5 million) (2013: positive fair value of USD 10.54 million; INR 631.5 million).
The notional principal amounts of these instruments are not indicative of the amounts at risk which are smaller amounts payable under the terms of these instruments and upon the basis of the contract or notional principal amount. Derivatives contracts in the non-trading book are used for hedging purposes only and are accounted for on this basis and are executed with bank counterparties for whom volume and settlement limits have been approved. Counterparty group limits are approved for connected exposures.
The methodologies for the valuation of derivative products are defined in the Valuation Policy of the Bank, which has been approved by the Board Risk Committee (BRC) of the Bank. The Bank uses swap rates, cross currency basis spreads and spot rates as inputs for the valuation of currency swaps and foreign exchange forward transactions. Further, the Bank uses swap rates and interest rate basis spreads as inputs for the valuation of interest rate swaps. Inputs are drawn from Reuters on a real time basis. While the currency wise cash flows for currency swaps and forward transactions are discounted with the appropriate swap rate for the respective currency and the applicable cross currency basis spread, cash flows for interest rate swaps are discounted with the appropriate zero rate for the currency. Further, the floating rate cash flows for currency swaps and forward transactions are calculated from the zero rates derived from the swap curve and the appropriate basis spread applicable for the currency. The floating rate cash flows for interest rate swaps are calculated from the zero rates derived from the swap curve and the appropriate interest rate basis applicable for the currency.
The Bank has computed the Credit Value Adjustment (CVA) and Debit Value Adjustment (DVA) for the derivative portfolio which amounted to USD 75K (INR 4,494K) and USD 71K (INR 4,254K) respectively. The CVA and DVA have been computed similar to Basel II collective provisioning using the MTM exposures; rating wise probability of defaults as published by S&P; and 45% loss given default as used in the Basel’s foundation IRB approach.
Instrument Non-tradingMore than 3 months but not more than 6
months
More than 6 months but not
more than 1 yearTotal
Foreign exchange contracts 572,346 2,063,033 54,588 32,678
Interest rate 919,147 1,015,481 31,890 20,252
Total 1,491,493 3,078,514 86,478 52,930
Instrument Non-tradingMore than 3 months but not more than 6
months
More than 6 months but not
more than 1 yearTotal
Foreign exchange contracts 34,292 123,607 3,271 1,958
Interest rate 55,071 60,843 1,911 1,213
Total 89,363 184,450 5,182 3,171
USD 000s
INR Million
Principal amounts of derivative financial instruments
As at March 31, 2014
As at March 31, 2014

70
ICICI Bank UK PLC, Strategic reportDirectors’ report and financial statements
March 31, 2014
Instrument Non-tradingMore than 3 months but not more than 6
months
More than 6 months but not
more than 1 yearTotal
Foreign exchange contracts 247,038 1,884,238 20,726 24,447
Interest rate 586,741 1,592,906 54,891 38,369
Total 833,779 3,477,144 75,617 62,816
Instrument Non-tradingMore than 3 months but not more than 6
months
More than 6 months but not
more than 1 yearTotal
Foreign exchange contracts 14,801 112,894 1,242 1,465
Interest rate 35,155 95,439 3,289 2,299
Total 49,956 208,333 4,531 3,764
USD 000s
INR Million
As at March 31, 2013
In addition of the above the Bank holds equity options relating to their Foreign Currency Convertible Bonds. As at March 31, 2014 these equity options had a gross positive fair value of USD 0.3 million (INR 18.0 million) (March 31, 2013 gross positive fair value of USD 0.8 million; INR 47.9 million). These options are valued based on valuation techniques with observable market inputs and are classified as level 2. The level 3 assets of the Bank mainly include certain interest swaps wherein the valuation is based on single counterparty quotes. Refer to note 19 for details of fair value leveling methodology. There were no transfers of derivative financial instruments between level 1, level 2 and level 3 during the year.
Principal amounts of derivative financial instruments
Instrument Foreign exchange contracts Interest rate
Gross Positive Fair Value
Gross Negative Fair Value
Gross Positive Fair Value
Gross Negative Fair Value
Level 1 96 153 - -
Level 2 54,491 32,525 31,890 20,252
Level 3
Total 54,587 32,678 31,890 20,252
Instrument Foreign exchange contracts Interest rate
Gross Positive Fair Value
Gross Negative Fair Value
Gross Positive Fair Value
Gross Negative Fair Value
Level 1 6 9 - -
Level 2 3,265 1,949 1,911 1,213
Level 3 - - - -
Total 3,271 1,958 1,911 1,213
USD 000s
INR Million
Derivative financial instruments by valuation method
As at March 31, 2014
As at March 31, 2014
As at March 31, 2013
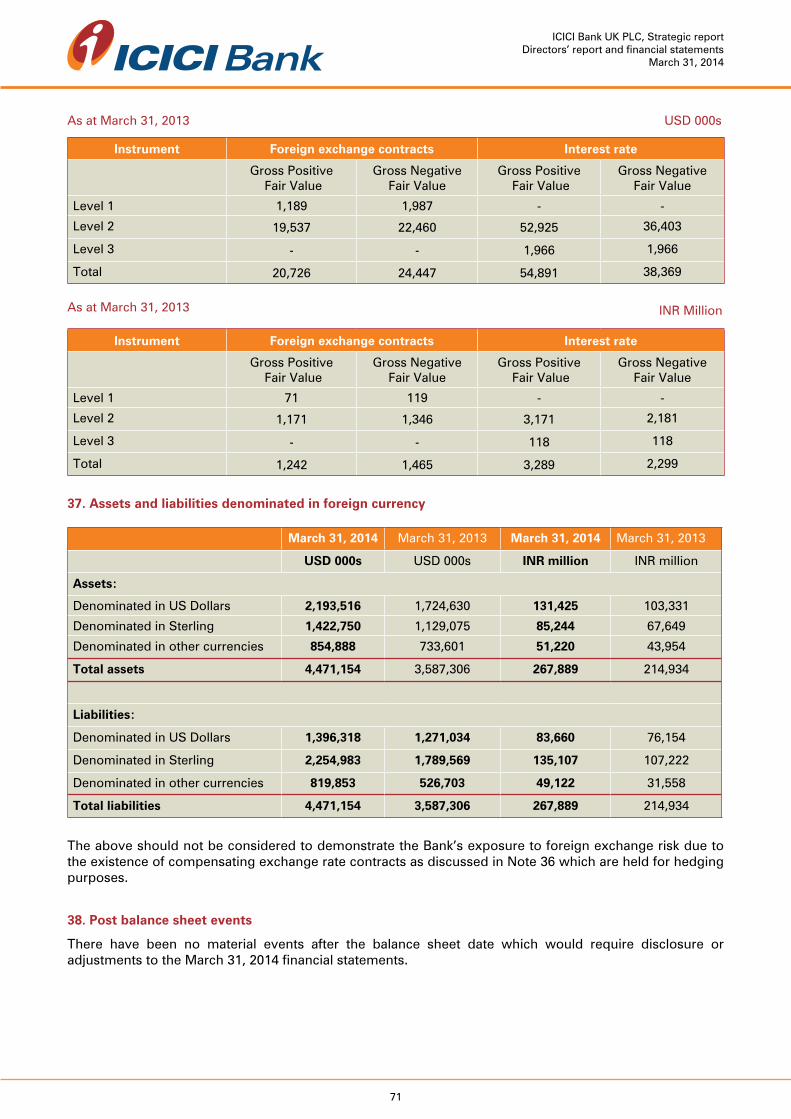
71
ICICI Bank UK PLC, Strategic reportDirectors’ report and financial statements
March 31, 2014
Instrument Foreign exchange contracts Interest rate
Gross Positive Fair Value
Gross Negative Fair Value
Gross Positive Fair Value
Gross Negative Fair Value
Level 1 1,189 1,987 - -
Level 2 19,537 22,460 52,925 36,403
Level 3 - - 1,966 1,966
Total 20,726 24,447 54,891 38,369
Instrument Foreign exchange contracts Interest rate
Gross Positive Fair Value
Gross Negative Fair Value
Gross Positive Fair Value
Gross Negative Fair Value
Level 1 71 119 - -
Level 2 1,171 1,346 3,171 2,181
Level 3 - - 118 118
Total 1,242 1,465 3,289 2,299
USD 000s
INR Million
As at March 31, 2013
As at March 31, 2013
37. Assets and liabilities denominated in foreign currency
March 31, 2014 March 31, 2013 March 31, 2014 March 31, 2013
USD 000s USD 000s INR million INR million
Assets:
Denominated in US Dollars 2,193,516 1,724,630 131,425 103,331
Denominated in Sterling 1,422,750 1,129,075 85,244 67,649
Denominated in other currencies 854,888 733,601 51,220 43,954
Total assets 4,471,154 3,587,306 267,889 214,934
Liabilities:
Denominated in US Dollars 1,396,318 1,271,034 83,660 76,154
Denominated in Sterling 2,254,983 1,789,569 135,107 107,222
Denominated in other currencies 819,853 526,703 49,122 31,558
Total liabilities 4,471,154 3,587,306 267,889 214,934
The above should not be considered to demonstrate the Bank’s exposure to foreign exchange risk due to the existence of compensating exchange rate contracts as discussed in Note 36 which are held for hedging purposes.
38. Post balance sheet events
There have been no material events after the balance sheet date which would require disclosure or adjustments to the March 31, 2014 financial statements.

72
ICICI Bank UK PLC, Strategic reportDirectors’ report and financial statements
March 31, 2014
39. Ultimate parent company and parent undertaking of larger group of which the Bank is a member
The Bank is a wholly owned subsidiary of ICICI Bank Limited. The parent company is incorporated in India. Copies of the group accounts for ICICI Bank Limited can be obtained from the Secretarial Department, ICICI Bank Limited, ICICI Bank Towers, Bandra-Kurla Complex, Mumbai 400051, India.