icom incorporate · icom incorporated annual report 2017 1 financial highlights icom incorporated...
TRANSCRIPT

YEAR ENDED MARCH 31, 2017
ICOM INCORPORATE

ICOM INCORPORATED ANNUAL REPORT 2017 1
Financial Highlights ICOM INCORPORATED AND SUBSIDIARIES Years ended March 31, 2017, 2016 and 2015
Millions of yen
Thousands of U.S. dollars
2017 2016 2015 2017 Net sales ¥ 24,092 ¥ 26,875 ¥ 26,399 $ 214,762 Operating income 732 2,368 2,501 6,525 Income before income taxes 724 2,349 2,992 6,454 Net income 474 1,660 2,115 4,225 Net income attributable to owners of parent 474 1,660 2,115 4,225 Total assets ¥ 58,324 ¥ 59,201 ¥ 58,660 $ 519,914 Amounts per share: Yen U.S. dollars
Net assets ¥ 3,625.42 ¥ 3,613.66 ¥ 3,637.17 $ 32.32 Net income – basic 31.98 112.03 142.72 0.29 Net income – diluted – – – – Cash dividends 20.00 36.00 35.00 0.18
Notes: 1. All dollar amounts herein refer to U.S. dollars translated from Japanese yen at ¥112.67 = U.S.$1.00, the exchange rate prevailing on March 31, 2017. 2. Amounts shown in millions of yen and thousands of dollars are rounded off to the nearest million or thousand.
Net Sales Operating Income (Millions of yen) (Millions of yen)
Profit attributable to owners of parent Total Assets (Millions of yen) (Millions of yen)
22,000
24,000
26,000
28,000
2015 2016 2017
26,39926,875
24,092
0
500
1,000
1,500
2,000
2,500
3,000
2015 2016 2017
2,501 2,368
732
0
500
1,000
1,500
2,000
2,500
2015 2016 2017
2,115
1,660
474
48,000
50,000
52,000
54,000
56,000
58,000
60,000
2015 2016 2017
58,660 59,20158,324

ICOM INCORPORATED ANNUAL REPORT 2017 2
Operating Highlights GEOGRAPHICAL SEGMENT INFORMATION Years ended March 31, 2017 and 2016 Millions of yen Thousands of U.S. dollars
Net sales Operating income (loss) Net sales
Operating income (loss)
2017 2016 2017 2016 2017 2017 Japan ¥ 20,776 ¥ 23,129 ¥ 500 ¥ 2,209 $ 185,203 $ 4,458 North America 7,325 8,879 (37) 10 65,296 (331) Europe 1,070 1,091 36 (5) 9,538 321 Asia & Oceania 1,272 1,310 31 (33) 11,339 276
Eliminations (6,351) (7,534) 202 187 (56,614) 1,801 Consolidated total ¥ 24,092 ¥ 26,875 ¥ 732 ¥ 2,368 $ 214,762 $ 6,525 Notes: 1. All dollar amounts herein refer to U.S. dollars translated from Japanese yen at ¥112.18 = U.S.$1.00, the exchange rate prevailing on March 31, 2017. 2. Amounts shown in millions of yen and thousands of dollars are rounded off to the nearest million or thousand.
Net Sales (Millions of yen)
Operating Income (Loss) (Millions of yen)
0
5,000
10,000
15,000
20,000
25,000
2016 2017
23,12920,776
8,8797,325
1,091 1,0701,310 1,272
Japan
North America
Europe
Asia & Oceania
(500)
0
500
1,000
1,500
2,000
2,500
3,000
2016 2017
2,209
500
10△ 37△ 5 36△ 33 31
Japan
North America
Europe
Asia & Oceania

ICOM INCORPORATED ANNUAL REPORT 2017 3
Operating Highlights OVERSEAS SALES Years ended March 31, 2017 and 2016 Millions of yen Thousands of U.S. dollars
2017 (Unaudited) 2016 2017 (Unaudited) North America ¥ 6,504 27.0% ¥ 8,130 30.2% $ 57,978 Europe 3,592 14.9 3,790 14.1 32,020 Asia & Oceania 5,345 22.2 5,266 19.6 47,647 Other 680 2.8 849 3.2 6,062
Overseas total 16,121 66.9 18,035 67.1 143,707 Domestic total 7,971 33.1 8,840 32.9 71,055
Consolidated total ¥ 24,092 100.0% ¥ 26,875 100.0% $ 214,762 Notes: 1. All dollar amounts herein refer to U.S. dollars translated from Japanese yen at ¥112.18 = U.S.$1.00, the exchange rate prevailing on March 31, 2017. 2. Amounts shown in millions of yen and thousands of dollars are rounded off to the nearest million or thousand.
Net Sales 2016
Net Sales 2017
Domestic Sales32.9%
North America30.2%
Europe14.1%
Asia & Oceania19.6%
Other3.2%
OverseasSales
Domestic Sales33.1%
North America27.0%
Europe14.9%
Asia & Oceania22.2%Other
2.8%
OverseasSales

ICOM INCORPORATED ANNUAL REPORT 2017 4
ICOM INCORPORATED AND SUBSIDIARIES
Consolidated Balance Sheet
March 31, 2017
Millions of yen
Thousands of U.S. dollars
(Note 1)
Assets 2017 2016 2017 Current assets:
Cash and deposits (Notes 3, 4 and 10) ¥ 31,091 ¥ 32,986 $ 277,153 Marketable securities (Notes 3, 4 and 5) 300 401 2,674 Notes and accounts receivable (Note 4) 4,686 5,144 41,772 Allowance for doubtful accounts (17) (28) (152)
4,669 5,116 41,620 Inventories (Note 6) 6,422 6,379 57,247 Deferred income taxes (Note 8) 331 512 2,951 Other current assets 1,766 1,436 15,743
Total current assets 44,579 46,830 397,388
Property, plant and equipment: Land 4,150 4,152 36,994 Buildings and structures 6,800 6,808 60,617 Machinery and equipment 12,693 12,577 113,149 Vehicles and other 202 204 1,801 Construction in progress 11 10 98
Property, plant and equipment, at cost 23,856 23,751 212,659 Less accumulated depreciation (16,377) (15,883) (145,989)
Property, plant and equipment, net (Note 14) 7,479 7,868 66,670
Investments and other assets:
Investments in securities (Notes 4 and 5) Investments in affiliates 96 85 856 Other 2,788 2,989 24,853
Other investments 2,713 792 24,184 Deferred income taxes (Note 8) 578 629 5,152 Intangible assets (Note 14) 146 63 1,301 Allowance for doubtful accounts (55) (55) (490)
Total investments and other assets 6,266 4,503 55,856
Total assets (Note 14) ¥ 58,324 ¥ 59,201 $ 519,914 See accompanying Notes to consolidated financial statements.

ICOM INCORPORATED ANNUAL REPORT 2017 5
ICOM INCORPORATED AND SUBSIDIARIES
Consolidated Balance Sheet March 31, 2017
Millions of yen
Thousands of U.S. dollars
(Note 1)
Liabilities and net assets 2017 2016 2017 Current liabilities:
Accounts payable - trade (Note 4) ¥ 1,154 ¥ 1,328 $ 10,287 Accounts payable - other 442 632 3,940 Accrued income taxes (Note 8) 26 217 232 Deferred income taxes (Note 8) – 1 – Accrued expenses 558 665 4,974 Accrued bonuses 396 458 3,530 Warranty reserves 48 48 428 Other current liabilities 122 123 1,088
Total current liabilities 2,746 3,472 24,479
Long-term liabilities: Deferred income taxes (Note 8) 21 140 187 Liability for retirement benefits (Note 7) 1,268 1,451 11,303 Other long-term liabilities 568 591 5,064
Total long-term liabilities 1,857 2,182 16,554
Net assets: Shareholders’ equity (Note 9):
Common stock: Authorized – 34,000,000 shares; Issued – 14,850,000 shares in 2017 and 2016 7,081 7,081 63,122
Capital surplus 10,449 10,449 93,145 Retained earnings (Note 16) 36,187 36,128 322,579 Less treasury stock, at cost:
32,190 shares in 2017 and 32,083 shares in 2016 (104) (104) (927) Total shareholders’ equity 53,613 53,554 477,919
Accumulated other comprehensive income (loss) (Note 12):
Net unrealized holding gain on securities (Note 5) 22 20 196 Translation adjustments 338 396 3,013 Retirement benefit liability adjustments (Note 7) (252) (423) (2,247)
Total accumulated other comprehensive income (loss) 108 (7) 962 Total net assets 53,721 53,547 478,881
Total liabilities and net assets ¥ 58,324 ¥ 59,201 $ 519,914 See accompanying Notes to consolidated financial statements.

ICOM INCORPORATED ANNUAL REPORT 2017 6
ICOM INCORPORATED AND SUBSIDIARIES
Consolidated Statement of Income Year ended March 31, 2017
Millions of yen
Thousands of U.S. dollars
(Note 1)
2017 2016 2017 Net sales (Note 14) ¥ 24,092 ¥ 26,875 $ 214,762 Cost of sales (Notes 6 and 14) 14,017 15,035 124,951
Gross profit 10,075 11,840 89,811 Selling, general and administrative expenses (Notes 11 and 14) 9,343 9,472 83,286
Operating income (Note 14) 732 2,368 6,525 Other income (expenses):
Interest and dividend income 96 182 856 Gain on sales of investment in securities, net (Note 5) 56 9 499 Foreign exchange loss, net (57) (77) (508) Gain on sales of property, plant and equipment 1 1 9 Sales discounts (146) (175) (1,301) Other, net 42 41 374
(8) (19) (71) Profit before income taxes 724 2,349 6,454
Income taxes (Note 8):
Current 212 590 1,890 Deferred 38 99 339
250 689 2,229 Profit ¥ 474 ¥ 1,660 $ 4,225 Profit attributable to owners of parent (Note 13) ¥ 474 ¥ 1,660 $ 4,225
See accompanying Notes to consolidated financial statements.

ICOM INCORPORATED ANNUAL REPORT 2017 7
ICOM INCORPORATED AND SUBSIDIARIES
Consolidated Statement of Comprehensive Income
Year ended March 31, 2017
Millions of yen
Thousands of U.S. dollars
(Note 1)
2017 2016 2017 Profit ¥ 474 ¥ 1,660 $ 4,225 Other comprehensive income (loss) (Note 12):
Net unrealized holding gain on securities 2 3 18 Translation adjustments (58) (507) (517) Retirement benefit liability adjustments 171 (941) 1,524 Total other comprehensive income (loss) 115 (1,445) 1,025
Comprehensive income ¥ 589 ¥ 215 $ 5,250 Total comprehensive income attributable to: Owners of parent ¥ 589 ¥ 215 $ 5,250 See accompanying Notes to consolidated financial statements.

ICOM INCORPORATED ANNUAL REPORT 2017 8
ICOM INCORPORATED AND SUBSIDIARIES
Consolidated Statement of Changes in Net Assets
Year ended March 31, 2017
Millions of yen
Number of
shares in
issue
Common
stock
Capital
surplus
Retained
earnings
Treasury
stock, at cost
Net
unrealized
holding
gain
on securities
Translation
adjustments
Retirement
benefit liability
adjustments
Total net
assets
Balance at April 1, 2015 14,850,000 ¥ 7,081 ¥ 10,449 ¥ 35,031 ¥ (103) ¥ 17 ¥ 903 ¥ 518 ¥ 53,896
Profit attributable to
owners of parent
for the year – – – 1,660 – – – – 1,660
Cash dividends – – – (563) – – – – (563)
Purchases of treasury
stock – – – – (1) – – – (1)
Other changes – – – – – 3 (507) (941) (1,445)
Balance at April 1, 2016 14,850,000 ¥ 7,081 ¥ 10,449 ¥ 36,128 ¥ (104) ¥ 20 ¥ 396 ¥ (423) ¥ 53,547
Profit attributable to
owners of parent
for the year – – – 474 – – – – 474
Cash dividends – – – (415) – – – – (415)
Purchases of treasury
stock – – – – (0) – – – (0)
Other changes – – – – – 2 (58) 171 115
Balance at March 31, 2017 14,850,000 ¥ 7,081 ¥ 10,449 ¥ 36,187 ¥ (104) ¥ 22 ¥ 338 ¥ (252) ¥ 53,721
Thousands of U.S. dollars (Note 1)
Common
stock
Capital
surplus
Retained
earnings
Treasury
stock, at cost
Net
unrealized
holding
gain
on securities
Translation
adjustments
Retirement
benefit liability
adjustments
Total net
assets
Balance at April 1, 2016 $ 63,122 $ 93,145 $ 322,054 $ (927) $ 178 $ 3,530 $ (3,771) $ 477,331
Profit attributable to
owners of parent
for the year – – 4,225 – – – – 4,225
Cash dividends – – (3,700) – – – – (3,700)
Purchases of treasury
stock – – – (0) – – – (0)
Other changes – – – – 18 (517) 1,524 1,025
Balance at March 31, 2017 $ 63,122 $ 93,145 $ 322,579 $ (927) $ 196 $ 3,013 $ (2,247) $ 478,881
See accompanying Notes to consolidated financial statements.

ICOM INCORPORATED ANNUAL REPORT 2017 9
ICOM INCORPORATED AND SUBSIDIARIES
Consolidated Statement of Cash Flows Year ended March 31, 2017
Millions of yen
Thousands of U.S. dollars
(Note 1)
2017 2016 2017 Operating activities:
Profit before income taxes ¥ 724 ¥ 2,349 $ 6,454 Adjustments for:
Depreciation and amortization 987 892 8,798 Interest and dividend income (96) (182) (856) Foreign exchange (gain) loss, net (59) 129 (526) Decrease (increase) in notes and accounts receivable 432 (674) 3,851 Increase in inventories (81) (10) (722) (Decrease) increase in accounts payable - trade (164) 250 (1,462) Other, net (2,173) (24) (19,370)
Subtotal (430) 2,730 (3,833) Income taxes paid (436) (923) (3,887) Net cash (used in) provided by operating activities (866) 1,807 (7,720)
Investing activities:
(Increase) decrease in time deposits with original maturities in excess of three months (1,276) 2,816 (11,375) Redemption of marketable securities 399 100 3,557 Purchases of property, plant and equipment (675) (680) (6,017) Purchases of intangible assets (58) (47) (517) Purchases of investments in securities (645) (1,330) (5,750) Proceeds from sales and redemption of investments in securities 598 121 5,331
Interest and dividend income received 110 181 981 Other, net (407) 1,823 (3,628) Net cash (used in) provided by investing activities (1,954) 2,984 (17,418)
Financing activities:
Purchases of treasury stock (0) (1) (0) Cash dividends paid (415) (563) (3,700) Net cash used in financing activities (415) (564) (3,700)
Effect of exchange rate changes on cash and cash equivalents 51 (242) 455
Net (decrease) increase in cash and cash equivalents (3,184) 3,985 (28,383) Cash and cash equivalents at beginning of year 32,195 28,210 286,994 Cash and cash equivalents at end of year (Note 3) ¥ 29,011 ¥ 32,195 $ 258,611
See accompanying Notes to consolidated financial statements.

ICOM INCORPORATED AND SUBSIDIARIES
Notes to Consolidated Financial Statements
ICOM INCORPORATED ANNUAL REPORT 2016 10
March 31, 2017 1. Basis of Preparation
The accompanying consolidated financial statements of ICOM INCORPORATED (the “Company”) and its subsidiaries are
prepared on the basis of accounting principles generally accepted in Japan, which are different in certain respects as to the application and disclosure requirements of International Financial Reporting Standards, and have been compiled from the consolidated financial statements prepared by the Company as required by the Financial Instruments and Exchange Act of Japan.
In preparing the accompanying consolidated financial statements, certain reclassifications have been made to the consolidated financial statements issued domestically for the convenience of readers outside Japan. Certain reclassifications of previously reported amounts have been made to conform the consolidated financial statements for the year ended March 31, 2016 to the 2017 presentation. Such reclassifications had no effect on consolidated net income or net assets.
In addition, the notes to the consolidated financial statements include certain information which is not required under accounting principles generally accepted in Japan but is presented herein as additional information.
The translation of yen amounts into U.S. dollar amounts is included solely for the convenience of readers outside Japan, as a matter of arithmetic computation only, and has been made at ¥112.18 = U.S.$1.00, the approximate rate of exchange in effect on March 31, 2017. This translation should not be construed as a representation that yen have been, could have been, or could in the future be, converted into U.S. dollars at the above or any other rate. 2. Summary of Significant Accounting Policies (a) Principles of consolidation
The accompanying consolidated financial statements include the accounts of the Company and the companies which it controls directly or indirectly. Two companies over which the Company exercises significant influence in terms of their operating and financial policies have been included in the accompanying consolidated financial statements on an equity basis.
All significant intercompany balances and transactions have been eliminated in consolidation. All material unrealized intercompany gains and losses among the Company and the subsidiaries have been entirely eliminated.
The financial statements of certain consolidated subsidiary whose fiscal year end is December 31 has been included in consolidation on the basis of a full fiscal year closing on March 31 for consolidation purposes.
(b) Cash and cash equivalents
For purposes of the consolidated statements of cash flows, cash and cash equivalents consist of cash on hand, deposits with banks withdrawable on demand, and short-term investments which are readily convertible to cash subject to an insignificant risk of any changes in their value and which were purchased with an original maturity of three months or less.
(c) Foreign currency translation
The balance sheet accounts of the overseas subsidiaries are translated into yen at the rates of exchange in effect at the balance sheet date except that the components of net assets are translated at their historical exchange rates. Adjustments resulting from translating accounts denominated in foreign currencies are not included in the determination of profit in the accompanying consolidated financial statements, but are reported as “Translation adjustments,” a component of net assets.
Revenue and expense accounts are translated at the average rates of exchange in effect during the year. All monetary assets and liabilities denominated in foreign currencies are translated into yen at the rates of exchange in effect
at the balance sheet date, except that receivables hedged by qualified forward foreign exchange contracts are translated at the corresponding contract rates. Gain or loss on each translation is credited or charged to income.
(d) Marketable securities and investments in securities
In general, securities are classified into three categories: trading securities, held-to-maturity debt securities or other securities. Trading securities, consisting of debt and marketable equity securities, are stated at fair value. Gain or loss, both realized and unrealized, are credited or charged to income. Held-to-maturity debt securities are stated at their amortized cost. Marketable securities classified as other securities are carried at fair value with any changes in unrealized holding gain or loss, net of the applicable income taxes, reported as a separate component of net assets. Non-marketable securities classified as other securities are carried at cost determined by the moving average method.
Securities held by the Company and its subsidiaries including investments in securities, which are not accounted for on an equity basis, are all classified as “other securities” and have been accounted for as outlined above.

ICOM INCORPORATED AND SUBSIDIARIES
Notes to Consolidated Financial Statements
ICOM INCORPORATED ANNUAL REPORT 2017 11
2. Summary of Significant Accounting Policies (continued) (e) Inventories
Inventories are mainly stated at the lower of cost or net selling value, cost being determined by the moving average method, except for goods held by certain overseas subsidiaries which are valued at the lower of cost or market, cost being determined by the moving average method.
(f) Property, plant and equipment (except for leased assets)
Property, plant and equipment are stated at cost. Depreciation of property, plant and equipment is computed principally by the declining-balance method over the estimated useful lives of the respective assets as prescribed in the Corporation Tax Law of Japan, except that the straight-line method is applied to buildings (other than structures attached to the buildings) acquired on or after April 1, 1998 and structures attached to buildings and other structures acquired on or after April 1, 2016. Small assets owned by the Company and its domestic subsidiaries, which are valued at ¥100 thousand or more and less than ¥200 thousand, are depreciated by the straight-line method over a three-year period.
(g) Intangible assets (except for leased assets)
Amortization of intangible assets is calculated by the straight-line method over the estimated useful lives of the respective assets as prescribed in the Corporation Tax Law of Japan. Expenditures related to the development of computer software intended for internal use are charged to income when incurred, except if it is anticipated that this software will contribute to the generation of income or to future cost savings. Such expenditures are capitalized as assets and amortized by the straight-line method over an estimated useful life of 3 or 5 years. Small assets owned by the Company and its domestic subsidiaries, which are valued at ¥100 thousand or more and less than ¥200 thousand, are amortized by the straight-line method over a three-year period.
(h) Leased assets
Leased assets are depreciated by the straight-line method over respective lease periods with no residual value.
(i) Allowance for doubtful accounts
The allowance for doubtful accounts is computed based on the historical ratio of bad debts and an estimate of certain uncollectible amounts determined after an analysis of specific individual receivables.
(j) Accrued bonuses
Accrued bonuses are calculated based on the estimated amount to be paid to employees after the balance sheet date, which are
attributable to the current fiscal year. (k) Warranty reserves
Warranty reserves for certain overseas subsidiaries are provided for anticipated future repair costs based on the historical ratio calculated using product repair costs against net sales, which are attributable to the current fiscal year.
(l) Liability for retirement benefits
Liability for retirement benefits is provided mainly at an amount calculated based on the retirement benefit obligation less the fair value of the pension plan assets. The retirement benefit obligation is attributed to each period by the straight-line method over the estimated remaining years of service of the eligible employees.
Actuarial gain or loss is being amortized in the year following the year in which the gain or loss is recognized by the straight-line method over ten years, which is within the average remaining years of service of eligible employees.
ICOM INCORPORATED AND SUBSIDIARIES
Notes to Consolidated Financial Statements
ICOM INCORPORATED ANNUAL REPORT 2017 12
2. Summary of Significant Accounting Policies (continued) (m) Hedge accounting
The Company utilizes derivative transactions in order to manage the risks arising from adverse fluctuation in foreign currency exchange rates. In accordance with internal management rules, the Company enters into forward foreign exchange contracts which fall within the Company’s foreign currency or foreign currency receivables holding limits. Derivative transactions are not entered into for speculative purposes.
Under the accounting standard for financial instruments, gain or loss on derivatives designated as hedging instruments is deferred until the loss or gain on the underlying hedged items is recognized. Forward foreign exchange contracts which meet certain conditions are accounted for by a method under which the foreign currency deposits and receivables are translated at their corresponding forward foreign exchange contract rates (“Allocation method.”)
The evaluation of effectiveness of such forward foreign exchange contracts is omitted because significant terms of the hedging instruments and underlying hedged items are the same and the Company assumes that movements in cash flows are completely offset.
(n) Distribution of retained earnings
Under the Companies Act of Japan and the Company’s Articles of Incorporation, the distribution of retained earnings with respect to a given fiscal year end is made by resolution of the shareholders at a general meeting held subsequent to the close of the financial period. The distribution of retained earnings with respect to interim financial periods is made by resolution of the Board of Directors. (Please refer to Note 16.)
(Changes in Accounting Policies)
Application of Practical Solution on a Change in Depreciation Method Due to Tax Reform 2016
In line with the revised Corporation Tax Act of Japan the Company adopted the “Practical Solution on a Change in
Depreciation Method Due to Tax Reform 2016” (Accounting Standards Board of Japan (“ASBJ”) Practical Issues Task Force (“PITF”) No.32 issued on June 17, 2016) and changed the depreciation method for structures attached to buildings and other structures acquired on or after April 1, 2016 from the declining-balance method to the straight-line method.
This change had no impact on the consolidated financial statements.
(Additional Information) Application of Implementation Guidance on Recoverability of Deferred Tax Assets
Effective from the fiscal year ended March 31, 2017, the Company and its domestic subsidiaries adopted “Implementation
Guidance on Recoverability of Deferred Tax Assets” (ASBJ Guidance No.26, issued on March 28, 2016.)

ICOM INCORPORATED AND SUBSIDIARIES
Notes to Consolidated Financial Statements
ICOM INCORPORATED ANNUAL REPORT 2017 13
3. Cash and Cash Equivalents
In the preparation of the consolidated statements of cash flows, the relationship between the items included in cash and cash equivalents and the corresponding amounts reflected in the consolidated balance sheets at March 31, 2017 and 2016 is summarized as follows:
Millions of yen Thousands of
U.S. dollars
2017 2016 2017 Cash and deposits ¥ 31,091 ¥ 32,986 $ 277,153 Marketable securities 300 401 2,674 Subtotal ¥ 31,391 ¥ 33,387 $ 279,827 Time deposits with original maturities in excess of three months
(2,080)
(791)
(18,542)
Marketable securities with original maturities in excess of three months
(300)
(401)
(2,674)
Cash and cash equivalents ¥ 29,011 ¥ 32,195 $ 258,611
4. Financial Instruments (1) General information
i) Policy for financial instruments
In consideration of plans for capital investment, which is mainly centered on radio manufacturing and sales, the Group obtains necessary financing through its own funds. The Group manages surplus funds through financial assets that have high levels of liquidity. The Group uses derivatives for the purpose of reducing risk and does not enter into derivatives for speculative or trading purposes.
ii) Types of financial instruments and related risk
Notes and accounts receivable are exposed to credit risk in relation to customers. In addition, the Group is exposed to foreign currency exchange rate fluctuation risk arising from trade receivables denominated in foreign currencies. Marketable securities and investments in securities are exposed to market risk. Those securities are composed of mainly
corporate bonds in other securities and the shares of common stock of other companies with which it has business relationships. Fair values of those securities are periodically reviewed and reported to board of directors meetings. Most of Trade accounts payable have payment due dates within two months. The Group is exposed to foreign currency
exchange rate fluctuation risk arising from those denominated in foreign currencies. Regarding derivatives, the Group enters into forward foreign exchange contracts to reduce the foreign currency exchange
rate fluctuation risk arising from cash and deposits and receivables denominated in foreign currencies, and utilizes compound financial instruments for the purpose of efficient management of surplus funds. Further information regarding the method of hedge accounting, hedging instruments and hedged items, hedging policy, and the assessment of the effectiveness of hedging activities can be found in “(m) Hedge accounting” in Note 2 “Summary of Significant Accounting Policies”.

ICOM INCORPORATED AND SUBSIDIARIES
Notes to Consolidated Financial Statements
ICOM INCORPORATED ANNUAL REPORT 2017 14
4. Financial Instruments (continued) (1) General information (continued)
iii) Risk management for financial instruments
(a) Monitoring of credit risk (the risk that customers or counterparties may default) In accordance with the internal policies for managing credit risk of the Group arising from trade receivables, the credit
department monitors credit worthiness of main customers periodically, in principle, and monitors due dates and outstanding balances by customer. In addition, the Group is making efforts to identify and mitigate risks of bad debt from customers who have financial difficulties. In accordance with the internal policies for security management, the Group only acquires corporate bonds or other
securities with high credit ratings. Accordingly, the Group believes that the credit risk deriving from such debt securities is insignificant. The Group also believes that the credit risk of derivatives is insignificant as the Group enters into derivative
transactions only with financial institutions with high credit ratings. (b) Monitoring of market risks (the risks arising from fluctuations in foreign exchange rates, interest rates and others)
For cash and deposits denominated in foreign currencies, in principle, for a portion of receivables denominated in foreign currencies, the Group identifies the foreign currency exchange risk by each currency and enters into forward foreign exchange contracts to hedge such risk. For marketable securities and investments in securities, the Group periodically reviews the fair values of such financial
instruments and the financial position of the issuers. In addition, the Group continuously evaluates whether securities should be maintained taking into account their fair values and the relationships with the issuers. For derivative transactions, the accounting department of the Company enters into and manages transactions, and a
representative director, in advance, approves them within the limits reported at the Board of Directors meeting. Results of derivative transactions are reported at the monthly Board of Directors meetings. The consolidated subsidiaries do not enter into derivative transactions.
(c) Monitoring of liquidity risk (the risk that the Group may not be able to meet its obligations on the scheduled due dates) Based on reports from each division, the accounting department of the Company prepares and updates its cash flow
plans on a timely basis and maintains liquidity of assets for payment to manage liquidity risk. The consolidated subsidiaries monitor liquidity risk in the same manner.
iv) Supplementary explanation of the estimated fair value of financial instruments
The fair value of financial instruments is based on their quoted market price, if available. When there is no quoted market price available, fair value is reasonably estimated. Since various assumptions and factors are reflected in estimating the fair value, different assumptions and factors could result in different fair values.

ICOM INCORPORATED AND SUBSIDIARIES
Notes to Consolidated Financial Statements
ICOM INCORPORATED ANNUAL REPORT 2017 15
4. Financial Instruments (continued) (2) Estimated fair value of financial instruments
The carrying value, fair value and unrealized gain (loss) of the financial instruments on the consolidated balance sheets at March 31, 2017 and 2016 are shown in the following table. The following table does not include financial instruments for which it is extremely difficult to determine the fair value. (Please refer to Note ii below).
Millions of yen
2017 2016
Carrying value
Fair value Unrealized gain (loss)
Carrying
value Fair value
Unrealized gain (loss)
Assets (1) Cash and deposits ¥ 31,091 ¥ 31,091 ¥ – ¥ 32,986 ¥ 32,986 ¥ – (2) Notes and accounts
receivable
4,686 4,686
–
5,144 5,144
– (3) Marketable securities and
investments in securities
2,926 2,926 –
3,227 3,227 – Total assets ¥ 38,703 ¥ 38,703 ¥ – ¥ 41,357 ¥ 41,357 ¥ –
Liabilities (1) Accounts payable - trade ¥ 1,154 ¥ 1,154 ¥ – ¥ 1,328 ¥ 1,328 ¥ –
Total liabilities ¥ 1,154 ¥ 1,154 ¥ – ¥ 1,328 ¥ 1,328 ¥ –
Thousands of U.S. dollars
2017 Carrying
value Fair value
Unrealized gain (loss)
Assets (1) Cash and deposits $ 277,153 $ 277,153 $ – (2) Notes and accounts
receivable
41,772 41,772
– (3) Marketable securities and
investments in securities
26,083 26,083 – Total assets $ 345,008 $ 345,008 $ –
Liabilities (1) Accounts payable - trade $ 10,287 $ 10,287 $ –
Total liabilities $ 10,287 $ 10,287 $ –

ICOM INCORPORATED AND SUBSIDIARIES
Notes to Consolidated Financial Statements
ICOM INCORPORATED ANNUAL REPORT 2017 16
4. Financial Instruments (continued) (2) Estimated fair value of financial instruments (continued)
Notes: i) Methods to determine the fair value of financial instruments are as follows:
Assets (1) Cash and deposits, and (2) Notes and accounts receivable
Since these items are settled in a short period of time, their carrying value approximate the fair value.
(3) Marketable securities and investments in securities The fair value of equity securities is based on quoted market prices. The fair value of debt securities is based on either quoted market prices or the prices provided by the financial institutions making markets for these securities. For information on securities classified by holding purpose, please refer to Note 5.
Liabilities (1) Accounts payable - trade
Since this item is settled in a short period of time, its carrying value approximates the fair value.
ii) Financial instruments for which it is extremely difficult to determine the fair value are as follows:
Millions of yen Thousands of
U.S. dollars
2017 2016 2017 Unlisted equity securities ¥ 258 ¥ 248 $ 2,300
Since there is no market price for unlisted equity securities and it is difficult to determine the fair value, they are not
included in above “(3) Marketable securities and investments in securities” and in the preceding table “(2) Estimated fair value of financial instruments.”
ICOM INCORPORATED AND SUBSIDIARIES
Notes to Consolidated Financial Statements
ICOM INCORPORATED ANNUAL REPORT 2017 17
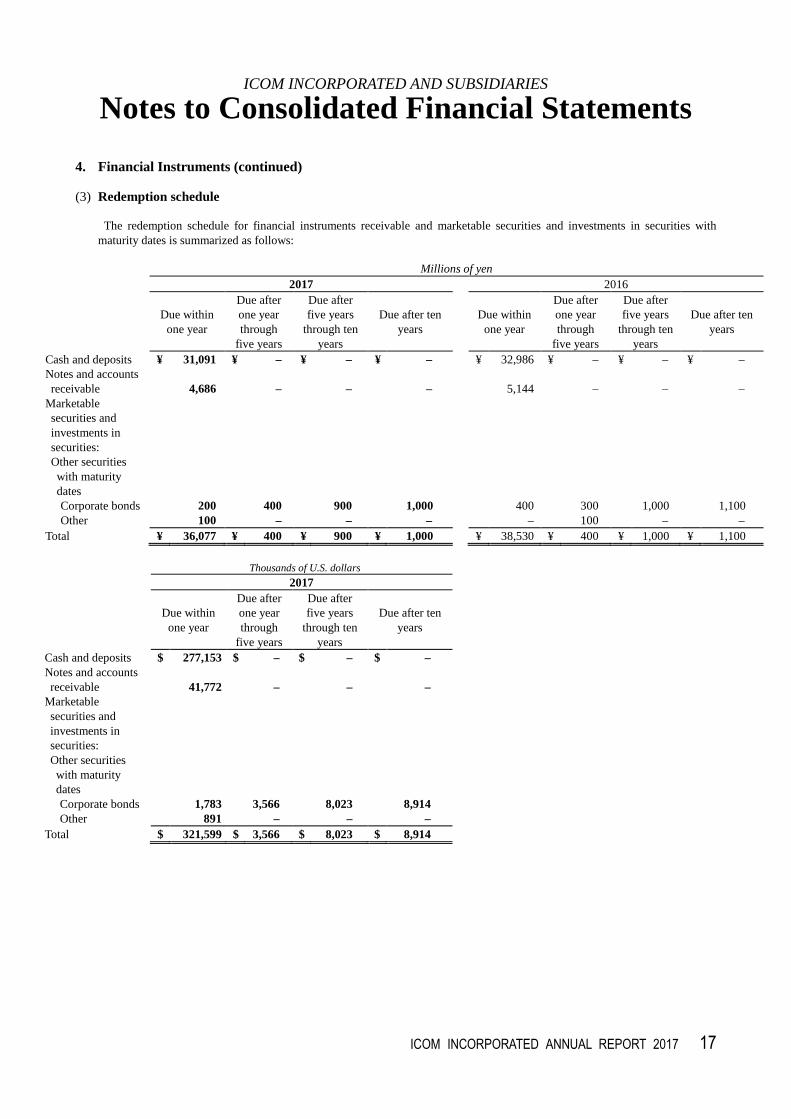
4. Financial Instruments (continued) (3) Redemption schedule
The redemption schedule for financial instruments receivable and marketable securities and investments in securities with maturity dates is summarized as follows:
Millions of yen 2017 2016
Due within one year
Due after one year through
five years
Due after five years
through ten years
Due after ten years
Due within one year
Due after one year through
five years
Due after five years
through ten years
Due after ten years
Cash and deposits ¥ 31,091 ¥ – ¥ – ¥ – ¥ 32,986 ¥ – ¥ – ¥ – Notes and accounts receivable
4,686 – – –
5,144 – – –
Marketable securities and investments in securities:
Other securities with maturity dates
Corporate bonds 200 400 900 1,000 400 300 1,000 1,100 Other 100 – – – – 100 – –
Total ¥ 36,077 ¥ 400 ¥ 900 ¥ 1,000 ¥ 38,530 ¥ 400 ¥ 1,000 ¥ 1,100
Thousands of U.S. dollars
2017
Due within one year
Due after one year through
five years
Due after five years
through ten years
Due after ten years
Cash and deposits $ 277,153 $ – $ – $ – Notes and accounts receivable
41,772 – – –
Marketable securities and investments in securities:
Other securities with maturity dates
Corporate bonds 1,783 3,566 8,023 8,914 Other 891 – – –
Total $ 321,599 $ 3,566 $ 8,023 $ 8,914

ICOM INCORPORATED AND SUBSIDIARIES
Notes to Consolidated Financial Statements
ICOM INCORPORATED ANNUAL REPORT 2017 18
5. Marketable Securities and Investments in Securities
Marketable securities and investments in securities classified as other securities at March 31, 2017 and 2016 are summarized as follows:
Millions of yen
2017 2016
Carrying value
Acquisition cost
Unrealized gain (loss)
Carrying
value Acquisition
cost Unrealized gain (loss)
Securities whose carrying value exceeds their acquisition cost:
Equity securities ¥ 170 ¥ 136 ¥ 34 ¥ 37 ¥ 11 ¥ 26 Corporate bonds 1,892 1,851 41 2,824 2,755 69
Subtotal 2,062 1,987 75 2,861 2,766 95 Securities whose carrying value does not exceed their acquisition cost:
Equity securities 147 182 (35) 257 319 (62) Corporate bonds 717 721 (4) 109 111 (2)
Subtotal 864 903 (39) 366 430 (64) Total ¥ 2,926 ¥ 2,890 ¥ 36 ¥ 3,227 ¥ 3,196 ¥ 31
Thousands of U.S. dollars
2017 Carrying
value Acquisition
cost Unrealized gain (loss)
Securities whose carrying value exceeds their acquisition cost: Equity securities $ 1,515 $ 1,212 $ 303 Corporate bonds 16,866 16,500 366
Subtotal 18,381 17,712 669 Securities whose carrying value does not exceed their acquisition cost: Equity securities 1,310 1,622 (312) Corporate bonds 6,392 6,427 (35)
Subtotal 7,702 8,049 (347) Total $ 26,083 $ 25,761 $ 322
Since there is no market price for unlisted equity securities and it is difficult to determine the fair value, unlisted equity securities of
¥258 million ($2,300 thousand) and ¥248 million at March 31, 2017 and 2016, respectively, are not included in the above table. Sales of other securities for the years ended March 31, 2017 and 2016 are summarized as follows:
Millions of yen Thousands of
U.S. dollars
2017 2016 2017 Sales ¥ 98 ¥ 19 $ 874 Aggregate gain 56 9 499

ICOM INCORPORATED AND SUBSIDIARIES
Notes to Consolidated Financial Statements
ICOM INCORPORATED ANNUAL REPORT 2017 19
6. Inventories
Inventories at March 31, 2017 and 2016 consisted of the following:
Millions of yen Thousands of
U.S. dollars
2017 2016 2017 Merchandise and finished products ¥ 3,107 ¥ 3,366 $ 27,697 Work in process 67 213 597 Raw materials and supplies 3,248 2,800 28,953 Total ¥ 6,422 ¥ 6,379 $ 57,247
Cost of sales included loss on devaluation of inventories of ¥50 million ($446 thousand) and ¥106 million for the years ended
March 31, 2017 and 2016, respectively. 7. Retirement Benefits Plans
(1) Outline of retirement benefits for employees
The Company and its domestic subsidiaries have employees’ defined benefit pension plans, i.e., corporate pension plans and lump-sum payment plans. The Company and its domestic subsidiaries pay additional retirement benefits to employees under certain circumstances. Certain consolidated subsidiaries calculate the liability for retirement benefits based on the simplified method. Under the
simplified method retirement benefit obligation has been calculated based on the amount which would be payable at the year end if all eligible employees terminated their services voluntarily.
(2) Liability for retirement benefits for the years ended March 31, 2017 and 2016
i) The changes in retirement benefit obligation are outlined as follows (except for retirement benefit obligation calculated by simplified method):
Millions of yen Thousands of
U.S. dollars
2017 2016 2017 Retirement benefit obligation at beginning of year ¥ 5,327 ¥ 4,045 $ 47,486 Service cost 222 166 1,979 Interest cost 44 81 392 Actuarial loss 77 1,088 686 Retirement benefits paid (87) (53) (775) Retirement benefit obligation at end of year ¥ 5,583 ¥ 5,327 $ 49,768
ii) The changes in plan assets at fair value are outlined as follows (except for retirement benefit obligation calculated by
simplified method):
Millions of yen Thousands of
U.S. dollars
2017 2016 2017 Plan assets at fair value at beginning of year ¥ 4,208 ¥ 4,156 $ 37,511 Expected return on plan assets 74 83 660 Actuarial gain (loss) 184 (280) 1,640 Contributions by the employer 308 302 2,745 Retirement benefits paid (87) (53) (775) Plan assets at fair value at end of year ¥ 4,687 ¥ 4,208 $ 41,781

ICOM INCORPORATED AND SUBSIDIARIES
Notes to Consolidated Financial Statements
ICOM INCORPORATED ANNUAL REPORT 2017 20
7. Retirement Benefits Plans (continued) (2) Liability for retirement benefits for the years ended March 31, 2017 and 2016 (continued)
iii) The changes in retirement benefits obligation calculated by simplified method are outlined as follows:
Millions of yen Thousands of
U.S. dollars
2017 2016 2017 Retirement benefit obligation at beginning of year ¥ 332 ¥ 291 $ 2,959 Retirement benefits expenses 49 46 437 Retirement benefits paid (9) (5) (80) Retirement benefit obligation at end of year ¥ 372 ¥ 332 $ 3,316
iv) The balance of retirement benefit obligation and plan assets at fair value, liabilities and assets recognized in the
consolidated balance sheets are outlined as follows:
Millions of yen Thousands of
U.S. dollars
2017 2016 2017 Funded retirement benefit obligation ¥ 5,583 ¥ 5,327 $ 49,768 Plan assets at fair value (4,687) (4,208) (41,781) 896 1,119 7,987 Unfunded retirement benefit obligation 372 332 3,316 Net amount of liabilities and assets recognized in consolidated balance sheets 1,268 1,451 11,303
Liability for retirement benefits 1,268 1,451 11,303 Net amount of liabilities and assets recognized in consolidated balance sheets ¥ 1,268 ¥ 1,451 $ 11,303
v) The components of retirement benefit expenses for the years ended March 31, 2017 and 2016 are outlined as follows:
Millions of yen Thousands of
U.S. dollars
2017 2016 2017 Service cost ¥ 271 ¥ 212 $ 2,416 Interest cost 44 81 392 Expected return on plan assets (74) (83) (660) Amortization:
Actuarial loss (gain) 139 (6) 1,239 Retirement benefit expenses ¥ 380 ¥ 204 $ 3,387

ICOM INCORPORATED AND SUBSIDIARIES
Notes to Consolidated Financial Statements
ICOM INCORPORATED ANNUAL REPORT 2017 21
7. Retirement Benefits Plans (continued) (2) Liability for retirement benefits for the years ended March 31, 2017 and 2016 (continued)
vi) The component of retirement benefit liability adjustments included in other comprehensive income (loss) before tax effects are outlined as follows:
Millions of yen Thousands of
U.S. dollars
2017 2016 2017 Actuarial gain (loss) ¥ 246 ¥ (1,374) $ 2,193 ¥ 246 ¥ (1,374) $ 2,193
vii) The balance of retirement benefit liability adjustments recognized in accumulated other comprehensive income (loss) before tax effects is outlined as follows:
Millions of yen Thousands of
U.S. dollars
2017 2016 2017 Unrecognized actuarial loss ¥ (363) ¥ (609) $ (3,236) Total ¥ (363) ¥ (609) $ (3,236)
viii) The plan assets by major category consist of the following:
2017 2016
Bonds 52.0% 52.0% Equities 47.0% 46.0% Cash and deposits 1.0% 2.0%
Total 100.0% 100.0%
The expected long-term rate of return on plan assets is has been estimated based on the consideration of both the portfolio
allocation to each class at present and in the future and long-term expected rate of return from plan assets held in each category at present and in the future.
ix) The assumptions used in accounting for the defined benefit pension plans for the years ended March 31, 2017 and
2016 are as follows:
2017 2016
Discount rates 0.8% 0.8% Expected long-term rates of return on plan assets 1.8% 2.0% Expected rate of compensation increases 1.6% 1.6%
ICOM INCORPORATED AND SUBSIDIARIES
Notes to Consolidated Financial Statements
ICOM INCORPORATED ANNUAL REPORT 2017 22
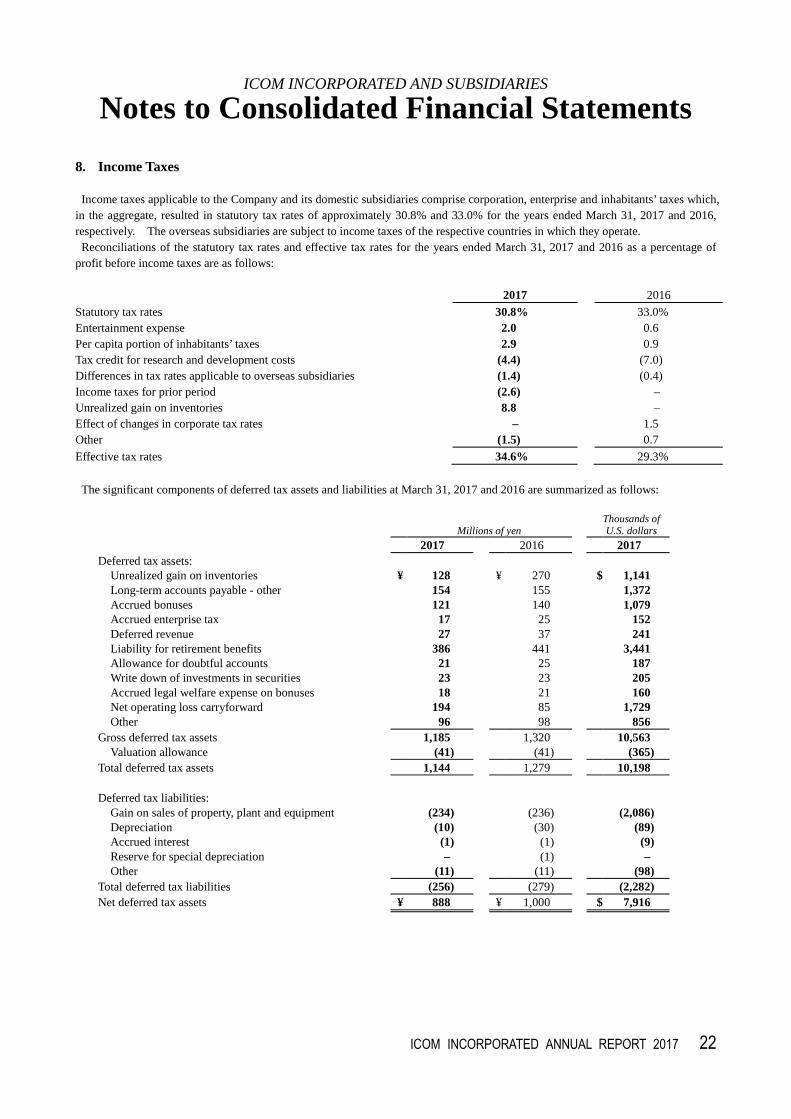
8. Income Taxes
Income taxes applicable to the Company and its domestic subsidiaries comprise corporation, enterprise and inhabitants’ taxes which, in the aggregate, resulted in statutory tax rates of approximately 30.8% and 33.0% for the years ended March 31, 2017 and 2016, respectively. The overseas subsidiaries are subject to income taxes of the respective countries in which they operate. Reconciliations of the statutory tax rates and effective tax rates for the years ended March 31, 2017 and 2016 as a percentage of
profit before income taxes are as follows:
2017 2016
Statutory tax rates 30.8% 33.0% Entertainment expense 2.0 0.6 Per capita portion of inhabitants’ taxes 2.9 0.9 Tax credit for research and development costs (4.4) (7.0) Differences in tax rates applicable to overseas subsidiaries (1.4) (0.4) Income taxes for prior period (2.6) – Unrealized gain on inventories 8.8 – Effect of changes in corporate tax rates – 1.5 Other (1.5) 0.7
Effective tax rates 34.6% 29.3%
The significant components of deferred tax assets and liabilities at March 31, 2017 and 2016 are summarized as follows:
Millions of yen
Thousands of U.S. dollars
2017 2016 2017 Deferred tax assets:
Unrealized gain on inventories ¥ 128 ¥ 270 $ 1,141 Long-term accounts payable - other 154 155 1,372 Accrued bonuses 121 140 1,079 Accrued enterprise tax 17 25 152 Deferred revenue 27 37 241 Liability for retirement benefits 386 441 3,441 Allowance for doubtful accounts 21 25 187 Write down of investments in securities 23 23 205 Accrued legal welfare expense on bonuses 18 21 160 Net operating loss carryforward 194 85 1,729 Other 96 98 856
Gross deferred tax assets 1,185 1,320 10,563 Valuation allowance (41) (41) (365)
Total deferred tax assets 1,144 1,279 10,198
Deferred tax liabilities: Gain on sales of property, plant and equipment (234) (236) (2,086) Depreciation (10) (30) (89) Accrued interest (1) (1) (9) Reserve for special depreciation – (1) – Other (11) (11) (98)
Total deferred tax liabilities (256) (279) (2,282) Net deferred tax assets ¥ 888 ¥ 1,000 $ 7,916

ICOM INCORPORATED AND SUBSIDIARIES
Notes to Consolidated Financial Statements
ICOM INCORPORATED ANNUAL REPORT 2017 23
9. Shareholders’ Equity The Companies Act (the “Act”) provides that an amount equal to 10% of the amount to be disbursed as distributions of capital
surplus (other than the capital reserve) and retained earnings (other than the legal reserve) be transferred to the capital reserve and the legal reserve, respectively, until the sum of the capital reserve and the legal reserve equals 25% of the capital stock account. Such distributions can be made at any time by resolution of the shareholders, or by the Board of Directors if certain conditions are met. The Company’s legal reserve included in retained earnings at March 31, 2017 and 2016 amounted to ¥293 million ($2,612
thousand). In addition, upon the issuance and sale of new shares of capital stock, the entire amount of the proceeds is required to be accounted
for as capital stock, although a company may, by resolution of the Board of Directors, account for an amount not exceeding one-half of the proceeds of the sale of new shares as additional paid-in capital included in capital surplus. Movements in treasury stock for the years ended March 31, 2017 and 2016 are summarized as follows:
Number of shares
2017 April 1, 2016 Increase Decrease March 31, 2017
Shares issued: Common stock 14,850,000 – – 14,850,000
Treasury stock: Common stock 32,083 107 – 32,190
Number of shares
2016
April 1, 2015 Increase Decrease March 31, 2016
Shares issued: Common stock 14,850,000 – – 14,850,000
Treasury stock: Common stock 31,783 300 – 32,083
The increases in treasury stock were due to purchases of shares of less than one voting unit.

ICOM INCORPORATED AND SUBSIDIARIES
Notes to Consolidated Financial Statements
ICOM INCORPORATED ANNUAL REPORT 2017 24
10. Derivatives and Hedging Activities The estimated fair value of the derivatives positions outstanding which qualify for hedge accounting at March 31, 2017 is
summarized as follows: Currency-related transactions
Millions of yen Thousands of U.S. dollars
2017 2017
Method of hedge
accounting Transaction Major
hedged item Notional amount
More than one year Fair value
Notional amount
More than one year Fair value
Allocation method for forward foreign exchange contracts
Forward foreign exchange contracts
Sell: Foreign currency deposits
EUR
¥ 993 ¥ – ¥ –
$8,852 $---- $----
Total ¥ 993 ¥ – ¥ – $8,852 $---- $----
There were no derivatives positions outstanding which qualify for hedge accounting at March 31, 2016.
The forward foreign exchange contracts that qualify for the allocation method and the underlying foreign currency deposits are accounted for as a unit. Therefore, the fair value of the forward foreign exchange contracts is included in cash and deposits. 11. Research and Development Costs Research and development costs included in selling, general and administrative expenses for the years ended March 31, 2017 and
2016 are as follows:
Millions of yen
Thousands of U.S. dollars
2017 2016 2017 Research and development costs ¥ 3,277 ¥ 3,144 $ 29,212
ICOM INCORPORATED AND SUBSIDIARIES
Notes to Consolidated Financial Statements
ICOM INCORPORATED ANNUAL REPORT 2017 25
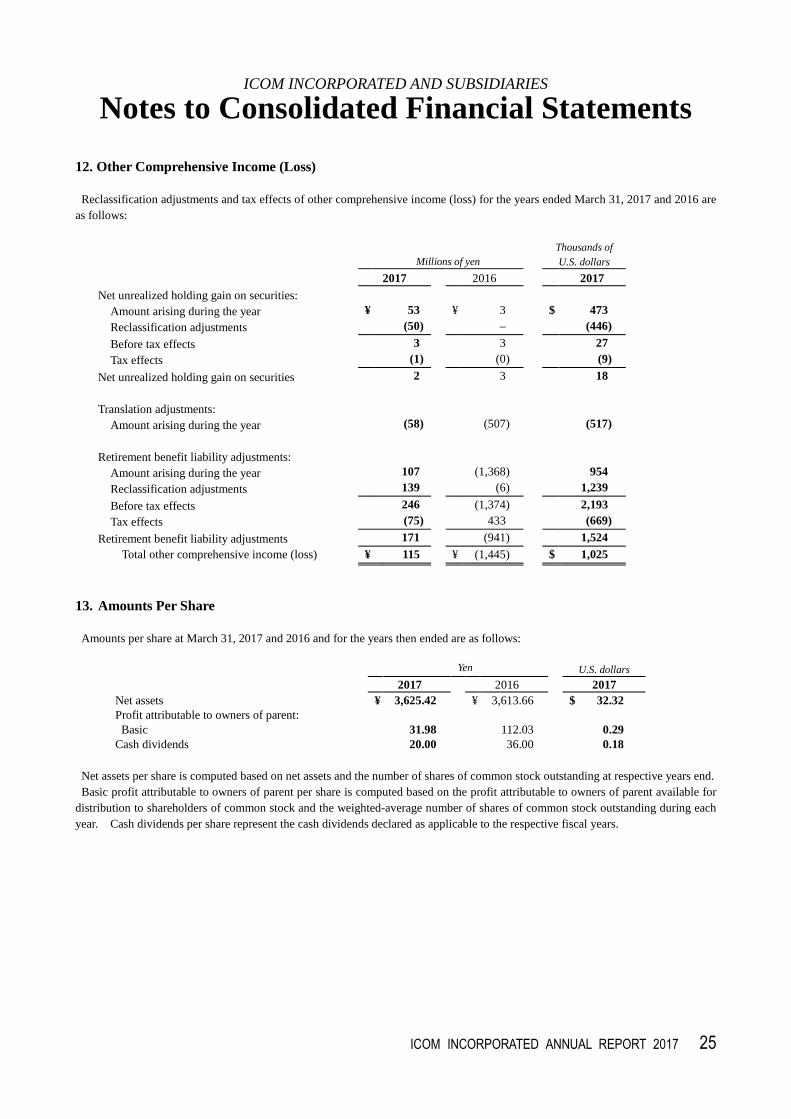
12. Other Comprehensive Income (Loss) Reclassification adjustments and tax effects of other comprehensive income (loss) for the years ended March 31, 2017 and 2016 are
as follows:
Millions of yen
Thousands of U.S. dollars
2017 2016 2017 Net unrealized holding gain on securities:
Amount arising during the year ¥ 53 ¥ 3 $ 473 Reclassification adjustments (50) – (446)
Before tax effects 3 3 27 Tax effects (1) (0) (9)
Net unrealized holding gain on securities 2 3 18
Translation adjustments:
Amount arising during the year (58) (507) (517)
Retirement benefit liability adjustments:
Amount arising during the year 107 (1,368) 954
Reclassification adjustments 139 (6) 1,239
Before tax effects 246 (1,374) 2,193 Tax effects (75) 433 (669)
Retirement benefit liability adjustments 171 (941) 1,524 Total other comprehensive income (loss) ¥ 115 ¥ (1,445) $ 1,025
13. Amounts Per Share
Amounts per share at March 31, 2017 and 2016 and for the years then ended are as follows:
Yen U.S. dollars
2017 2016 2017 Net assets ¥ 3,625.42 ¥ 3,613.66 $ 32.32 Profit attributable to owners of parent: Basic 31.98 112.03 0.29 Cash dividends 20.00 36.00 0.18
Net assets per share is computed based on net assets and the number of shares of common stock outstanding at respective years end. Basic profit attributable to owners of parent per share is computed based on the profit attributable to owners of parent available for
distribution to shareholders of common stock and the weighted-average number of shares of common stock outstanding during each year. Cash dividends per share represent the cash dividends declared as applicable to the respective fiscal years.

ICOM INCORPORATED AND SUBSIDIARIES
Notes to Consolidated Financial Statements
ICOM INCORPORATED ANNUAL REPORT 2017 26
14. Segment Information
i) Outline of segment information
The Company’s reporting segments are divisions of the Company for which separate financial information is available, and whose operating results are reviewed regularly by the board of directors meeting of the Company (the highest management decision making body) in order to allocate management resources and assess performance of operations. The Company and its subsidiaries are primarily engaged in the manufacture and sale of telecommunications equipment.
The subsidiaries are independent business units and formulate comprehensive strategies for products and operate business geographically. Therefore, the group consists of four segments based on sales by region. The four segments are “Japan,” “North America,”
which primarily includes the United States and Canada; “Europe,” which primarily includes Germany and Spain; and “Asia & Oceania,” which primarily includes Australia, Taiwan and China.
ii) Calculation methods used for sales, income or loss, assets and other items on each reporting segment
The accounting policies of the segments are substantially the same as those described in the significant accounting policies in Note 2. Segment performance is evaluated based on operating income or loss. Intersegment sales are recorded at the same prices applied in transactions with third parties. Change in Depreciation Method The Company adopted “Practical Solution on a Change in Depreciation Method Due to Tax Reform 2016” (PITF No.32
issued on June 17, 2016) in accordance with the revision of the Corporation Tax Law of Japan, and changed the method of accounting for depreciation of structures attached to buildings and other structures acquired on or after April 1, 2016 from the declining-balance method to the straight-line method. This change had no impact on the consolidated financial statements.
iii) Information as to sales, income or loss, assets and other items on each reporting segment
Information by reporting segment for the years ended March 31, 2017 and 2016 are as follows:
Millions of yen
2017
Japan North
America Europe
Asia & Oceania
Subtotal Eliminations Consolidated
I. Net sales and operating income (loss)
Sales to third parties ¥ 14,780 ¥ 7,319 ¥ 1,070 ¥ 923 ¥ 24,092 ¥ – ¥ 24,092 Intersegment sales 5,996 6 – 349 6,351 (6,351) –
Net sales 20,776 7,325 1,070 1,272 30,443 (6,351) 24,092 Operating expenses 20,276 7,362 1,034 1,241 29,913 (6,553) 23,360 Operating income (loss) ¥ 500 ¥ (37) ¥ 36 ¥ 31 ¥ 530 ¥ 202 ¥ 732
II. Total assets ¥ 51,869 ¥ 5,737 ¥ 756 ¥ 1,915 ¥ 60,277 ¥ (1,953) ¥ 58,324 III. Other items
Depreciation and amortization ¥ 880 ¥ 95 ¥ 4 ¥ 8 ¥ 987 ¥ – ¥ 987 Investments in affiliates 96 – – – 96 – 96 Increase in property, plant and equipment / intangible assets 589 93 1 11 694 – 694
ICOM INCORPORATED AND SUBSIDIARIES
Notes to Consolidated Financial Statements
ICOM INCORPORATED ANNUAL REPORT 2017 27
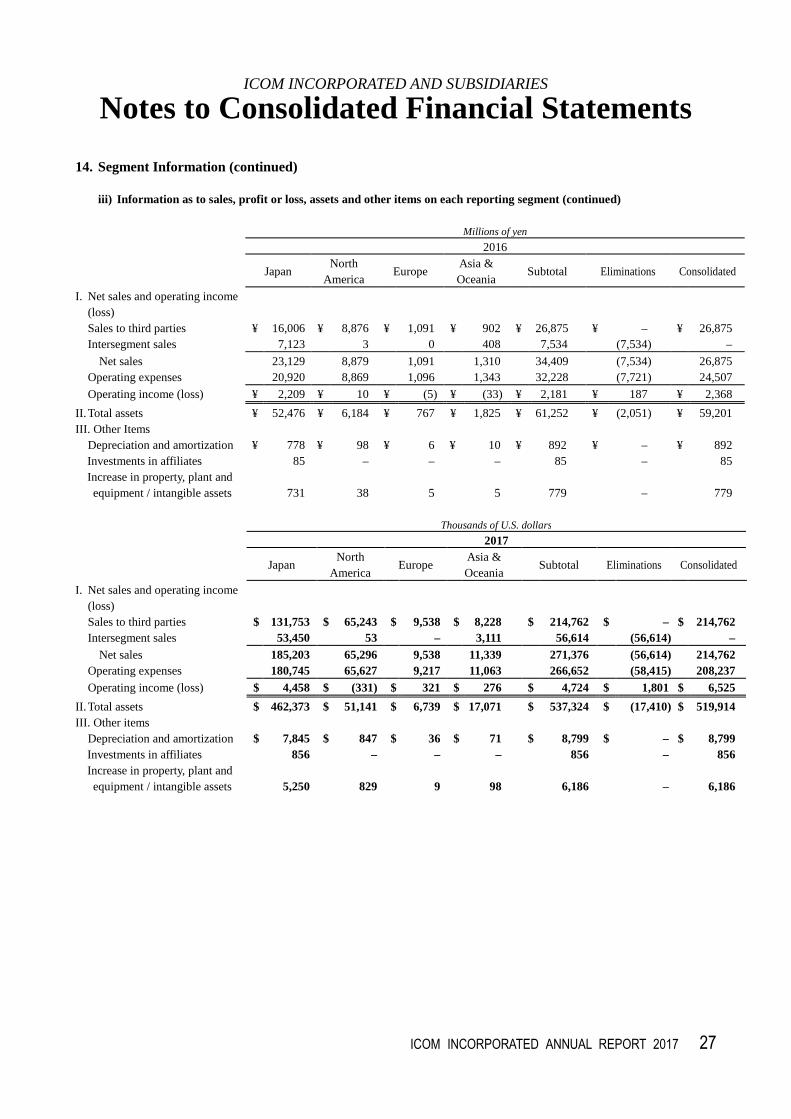
14. Segment Information (continued)
iii) Information as to sales, profit or loss, assets and other items on each reporting segment (continued)
Millions of yen
2016
Japan North
America Europe
Asia & Oceania
Subtotal Eliminations Consolidated
I. Net sales and operating income (loss)
Sales to third parties ¥ 16,006 ¥ 8,876 ¥ 1,091 ¥ 902 ¥ 26,875 ¥ – ¥ 26,875 Intersegment sales 7,123 3 0 408 7,534 (7,534) –
Net sales 23,129 8,879 1,091 1,310 34,409 (7,534) 26,875 Operating expenses 20,920 8,869 1,096 1,343 32,228 (7,721) 24,507
Operating income (loss) ¥ 2,209 ¥ 10 ¥ (5) ¥ (33) ¥ 2,181 ¥ 187 ¥ 2,368
II. Total assets ¥ 52,476 ¥ 6,184 ¥ 767 ¥ 1,825 ¥ 61,252 ¥ (2,051) ¥ 59,201 III. Other Items
Depreciation and amortization ¥ 778 ¥ 98 ¥ 6 ¥ 10 ¥ 892 ¥ – ¥ 892 Investments in affiliates 85 – – – 85 – 85 Increase in property, plant and equipment / intangible assets 731 38 5 5 779 – 779
Thousands of U.S. dollars
2017
Japan North
America Europe
Asia & Oceania
Subtotal Eliminations Consolidated
I. Net sales and operating income (loss)
Sales to third parties $ 131,753 $ 65,243 $ 9,538 $ 8,228 $ 214,762 $ – $ 214,762 Intersegment sales 53,450 53 – 3,111 56,614 (56,614) –
Net sales 185,203 65,296 9,538 11,339 271,376 (56,614) 214,762 Operating expenses 180,745 65,627 9,217 11,063 266,652 (58,415) 208,237 Operating income (loss) $ 4,458 $ (331) $ 321 $ 276 $ 4,724 $ 1,801 $ 6,525
II. Total assets $ 462,373 $ 51,141 $ 6,739 $ 17,071 $ 537,324 $ (17,410) $ 519,914 III. Other items
Depreciation and amortization $ 7,845 $ 847 $ 36 $ 71 $ 8,799 $ – $ 8,799 Investments in affiliates 856 – – – 856 – 856 Increase in property, plant and equipment / intangible assets 5,250 829 9 98 6,186 – 6,186

ICOM INCORPORATED AND SUBSIDIARIES
Notes to Consolidated Financial Statements
ICOM INCORPORATED ANNUAL REPORT 2017 28
14. Segment Information (continued)
iv) Geographical information
(a) Sales
Sales categorized by country and region based on locations of customers by the Group for the years ended March 31, 2017 and 2016 were summarized as follows:
Millions of yen Thousands of U.S. dollars 2017 2016 2017 Japan ¥ 7,971 ¥ 8,840 $ 71,055 USA 5,391 6,864 48,056 North America (except for the USA)
1,113
1,266
9,922
Europe 3,592 3,790 32,020 Asia & Oceania 5,345 5,266 47,647 Other 680 849 6,062
Total ¥ 24,092 ¥ 26,875 $ 214,762
(b) Property, plant and equipment
Property, plant and equipment categorized by country and region at March 31, 2017 and 2016 were summarized as follows:
Millions of yen Thousands of U.S. dollars 2017 2016 2017 Japan ¥ 6,068 ¥ 6,381 $ 54,092 USA 1,218 1,283 10,858 North America (except for the USA)
13
13
116
Europe 9 13 80 Asia & Oceania 171 178 1,524
Total ¥ 7,479 ¥ 7,868 $ 66,670
Disclosure of the information by product and service for the years ended March 31, 2017 and 2016 has been omitted as sales of products and services to external customers in a single segment account for more than 90% of net sales in the consolidated statement of income. Disclosure of the information by major customers for years ended March 31, 2017 and 2016 has been omitted as sales
to each customer were less than 10% of consolidated net sales.

ICOM INCORPORATED AND SUBSIDIARIES
Notes to Consolidated Financial Statements
ICOM INCORPORATED ANNUAL REPORT 2017 29
15. Significant Subsidiaries and Affiliates
The Company’s subsidiaries and significant affiliates at March 31, 2017 are presented as follows:
Name Ownership
Interest Country of Incorporation Subsidiaries/Affiliate
Icom America, Inc. 100.0% United States of America Consolidated subsidiary Icom (Europe) GmbH 100.0% Germany Consolidated subsidiary Icom (Australia) Pty., Ltd. 100.0% Australia Consolidated subsidiary Icom Spain, S.L. 100.0% Spain Consolidated subsidiary Asia Icom Inc. 100.0% Taiwan Consolidated subsidiary PURECOM CO., LTD. 100.0% China Consolidated subsidiary Wakayama Icom Inc. 100.0% Japan Consolidated subsidiary Icom Information Products Inc. 100.0% Japan Consolidated subsidiary Icom America License Holding LLC 100.0% United States of America Consolidated sub-subsidiary
ICOM CANADA HOLDINGS INC. 100.0% Canada Consolidated sub-subsidiary
ICOM DO BRASIL RADIOCOMUNICACAO LTDA.
100.0% Brazil Consolidated sub-subsidiary
Comforce Inc. 49.0% Japan Affiliate accounted for by the equity method
Position Co., Ltd. 33.3% Japan Affiliate accounted for by the equity method
16. Subsequent Event The following distribution of retained earnings of the Company, which has not been reflected in the accompanying consolidated
financial statements for the year ended March 31, 2017, was approved at the Company’s general shareholders’ meeting held on June 27, 2017:
Millions of yen Thousands of
U.S. dollars
2017 2016 2017 Cash dividends (¥10 = U.S.$0.09 per share) ¥ 148 ¥ 267 $ 1,319


BOARD OF DIRECTORS AND AUDITORS Tokuzo Inoue Chairman and Representative Director Tsutomu Fukui President and Representative Director Nobuo Ogawa Executive Managing Director Hiroshi Shimizu Director Kenichi Kojiyama Director Masataka Harima Director Haruyuki Yoshizawa Outside Director Toshihiko Sano Auditor Hiroshi Umemoto Outside Auditor Katsunori Sugimoto Outside Auditor EXECUTIVE OFFICERS Hiroshi Nakaoka Takashi Tsujiuchi Shinichi Matsuo Shigeyoshi Tanabe Yoshiteru Yano Yoshiki Enomoto Shu Kitaguchi DIRECTORY Head Office: 1-1-32, Kamiminami, Hirano-ku, Osaka, 547-0003, Japan Phone: 81-6-6793-5301 Fax: 81-6-6793-5305 URL http://www.icom.co.jp/ Subsidiaries: Icom America, Inc. 12421 Willows Road NE, Kirkland, WA 98034, U.S.A Phone: 1-425-454-8155 Fax: 1-425-454-1509 URL http://www.icomamerica.com/ Icom (Europe) GmbH Auf der Krautweide 24, 65812 Bad Soden am Taunus, Germany Phone: 49-6196-76685-0 Fax: 49-6196-76685-50 URL http://www.icomeurope.com/
Icom (Australia) Pty., Ltd. A.B.N. 88 006 092 575 Unit 1/103 Garden Road, Clayton Victoria 3168, Australia Phone: 61-3-9549-7500 Fax: 61-3-9549-7505 URL http://www.icom.net.au/ Icom Spain, S.L. Ctra. Rubi, No. 88 “Edificio Can Castanyer” 08190, Sant Cugat del Valles, Barcelona, Spain Phone: 34-93-590-2670 Fax: 34-93-589-0446 URL http://www.icomspain.com/ Asia Icom Inc. 6F, No.68, Section 1, Cheng-Teh Road, Taipei, Taiwan R.O.C. Phone: 886-2-2559-1899 Fax: 886-2-2559-1874 PURECOM CO.,LTD Room 1110H, Block A, Tiley Central Plaza, Houhai, Avenue East, Nanshan District, Shenzhen, 518054, China. Phone: 86-755-8633-2141 Wakayama Icom Inc. 1866-1, Oaza Tokuda, Aritagawa-chou Arita-gun, Wakayama, 643-0801 Japan Phone: 81-737-52-6600 Fax: 81-737-52-6603 Icom Information Products Inc. 3-8-15, Nipponbashi, Naniwa-ku, Osaka, 556-0005, Japan Phone: 81-6-6635-5701 Fax: 81-6-6635-5707 URL http://www.icom-jk.co.jp/ Icom America License Holding LLC 12421 Willows Road NE, Kirkland, WA 98034, U.S.A Phone: 1-425-454-8155 Fax: 1-425-454-1509 ICOM CANADA HOLDINGS INC. Glenwood Centre #150-6165 Highway 17A, Delta, B.C. V4K 5B8, Canada Phone: 1-604-952-4266 Fax: 1-604-952-0090 URL http://www.icomcanada.com/
ICOM DO BRASIL RADIOCOMUNICACAO LTDA. Rua Itororó, 444 Padre Eustáquio Belo Horizonte MG, CEP: 30130-150 Brazil Phone: 55-31-3582-8847 Affiliates: Comforce Inc. Sumitomofudousanhamatyou Bld.8F, 3-42-3, Nihombashihamacho, Chuo-ku, Tokyo, 103-0007, Japan Phone: 81-3-3662-1167 Fax: 81-3-3662-1168 URL http://www.comforce.co.jp/ Position Co., Ltd. 3-3-9, Sotokanda, Chiyoda-ku, Tokyo, 101-0021, Japan Phone: 81-3-5297-6111 URL http://www.posit.co.jp/ TRANSFER AGENT Mitsubishi UFJ Trust and Banking Corporation Tokyo Office: 4-5, Marunouchi 1-chome, Chiyoda-ku, Tokyo 100-8212, Japan Osaka Office: 6-3, Fushimimachi 3-chome Chuo-ku, Osaka, 541-0044, Japan INVESTOR RELATIONS Keiichi Uehata General Manager of Business Management Department 1-1-32, Kamiminami, Hirano-ku, Osaka, 547-0003, Japan Phone: 81-6-6793-5301 Fax: 81-6-6793-5305 CORPORATE FACTS (As of March 31, 2017) Established: July 1964 Employees: 641 Paid-in capital: ¥7,081 million Authorized shares: 34,000,000 Issued and outstanding shares: 14,850,000 Shareholders: 8,216 Stock listing: Tokyo Stock Exchange
(As of March 31, 2017)
Major shareholders Thousands of shares State Street Bank and Trust Company 1,926 Tokuzo Inoue 1,868 Gigapalace Inc. 1,472 The Icom Foundation The Master Trust Bank of Japan, Ltd.
1,000 457
JVC KENWOOD Corporation 445 Meiji Yasuda Life Insurance Company 326 UBS AG LONDON A/C IPB SEGREGATED CLIENT ACCOUNT 266 The Bank of Tokyo-Mitsubishi UFJ, Ltd. 243 The Hiroshima Bank, Ltd. 240