ideas
TRANSCRIPT

IDEASAuthor(s): Sharon L. YoungSource: The Arithmetic Teacher, Vol. 38, No. 2 (OCTOBER 1990), pp. 24-34Published by: National Council of Teachers of MathematicsStable URL: http://www.jstor.org/stable/41194691 .
Accessed: 14/06/2014 08:29
Your use of the JSTOR archive indicates your acceptance of the Terms & Conditions of Use, available at .http://www.jstor.org/page/info/about/policies/terms.jsp
.JSTOR is a not-for-profit service that helps scholars, researchers, and students discover, use, and build upon a wide range ofcontent in a trusted digital archive. We use information technology and tools to increase productivity and facilitate new formsof scholarship. For more information about JSTOR, please contact [email protected].
.
National Council of Teachers of Mathematics is collaborating with JSTOR to digitize, preserve and extendaccess to The Arithmetic Teacher.
http://www.jstor.org
This content downloaded from 195.34.79.192 on Sat, 14 Jun 2014 08:29:50 AMAll use subject to JSTOR Terms and Conditions

IDEAS
IDEAS section for this month, which is Popcorn-popping Month,
focuses on using and interpreting data about popcorn as a basis for integrat- ing mathematics, science, health, and social studies. Measurement and other relationships are explored through making graphs and measuring popcorn and in a parent-involvement activity sheet.
This month the reproducible sheets for the IDEAS section are designed to be used by multiple grade levels. In- cluded are an activity sheet for par- ents to use with their children, three class-activity sheets, and a data sheet. A teacher may want to reproduce and use several sheets.
IDEAS
LEVELS 1-8
POPCORN DATA SHEET
This data sheet should be duplicated and used when indicated for class- room activity sheets and the take- home parent activity sheet. The fol- lowing information will help you and your students interpret the popcorn data.
1 . Most of the popcorn in the world is produced and consumed in the United
Edited and prepared by Sharon L. Young Mathematics Education Consultant Palm Harbor, FL 34683
This section is designed for teachers who wish to give students new insights into familiar top- ics in grades K-8. This material can be repro- duced by classroom teachers for use in their own classes without requesting permission from the National Council of Teachers of Math- ematics.
24
States. Note that in the table 'Top- corn production 1987-89," "other" includes Canada as well as several states. Assume that each of the places constituting "other" produces less popcorn than any of the states listed separately in the table. 2. Data on popcorn expansion is given for "good popcorn." Note that a hot-air popper yields greater expan- sion than a traditional popcorn pop- per.
3. Sizes of popcorn bags vary from vendor to vendor. The sizes given are typical of bags used in movie theaters. Popcorn is also sold in tubs and car- tons. 4. The map of the United States shows the regions used in analyzing sales data for the snack industry. Data for the two tables showing regional sales are based on sales in the forty- eight contiguous states. 5. The size of a batch of popcorn can vary; however, if a small popper is used, you should not use more than one-third cup of unpopped kernels. 6. The Popcorn Institute, 111 East Wacker Drive, Chicago, IL 60601, and the Snack Food Association, 1711 King Street, Alexandria, VA 22314, supplied the data regarding popcorn sales, production, and expansion.
Extensions
1 . Send home a copy of the "Popcorn Data Sheet" along with a copy of "At Home with Popcorn." Ask students to record the results of this home-ac- tivity sheet and then to share their re- sults with the class. 2. A brochure for teachers with sug- gestions for teaching with popcorn in history, science, mathematics, geog-
raphy, home economics, and health is available from the Popcorn Institute (see address in item 6 of the previous section.) 3. Students can conduct their own li- brary research to find out more about popcorn. The Bibliography contains suggested resources.
Bibliography de Paola, Tomie. The Popcorn Book. New
York: Holiday House, 1978. Kellogg, Cynthia. Corn- What It Is, What It
Does. New York: Greenwillow Books, 1989. Selson, Millicent Ellis. Popcorn. New York:
Morrow, 1976. Williams, Barbara. Cornz a Poppin. New York:
Holt, Rinehart & Winston, 1976. Woodside, Dave. What Makes Popcorn Pop?
New York: Atheneum, 1980. Wyler, Rose. Science Fun with Peanuts and
Popcorn. New York: J. Messner, 1986.
IDEAS
LEVELS 1-3 HOW MUCH POPCORN?
Objective
Pupils explore ideas of expansion, ca- pacity, and estimation. They first look at some unpopped popcorn and make estimates of how much popcorn they think will result when it is popped. Next they revise their estimates after popping the popcorn, and finally they check their estimates by measuring and counting. The data collected are displayed in a table.
Materials
1. Unpopped popcorn 2. Popcorn popper 3. Measuring cup
ARITHMETIC TEACHER
This content downloaded from 195.34.79.192 on Sat, 14 Jun 2014 08:29:50 AMAll use subject to JSTOR Terms and Conditions
4. Bowls or other large containers 5. Paper cups 6. A copy of "How Much Popcorn?" for each student
Directions
Note: If popcorn popping is not pos- sible in your classroom, see step 9.
1. Ask students questions like these, discussing their responses as a class. • If I popped a handful of popcorn kernels, would I be able to hold all the popped popcorn in my hand? Why or why not? (Answers will vary.) • When you pop popcorn do you think it fills about twice as much space as the original unpopped kernels? Ten times as much space? (Answers will vary.) 2. Place students in groups of four to six students. Discuss group behav- iors: help one another, disagree in an agreeable way; listen to others in your group, take turns. 3. Distribute copies of "How Much Popcorn?" to each student. 4. Give each group one-third cup of unpopped kernels and some empty paper cups. Direct students to look at the unpopped popcorn. Tell them to make three estimates about how much popcorn they will have after it is popped. • How many paper cups will the pop- corn fill? • How many popped kernels will fill a paper cup? • How many popped kernels will be in their handful?
Ask students to discuss their esti- mates and then to record them. 5. Pop the popcorn for each group. Students from all groups can watch during the popping for other groups, or you could have them involved in some other quiet activity while they are waiting for the group's popcorn to be popped. 6. After the popcorn is popped, ask each group to make estimates again for the same three things. Ask if they want to change their estimates after having looked at the popped corn. Do not have students erase their original
OCTOBER 1990
IHj^^^H
estimates; rather, have them record the new estimates in the second col- umn of the table. If students do not want to change their estimates, they should record the same numbers in the "after popping" column as they originally had in the "before pop- ping" column. 7. Next direct students to measure the popped popcorn using paper cups. This task can be done in two ways: (a) fill several paper cups until all pop- corn has been measured, or (b) use one paper cup and a large empty con- tainer. Fill the paper cup with pop- corn and pour that popcorn into the empty container. Continue filling and emptying the paper cup, making sure to tally each time the cup is filled. Record the results in the "actual" col- umn. Continue by having students count and record the number of popped kernels in a paper cup and in a handful. 8. Finally, ask students to discuss their results. Suggest that they com- pare their estimates with the actual counts. Ask whether their estimates were more accurate when made be- fore the popcorn was popped or after it was popped. 9. If you cannot pop popcorn in your classroom, you can still do the activ- ity by popping the popcorn elsewhere and bringing it into the classroom. Then before showing the popped pop- corn to the groups of students, you should first show them one-third cup of unpopped kernels and have stu- dents make their initial estimates as in step 4. Then give each group a batch of popcorn popped from one-third cup
of kernels, telling them that's how much they would have if they had popped that amount. Continue as in steps 6-8.
Answers
Estimates will vary. The actual counts will vary depending on the expansion ratio for the popcorn used.
Extensions
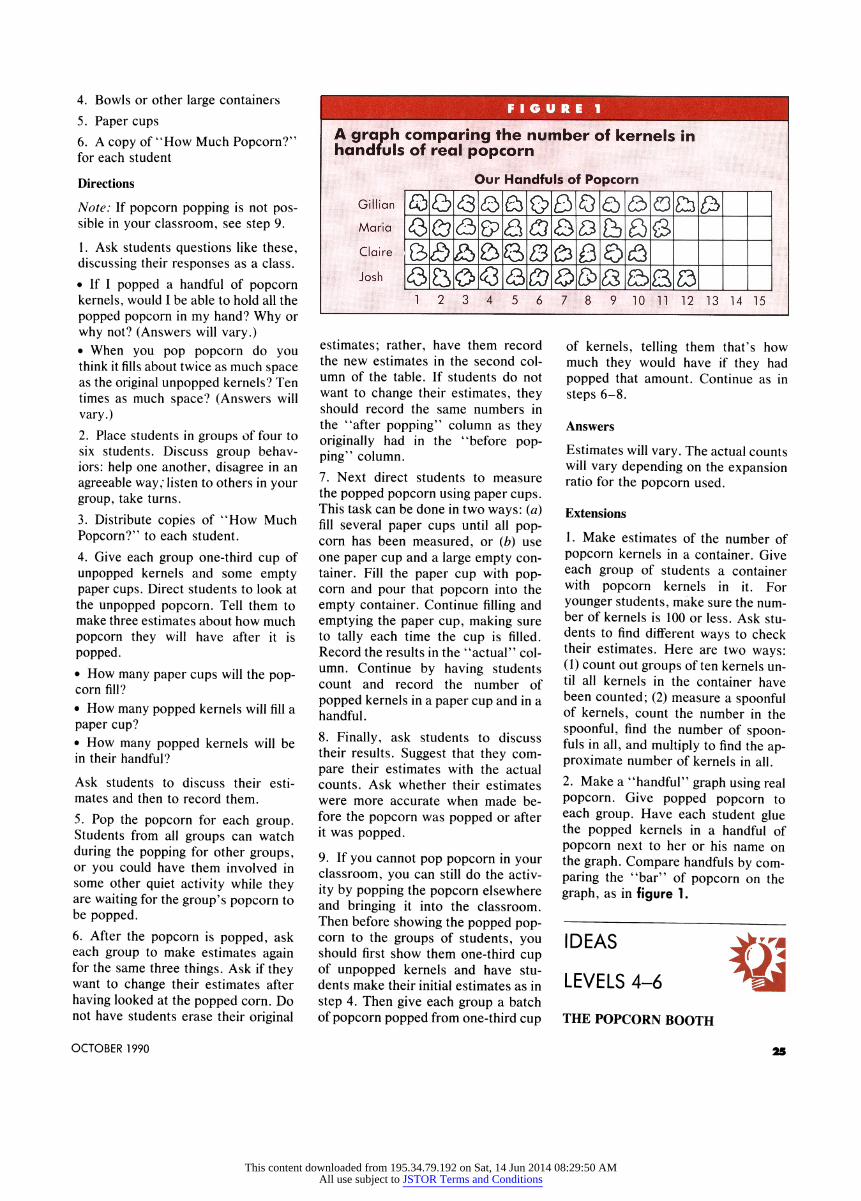
1 . Make estimates of the number of popcorn kernels in a container. Give each group of students a container with popcorn kernels in it. For younger students, make sure the num- ber of kernels is 100 or less. Ask stu- dents to find different ways to check their estimates. Here are two ways: (1) count out groups often kernels un- til all kernels in the container have been counted; (2) measure a spoonful of kernels, count the number in the spoonful, find the number of spoon- fuls in all, and multiply to find the ap- proximate number of kernels in all. 2. Make a "handful" graph using real popcorn. Give popped popcorn to each group. Have each student glue the popped kernels in a handful of popcorn next to her or his name on the graph. Compare handfuls by com- paring the "bar" of popcorn on the graph, as in figure 1.
IDEAS
LEVELS 4-6
THE POPCORN BOOTH
25
This content downloaded from 195.34.79.192 on Sat, 14 Jun 2014 08:29:50 AMAll use subject to JSTOR Terms and Conditions
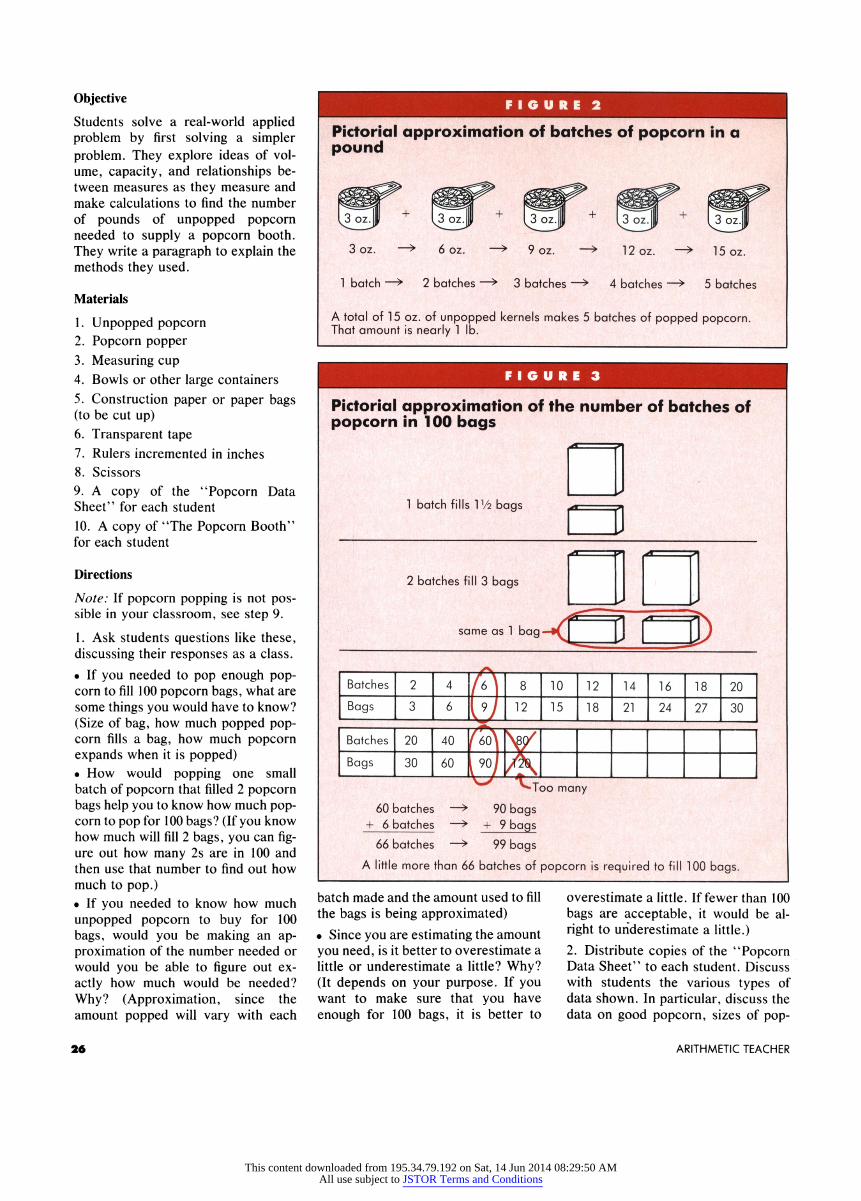
Pictorial approximation of batches of popcorn in a pound
Pictorial approximation of the number of batches of popcorn in 100 bags
Objective Students solve a real-world applied problem by first solving a simpler problem. They explore ideas of vol- ume, capacity, and relationships be- tween measures as they measure and make calculations to find the number of pounds of unpopped popcorn needed to supply a popcorn booth. They write a paragraph to explain the methods they used.
Materials
1 . Unpopped popcorn 2. Popcorn popper 3. Measuring cup 4. Bowls or other large containers 5. Construction paper or paper bags (to be cut up) 6. Transparent tape 7. Rulers incremented in inches 8. Scissors 9. A copy of the "Popcorn Data Sheet" for each student 10. A copy of 'The Popcorn Booth" for each student
Directions
Note: If popcorn popping is not pos- sible in your classroom, see step 9.
1. Ask students questions like these, discussing their responses as a class. • If you needed to pop enough pop- corn to fill 100 popcorn bags, what are some things you would have to know? (Size of bag, how much popped pop- corn fills a bag, how much popcorn expands when it is popped) • How would popping one small batch of popcorn that filled 2 popcorn bags help you to know how much pop- corn to pop for 100 bags? (If you know how much will fill 2 bags, you can fig- ure out how many 2s are in 100 and then use that number to find out how much to pop.) • If you needed to know how much unpopped popcorn to buy for 100 bags, would you be making an ap- proximation of the number needed or would you be able to figure out ex- actly how much would be needed? Why? (Approximation, since the amount popped will vary with each
26
^^^^^^^^J
■дтцп
batch made and the amount used to fill the bags is being approximated) • Since you are estimating the amount you need, is it better to overestimate a little or underestimate a little? Why? (It depends on your purpose. If you want to make sure that you have enough for 100 bags, it is better to
overestimate a little. If fewer than 100 bags are acceptable, it would be al- right to underestimate a little.) 2. Distribute copies of the "Popcorn Data Sheet" to each student. Discuss with students the various types of data shown. In particular, discuss the data on good popcorn, sizes of pop-
ARITHMETIC TEACHER
This content downloaded from 195.34.79.192 on Sat, 14 Jun 2014 08:29:50 AMAll use subject to JSTOR Terms and Conditions

corn bags, and the amount of un- popped popcorn to use for a batch of popcorn. 3. Distribute copies of 'The Popcorn Booth" to each student and discuss its contents. Elicit from students the idea that although it appears that the first task is to pop some popcorn, im- portant decisions must be made to start the project. Students must first decide what size of popcorn bag to use. However, a word of caution: the small-sized bag will hold about six cups of popped popcorn and the large- sized bag will hold about fifteen cups. If the large size is used, students may have to borrow popcorn from another group to find out how much the bag holds. Students must also realize that they need to make a paper model of the popcorn bag in order to fill it with popped popcorn. 4. Place students in four or five groups, depending on how many batches of popcorn you can pop. Dis- cuss group behaviors: help one an- other, disagree in an agreeable way, listen to others in your group, take turns. 5. Distribute paper, rulers, scissors, and tape for each group to make a model of a popcorn bag. As each group works on making its model, the teacher can work with one group at a time to measure and pop a batch of popcorn to be used in the activity. Students should then use their batch of popped popcorn to find how many bags can be filled. 6. Act as a resource to the groups as they decide what other data they need to know to find out how many pounds of popcorn to buy. A solution to the problem can be found in several dif- ferent ways. One of the easiest is to (a) find about how many batches of popcorn can be popped from one pound of unpopped kernels, (b) find about how many batches of popcorn will fill 100 bags, and (c) find how many pounds of unpopped kernels are needed to make the number of batches that fills 100 bags. Although it appears that formal computation with decimals, fractions, and long division might be needed to find a solution, such computation is not necessary.
OCTOBER 1990
Rather, students can use informal methods to find a solution and should be encouraged to do so. A formal method is compared with an informal method to illustrate the difference.
A formal method
(a) Find about how many batches of popcorn can be popped from 1 pound of unpopped kernels by dividing the number of ounces in a pound by the number of ounces in a batch of pop- corn: 16 ounces (1 lb.) divided by 3 ounces yields an answer of about 5.3, so each pound makes about 5 batches. (b) Find about how many batches of popcorn are required to fill 100 bags by dividing 100 by the number of bags filled by 1 batch of popcorn. If, for example, lî/г bags were filled by 1 batch, then 100 divided by 1.5 would be about 66.6, so about 67 batches would be needed to fill 100 bags. (c) Divide the number found in step 6b by the number found in step 6a. Since 67 divided by 5 is 13.4, about 14 pounds of unpopped popcorn would be needed. Note that 13.4 was rounded up to 14 so as not to under- estimate the amount needed.
An informal method
(i) Find about how many batches of popcorn can be popped from 1 pound of unpopped kernels by drawing pic- tures or adding 3-ounce batches until you get close to 1 pound, or 16 ounces, as shown in figure 2. (Re- member that we need only an approx- imate number.) (ii) Find about how many batches of popcorn fill 100 bags by drawing pic- tures or using guess and check and adding amounts until 100 is reached. For example, figure 3 shows a method for finding the number of batches when the sample batch filled IV2 popcorn bags. Find how many pounds are needed by successively adding the number found in step i until you reach the number found in step ii, as shown in figure 4. Count the number of times the num- ber of batches found in step i were added to find the number of times the number found in step i can be divided into the number found in step ii.
■ТЕ^Т^ЖЯ
7. Encourage students to write a paragraph describing how they found their answer to the problem. 8. Have the various groups orally re- port their results, and allow the class to discuss them. 9. If you cannot pop popcorn in your classroom, you can still do the activ- ity by popping the popcorn elsewhere and bringing it into the classroom or by purchasing ready-to-eat popcorn. If you pop the popcorn elsewhere, supply one batch for each group of students. If ready-to-eat popcorn is used, furnish three quarts of it for each group of students. Explain that a batch of "good popcorn" popped from three ounces of kernels would yield about three quarts of popped popcorn. Use a glass one-quart mea- suring container to help students pic- ture this amount.
Answers
Actual answers will vary depending on the sizes of the bags and on the expan- sion ratio of the popcorn popped.
Extensions
1 . Have students determine the num- ber of pounds of unpopped popcorn
27
This content downloaded from 195.34.79.192 on Sat, 14 Jun 2014 08:29:50 AMAll use subject to JSTOR Terms and Conditions
needed for 500 bags of popcorn or for 1000 bags of popcorn. 2. Have students determine the num- ber of pounds of unpopped popcorn needed if bags of a different size or bags of two or more sizes are used. 3. Have students determine the cost of producing a bag of popcorn, includ- ing the cost of the bag itself and the cost of any seasonings or flavorings. Then have them set a price for the popcorn and determine what their profit margin will be. 4. Have students estimate and then find how many cups of popcorn each size of bag holds. Note that in movie theaters the difference in price be- tween a small bag and a large bag may be only twenty-five or fifty cents, but the large bag may hold twice as much popcorn.
IDEAS
LEVELS 5-8
HOW MUCH POPCORN DO WE EAT PER CAPITA?
Objective
Students explore the relationship of two sets of data by predicting whether that relationship is stable or changes over time. They make a graph to check their prediction.
Materials
1 . One quart of popped popcorn 2. Unpopped popcorn 3. Popcorn popper 4. Measuring cup 5. Bowl 6. Calculators 7. A copy of the "Popcorn Data Sheet" for each student 8. A copy of "How Much Popcorn Do We Eat per Capita?" for each stu- dent.
Directions
Note: If popcorn popping is not pos- sible in your classroom, you can use
28
the computation method described in step 6 to conduct the activity. 1. Show students a quart of popped popcorn. Ask them questions like these, discussing their responses as a class. • How often do you eat popcorn - once a week? Once a month? More often? Less often? • If this is one quart of popped pop- corn, how many quarts of popcorn do you estimate you eat at one time - one quart? Two quarts? • How many quarts do you estimate you eat in a year? How did you de- cide? • Do you think everybody eats as much popcorn as you do? Do you think most people eat more? Less? • Do you think some people eat no popcorn at all? 2. Discuss with students the meaning of per capita. Have them look up the definition in the dictionary and then discuss the fact that many graphs and tables seen in magazines and newspa- pers are based on per capita data. Ask how that figure is arrived at for pop- corn consumption. (The data are fig- ured on an average amount eaten by each person, even though some peo- ple might not eat any popcorn, others eat' a little, and still others eat a lot.) 3. Place students in groups of three to five students each. Discuss group be- haviors: help one another, disagree in an agreeable way, listen to others in your group, take turns. 4. Distribute copies of "How Much Popcorn Do We Eat per Capita?" to each student. Discuss the first para- graph and ask students what data they will need to have to make the graph. (Data on quarts of popped popcorn consumed in the United States each year 1980-89 and on the number of people in the United States each year 1980-89) 5. Distribute copies of the "Popcorn Data Sheet" to each student. Ask stu- dents to look carefully at the data given and to find data they could use for their graph (the data in the ta- ble "Population and popcorn sales growth for ten years"). Note with stu- dents that this table contains data for
pounds of unpopped popcorn, but what is needed is data for quarts of popped popcorn. Elicit from students the idea that to change the data in the table to the form needed, they would first need to find out how many quarts of popped popcorn can be made from a pound of unpopped popcorn. Then they would need to make a new table for quarts of popped popcorn con- sumed for each of the ten years by multiplying the data in the given table by that number of quarts. 6. Direct students to work in their groups to find the number of quarts of popped popcorn that can be made from a pound of unpopped popcorn. This number can be found in two ways. The first method involves pop- ping popcorn in the class. The second method involves some computations.
Popping method
Pop Уъ cup of unpopped kernels and have students measure the number of cups of popped popcorn made. If "good popcorn" kernels are used (see data sheet), Уз cup of kernels weighing approximately 3 ounces should yield about 12 cups, or 3 quarts, of popped popcorn. So 1 ounce of unpopped ker- nels yields about 4 cups, or 1 quart, of popped popcorn, and 1 pound (16 oz.) of unpopped kernels yields about 16 quarts of popped popcorn.
Computation method Use the "good popcorn" data from the data sheet to find that !/з cup of unpopped kernels weighing about 3 ounces yields thirty-five to thirty- eight times that amount, which is 112/з-122/з cups, or about 12 cups, which is the same as 3 quarts. Since 3 ounces of unpopped kernels yield 3 quarts of popped popcorn, then 1 ounce of unpopped kernels yields 1 quart of popped popcorn. Conse- quently, 1 pound (16 oz.) of unpopped kernels yields about 16 quarts of popped popcorn. Elicit from students the idea that the data for consumption of popped popcorn will be approxi- mate, so approximate measures can be used in later calculations. For ex- ample, if their popcorn yielded a little
(Turn to page 34)
ARITHMETIC TEACHER
This content downloaded from 195.34.79.192 on Sat, 14 Jun 2014 08:29:50 AMAll use subject to JSTOR Terms and Conditions

Survey your family, friends, and neighbors. Ask if they eat popcorn at home. If they answer yes, then ask them what kind they buy: ready to eat, microwavable unpopped, or regular unpopped. Make a table to show your data. Check the data sheet. How do your results compare with the results for the Í region where you live? 1
r- ^
Popcorn at home
Number of people No popcorn
Ready to eat
Microwavable unpopped
Regular unpopped
4
Pop some popcorn! Measure the amount ^^* before and after popping. Count the number of kernels that did not pop. Check the data sheet. Does your popcorn measure up? Would it be considered to be good popcorn?
Dear Parents, Your child has been using mathematics to investigate data about popcorn. This sheet suggests three different activities. You and your child may want to select one or more of them to do together. Use the accompanying "Popcorn Data Sheet" to assist you.^*^
^ '*^
i Read nutrition-label information on several ' snack foods, including popcorn. Why do you
think popcorn is considered to be a very healthy food, especially when it is served without butter?
~4 J~'-^
At Home with Popcorn
IDEAS *
Name _
This content downloaded from 195.34.79.192 on Sat, 14 Jun 2014 08:29:50 AMAll use subject to JSTOR Terms and Conditions

IDEAS ^y« ^ül Name
How Much Popcorn? Work in a group. You have one-third of a cup of unpopped popcorn. Before popping, make some estimates about the amounts of popped popcorn that will result. Pop the popcorn. Make some new estimates after popping. Then find the actual number.
Estimate Actual
Before popping After popping
How many 'ls of popcorn in the
How many A * "7' s
in each '/ ?
How many A-'4.s
in your çn/1 y ?
Look at your results. Write about what you found out
From the Arithmetic Teacher, October 1990
This content downloaded from 195.34.79.192 on Sat, 14 Jun 2014 08:29:50 AMAll use subject to JSTOR Terms and Conditions
IDEAS ̂V* ^tlM Name
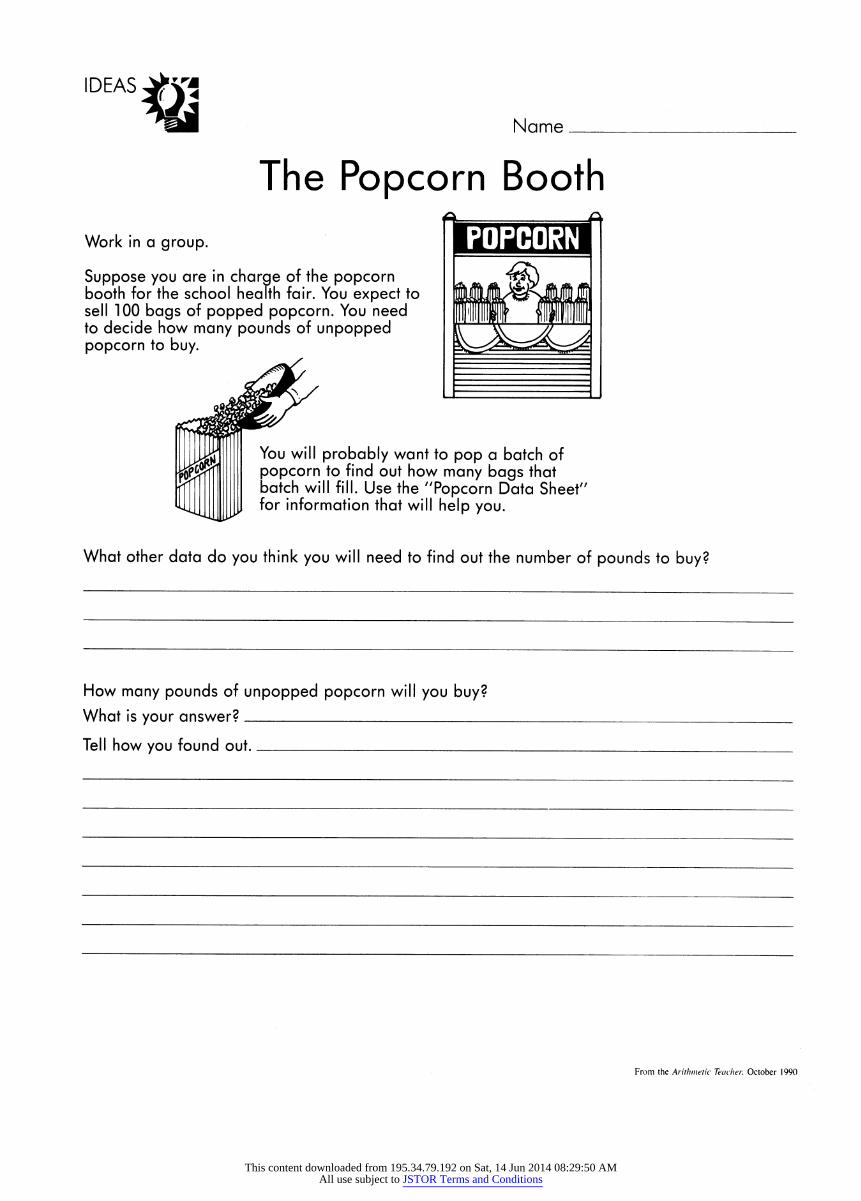
The Popcorn Booth Work in a group. Р^^и^Ш^дкЯ Suppose you are in charge of the popcorn i$y booth for the school health fair. You expect to ШУ|/^^М^ sell 100 bags of popped popcorn. You need ДИШ ШШМ to decide how many pounds of unpopped (v aL ]ж У
will probably want to pop a batch of opcorn to find out how many bags that atch will fill. Use the "Popcorn Data Sheet" >r information that will help you.
What other data do you think you will need to find out the number of pounds to buy?
How many pounds of unpopped popcorn will you buy? What is your answer?
Tell how you found out
From the Arithmetic Teacher, October 1990
This content downloaded from 195.34.79.192 on Sat, 14 Jun 2014 08:29:50 AMAll use subject to JSTOR Terms and Conditions

IDEAS ^K'í
How Much Popcorn Do We Eat per Capita?
Work in a group. Make a graph to show the number of quarts of popped popcorn eaten per capita in the United States each year 1980-89. Use the "Popcorn Data Sheet" to help you.
1. Before you start, look at the data and make some predictions about the graph. • How many quarts of popped popcorn do you think each person in the United States eats
in a year? • Do you think the amount of popped popcorn eaten by each person decreases, increases,
or stays about the same each year?
2. Write the title of your graph, finish the scales and write the labels for the parts of the graph. Then plot the points.
60 I - I 1 1 1 1 I 1 1 1
□ ' ' □ □ □ 35 I - I I I I I I I I I -
1980 I II II II II II II II II I
3. Compare the results from the graph with your predictions above. What reasons can you give for these results?
From the Arithmetic Teacher, October 1 990
This content downloaded from 195.34.79.192 on Sat, 14 Jun 2014 08:29:50 AMAll use subject to JSTOR Terms and Conditions

From the Arithmetic Teacher, October 1990
IDEAS ^yj *Wm Name
Popcorn Data Sheet _^ Popcorn production 1987-89- I /~'Г' ^ÄS-^es
f >L ^ C
Production in thousands of pounds V г? Л «ts original volume; f * ' ^'^l%i State or ^^^ • 1 • results in at least § * ^j
country 1987 1 1988 I 1989 T^ ^ I 98o/o popped I Ш{ ** Illinois
119418 82217 155 274 [ • %*• kernels. V-^V^l ^^ ^' ^^ j Indiana 226 574 86 799 198 703 I ¿Г 1ТГ ^^ ^^
bwa Kansas
60 20
576 012
39 24 639
039 41769 35 297 Ч^'/' r^^*C [Population and popcorn-sales Kansas 20 012 24 639 35 297 r^^*C /' arowth growtn for tor ten ten vears years Kentucky 28 259 11285 19 610 4 : Л growtn arowth for tor ten ten vears years " ' __
Michigan 19 607 9 549 6 417 '^ m^yjř J | " '
Sales of Missouri 71557 47 482 64 337 ^^ ^^mr Estimated population*** unpopped popcorn* Nebraska 93 678 111197 191924
Г V ^Д^ 1
Year (U.S. residents) (in pounds) Ohio 86 568 67 585 68 681 Г ; 1 198Q
226 546 000
568 000 000
Qther I 33812 I 27714 I 77M¿ Д Л/ 1981 229 637 000 600 000 000
Arkansas, California, Canada, Colorado, Idaho, Minnesota, I Ml 1 982 231 996 000 61 1 000 000 North Carolina, Oklahoma, Pennsylvania, South Dakota, ' *C^4 1983 234 284 000 618 000 000 Tennessee, Texas, Washington JL**/* 1 1984 236 477 000 630 000 000
I Am€^ ' %l 1 1985 238 736 000 670 000 000
( г Т 1986 241096 000 700 000 000 1988 popcorn sales** I *-Ъ~ 1 ш 243 400 000 741000 000 (type? yiyptg» 1988 popcorn
by »y r^wl/ region) '* ^
Т*шУ 1 ]Ш 245 602 000 807 000 000
yiyptg» by »y region) r^wl/ ^^^/^^ ^^"^^ 1 1989 I 248 239 000 | 872 000 000
Share of regional markets ^^"^^ Microwavabie Regular u.S. census divisions (used to measure regional sales)*'
Regions Ready-to-eat unpopped unpopped
East North Central 11.8% 43.0% 45.2% i^T^T^ * nCV East South Central 5.9 47.7 46.4 f/ ¡' | Г r3^^ J^landA Middle Atlantic 16.7 48.7 34.6 / T> 4 ) Г^УГЛ AjF Mountain 13.3 34.4 52.3 /^ f ^
Nor¿A If ' ¿*«*Ъ* New England 22.2 43.4 344 l^l^^A -4"""^VA!U^V ™™*ЧШ
South Atlantic 9.8 53.6 36.6 ^L С / M7I^ | -C ' Nort^Cenj^J /^'W West North Central 12.2 37.6 50.2 Ж ' L I I 'r 'Jt^^L West South Central | 7.8 | 45.1 | 47.1 |
Ж m^
'J" L
~~j~~
P l- "^^^¿ГаДсЖ
Sizes of popcorn bags л A ^^hL^ ^T^V- '
" ( 1 с^ I ' h г-Ш ^W
' ' ^^^^^^^J_^f~~^ South Central ' 1 I h г-Ш
__J/O1 A • ft | Т*У/о" I
4 6 1988 snack sales by region** Millions of Share of regional markets pounds of
¿^"^^ - ^' For one batch sa''eó snacks Potato Tortilla Corn Snack ^ ^^m^^^^I
^' For г
one Region sold in region chips chips chips Popcorn Pretzels nuts Other
&&$Ша&
I °A г
ï.mnompd P PP East North Central 780 36.9% 17.0% ~47%" 16.9% 7.7% 7.5% 9.3% ШШ$Ш tZÍ Kerneis.
P PP East East South
North Central Central
215 780
38.7 16.6 6.3 16.5 3.5 7.6 10.8 5шВОГО2Й5ЙЯ
Kerneis. Middle Atlantic 611 34.0 11.5 3.4 14.5 16.2 11.9 8.5 Я)*ЙСШда01 Wei9ht: Mountain 292 33.5 26.0 5.8 15.6 3.5 7.3 8.3
^^f£rSiS^^k>^' Approx. 3oz. New England 261 36.2 12.4 4.1 20.3 5.8 12.2 9.0 ^S^^HSBcS^L^ Pacific 591 28-0 285 5.1 16.0 3.4 10.0 9.0
JřÍiRSiEÉsSSŠÍř J South Atlantic 681 36.5 14.2 4.9 17.2 6.2 10.1 10.9 Qfj|[l|
J 4Jfy West North Central 390 35.6 22.0 4.5 17.3 4.3 7.2 9.1
_J - IM %Л | West South Central | 493 | 31.9 | 26.3 | 9.3 | 13.6 1 2.5 | 6.2 | 10.2
*Source: Popcorn Institute **Source: Snack Food Association ***Source: U.S. Census Bureau
This content downloaded from 195.34.79.192 on Sat, 14 Jun 2014 08:29:50 AMAll use subject to JSTOR Terms and Conditions

^^О"^^^^и
more than, or a little less than, 1 quart popped for each ounce unpopped, the 1 -quart figure could be used as an ap- proximate measure. If a batch of pop- corn yields significantly less than 12 cups of popped popcorn, have stu- dents first determine how much 1 ounce yields and multiply that by 16 to determine the amount 1 pound would yield. For example, if a batch made 9 cups of popped popcorn, then 1 ounce yields 3 cups (!/з of 9 cups), so 1 pound yields 3 x 16, or 48, cups, which is 12 quarts.
7. Next, students will need to use the data from step 6 to create a new table for quarts of popped popcorn con- sumed. Calculators should be avail- able for these computations. {Note: The table on the data sheet indicates sales of unpopped corn. It does not necessarily follow that all that pop- corn was consumed. This fact is an- other reason that the computations will yield only an approximation.) To
34
find the number of quarts of popped popcorn sold in 1980, use the popula- tion-and-popcorn-sales table on the data sheet. Divide 568 000 000 by 226 546 000. The quotient shown on the display, 2.507 217, represents pounds of popcorn sold for each resi- dent. Since 1 pound of unpopped pop- corn generally yields about 16 quarts of popped popcorn, then the number of pounds of popcorn for each resi- dent should be multiplied by 16 to yield the approximate number of quarts of popped popcorn for each resident. (Note: If the popping method in step 6 yielded a result other than 16, use that number in these computations.) Calculate 2.507 217 [x] 16 0 The product shown on the display, 40.115 472, can be rounded to the nearest whole number, 40. Thus, the per-capita consumption of popped popcorn in 1980 was about 40 quarts. 8. Have students complete their graphs by plotting the points for the
data obtained from the calculations in step 8. 9. Encourage students to report on the comparisons of their original pre- dictions and the results as indicated by the graph.
Answers
2. Points plotted on the graph could vary if in step 6 the popcorn yielded significantly smaller quantities than 1 quart popped for each ounce un- popped. The completed graph shown in figure 5 is based on that ratio. 3. The main reason for the increased per-capita consumption of popcorn over the last several years is the very successful introduction of microwav- able popcorn into the market.
Extensions
1 . Have students conduct a survey of students and teachers, asking how many quarts of popped popcorn they think each person eats in a year. Dis- play the results in a table. 2. Have students conduct a survey of students and teachers, asking them which of the snack foods on this list they would most want to have for snacks at home:
Potato chips Popcorn Tortilla chips Pretzels Corn chips Snack nuts
After the results are tallied, students can find the percentage of respond- ents that preferred each snack food. These results can then be compared with the 1988 sales figures for the re- gion where they live, as given on the data sheet. If students do not live in any of the regions shown, they can find which region's sales were most like the results of their own survey. 3. Students can make a multiple bar graph showing popcorn production by state for 1987-89, using the data on popcorn production given on the data sheet. After the graph has been com- pleted, ask students why they think the production figures for 1988 are so much lower than those for 1987 in many states. The reason is the sum- mer drought across the Midwest that year. W
ARITHMETIC TEACHER
This content downloaded from 195.34.79.192 on Sat, 14 Jun 2014 08:29:50 AMAll use subject to JSTOR Terms and Conditions