identification and tracking application of...
TRANSCRIPT

IDENTIFICATION AND TRACKINGAPPLICATION OF SELF-CONFIGURING SENSOR
NETWORKS FROM OFF-THE-SHELF PARTS
Item Type text; Electronic Thesis
Authors Wood, Kevin Michael
Publisher The University of Arizona.
Rights Copyright © is held by the author. Digital access to this materialis made possible by the University Libraries, University of Arizona.Further transmission, reproduction or presentation (such aspublic display or performance) of protected items is prohibitedexcept with permission of the author.
Download date 19/05/2018 08:05:00
Link to Item http://hdl.handle.net/10150/197290

IDENTIFICATION AND TRACKING APPLICATION OF SELF-CONFIGURING
SENSOR NETWORKS FROM OFF-THE-SHELF PARTS
By
Kevin Michael Wood
A Thesis Submitted to The Honors College
In Partial Fulfillment of the Bachelors degree
With Honors in
Computer Engineering
THE UNIVERSITY OF ARIZONA
May 2009
Approved by:
____________________________
Martha Ostheimer
College of Engineering (Interdisciplinary Advisor)

STATEMENT BY AUTHOR
I hereby grant to the University of Arizona Library the nonexclusive worldwide right
to reproduce and distribute my thesis and abstract (herein, the “licensed materials”), in whole
or in part, in any and all media of distribution and in any format in existence now or
developed in the future. I represent and warrant to the University of Arizona that the licensed
materials are my original work, that I am the sole owner of all rights in and to the licensed
materials, and that none of the licensed materials infringe or violate the rights of others. I
further represent that I have obtained all necessary rights to permit the University of Arizona
Library to reproduce and distribute any nonpublic third party software necessary to access,
display, run, or print my thesis. I acknowledge that University of Arizona Library may elect
not to distribute my thesis in digital format if, in its reasonable judgment, it believes all such
rights have not been secured.
Signed: ___________________________________

Roles and Responsibilities
Kevin Wood (Computer Engineer):
Responsible for the creation and testing of all the embedded software for the project, as well as
the base station PC software which interfaces with the wireless mesh network and handles all data
acquisition. Leadership responsibility on the team was mostly shared between team members,
because Kevin was not the only one who desired to possess a leadership role. On account of this,
Kevin led the software design for the project (which is almost completely software), and led the
data acquisition system design (which enables the system to function).
Michael Zack Stevens (Computer Engineer):
Designed and implemented the client software for the PC and created the server that takes data
from the base station and makes it usable for clients. Zack led the creation of an API for reading
the data interpreted by the system so that a client can display it without having to interface the
system beyond the highest level.
Thurston Hane (Systems Engineer):
Responsible for project management, paperwork, customer relations, and test engineering.
Michael Moore (Electrical Engineer):
Created power supplies for the devices, attached RFID readers to the wireless sensor nodes, and
created an iPhone web client for our system. Mike led customer relations.

Abstract
With the cost of microprocessor systems dropping steadily, sensor networks are becoming
more and more viable for replacing traditional “dumb” sensors. This presents a host of
advantages to the system collecting data, and allows for unprecedented system flexibility. In
parallel to these developments, RFID “tagging” has come a long way and has also entered the
realm of affordable sensor solutions. The merger of these ideas enables transient, modular, and
reconfigurable asset identification and tracking systems. In this paper, we explore the feasibility
of implementing such a network with commercial off-the-shelf (COTS) parts for real world
applications. Specifically, we create a drop-in system for managing documents and records in a
medical triage center, based on identifying assets and personnel by means of RFID. A self-
reconfiguring sensor network provides the foundation, allows for the system to be deployed in
minutes, both on a battlefield or in a hospital, and once deployed, the hospital beds may move
around freely. The advantages of this platform will be discussed alongside the unique
requirements that are introduced in this type of project.

WIRELESS SENSOR NETWORK
ENGR 498 SENIOR CAPSTONE PROJECT
TECHNICAL REPORT
Submitted By
Team 3670
Authors
Michael C. Moore, Kevin M. Wood, Michael Z. Stephens, Thurston T. Hane
Mentor
Kevin Prodromides
Project Sponsors
Dr. Michael Marcellin and Dr. Hao Xin
Electrical and Computer Engineering Department
University of Arizona
Report Submitted
April 30th, 2009
Interdisciplinary Engineering Design Program
University of Arizona
Tucson, AZ 85721

ABSTRACT
With the cost of microprocessor systems dropping steadily, sensor networks are becoming more
and more viable for replacing traditional “dumb” sensors. This presents a host of advantages to the
system collecting data, and allows for unprecedented system flexibility. In parallel to these developments,
RFID “tagging” has come a long way and has also entered the realm of affordable sensor solutions. The
merger of these ideas enables transient, modular, and reconfigurable asset identification and tracking
systems. In this paper, we explore the feasibility of implementing such a network with commercial off-the-
shelf (COTS) parts for real world applications. Specifically, we create a drop-in system for managing
documents and records in a medical triage center, based on identifying assets and personnel by means of
RFID. A self-reconfiguring sensor network provides the foundation, allows for the system to be deployed
in minutes, both on a battlefield or in a hospital, and once deployed, the hospital beds may move around
freely. The advantages of this platform will be discussed alongside the unique requirements that are
introduced in this type of project.

iii
TABLE OF CONTENTS
ABSTRACT ..................................................................................................................................................II
TABLE OF CONTENTS ............................................................................................................................ III
LIST OF FIGURES .................................................................................................................................... IV
LIST OF TABLES ...................................................................................................................................... IV
ACKNOWLEDGEMENT ........................................................................................................................... V
1 INTRODUCTION ........................................................................................................................... 1
1.1 BUSINESS CASE ................................................................................................. 2
1.2 SYSTEM REQUIREMENTS ................................................................................ 2
1.3 CRITICAL POINTS TO ACHIEVE A QUALITY DESIGN ............................... 4
3 DESIGN CONCEPT AND ANALYSIS ......................................................................................... 5
4 SYSTEM BUILD ............................................................................................................................ 8
4.1 HARDWARE MODIFICATIONS ...................................................................... 21
4.2 SOFTWARE INTERFACES ............................................................................... 22
5 TEST RESULTS ............................................................................................................................ 24
6 CONCLUSIONS AND RECOMMENDATION ........................................................................... 27
APPENDIX A: PSUEDO-CODE FOR SOFTWARE ALGORITHMS ..................................................... 28
APPENDIX B: LIST OF RELEVANT ACRONYMS ............................................................................... 31
APPENDIX C: VENDOR LOGOS ............................................................................................................ 32
REFERENCES ........................................................................................................................................... 33

iv
LIST OF FIGURES
Figure 1: Service Query by Mote ID .......................................................................................................... 12
Figure 2: Silverlight Client Demo - Logging in .......................................................................................... 13
Figure 3: Silverlight Client Demo - Failed login attempt .......................................................................... 14
Figure 4: Silverlight Client Demo - Logged in and viewing ..................................................................... 15
Figure 5: Silverlight Client Demo - Waiting for a doctor ........................................................................... 16
Figure 6: iPhone "iDoctor" Web Application ............................................................................................. 17
Figure 7: Service Query by RFID Tag ........................................................................................................ 18
Figure 8: PC Server software ...................................................................................................................... 19
Figure 9: Physical network setup ................................................................................................................ 20
Figure 10: A few of the RFID tags being used to test the system. .............................................................. 20
Figure 11: Power Supply for Mote and RFID Tag Reader ......................................................................... 21
Figure 12: Tiny OS logo ............................................................................................................................. 32
Figure 13: Crossbow logo ........................................................................................................................... 32
Figure 14: Skyetek logo .............................................................................................................................. 32
LIST OF TABLES
Table 1: CTQ Matrix, showing what is most important to our customers .................................................... 4
Table 2: Design Matrix, as modeled in Acclaro. ......................................................................................... 7

v
ACKNOWLEDGEMENT
We would like to thank Professor Michael Marcellin and Professor Hao Xin from the University of
Arizona ECE department for their generous support. They provided funds for purchasing materials,
guidance throughout the design process, and a warm customer relationship. They were always available
when we needed them, and they never got in the way when our team felt the need to work on our own
accord.
We would also like to thank the International Telemetering Conference (ITC), at which we will be
delivering a paper on our results in October. The organization indirectly supplied the money used to buy
our materials, and provided the motivation for us to work on our project.
Finally, we would like to thank each other, for continued motivation to succeed and unfaltering
perseverance when things didn’t work the first (or second, or third...) times. There were several late nights
spend working on the project, and no pay was received for our hard work.
Also, to Thurston: Thanks for all the sushi!
1
1 INTRODUCTION
In today’s battlefield triage situations, doctors and corpsmen cannot count on accuracy, speed of
delivery, and security of patient data and treatments. Usually, these doctors rely on a primitive form of
record keeping, such as jotting notes down onto a clipboard. While it is a proven system, the clipboard
has inherent flaws including, but not limited to, lack of speedy access, secure data storage and
transmission, and a high probability of misinterpretation of information. This project focuses on a multi-
hop wireless sensor network (WSN) composed of many wearable sensors, one for each patient, that host a
radio frequency identification (RFID) reader and are capable of radio-frequency communication. Team
3670 set out to solve this task using a wireless sensor network system to create a much more effective and
secure method of handling patient data and to create a way to enhance the care of service members.
This project set out to completely replace the current system for managing data in a battlefield
triage center and provide a mobile system that manages, stores, and provides quick and secure access to
patient data to authorized doctors. While there is a desire to decrease the one-on-one time staff has with
each patient, it must be done safely. A loss in medical data or access typical of that seen in common
wireless networks cannot be tolerated. This project will seek to provide instant verification of patient and
practitioner proximity and provide patient data access to authorized personnel within range of the patient.
The new system design will be defined and diagrammed later in this document.
This product will be marketable to services in need of a “field-deployable” system to handle
treatment of patients. Initially we will focus on a battlefield triage scenario, however, this will be
expandable to doctors working in remote regions, areas where proximity detection may be needed, and
any further applications that could use a “presence-awareness” system. This is made possible by our low-
cost, expandable range network architecture. To avoid a high cost network while still attaining long range
distance from the central workstation, the network employs multi-hop communication, using each
patient’s wearable sensor as a hop. By using patients as hops, rather than statically placed sensors, the
same effect can be achieved while making more efficient use of resources.
The end result of this project will be not only to provide a working demonstration of these abilities,
but also provide an academic paper for presentation at the International Telemetering Conference in Las
Vegas during the fall of 2009.

2
1.1 BUSINESS CASE
The International Foundation for Telemetering (IFT) has provided money to the University of
Arizona for research and development in Telemetering applications. So far, the money has purchased
Crossbow sensor boards (seven nodes and two base stations) that will be used to develop a telemetering
application. The customer, Electrical and Computer Engineering (ECE) Professors Marcellin and Xin, are
required to have a group demonstrate a telemetering application at the 2009 IFT conference. Our team
will design this application and present it at the conference so that IFT will continue to fund this research.
The specific application for the IFT will be a drop-in battlefield triage information management
system using the provided Crossbow Wireless Sensor Network. The benefit of this product will be a
faster and more accurate method of dealing with any battlefield triage situation.
1.2 SYSTEM REQUIREMENTS
Customer Needs as Functions, Attributes, and Measurable Concepts
1. Mobility Needs
a. Easily deployable
b. Easily removable
c. Provide maximum scalability
d. Expedient deployment process
e. Expedient removal process
2. Deployment Needs
a. Require minimal system configuration
b. Expedient deployment
c. Reliable components
d. Inexpensive components
3. Reliability Needs
a. Transmit data securely
b. Low latency data transmission
3
c. Little to no down-time
d. Consume minimal power
e. Not interfere with other equipment
4. Convenience Needs
a. Present data in a robust UI
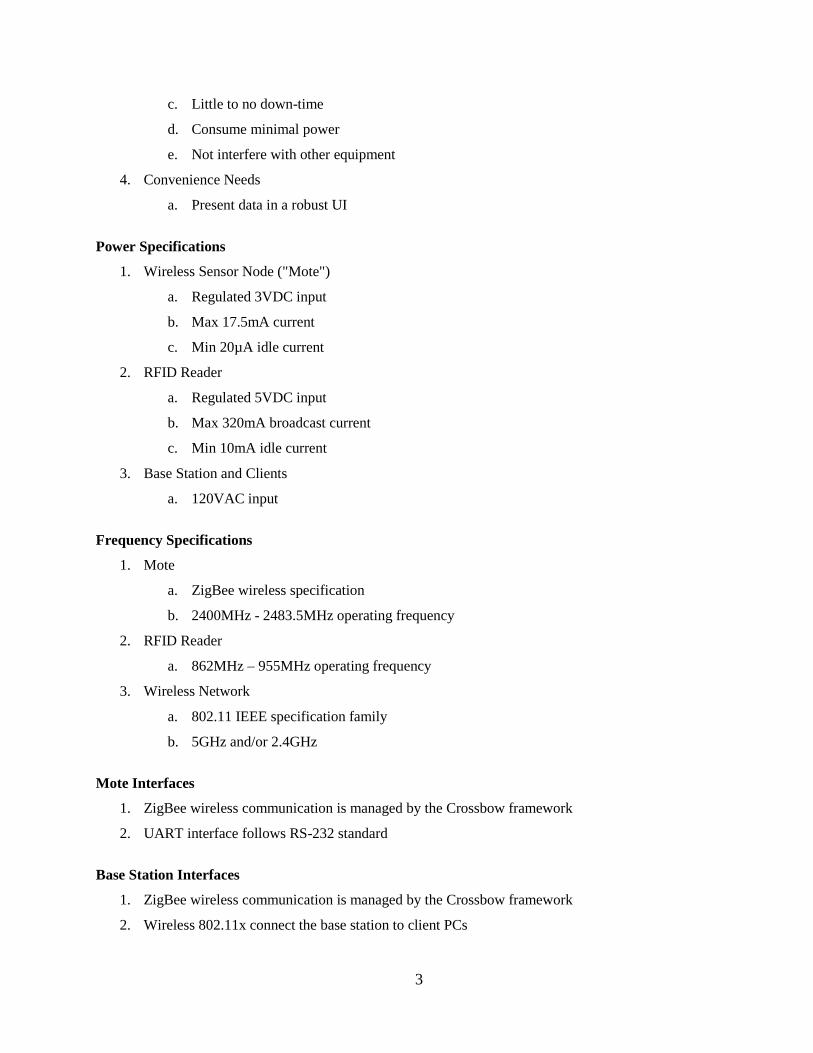
Power Specifications
1. Wireless Sensor Node ("Mote")
a. Regulated 3VDC input
b. Max 17.5mA current
c. Min 20µA idle current
2. RFID Reader
a. Regulated 5VDC input
b. Max 320mA broadcast current
c. Min 10mA idle current
3. Base Station and Clients
a. 120VAC input
Frequency Specifications
1. Mote
a. ZigBee wireless specification
b. 2400MHz - 2483.5MHz operating frequency
2. RFID Reader
a. 862MHz – 955MHz operating frequency
3. Wireless Network
a. 802.11 IEEE specification family
b. 5GHz and/or 2.4GHz
Mote Interfaces
1. ZigBee wireless communication is managed by the Crossbow framework
2. UART interface follows RS-232 standard
Base Station Interfaces
1. ZigBee wireless communication is managed by the Crossbow framework
2. Wireless 802.11x connect the base station to client PCs

4
Client PC Interfaces
1. Wireless 802.11x connect the base station to client PCs
2. Hyper Text Transfer Protocol will provide the user interface for doctors to visualize patient data
3. Human Input Devices will allow the doctor to alter existing patient profile data
1.3 CRITICAL POINTS TO ACHIEVE A QUALITY DESIGN
In the early phases of our project, we met with our sponsor to decide on the most crucial performance
metrics that would be part of a quality design. The following table shows our Critical to Quality (CTQ)
Matrix, which relates our highest-level requirements to the performance metrics that indicate success.
Top Level Functional
Requirement
Customer
Importance
Metric
Type Target Value & Tolerance
Fast Setup 4 Hours
<1 hour installation for small scale
scenario
Node Hopping
Communication 5 Seconds <15 second response
Identify patients 4 Seconds <15 second Id retrieval delay
Transmit Patient
Information 5 Seconds <15 second data retrieval
Table 1: CTQ Matrix, showing what is most important to our customers

5
3 DESIGN CONCEPT AND ANALYSIS
Initial Design Considerations
We considered two designs prior to the selection of our current design and its subsequent
development. Although we ultimately settled on one design, each presented unique ideas to conveying
patient data to doctors and personnel. Each designs met the customer constraint of identifying patients
using a wireless sensor network and presenting their records to doctors and authorized personnel.
The First Considered Design
The first of the unused designs involved utilizing the Zigbee wireless network presented by the
Crossbow Motes to transmit both patient identification and patient data. Patients would be identified
using a barcode scanner. Barcodes would be placed on their wristbands or identification tags and would
be scanned as patients need to be identified by doctors and personnel. Each unique tag read would be sent
across the Zigbee network to the base station where the patient’s records would be retrieved and
transmitted back to the detecting Mote. Here, a computer would be connected directly to the sensor node
(called a "Mote" by the Crossbow platform) as well and would present the records upon receiving them
from the Mote. All patients’ records would be kept in a centralized database.
This design presented the unique idea of using the Zigbee network for both transmitting the detected
identification tags as well as the patient’s records themselves. This would remove the necessity for the
standardized Internet Protocol based network. Although this seemed to have quite the advantage in
reducing the network to simple Mote connections, we did not yet understand the nature of the Mote
connections. As we later discovered in our tests of the final design, this method would have presented
problems as the Zigbee network would become flooded with packets. Data transmission would thus
become slower. We also discovered that reconfiguring a network can be a costly process considering the
process should complete transactions in a timely fashion. When Motes need to reconfigure, they can take
up to thirty seconds to do so. This can cause problems if the computer is portable and moving from room
to room.
The design also presented the idea of a barcode reader. Although this may be just as fast as our final
design, it is much more informal and even intrusive. While our final design would be out of the patient’s
way, this design would require personnel to physically scan a patient. We felt this to not be in the
patient’s best interest as it might be construed as intrusive and possibly dehumanizing as one person
would physically scan the other.
6
The Second Considered Design
The second design presented the possibility of either using the Zigbee network and Motes only for
networking or eliminating the Zigbee network and utilizing a standard wireless network. This design
involved eliminating the central database and storing all patient data on the network of computers. Data
could either be stored completely on each computer or could be stored in parts on each computer,
communicating missing parts across the network as requested. In other words, if a record does not exist
on one computer, it can communicate wirelessly across the network to locate and retrieve it from the
computer with that record. In this case, each RFID reader would be connected directly to each computer.
Although innovative, there were drawbacks to this idea. If the mesh network where data was
separated onto each connected computer is chosen, no computer can be turned off unless redundancy is
available. If a computer cannot find an identification, that doesn’t necessarily mean that it doesn’t exist in
the network. It may just be that the computer with the record is unreachable. Unfortunately this would
mean that downtime is inevitable as computers fail or fall out of range of the network. Locating the
disconnected computer might also be impossible in large scenarios.
If entire record databases were duplicated to each machine in the network, each computer may begin
to run low on space or be forced to omit records to hold onto the database as the number of patients might
be very high. There is also the problem of updating records. If each computer has a copy of the records,
each update needs to be propagated in order maintain up-to-date records on all the computers, otherwise
merging issues emerge when equivalent records with conflicting details are being updated and merged
simultaneously or out of order. There is also the problem of lost computers. With duplicate databases, a
lost or stolen computer can mean serious problems as large amounts of sensitive data can go missing.
The Chosen Design
The design we finally settled on was similar to the first considered design, but utilized different
techniques including utilizing a second network and using Radio Frequency Identification, or RFID,
devices instead of bar code scanners. In our final case, only RFID tags are sent over the Zigbee network;
patient records are returned over a different path using a standard wireless network. This frees up much
of the Zigbee network for transmitting data by keeping the amount of data transmitted minimal. This also
allows us to implement standardized security measures on the patient data being sent back to the client
computers. Doctors can now also carry computers around with them without worry of losing network
connection or worrying about being unable to access patient data. RFID readers can now be assigned
wherever they are needed and doctors can get patient data just about anywhere as patients are not
confined to their beds or rooms. All patient records will be stored in a centralized location to maintain
consistent records and to maximize portability.
7
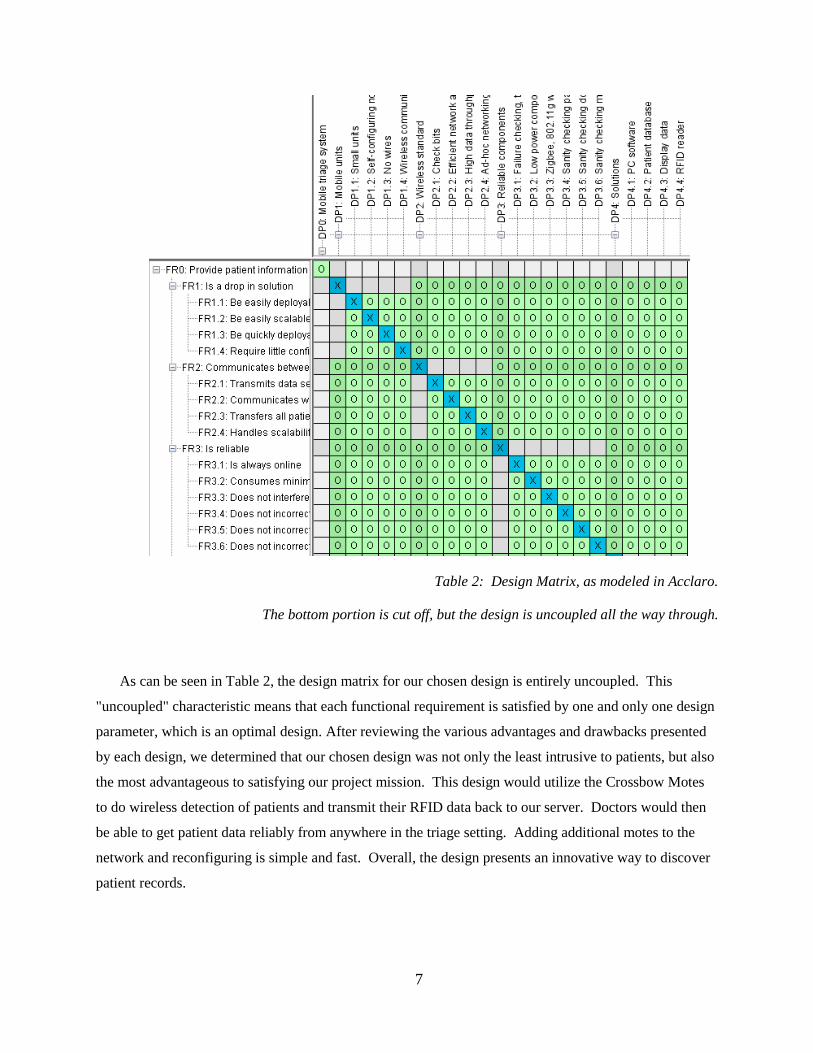
Table 2: Design Matrix, as modeled in Acclaro.
The bottom portion is cut off, but the design is uncoupled all the way through.
As can be seen in Table 2, the design matrix for our chosen design is entirely uncoupled. This
"uncoupled" characteristic means that each functional requirement is satisfied by one and only one design
parameter, which is an optimal design. After reviewing the various advantages and drawbacks presented
by each design, we determined that our chosen design was not only the least intrusive to patients, but also
the most advantageous to satisfying our project mission. This design would utilize the Crossbow Motes
to do wireless detection of patients and transmit their RFID data back to our server. Doctors would then
be able to get patient data reliably from anywhere in the triage setting. Adding additional motes to the
network and reconfiguring is simple and fast. Overall, the design presents an innovative way to discover
patient records.

8
4 SYSTEM BUILD
The physical system, although making up the core of the project, is only half the work. There has
been a complex software system developed alongside to complement the capabilities of the system.
Physical System
The system was built using a number of Crossbow parts, SkyeTek parts, and custom software. From
Crossbow, we used several MICAz Motes, two MIB520 base stations for the Motes, and two MDA100
data acquisition boards for the Motes to interface with the RFID readers. From SkyeTek we used two M7
RFID readers, and the M7 development kit. Physically, the system was built by marrying the M7
modules to the MICAz boards by way of the MDA100 data acquisition boards. Each MICAz has an
expansion port that we were able to utilize in connecting each RFID reader by creating direct connections
from the M7 to the MDA100, which naturally take advantage of the Mote’s expansion port.
To connect the RFID reader, the MDA100 project board was used to create the interface for the M7
by connecting the TTL level serial data connections of the M7 to the respective pins of the project board.
We were able to attach the M7 to the project board by simply soldering wires between the provided
interface holes on the M7 and soldering the other ends to the project board. Since the M7 needs a higher
power supply, we attached an external supply by mounting a socket to the project board on a ground pin
as an anchor point and connected the M7 to the socket while attached to its anchor. We repeated this
process for the other M7 as well. The new connection was then adapted to handle the power needs of not
only the M7, but the Mote as well. By attaching a voltage regulator, we were able to eliminate the need
for batteries on the device completely. This interface was tested by communicating directly with the
Motes and monitoring the RFID tags read. As we would scan an RFID tag, we could print the result to
the screen and compare it to the known tag value. We were able to prove our connection was satisfactory
through many repeated trials.
For the base station that would interface with the computer, we simply attached the MIB520 gateway
to a free Mote and connected it to our server system. The rest of the system is built dynamically. Each
Mote or RFID capable Mote introduced would build its own path to the base station without interrupting
the existing communication stream. This was tested by attaching the Mote to the gateway and connecting
it to the computer. We then monitored the emulated serial port for the data that was being reported. As
Motes were introduced, we detected their heartbeat signals reliably, signifying that our base station was
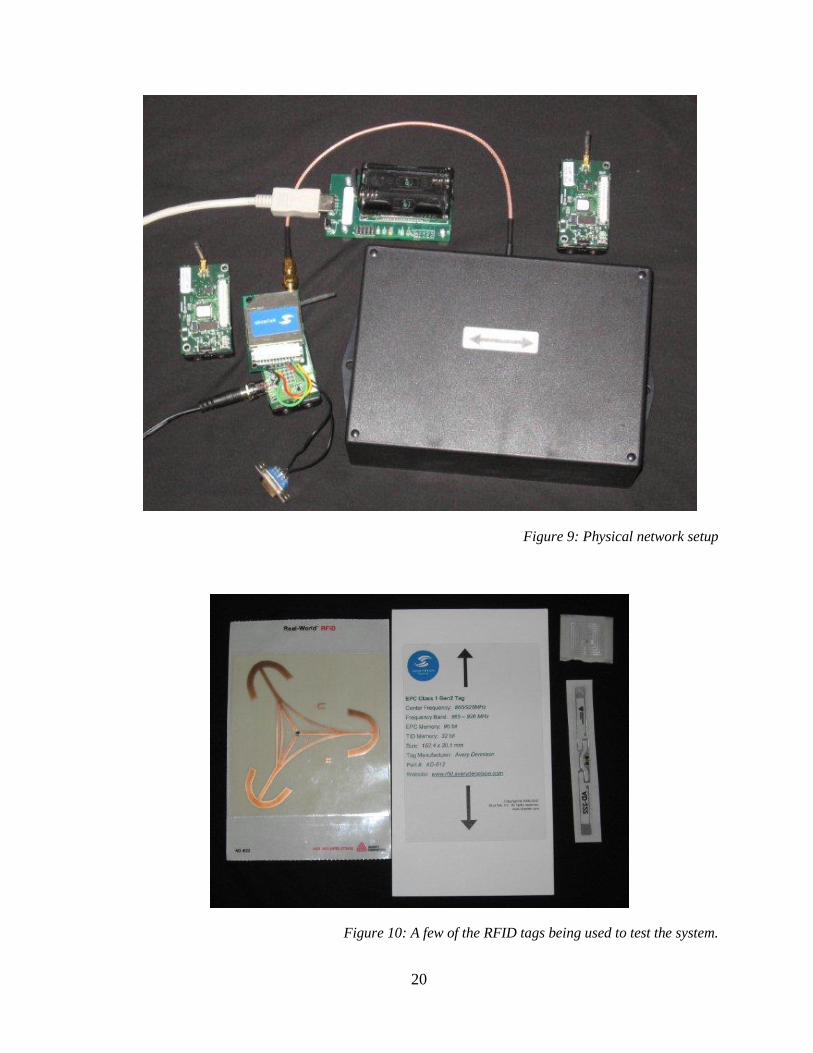
communicating correctly. The final, operational system appears in Figure 9.

9
Software System Back End
The software is split into several categories. The system back end consists of the code devised to
transmit data from the tags to the database, where data is logged for later retrieval by the various system
interfaces. The software for both the individual Motes and base station Mote were combined for
simplicity. This was designed using the language nesC and the suite of programs provided by Crossbow.
This is where the Motes know how to communicate with the RFID readers and rebroadcast the detected
tags. The same software is compiled and installed on every Mote in the network, including the base
station Mote. We were able to test this software by utilizing the lights on each Mote. We flashed the
yellow light-emitting diode (LED) to signify that a packet was sent and flash the red LED to signify that
the ACK (acknowledgement) was received. When the red LED would stay solid, the Mote could not
communicate with the base station. Since the red LED would always flash when the network was
established, we could expect our system to be communicating correctly. We could also test the RFID
capability by simply scanning RFID tags and monitoring the base station output.
On the computer side of the base station, there are two main pieces of software. The USB interface
for the Motes requires generic drivers that are usually automatically installed when the base station is
attached to a Windows based computer. To interface with the drivers, a library had to be written using
the .Net libraries and the C# language that would enumerate the base stations and trigger events for both
heartbeat messages and detected RFID tags. We tested this by writing a simple program that would scan
for connected base stations and begin to talk to them. Any data received by these base stations would be
printed to the screen.
Another piece of software was written to interface with these drivers to keep track of where each
RFID tag was last read. This is known as the server software. This software was written using .Net and
C# as well and would store all the data on a simple Structured Query Language (SQL) server. This is an
elaborate piece of software that keeps the locations and timestamps up to date. It was written to have a
robust user interface for demonstration purposes, but can be modified to run as a service without any
interface. Because there is an extensively visual interface, testing merely involved visual confirmation.
In operation, all data is actively reported to the screen and patient records can even be updated directly.
Testing that the software performs correctly, we connected the system of Motes and attached a base
station. We could then scan RFID tags and verify that the correct records were being retrieved.
Software System Interfaces
The final piece of software was the user interface, written in C# and Extensible Application Markup
Language (XAML) with .Net as well as “PHP: Hypertext Preprocessor” (PHP), “Asynchronous
JavaScript + XML” (AJAX), and JavaScript. This was written to be web based and involves three main

10
parts. The first is a control to convert the locations of patients and their records to a format the web
interfaces can read easily. This resides on a server that does not need to be the same as the base station;
but for our simulations, it did. To implement this, we essentially developed our own Application
Programming Interface (API) that would allow for expandability in the types of interfaces that would
integrate with our system. This was tested by navigating to the program in a web browser, as web
services inherently provides a test website that allows us to test each included method. Running each
method reported the results in a new window. This included testing that the database would be queried
correctly. When we had exhaustively tested each expected scenario, as well as unexpected scenario, we
felt ready to expand the product to a proper user interface.
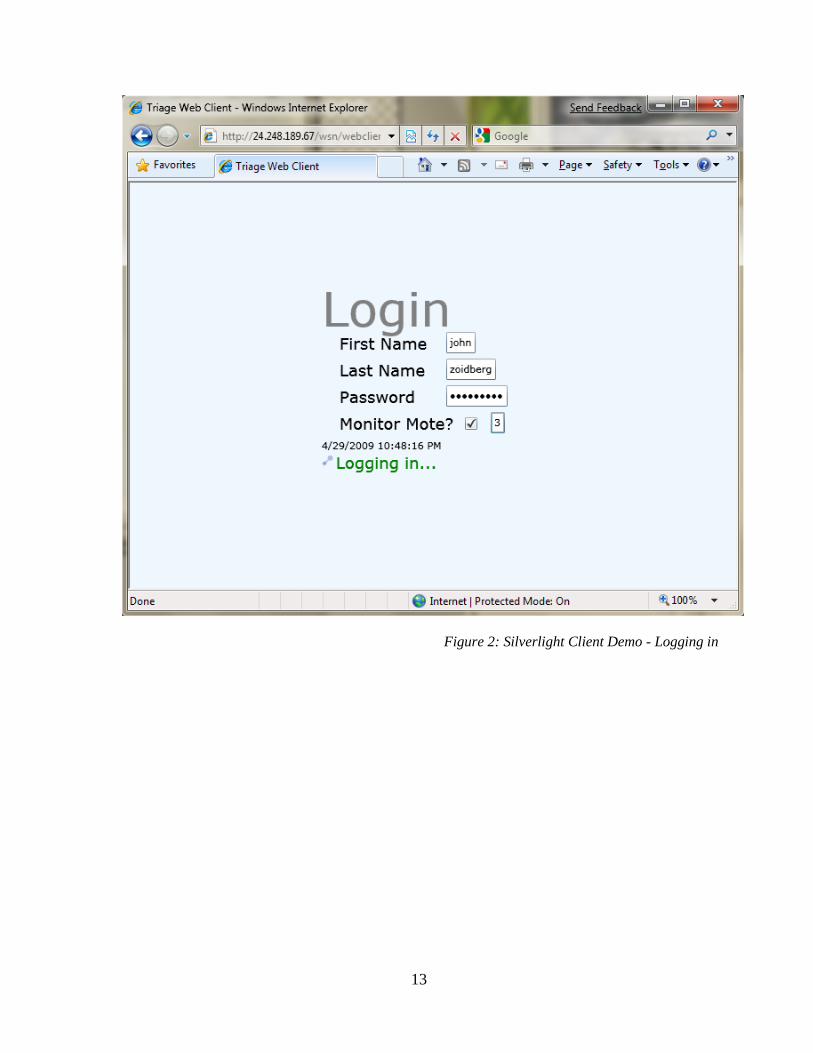
The initial user interface was programmed using Microsoft Silverlight to provide an elegant interface
that would keep the user up to date regarding the information provided for a particular asset or patient.
The interface provides an intuitive login that implements rudimentary security, as seen in Figure 3 where
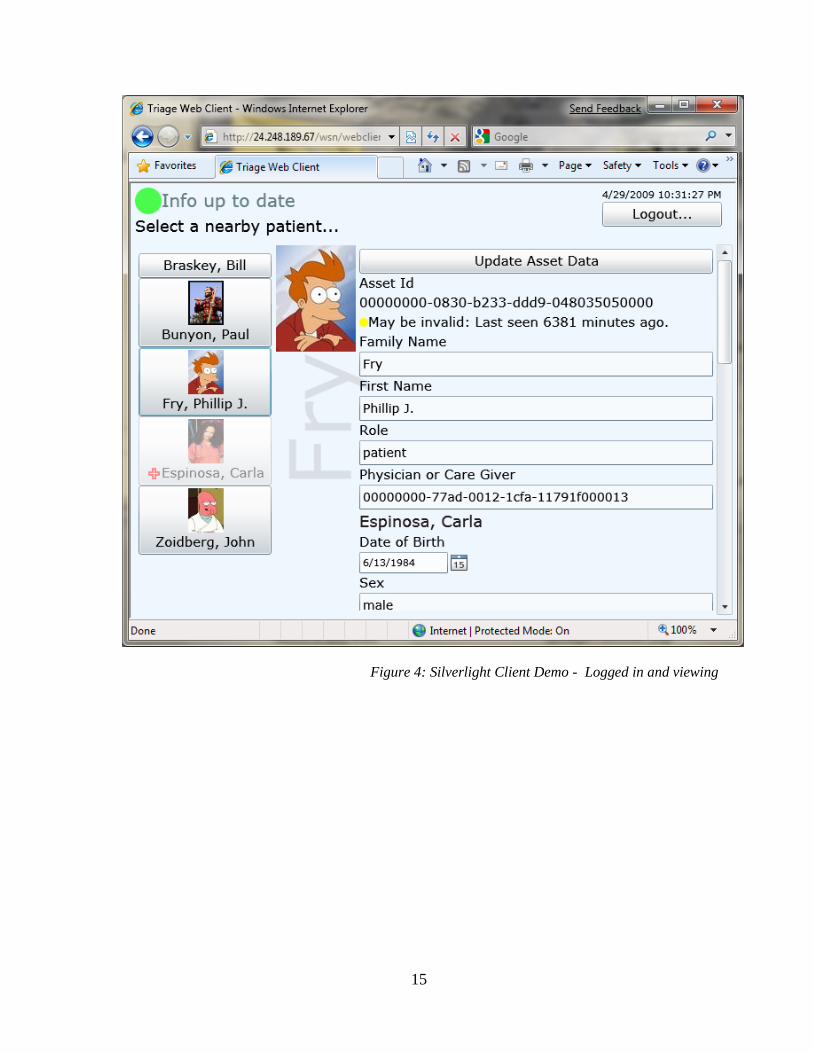
the user and password were not recognized by the system. Upon providing an authorized name and
password as the basic login schema, the user is allowed into the patient data viewing area, as seen in
Figure 4. Here, the user sees a message area for system status, a logout button and timer, a list of data
entry boxes to edit a patient’s data, and a list of the other people nearest to the user logged in. This list is
actively updated and asks the server for changes at a frequent rate. The user can click on a detected
person and the person’s data will show up in the reading panel, showing the entirety of the patient’s data
in the editable data boxes. If a patient’s data needs to be changed, the user can enter the changes and
click the button at the top of the page to update the data on the server. Hitting “Logout…” will return the
user to the login screen. Each feature was tested in Internet Explorer 8 Beta, Internet Explorer 7, and
Firefox 3 (Macintosh and Windows).
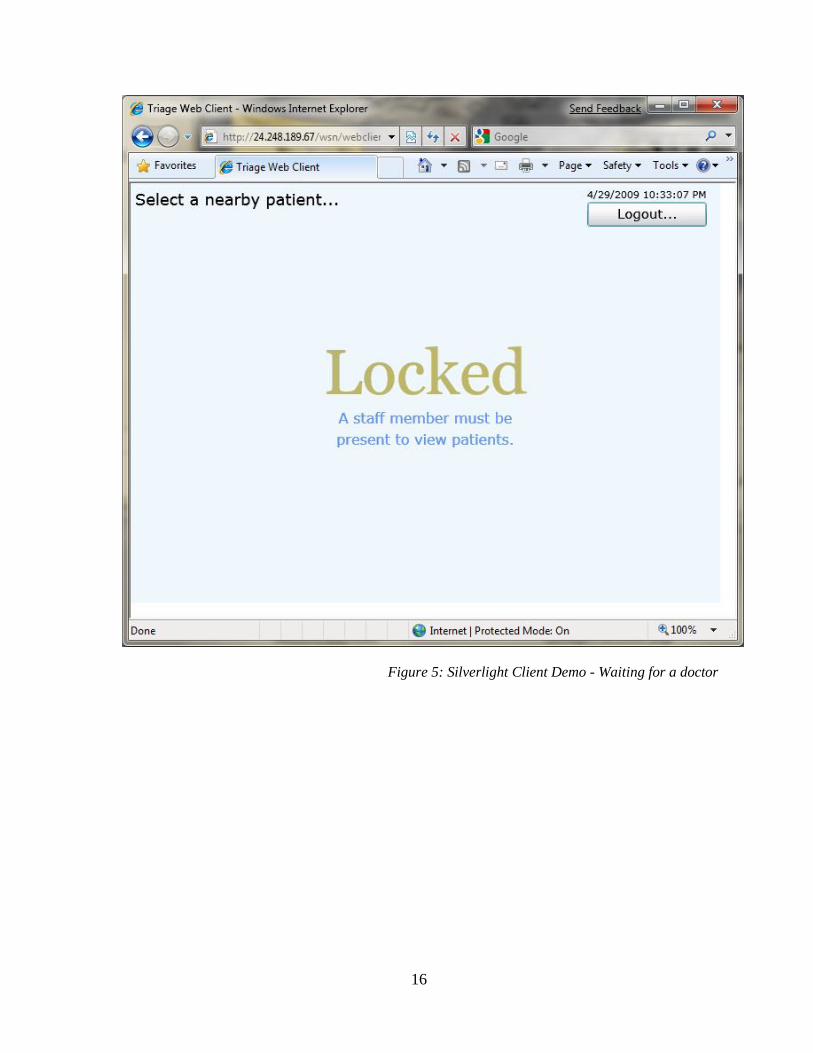
In addition to the default login schema, which assumes the person logging in is using a personal
computer or tablet PC to view patient data, the Silverlight control provides the ability to monitor a
particular, static location. Figure 2 and Figure 5 show how a technician can log into a stationary
computer, but cannot see patients. Once logged in, a doctor can visit the location monitored by the
computer and immediately see the patients available at the same location. The visible interface mirrors
that in Figure 4. Each feature was tested in Internet Explorer 8 Beta, Internet Explorer 7, and Firefox 3
(Macintosh and Windows).
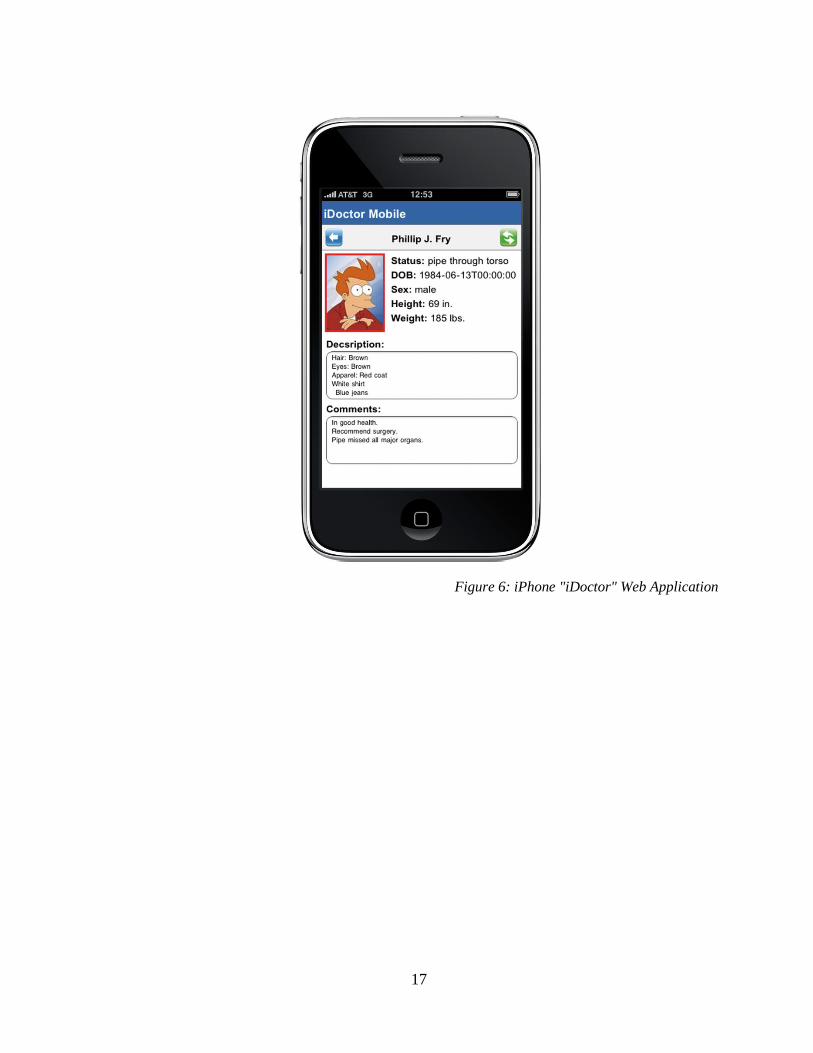
To further the capabilities of the system, we have implemented an iPhone specific interface. This
emphasizes the expandability provided by our API by accessing the same data and providing the same
features for a popular mobile device using PHP, AJAX, and JavaScript. The interface was designed to
provide a simple, yet secure, interface for personnel to use to log in. Upon logging in, the user’s interface

11
frequently polls the server to determine any patients nearby the user. As patients are detected, they
appear on the iPhone. When selected, the patient’s information is displayed and a select subset of his or
her record is displayed, as seen in Figure 6. The interface provides the ability to update these fields too.
This was thoroughly tested in Safari for the iPhone.
Operational Breakdown
Placed together, the system is large, but effective. Each RFID reader reads a tag and communicates it
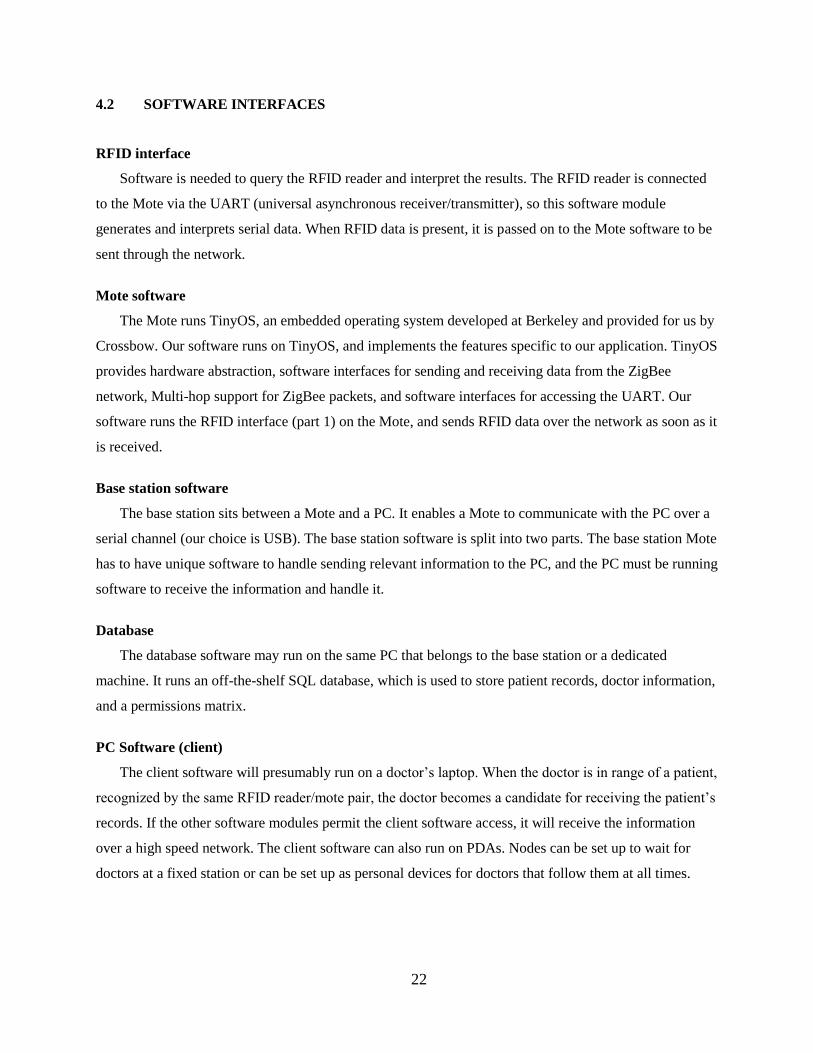
to the attached Mote. RFID tags, like those in Figure 10, are embedded in identification cards, laptop
stickers, patient’s wristbands, and other places that allow for easy identification. The Mote then
broadcasts the tag along its path to the base station, which may involve hopping data from one Mote to
the next until the base is reached. The base station then simply forwards the tag over the USB interface.
The base station software running on the server then gets an event that a new tag is available and logs its
data and associations into the SQL database for retrieval by the client software. A doctor or other
personnel connects to the client software by accessing the client webpage. The webpage includes the
Silverlight control. The user logs in and the control begins to periodically ask the server if there have
been any changes. If there is data to present, the user is notified and is able to see the detected patient’s
records.

12
Figure 1: Service Query by Mote ID
The web service allows us to remotely query the database from any client software we implement for
this system. This allows us to maintain security by limiting control of the database. In Figure 1, we are
demonstrating the ability to find all the assets whose last known location was at mote one. This allows us
to place a static computer next to a bed and maintain up-to-date data for that particular location. Next,
Figure 7 demonstrates taking the results gathered by the web service and making the data presentable.
13
Figure 2: Silverlight Client Demo - Logging in

14
Figure 3: Silverlight Client Demo - Failed login attempt
15
Figure 4: Silverlight Client Demo - Logged in and viewing
16
Figure 5: Silverlight Client Demo - Waiting for a doctor
17
Figure 6: iPhone "iDoctor" Web Application

18
Figure 7: Service Query by RFID Tag
Figure 7 shows how we can query the database by a particular RFID tag to get all the neighboring
assets. This is most useful in cases where doctors may be moving from room to room using portable
computers instead of bedside ones. In this case, a doctor could simply log into a web client that monitors
his or her RFID tag in the system. When a doctor approaches a patient, he or she simply needs to scan the
RFID tag on the computer or on his or her hospital identification card to gather the patient's data.

19
Figure 8: PC Server software
The server software monitors both the existing network of motes and the RFID tags used in the
system. For demonstration and testing purposes, the server has an extensive interface to visually monitor
the system. Figure 8 shows the server software detecting both a doctor and a patient at node one.
20
Figure 9: Physical network setup
Figure 10: A few of the RFID tags being used to test the system.

21
4.1 HARDWARE MODIFICATIONS
The majority of our hardware was purchased from off-the-shelf components, which have already been
introduced. The only custom hardware that our design required was a power supply that would regulate
two sources at safe levels, one for the RFID reader and one for the Crossbow Mote.
The power supply for the Crossbow MicaZ was required to have an input of 3.3V with a +/- 0.4V
tolerance whereas the SkyteTek M7 RFID Tag Reader was required to have a 5.0V input with a +/- 0.2V
tolerance. This presented a problem as both devices had to be present on the same board and powered by
a single source. The initial solution was to create a voltage divider which was quickly scrapped due to
large fluxations in current draw from the MicaZ. The next logical solution was a voltage regulator. A
very cost effective solution for this as we had acquired the Crossbow MDA100 prototyping board was to
use the off-the-shelf LM117T. This provided a simple, adjustable solution (shown in Figure XX) that
could be set very close or exactly to 3.3V by using a potentiometer. This power solution was our final
solution and effectively powers both the MicaZ and the M7.
Figure 11: Power Supply for Mote and RFID Tag Reader
Figure 11 shows the mote power supply using the LM117T variable voltage regulator. The 5V rail in
this picture was provided by an off-the-shelf "wall wart" that ran at a regulated 5V average. The 5V rail
powered the SkyeTek M7 RFID reader, while the 3.3V regulated output powered the Crossbow MicaZ
wireless sensor mote. The need for a regulated power supply to the mote is apparent as when the mote is
transmitting it draws a significantly larger amount of current which would cause our input voltage to be
imprecise if using only a simple voltage divider method.
22
4.2 SOFTWARE INTERFACES
RFID interface
Software is needed to query the RFID reader and interpret the results. The RFID reader is connected
to the Mote via the UART (universal asynchronous receiver/transmitter), so this software module
generates and interprets serial data. When RFID data is present, it is passed on to the Mote software to be
sent through the network.
Mote software
The Mote runs TinyOS, an embedded operating system developed at Berkeley and provided for us by
Crossbow. Our software runs on TinyOS, and implements the features specific to our application. TinyOS
provides hardware abstraction, software interfaces for sending and receiving data from the ZigBee
network, Multi-hop support for ZigBee packets, and software interfaces for accessing the UART. Our
software runs the RFID interface (part 1) on the Mote, and sends RFID data over the network as soon as it
is received.
Base station software
The base station sits between a Mote and a PC. It enables a Mote to communicate with the PC over a
serial channel (our choice is USB). The base station software is split into two parts. The base station Mote
has to have unique software to handle sending relevant information to the PC, and the PC must be running
software to receive the information and handle it.
Database
The database software may run on the same PC that belongs to the base station or a dedicated
machine. It runs an off-the-shelf SQL database, which is used to store patient records, doctor information,
and a permissions matrix.
PC Software (client)
The client software will presumably run on a doctor’s laptop. When the doctor is in range of a patient,
recognized by the same RFID reader/mote pair, the doctor becomes a candidate for receiving the patient’s
records. If the other software modules permit the client software access, it will receive the information
over a high speed network. The client software can also run on PDAs. Nodes can be set up to wait for
doctors at a fixed station or can be set up as personal devices for doctors that follow them at all times.
23
iPhone Software (client)
The iPhone client software runs on the Apple iPhone’s mobile Safari browser as a Web Application
or “WebApp”. The WebApp uses state-of-the-art AJAX (Advanced JavasScript and XML) transactions
to query the presence awareness software via the HTTP post method. The resulting data from this query
is returned in XML format and parsed on the iPhone client. It is then formatted properly and displayed to
the user in order to clearly display present, idle, and old users surrounding the individual using the mobile
device. The user is able to interact with the data causing it to update on request using the same AJAX
methods. The end user’s phone is updated approximately every 3 seconds (depending on the operating
system and what is occurring in the background) and the any visible lists and patient status’ are updated to
visually cue the user.
24
5 TEST RESULTS
The most cost effective test for our system is a field test. More in-depth testing would have been far
more expensive than necessary, as much of our system is software. These software reviews, especially for
the embedded software, should ideally be conducted by an unbiased third party. Unfortunately, our
project funds do not allow for such testing and verification.
The intended behavior of our system recognizes the presence of patients and triage personnel only
when they are within 0-4 meters of the sensor. It then relays this information through the network and
delivers the patient’s information to the doctor nearby. Only doctors authorized to see the patient
information may do so. Data may not be obtained any other way and without authorization.
The following field tests were required to ensure proper functionality of the prototype. These tests
were devised to cover all aspects of the product functionality, so that if any product feature was missing,
the corresponding test would fail. All tests passing indicates success in completing every functional
requirement.
Test 1: A patient RFID “tag” was near the sensor, and no doctor was nearby. No clients on the
system should have received patient data, and none did.
Test 2: A doctor RFID “tag” was near the sensor, and no patient was nearby. No clients on the
system should have received patient data, and none did.
Test 3: Two patient “tags” are near the sensor, and no doctor was nearby. No clients on the
system should have received patient data, and none did.
Test 4: Two doctor RFID “tags” are near the sensor, and no patient was nearby. No clients on the
system should have received patient data, and none did.
Test 5: A doctor RFID “tag” was near the sensor, and a patient approaches afterward. Only the
doctor near the patient (who was authorized) should have received the patient’s data, and this was
validated.
Test 6: A patient RFID “tag” was near the sensor, and a doctor approached afterward. Only the
doctor near the patient (who was authorized) should have received the patient’s data, and this was
validated.
Test 7: A doctor RFID “tag” was near the sensor, and a patient approached simultaneously
(introduced by turning the sensor on when both “tags” were in range). Only the doctor near the
patient (who was authorized) should have received the patient’s data, and this was validated.
Test 8: A doctor RFID “tag” was near the sensor, and two patients were also. Only the doctor
near the patient (who was authorized) should have received the both patients’ data, and this was

25
validated.
Test 9: A patient RFID “tag” was near the sensor, and two doctors were also. Both doctors near
the patient (who was authorized) should have received the patient’s data, but nobody else should
have. This was validated.
Test 10: A doctor RFID “tag” was near the sensor, and a patient approached afterward. The
doctor was not authorized to view the data. No data should have been delivered, and none was.
Test 11: A doctor RFID “tag” was near the sensor, and a patient approached afterward. The
doctor was authorized to edit the patient data, and did so. Test 5 was repeated, and the data should
have changed according to the edits made. This was validated.
Test 12: A doctor RFID “tag” was near the sensor, and a patient approached afterward. The
doctor was allowed to read the patient information, but not edit it. When he tried to edit the
information, he received an “access denied” message, and Test 5 indicated that the data has not
changed (validated).
Test 13: Repeated Tests 1-12 with a different sensor and client computer(s) on the network, and
received validation.
Test 14: Brought all working prototypes onto the network for maximum congestion. Ran Test 5
and recorded the amount of time until the data was received by the client computer. This should
have been under 15 seconds, as specified in our CTQ matrix, and it was.
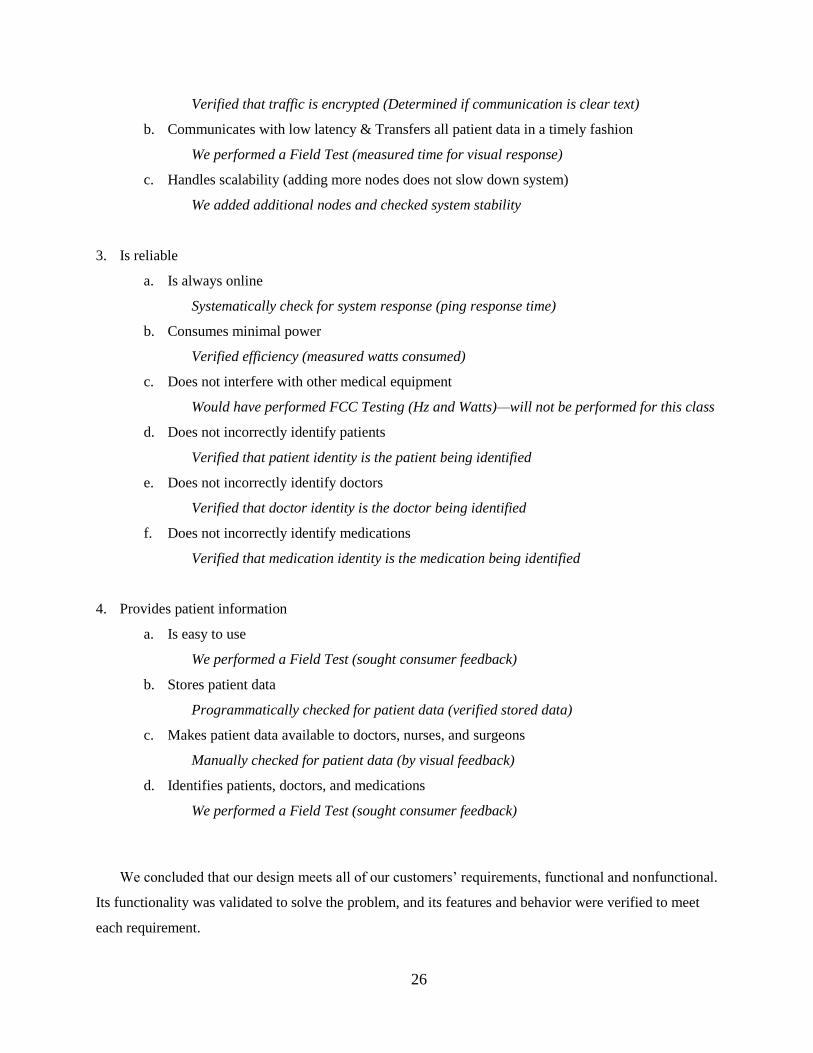
As stated, the above tests (which all passed) validate the functionality of the system. However, the
design still had to be verified to meet all of the CTQ requirements of our customer. The following list
breaks down each requirement and the test that was run in order to verify that our system was within
tolerable bounds.
1. Is a drop in solution
a. Be easily deployable
We performed a Field Test (sought consumer feedback)
b. Be easily scalable
We added additional nodes and checked system stability
c. Be quickly deployable & Require little configuration
We performed a Field Test (recorded time of installation)
2. Communicates between nodes
a. Transmits data securely
26
Verified that traffic is encrypted (Determined if communication is clear text)
b. Communicates with low latency & Transfers all patient data in a timely fashion
We performed a Field Test (measured time for visual response)
c. Handles scalability (adding more nodes does not slow down system)
We added additional nodes and checked system stability
3. Is reliable
a. Is always online
Systematically check for system response (ping response time)
b. Consumes minimal power
Verified efficiency (measured watts consumed)
c. Does not interfere with other medical equipment
Would have performed FCC Testing (Hz and Watts)—will not be performed for this class
d. Does not incorrectly identify patients
Verified that patient identity is the patient being identified
e. Does not incorrectly identify doctors
Verified that doctor identity is the doctor being identified
f. Does not incorrectly identify medications
Verified that medication identity is the medication being identified
4. Provides patient information
a. Is easy to use
We performed a Field Test (sought consumer feedback)
b. Stores patient data
Programmatically checked for patient data (verified stored data)
c. Makes patient data available to doctors, nurses, and surgeons
Manually checked for patient data (by visual feedback)
d. Identifies patients, doctors, and medications
We performed a Field Test (sought consumer feedback)
We concluded that our design meets all of our customers’ requirements, functional and nonfunctional.
Its functionality was validated to solve the problem, and its features and behavior were verified to meet
each requirement.
27
6 CONCLUSIONS AND RECOMMENDATION
Our finished system works exactly like the one that we imagined at the start of the project. Our test
data shows that the system works exactly as intended, and it has been both validated and verified against
all of our constraints and requirements.
On top of our success in meeting expectations, we are very pleased with our results. Now that the
groundwork has been finished for sending RFID-detected identities around a reconfigurable wireless
network, future projects using the same technologies can expand on our developments. For example,
household items can be detected in waste bins and automatically replenished by a computer making
intelligent purchasing decisions. Library books can be tracked and reorganized when they are left off the
shelf, and library employees can be instructed exactly where the books are located and where they belong.
The applications for this technology are limitless, and we strongly recommend further study in the
applications of this technology.
Our work will be summarized and evaluated in a conference paper delivered at the International
Telemetring Conference (ITC) in October of 2009. Our paper will focus specifically on the specific
characteristics of projects using commercial off-the-shelf components to develop reconfigurable sensor
networks that track assets and identities. The discussion will largely be kept general to the discussion of
the advantages and specific requirements of these projects, in order that researchers and industry pioneers
may find value in our studies. However, our specific project, which we have outlined in great detail in this
report, will be used again and again to evaluate our claims.
The objective of this project is to provide accurate and secure access to assets and patient
information. While technological advancements have resulted in changes to many aspects of daily life,
there is still a significant gap between the existing solutions and the needs in the medical field. One of the
most pressing issues in medical care today is the high cost of healthcare and health insurance. Thanks to
the recent developments in wireless sensor networks and RFID, such costly expenditures may be avoided.
This project is an endeavor to suggest a solution utilizing these technologies and provide a remote data
accessing system designed for the medical environment.

28
APPENDIX A: PSUEDO-CODE FOR SOFTWARE ALGORITHMS
1. RFID interface
a. Poll for input
Loop always:
Send RFID reader a scan instruction
Wait for results
Parse results
If the results contain a coherent data tag:
Signal tag read event
End if
End loop
b. Tag read event
Send RFID reader a scan instruction
Wait for results
Parse results
If the results contain a coherent data tag:
If the tag data is the same as the one previously found:
If the tag data belongs to the set of accepted values:
Report tag read event to Mote software
End if
End if
End if
2. Mote software
a. Wait for input
Loop always:
Idle processor or put processor to sleep if possible
End loop
29
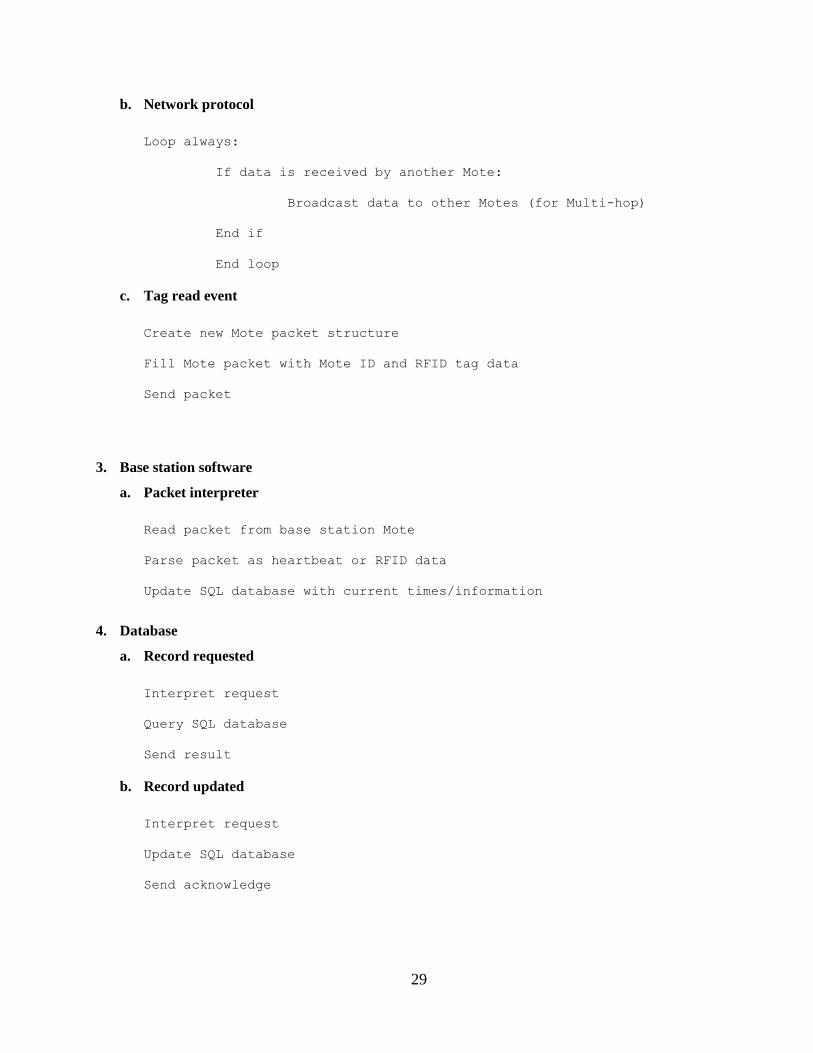
b. Network protocol
Loop always:
If data is received by another Mote:
Broadcast data to other Motes (for Multi-hop)
End if
End loop
c. Tag read event
Create new Mote packet structure
Fill Mote packet with Mote ID and RFID tag data
Send packet
3. Base station software
a. Packet interpreter
Read packet from base station Mote
Parse packet as heartbeat or RFID data
Update SQL database with current times/information
4. Database
a. Record requested
Interpret request
Query SQL database
Send result
b. Record updated
Interpret request
Update SQL database
Send acknowledge

30
5. PC Software (client)
a. Receive patient information
Display patient records on screen
b. Receive medication allowance information
Visually and audibly notify the user of “accept” or “deny”
c. Handle change in patient information
Send update to database
6. Data structures, formats, and interfaces
a. Mote packet
Mote ID (1 byte)
Message header (1 byte)
Message flags (1 byte)
CRC (1 byte)
RFID data (12 bytes)
b. Database request packet
String (SQL query) (variable size terminated by null character)
c. Database response packet
XML file split into packets
Packet header including packet size
Data (size indicated in packet header)
d. Database entry structure
Handled by SQL server
31
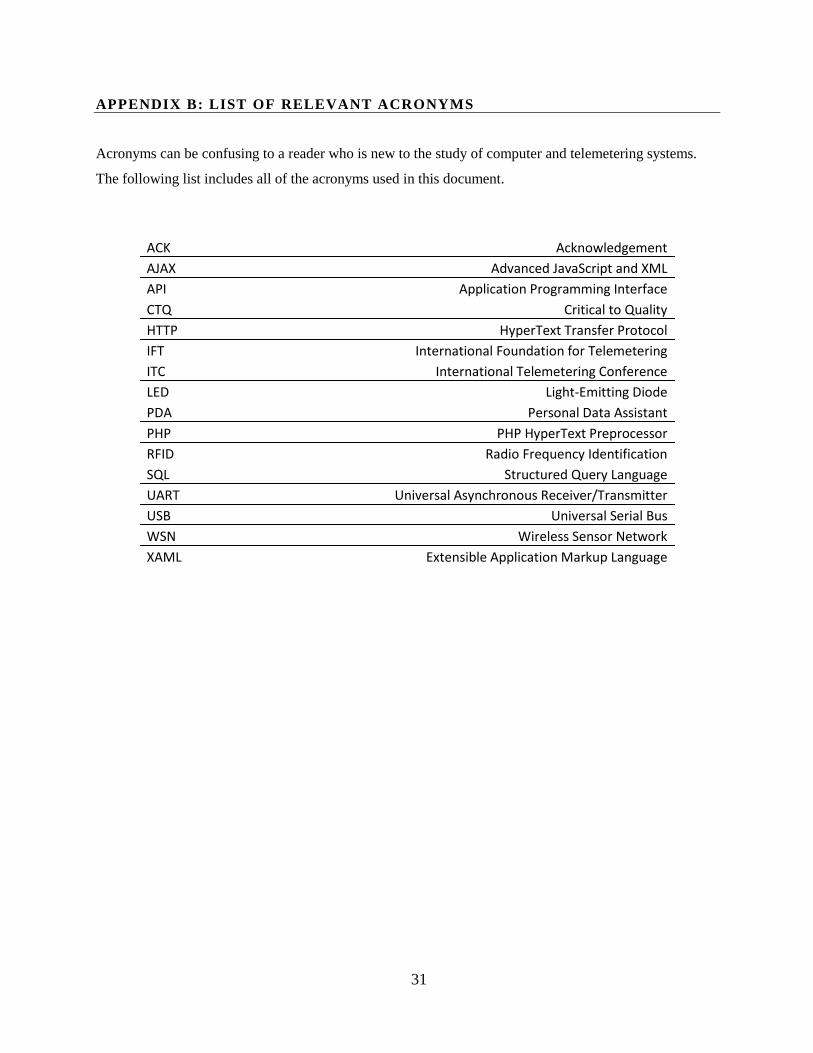
APPENDIX B: LIST OF RELEVANT ACRONYMS
Acronyms can be confusing to a reader who is new to the study of computer and telemetering systems.
The following list includes all of the acronyms used in this document.
ACK Acknowledgement
AJAX Advanced JavaScript and XML
API Application Programming Interface
CTQ Critical to Quality
HTTP HyperText Transfer Protocol
IFT International Foundation for Telemetering
ITC International Telemetering Conference
LED Light-Emitting Diode
PDA Personal Data Assistant
PHP PHP HyperText Preprocessor
RFID Radio Frequency Identification
SQL Structured Query Language
UART Universal Asynchronous Receiver/Transmitter
USB Universal Serial Bus
WSN Wireless Sensor Network
XAML Extensible Application Markup Language

32
APPENDIX C: VENDOR LOGOS
These logos represent the vendors from which we purchased products.
Figure 12: Tiny OS logo
Figure 13: Crossbow logo
Figure 14: Skyetek logo

33
REFERENCES
(1) Crossbow Technology, Inc., “Crossbow Technology : Low-power Wireless Mote Solutions
Overview,”
http://www.xbow.com/Products/wproductsoverview.aspx
(2) TinyOS “Multihop Routing,”
http://www.tinyos.net/tinyos-1.x/doc/multihop/multihop_routing.html.
(3) Crossbow Technology, Inc.: TinyOS Getting Started Guide. Rev A, October, 2003.
http://www.qlimu.com/doc/TinyOS%20Getting%20Started%20Guide%207430-0022-03_A.pdf
(4) Weinstein, R.: RFID: A technical overview and its application to the enterprise.
IT Professional, Volume 7, Issue 3, May-June 2005, Page(s): 27 – 33.
(5) dMySQL, “Why MySQL?,”
http://dev.mysql.com/doc/refman/5.1/en/what-is-mysql.html
(6) Levis, P.,Madden, S., Gay, D., Polastre, J., Szewczyk, R., Woo, A., Brewer, E.,
Culler, D.: The emergence of networking abstractions and techniques in TinyOS.
In Proceedings of the First Symposium on Networked Systems Design and
Implementation (2004), USENIX Association, pp. 1–14
(7) Murthy, C., Manoj, B. Ad Hoc Wireless Networks. Prentice Hall PTR, 2004 Tse, D., Viswanath,
P. Fundamentals of Wireless Communication. Cambridge University Press, June 27, 2005