identification of a p-coumarate degradation regulon in rhodopseudomonas palustris by
TRANSCRIPT

Identification of a p-Coumarate Degradation Regulon inRhodopseudomonas palustris by Xpression, an Integrated Tool forProkaryotic RNA-Seq Data Processing
Somsak Phattarasukol, Matthew C. Radey, Colin R. Lappala, Yasuhiro Oda, Hidetada Hirakawa,* Mitchell J. Brittnacher, andCaroline S. Harwood
Department of Microbiology, University of Washington, Seattle, Washington, USA
High-throughput sequencing of cDNA prepared from RNA, an approach known as RNA-seq, is coming into increasing use as amethod for transcriptome analysis. Despite its many advantages, widespread adoption of the technique has been hampered by alack of easy-to-use, integrated, open-source tools for analyzing the nucleotide sequence data that are generated. Here we describeXpression, an integrated tool for processing prokaryotic RNA-seq data. The tool is easy to use and is fully automated. It performsall essential processing tasks, including nucleotide sequence extraction, alignment, quantification, normalization, and visualiza-tion. Importantly, Xpression processes multiplexed and strand-specific nucleotide sequence data. It extracts and trims specificsequences from files and separately quantifies sense and antisense reads in the final results. Outputs from the tool can also beconveniently used in downstream analysis. In this paper, we show the utility of Xpression to process strand-specific RNA-seqdata to identify genes regulated by CouR, a transcription factor that controls p-coumarate degradation by the bacterium Rhodo-pseudomonas palustris.
RNA-seq is a recently developed technique for global analysis ofmRNA transcripts that involves the use of high-throughput
sequencing technology (18). It has a number of advantages overtraditional microarray-based technologies, including improvedsensitivity, increased dynamic range, and lower cost. As a result, itis becoming the preferred tool for gene expression studies. Despitemany advantages, widespread adoption of RNA-seq is impeded bya lack of easy-to-use, integrated, open-source tools for processingof the nucleotide sequence data that are generated as the output ofthe technique. Millions of raw sequence reads are generated foreach RNA-seq experiment, making it impossible to process thesequencing data without bioinformatic tools.
A number of tools to process RNA-seq data automatically havebeen developed. Commercial solutions, such as Avadis NGS andIllumina CASAVA, offer rich features, but their costs are prohib-itive for small laboratories. Noncommercial tools, such as Array-ExpressHTS (6) and rnaSeqMap (11), have recently been released,but none of the existing tools is specifically designed for process-ing prokaryotic RNA-seq data. Due to their smaller genome sizes,prokaryotic RNA-seq data can be multiplexed by adding a barcodeto each sample to reduce per-sample sequencing costs. In addi-tion, strand-specific library construction methods can be used topreserve the directional information of prokaryotic transcripts (2,8). These methods yield sequences in a native direction as well asin a reverse-complement direction with respect to the orientationof the open reading frame (2, 8). Programming skills are requiredto customize existing bioinformatic tools for the processing ofthese types of RNA-seq data.
Here we describe Xpression, an integrated tool that we devel-oped to process prokaryotic RNA-seq data generated with Illu-mina sequencing technology. The tool accepts simple commandsfrom users via a graphical interface, is fully automated, and fin-ishes all processing tasks, starting from sequence extraction to thegeneration of a general visualization format file that can be openedby visualization software such as Artemis (http://www.sanger.ac
.uk/resources/software/artemis/) or the Integrated GenomicsViewer (http://www.broadinstitute.org/igv/). It will process datathat are not strand specific. But it is also designed to analyze mul-tiplexed and strand-specific data. It extracts and trims specificsequences from files and separately quantifies sense and antisensereads in the final results. Outputs from Xpression can also beconveniently used in downstream analysis. For example, users canapply a statistical software program such as DESeq (1) to geneexpression reports in order to identify differentially expressedgenes.
A recent genetic and biochemical study of the purple nonsulfurphototrophic bacterium Rhodopseudomonas palustris revealedthat the couAB genes, which encode an enoyl-CoA lyase/hydrataseand a coenzyme A ligase, are required for the degradation of theplant lignin monomers p-coumarate, ferulate, and caffeate (9). Inthe same study, a MarR family repressor protein named CouR wasidentified as binding p-coumaroyl coenzyme A (p-coumaroyl-CoA) to derepress couAB gene expression. Results from quantita-tive reverse transcriptase PCR (RT-PCR) experiments showedthat a couR mutant had levels of couAB expression 30- to 40-foldhigher than those of the wild type. Here we used Xpression toprocess strand-specific RNA-seq data so as to further investigatethe CouR regulon. This resulted in the identification of 11 addi-tional genes that are likely regulated by CouR.
Received 2 May 2012 Accepted 4 July 2012
Published ahead of print 13 July 2012
Address correspondence to Caroline S. Harwood, [email protected].
* Present address: Hidetada Hirakawa, Advanced Scientific Research LeadersDevelopment Unit, Gunma University, Showa-machi, Maebashi, Gunma, Japan.
Copyright © 2012, American Society for Microbiology. All Rights Reserved.
doi:10.1128/AEM.01418-12
6812 aem.asm.org Applied and Environmental Microbiology p. 6812–6818 October 2012 Volume 78 Number 19
Dow
nloa
ded
from
http
s://j
ourn
als.
asm
.org
/jour
nal/a
em o
n 23
Oct
ober
202
1 by
72.
205.
61.1
26.

MATERIALS AND METHODSBacterial strains and growth conditions. The R. palustris wild-type strainCGA009 and a couR deletion mutant derived from CGA009 (9) weregrown anaerobically in light with succinate (10 mM) as the carbon source,as described previously (9, 10). Cells in the mid-logarithmic phase ofgrowth, where they express p-coumarate degradation genes at high levels(15), were first chilled in an ice-water bath and then harvested by centrif-ugation, and the pellets were frozen in liquid nitrogen and then stored at�80°C.
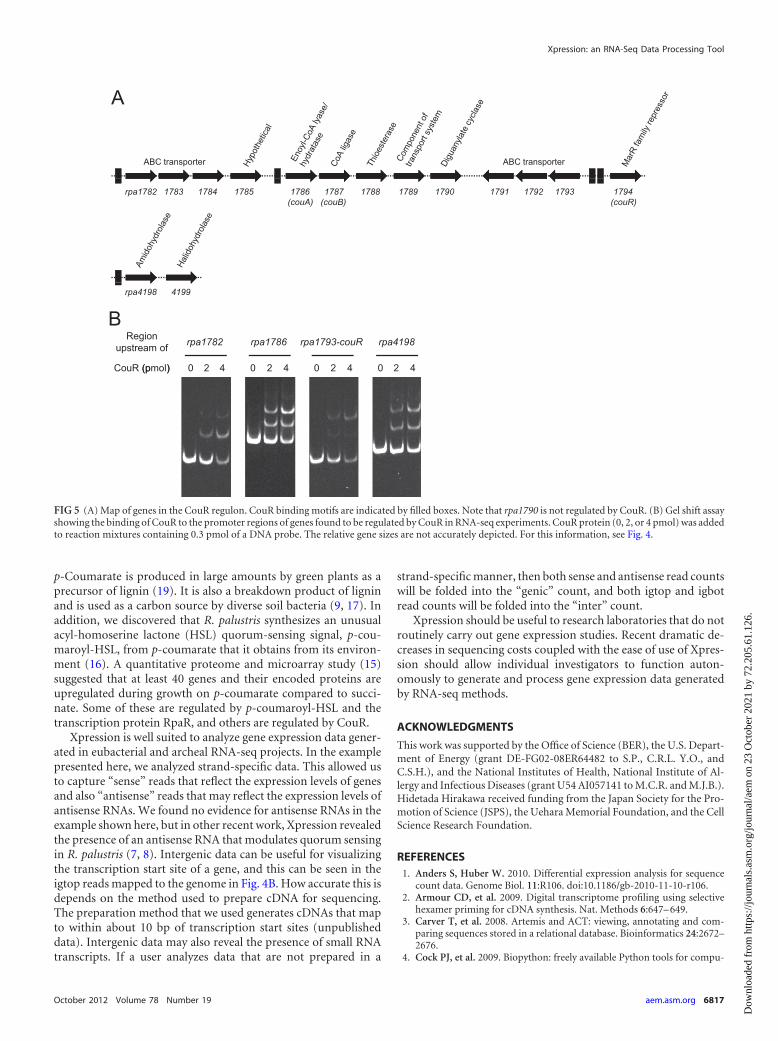
Electrophoretic mobility gel shift assays. CouR was purified as de-scribed previously (9), and electrophoretic mobility gel shift assays werecarried out as described previously (9) except that probes specific for thepromoter of each gene were generated by PCR amplification withgenomic R. palustris CGA009 DNA as the template. For each probe, theentire intergenic region was amplified.
Strand-specific cDNA library construction for RNA-seq. Cells pre-viously stored at �80°C were thawed and disrupted by bead beating, andRNA was then purified from cells as described previously (8). A strand-specific cDNA library was prepared from total RNA by a previously de-scribed method called Not-so-Random (NSR) RNA-seq (2). First- andsecond-strand synthesis, NSR RNA-seq library construction, and DNAsequencing on an Illumina GA2 system were carried out as describedpreviously (2, 8). For this, we specified nucleotide read lengths of 36 bases.
Xpression installation. Xpression is freely available for downloadfrom the Harwood Laboratory website (https://depts.washington.edu/
cshlab/html/rnaseq.html). Due to the nature of the dependent softwareBiopython (4), SAMtools (13), Pysam, and the Burrows-Wheeler align-ment (BWA) tool (12), the installation of Xpression requires a properlyconfigured Unix-like operating system. The website provides two alterna-tives for getting Xpression onto a desktop computer. For those who havea Linux or Unix-like operating system, the best option is to use the auto-matic script provided, which will install all required software from thesource. For those with a Windows or Mac OS operating system, we haveprovided a fully operational, system-independent graphical environment(Xpression VE) that can run Xpression. The only software that XpressionVE needs is a free virtualization software called VirtualBox (https://www.virtualbox.org/). Please consult the Xpression virtual system user guideavailable on the Harwood Laboratory website for point-and-click direc-tions for the installation of Xpression VE on a computer. This programcan be easily installed on a desktop, laptop, or netbook computer.
RNA-seq data processing. First, reference files for the genome se-quence being queried, R. palustris CGA009 in this case, were uploaded.We obtained these files from NCBI as described in the supporting docu-mentation available on the Harwood Laboratory website. The FASTA filewas uploaded into Xpression with the “FASTA Reference” button shownin Fig. 1A, and the GenBank file was uploaded into Xpression with the“GenBank Reference” button shown in Fig. 1A. The RNA-seq data (theFASTQ file from the Illumina sequencer) of the wild type were uploadedwith the “Sequencing FASTQ” button. Next, we entered “Sample Infor-mation” (Fig. 1A), which included a specified sample ID, “wild_type” inthe case shown in Fig. 1A. Also, the barcode for the sample to be analyzedwas entered into the appropriate window. We selected “4 —Generate Vi-sualization” to be the final step in the analysis. In the next step, we speci-fied “Sample Options” (Fig. 1B), after clicking on the “Options” menulocated as shown in Fig. 1A. The sequencing data were strand specific, andwe entered this in the “Sample Options” panel. We also indicated that wewould allow two nucleotide mismatches when aligning reads against areference genome and that the start position of the biological sequence isthe 6th nucleotide from the 5= end. This trims the barcode plus one addi-tional nucleotide off the sequence reads, effectively reducing them from36 to 31 nucleotides. Finally, we clicked “Add to Queue” (Fig. 1A) toqueue up additional files to be analyzed. Once everything was set, wepressed the “Start Run” button and waited for Xpression to finish all thetasks in its internal workflow (Fig. 2). The processing tasks included se-quence extraction, filtering, trimming, alignment, quantification, nor-malization, and visualization, as described below in Results. Xpressiongenerated a mapping statistics table and an expression profile presented asa comma-separated-values (CSV) file. Xpression also displayed mappingpositions and numbers of uniquely mapped reads computed in the pre-vious steps in customized Wiggle plots (https://cgwb.nci.nih.gov/golden
FIG 1 Depiction of the Xpression graphical interface. (A) Settings to analyzethe wild-type RNA-seq data are shown as an example. (B) Depiction of thesample options window.
FIG 2 Tasks carried out the internal workflow of Xpression. Tasks that areautomatically carried out include sequence extraction, filtering, trimming,alignment, quantification, normalization, and visualization. Once all the pro-cessing tasks are completed, Xpression provides the user with alignment sta-tistics, gene expression profiles, and gene expression plots.
Xpression: an RNA-Seq Data Processing Tool
October 2012 Volume 78 Number 19 aem.asm.org 6813
Dow
nloa
ded
from
http
s://j
ourn
als.
asm
.org
/jour
nal/a
em o
n 23
Oct
ober
202
1 by
72.
205.
61.1
26.
Path/help/wiggle.html), which we loaded onto the Artemis genomebrowser (3) (http://www.sanger.ac.uk/resources/software/artemis/). Themapped reads were presented in Artemis as described previously (8).
Identifying differentially expressed genes. We used the statisticalsoftware DESeq (1) to evaluate whether, for a given region, an observeddifference in read counts between the couR mutant and the wild type wassignificant. DESeq takes into account the technical and biological variabil-ity of count data and consequently yields more-balanced and accurateresults than simple calculation. Features with a P value of �0.05 and withfold change ratios of �3.0 were considered to be differentially expressed.
RNA-seq data accession number. The DNA raw sequencing readshave been deposited in NCBI Gene Expression Omnibus under accessionnumber GSE39025 (http://www.ncbi.nlm.nih.gov/geo/query/acc.cgi?acc�GSE39025).
RESULTS
Previously, we identified couA and couB as encoding enzymes reg-ulated by a transcriptional repressor protein that we named CouR(9). CouR binds p-coumaroyl-CoA to derepress the expression ofthese genes. CouA is an enoyl-CoA lyase/hydratase, and CouB is acoenzyme A ligase required for removing the side chain of thephenylpropanoid p-coumarate and converting it to p-hydroxy-benzaldehyde. The same enzymes remove the side chains of feru-late and caffeate. It is often the case that genes required for thetransport of a particular compound or for the degradation of re-lated compounds are coordinately regulated with degradationgenes. To identify other genes that may be regulated by CouR, wecompared the transcriptome of succinate-grown wild-type cellswith that of succinate-grown cells of the couR mutant by usingRNA-seq, and we used Xpression to analyze the sequence data.Succinate is a tricarboxylic acid cycle intermediate and a goodgrowth substrate for R. palustris. p-Coumarate is degraded toacetyl-CoA, which then enters the tricarboxylic acid cycle (9, 15).
Sequence read extraction, filtering, and trimming. Xpression
scanned sequences from the input FASTQ files and extracted onlythose that started with the specified barcode. To ensure that theextracted reads were of high quality, the tool assessed them usingbase-calling accuracy scores. Reads with an accuracy of 99% orgreater (called “high-quality reads”) were kept for further process-ing, while reads whose accuracy was lower (called “low-qualityreads”) were discarded. As shown in Table 1, 79.59% of the wild-type RNA-seq data were of high quality, and 81.92% of the couRmutant data were of high quality. Next, Xpression trimmed thereads as described in Materials and Methods to remove the bar-code so that the reads could be accurately aligned to the R. palustrisgenome in the next step.
Sequence read alignment and classification. Xpression usedthe BWA tool to map high-quality, trimmed reads from the pre-vious step against the FASTA reference genome sequence. Oncefinished, the tool categorized reads into four classes according tothe mapping results. First, reads that aligned to unique locationsin the reference genome were called “uniquely mapped reads.”Second, reads that aligned to unique locations but with more thantwo nucleotide mismatches were called “partially mapped reads.”Third, reads that aligned to more than one location were called“nonuniquely mapped reads.” Reads that could not be alignedwere called “unmapped reads.”
The mapping statistics generated by Xpression are shown inTable 1. Xpression aligned 92.48% of the high-quality reads fromthe wild-type data to the reference genome. Of these, 28.97% ofthe reads mapped to a single place on the genome (uniquelymapped). A large number of reads, 66.08%, mapped to more thanone location. A further analysis revealed that most of these non-uniquely mapped reads aligned to the two rRNA operons. Thepercentages of mapped reads from the couR mutant data were
TABLE 1 Sequence read statistics of RNA-seq data generated from wild-type R. palustris and the couR mutant
Sequence read statistic
No. (%) of reads
Wild type couR mutant
Total reads 11,507,621 (100) 11,132,011 (100)High-quality reads 9,159,246 (79.59) 9,119,736 (81.92)Low-quality reads 2,348,375 (20.41) 2,012,275 (18.08)
Total high-quality reads 9,159,246 (100) 9,119,736 (100)Mapped reads 8,470,854 (92.48) 8,413,620 (92.26)Unmapped reads 688,393 (7.52) 706,117 (7.74)
Total mapped reads 8,470,854 (100) 8,413,620 (100)Uniquely mapped reads 2,453,640 (28.97) 2,076,547 (24.68)Partially mapped reads 419,433 (4.95) 305,605 (3.63)Nonuniquely mapped reads 5,597,780 (66.08) 6,031,467 (71.69)
TABLE 2 couA read countsa derived from RNA-seq data from wild-type and couR mutant cells
Locus Size (bp) Kind of readb Gene
Wild type couR mutant
Raw reads RPM RPKM Raw reads RPM RPKM
rpa1786 297 Igbot 0 0 0 0 0 0rpa1786 297 Igtop 6 2.45 8.23 16 7.71 25.94rpa1786 807 Sense couA 16 6.52 8.08 1,636 787.85 976.27rpa1786 807 Antis 0 0 0 0 0 0a RPM, reads per million uniquely mapped reads; RPKM, reads per kilobase per million uniquely mapped reads.b See Fig. 3 for a diagram of the kinds of reads.
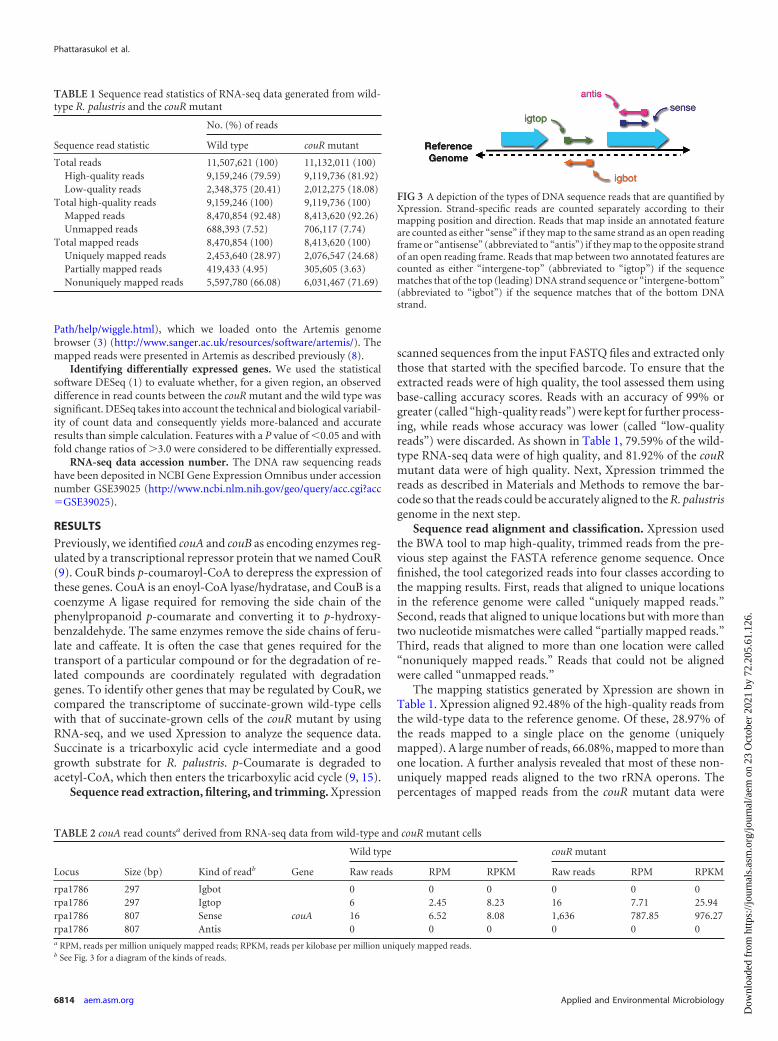
FIG 3 A depiction of the types of DNA sequence reads that are quantified byXpression. Strand-specific reads are counted separately according to theirmapping position and direction. Reads that map inside an annotated featureare counted as either “sense” if they map to the same strand as an open readingframe or “antisense” (abbreviated to “antis”) if they map to the opposite strandof an open reading frame. Reads that map between two annotated features arecounted as either “intergene-top” (abbreviated to “igtop”) if the sequencematches that of the top (leading) DNA strand sequence or “intergene-bottom”(abbreviated to “igbot”) if the sequence matches that of the bottom DNAstrand.
Phattarasukol et al.
6814 aem.asm.org Applied and Environmental Microbiology
Dow
nloa
ded
from
http
s://j
ourn
als.
asm
.org
/jour
nal/a
em o
n 23
Oct
ober
202
1 by
72.
205.
61.1
26.

similar (Table 1). Unlike other classes of reads, uniquely mappedreads were aligned unambiguously to locations in the referencegenome, and Xpression quantified this class of reads to infer tran-script levels in the next step.
Sequence read quantification, normalization, and visualiza-tion. Xpression first collected all annotated features in the refer-ence genome from the GenBank reference annotation file. Thetool then counted how many uniquely mapped reads were locatedinside each gene and provided raw and normalized numbers foreach gene (Table 2). Since our RNA-seq data were strand specific,the tool also took into account the alignment direction of reads
with respect to the transcriptional direction of genes. It thus sep-arated gene counts into “sense counts” (sense), if reads weremapped in the same direction as the gene, and “antisense counts”(antis), if reads were mapped in the opposite direction (Fig. 3).
The tool also counted how many uniquely mapped reads werelocated inside each intergenic region, which was defined as thenucleotides between two adjacent annotated features. These readswere collectively called “intergene counts.” Since there is no tran-scriptional direction according to which intergenic regions canreferred, Xpression separated intergene counts based on whichDNA strand the reads aligned to. They were either “intergene-top”
FIG 4 Visualization of RNA-seq data using output from Xpression. RNA-seq profiles of wild type (A) and couR mutant (B) cells grown on succinate werecompared. Numbers of sequence reads (RPM) were binned (1 to 10, 11 to 100, or 101 to 1,000) as indicated on the y axes, and the start location of the reads wasoverlaid on the R. palustris CGA009 genome using Artemis software as described in Materials and Methods. The type of DNA sequence read is indicted by the linecolor: blue, sense reads; pink, antisense reads; green, intergenic regions on the top DNA strand; orange, intergenic regions on the bottom DNA strand. Predictedgene functions are color coded as follows: blue, transport; gray, hypothetical; red, enzyme; purple, diguanylate cyclase. This is a simplified version of the figuregenerated in Artemis.
Xpression: an RNA-Seq Data Processing Tool
October 2012 Volume 78 Number 19 aem.asm.org 6815
Dow
nloa
ded
from
http
s://j
ourn
als.
asm
.org
/jour
nal/a
em o
n 23
Oct
ober
202
1 by
72.
205.
61.1
26.

counts (abbreviated to “igtop”), which were the number of readswhose sequences matched intergenic sequences on the top (lead-ing) DNA strand, or “intergene-bottom” counts (abbreviated to“igbot”), which were the number of reads whose sequencesmatched intergenic sequences on the bottom DNA strand (Fig. 3).Table 2 shows the number of reads that mapped to couA and theintergenic region upstream of couA. In the sense direction, therewere 16 uniquely mapped reads for the wild type, while there were1,636 uniquely mapped reads for the couR mutant in the couAgene. In the intergenic region, 6 and 16 reads matched the topstrand for the wild type and the couR mutant, respectively.
To facilitate the comparison of read numbers between anno-tated regions and between samples, Xpression normalized rawcounts to reads per million uniquely mapped reads (RPM) andreads per kilobase per million uniquely mapped reads (RPKM).This normalization method was similar to that of Mortazavi et al.(14). The only difference was that Xpression normalized rawcounts to the total number of uniquely mapped reads, instead ofthe total number of reads, to reduce the weight of the rRNA reads.When normalized, the couA genes in the wild-type strain and thecouR mutant had 8.08 and 976.27 RPKM, respectively (Table 2).
Since our RNA-seq data are strand specific, Xpression createdfour plots for each sample, as illustrated in Fig. 4A and 4B. Acomparison of Fig. 4A and B shows that the genes rpa1782 torpa1793 were expressed at higher levels in the couR mutant than inthe wild type. An exception is rpa1790, predicted to encode adiguanylate cyclase, which was not differentially expressed be-tween the two strains.
The CouR regulon. Xpression identified 13 genes that wereexpressed at 3-fold or higher levels in the couR mutant than in thewild type (Table 3). Consistent with our previous RT-PCR data,the RNA-seq data indicate that couA and couB are repressed byCouR. In fact, with the exception of rpa1790, the genes rpa1782 torpa1793 near couAB were all repressed by CouR. rpa1782 torpa1784 are predicted to encode a TrapT family transporter, andrpa1791 to rpa1793 to encode a predicted ABC transporter. In
addition, rpa1789 encodes a periplasmic binding protein that hasbeen expressed and shown by a fluorescence-based thermal shiftassay to bind p-coumarate, ferulate, and cinnamate (5). Genesrpa4198 and rpa4199 were also strongly repressed by CouR (Table3). These genes, separated by 148 bp, are predicted to encode anamidohydrolase and a halide hydrolase.
We found a CouR binding motif (GTTATA NNN TATAAC)(9) upstream of rpa1782 and rpa1786 and in the intergenic regionbetween rpa1793 and couR (rpa1794). In addition, a CouR bind-ing motif with a three-nucleotide substitution was present up-stream of rpa4198-rpa4199 (Fig. 5A). In gel shift assays, using asprobes the regions 170 to 200 bp upstream of genes with predictedCouR binding motifs, we found that CouR bound to the promoterregions of rpa1782, rpa1793-couR, and rpa4198 (Fig. 5B). We haveshown previously that CouR binds to the rpa1786 (couA) pro-moter region (Fig. 5B) (9).
DISCUSSION
Here we defined a CouR regulon of 13 genes using Xpression, anucleotide sequence processing tool that we designed for thequantification and visualization of data generated by the methodof RNA-seq. Our RNA-seq experimental design involved isolatingRNA from wild-type cells and couR mutant cells grown on succi-nate and then reverse transcribing the RNA in a strand-specificmanner to generate cDNA, which was then sequenced on an Illu-mina platform. CouR is a transcriptional repressor protein thatbinds p-coumaroyl-CoA to derepress gene expression. We foundthat CouR controls not only the expression of couAB genes forp-coumarate degradation, as we described previously (9), but alsotransport systems that are likely involved in the uptake of p-cou-marate and structurally related compounds into cells. The func-tions of the predicted amidohydrolase and halidohydrolase genesthat are regulated by CouR are unclear, but one could speculatethat they are involved in preparing structurally modified forms ofphenylpropanoids to enter the p-coumarate degradation path-way. p-Coumarate metabolism is of interest for several reasons.
TABLE 3 Genes regulated by CouR
Locusa Kind of read Gene name Annotationb
Expression ratio(couR mutant vs WT)c
rpa1782* Sense TrapT family transporter, periplasmic binding protein 4.4rpa1783 Sense Trap transporter, small permease component 7.3rpa1784 Sense Trap transporter, large permease component 4.8rpa1785 Sense Hypothetical protein 6.7rpa1786* Sense couA Enoyl-CoA lyase/hydratase 81.6rpa1787 Sense couB Coenzyme A ligase 96.4rpa1788 Igtop 67.7rpa1788 Sense Thioesterase 30.8rpa1789 Igtop 16.0rpa1789 Sense Periplasmic binding protein 10.0rpa1791 Sense ABC transporter, ATP binding protein 15.3rpa1792 Sense ABC transporter, ATP binding protein 9.5rpa1793* Sense ABC transporter, membrane protein 9.9rpa4198* Sense Amidohydrolase 2 30.1rpa4199 Sense Putative 2-haloacid halidohydrolase 20.4a Those genes regulated by p-coumarate in Affymetrix GeneChip experiments (15) are in boldface. Elements with promoters that were examined by gel shift experiments areindicated by an asterisk.b As defined by the Joint Genome Institute site (www.jgi.doe.gov).c WT, wild type. Genes and intergenic regions that were changed more than 3-fold with a P value of �0.05 are listed. Expression ratios were calculated by DESeq, which took intoaccount the technical and biological variability of count data, and consequently they were slightly different from those obtained from simple calculation.
Phattarasukol et al.
6816 aem.asm.org Applied and Environmental Microbiology
Dow
nloa
ded
from
http
s://j
ourn
als.
asm
.org
/jour
nal/a
em o
n 23
Oct
ober
202
1 by
72.
205.
61.1
26.
p-Coumarate is produced in large amounts by green plants as aprecursor of lignin (19). It is also a breakdown product of ligninand is used as a carbon source by diverse soil bacteria (9, 17). Inaddition, we discovered that R. palustris synthesizes an unusualacyl-homoserine lactone (HSL) quorum-sensing signal, p-cou-maroyl-HSL, from p-coumarate that it obtains from its environ-ment (16). A quantitative proteome and microarray study (15)suggested that at least 40 genes and their encoded proteins areupregulated during growth on p-coumarate compared to succi-nate. Some of these are regulated by p-coumaroyl-HSL and thetranscription protein RpaR, and others are regulated by CouR.
Xpression is well suited to analyze gene expression data gener-ated in eubacterial and archeal RNA-seq projects. In the examplepresented here, we analyzed strand-specific data. This allowed usto capture “sense” reads that reflect the expression levels of genesand also “antisense” reads that may reflect the expression levels ofantisense RNAs. We found no evidence for antisense RNAs in theexample shown here, but in other recent work, Xpression revealedthe presence of an antisense RNA that modulates quorum sensingin R. palustris (7, 8). Intergenic data can be useful for visualizingthe transcription start site of a gene, and this can be seen in theigtop reads mapped to the genome in Fig. 4B. How accurate this isdepends on the method used to prepare cDNA for sequencing.The preparation method that we used generates cDNAs that mapto within about 10 bp of transcription start sites (unpublisheddata). Intergenic data may also reveal the presence of small RNAtranscripts. If a user analyzes data that are not prepared in a
strand-specific manner, then both sense and antisense read countswill be folded into the “genic” count, and both igtop and igbotread counts will be folded into the “inter” count.
Xpression should be useful to research laboratories that do notroutinely carry out gene expression studies. Recent dramatic de-creases in sequencing costs coupled with the ease of use of Xpres-sion should allow individual investigators to function auton-omously to generate and process gene expression data generatedby RNA-seq methods.
ACKNOWLEDGMENTS
This work was supported by the Office of Science (BER), the U.S. Depart-ment of Energy (grant DE-FG02-08ER64482 to S.P., C.R.L. Y.O., andC.S.H.), and the National Institutes of Health, National Institute of Al-lergy and Infectious Diseases (grant U54 AI057141 to M.C.R. and M.J.B.).Hidetada Hirakawa received funding from the Japan Society for the Pro-motion of Science (JSPS), the Uehara Memorial Foundation, and the CellScience Research Foundation.
REFERENCES1. Anders S, Huber W. 2010. Differential expression analysis for sequence
count data. Genome Biol. 11:R106. doi:10.1186/gb-2010-11-10-r106.2. Armour CD, et al. 2009. Digital transcriptome profiling using selective
hexamer priming for cDNA synthesis. Nat. Methods 6:647– 649.3. Carver T, et al. 2008. Artemis and ACT: viewing, annotating and com-
paring sequences stored in a relational database. Bioinformatics 24:2672–2676.
4. Cock PJ, et al. 2009. Biopython: freely available Python tools for compu-
FIG 5 (A) Map of genes in the CouR regulon. CouR binding motifs are indicated by filled boxes. Note that rpa1790 is not regulated by CouR. (B) Gel shift assayshowing the binding of CouR to the promoter regions of genes found to be regulated by CouR in RNA-seq experiments. CouR protein (0, 2, or 4 pmol) was addedto reaction mixtures containing 0.3 pmol of a DNA probe. The relative gene sizes are not accurately depicted. For this information, see Fig. 4.
Xpression: an RNA-Seq Data Processing Tool
October 2012 Volume 78 Number 19 aem.asm.org 6817
Dow
nloa
ded
from
http
s://j
ourn
als.
asm
.org
/jour
nal/a
em o
n 23
Oct
ober
202
1 by
72.
205.
61.1
26.

tational molecular biology and bioinformatics. Bioinformatics 25:1422–1423.
5. Giuliani SE, et al. 2011. Environment sensing and response mediated byABC transporters. BMC Genomics 12(Suppl. 1):S8. doi:10.1186/1471-2164-12-S1-S8.
6. Goncalves A, Tikhonov A, Brazma A, Kapushesky M. 2011. A pipelinefor RNA-seq data processing and quality assessment. Bioinformatics 27:867– 869.
7. Hirakawa H, Harwood CS, Pechter KB, Schaefer AL, Greenberg EP.2012. Antisense RNA that affects Rhodopseudomonas palustris quorum-sensing signal receptor expression. Proc. Natl. Acad. Sci. U. S. A. 109:12141–12146.
8. Hirakawa H, et al. 2011. Activity of the Rhodopseudomonas palustrisp-coumaroyl-homoserine lactone-responsive transcription factor RpaR.J. Bacteriol. 193:2598 –2607.
9. Hirakawa H, Schaefer AL, Greenberg EP, Harwood CS. 2012. Anaerobicp-coumarate degradation by Rhodopseudomonas palustris and identifica-tion of CouR, a MarR repressor protein that binds p-coumaroyl coenzymeA. J. Bacteriol. 194:1960 –1967.
10. Kim M-K, Harwood CS. 1991. Regulation of benzoate-CoA ligase inRhodopseudomonas palustris. FEMS Microbiol. Lett. 83:199 –204.
11. Lesniewska A, Okoniewski MJ. 2011. rnaSeqMap: a bioconductor pack-
age for RNA sequencing data exploration. BMC Bioinformatics 12:200.doi:10.1186/1471-2105-12-200.
12. Li H, Durbin R. 2010. Fast and accurate long-read alignment with Bur-rows-Wheeler transform. Bioinformatics 26:589 –595.
13. Li H, et al. 2009. The sequence alignment/map format and SAMtools.Bioinformatics 25:2078 –2079.
14. Mortazavi A, Williams BA, McCue K, Schaeffer L, Wold B. 2008.Mapping and quantifying mammalian transcriptomes by RNA-Seq. Nat.Methods 5:621– 628.
15. Pan C, et al. 2008. Characterization of anaerobic catabolism of p-coumarate in Rhodopseudomonas palustris by integrating transcriptomicsand quantitative proteomics. Mol. Cell. Proteomics 7:938 –948.
16. Schaefer AL, et al. 2008. A new class of homoserine lactone quorum-sensing signals. Nature 454:595–599.
17. Trautwein K, Wilkes H, Rabus R. 2012. Proteogenomics evidence for�-oxidation of plant-derived 3-phenylpropanoids in “Aromatoleum aro-maticum” EbN1. Proteomics 12:1402–1413.
18. Wang Z, Gerstein M, Snyder M. 2009. RNA-Seq: a revolutionary tool fortranscriptomics. Nat. Rev. Genet. 10:57– 63.
19. Whetten R, Sederoff R. 1995. Lignin biosynthesis. Plant Cell 7:1001–1013.
Phattarasukol et al.
6818 aem.asm.org Applied and Environmental Microbiology
Dow
nloa
ded
from
http
s://j
ourn
als.
asm
.org
/jour
nal/a
em o
n 23
Oct
ober
202
1 by
72.
205.
61.1
26.