identification of animal species in ground meat mixtures by multivariate analysis of isoelectric...
TRANSCRIPT
Electrophoresis 1998, 19, 3103-3109 Multivariate analysis of IEF profiles 3 103
Hans-Jacob Skarpeid Knut Kvaal Kjell Ivar Hildrum
Matforsk, Norwegian Food Research Institute, Aas, Norway
Identification of animal species in ground meat mixtures by multivariate analysis of isoelectric focusing protein profiles
The present work investigates the possibility of constructing a multivariate calibration model to predict the composition of ground meat with respect to animal species, based on intensity profiles from isoelectric focusing of water-soluble proteins in mixtures of ground meat. Samples containing various amounts of beef, pork and turkey meat were analyzed by isoelectric focusing in immobilized pH- gradients. The gels were photographed and the images transferred to a digital format. The digital images were processed in order to reduce background and optimize signal strength. Resulting gel profiles were analyzed by multivariate regression allowing the determination of sample composition with prediction errors close to 10%.
1 Introduction
Isoelectric focusing and other electrophoretic techniques give high resolution separations of complex protein mixtures. Still, the evaluation of such results are usually limited to qualitative visual inspection or to numerical analysis of a limited number of protein bands. Multivariate analysis is a systematic approach to interpret large and complex amounts of data, and thus seems well suited to assist in the interpretation of electrophoretic gels. Recently, this has also been shown successfully in a number of cases. Sondergaard el al. [l , 21 used classification techniques to identify wheat samples of high baking quality on the basis of isoelectric focusing combined with discriminant analysis or neural networks, and Zimmermann et al. [3,4] have used the same techniques on Western blots to classify repertoires of autoantibodies. These applications show that multivariate analysis of electrophoretic patterns can be successfully applied on rather complex problems.
The determination of species composition of processed meat products is one of the most prominent issues in determining the authenticity of meat products [5]. Various events like bovine spongiform encephalopathy (BSE) and the continued demand for food paying respect to various ethnic and religious standards, assure that this issue will have to be dealt with using efficient analytical procedures in the future as well. For routine application, such methods should be independent of reagents like antibodies and gene probes, which require considerable prior studies and knowledge of each species. Furthermore, operator-depend- ent evaluations of results are not easily transferable between laboratories. Multivariate analysis of electrophoretic pat- terns fulfills these criteria, and should therefore be investigated.
In our laboratory, multivariate calibration was previously applied to applications on a variety of systems mainly based on spectroscopic techniques such as near infrared reflec- tance (NIR) and transmittance (NIT) as well as sensory
Correspondence: Hans-Jacob Skarpeid, MATFORSK, Osloveien, N- 1430 Aas, Norway (Tel: 47-64970100, Fax 47-64970333; E-mail: hans-jacob. [email protected])
Abbreviations: PLSZ, partial least squares 2; RMSEP, root mean square error of prediction
Keywards Chemometrics I Multivariate calibration / Isoelectric focusing / Animal species
analysis [6-91. This paper shows that the techniques of multivariate calibration can successfully be applied to electrophoretic profiles as well. The use of isoelectric focusing to identify meat and fish species is well established, and even mixtures of two species have successfully been determined, based on visual inspection and comparison with known standards [lo-131. In this paper, we extend this to mixtures of three animal species, and show that these can be analyzed by combining isoelectric focusing and multivariate analysis. This approach is operator-independent in the sense that no prior knowledge on the IEF patterns of the species is required or utilized. However, information from all samples analyzed can be incorporated into the final calculated model. In this way complexity also relating to natural variation in the sample material can be taken into account. Note that at this stage, our approach also involves one operator-sensitive step, as the alignment of images of different lanes in done manually. The discussion part of this paper will demonstrate that this aspect of the approach is the main target for further research on the topic.
2 Materials and methods
2.1 Materials Beef, pork and turkey meat was obtained from commercial slaughterhouses. Three different lots of each species were collected and treated independently. The meat used for the experiment was of different qualities used in the normal production of processed comminuted meat products (Table 1). All samples consequently consisted of tissue from more than one muscle type and more than one individual. Two lots of each species (series A and B) were, therefore, of relatively fat meat qualities and one lot (series C) was of a lean meat quality. Fat analysis was performed in a Foss-Let 15310 by the AOAC official method 976.21 [14]. The meat was collected directly from the production line in the slaughterhouses. Most samples were obtained in the frozen state (-2O"C), and these were allowed to thaw at room temperature for 24 h before processing. Samples not frozen at the time of collection were kept at 4°C for 24-72 h. Afterwards all samples were processed, i.e. minced and mixed.
2.2 Design of experiment The general principle of design in this study is Simplex design [15]. The composition of all samples according to this design shows that the design effectively spans all
0 WILEY-VCH Verlag GmbH, 69451 Weinheim, 1998 0173-0835/98/18 18-3 103 $17.50+.50/0
Electrophoresis 1998, 19, 3103-3109 3 104 H.-J. Skarpeid, K. Kvaal and K. I. Hildrum
Table 1. Meat used in the study
Series A Series B Series C
Meat quality Approximate fat Meat quality Approximate fat Meat quality Approximate fat content (%) content (%) content (%)
Beef Quality IIa’ 15 Quality I1 15 Quality I 2 Pork Mixture of 13 Mixture of 17 Quality I 2
Turkey Mechanically 25 Mechanically 24 Neck meat 10 qualitites I and I1
recovered meat recovered meat
qualities I and 11
a) Designations used: Quality I and Quality I1 represent meat meeting the requirements of the highest and second highest production meat classes in Norway, respectively.
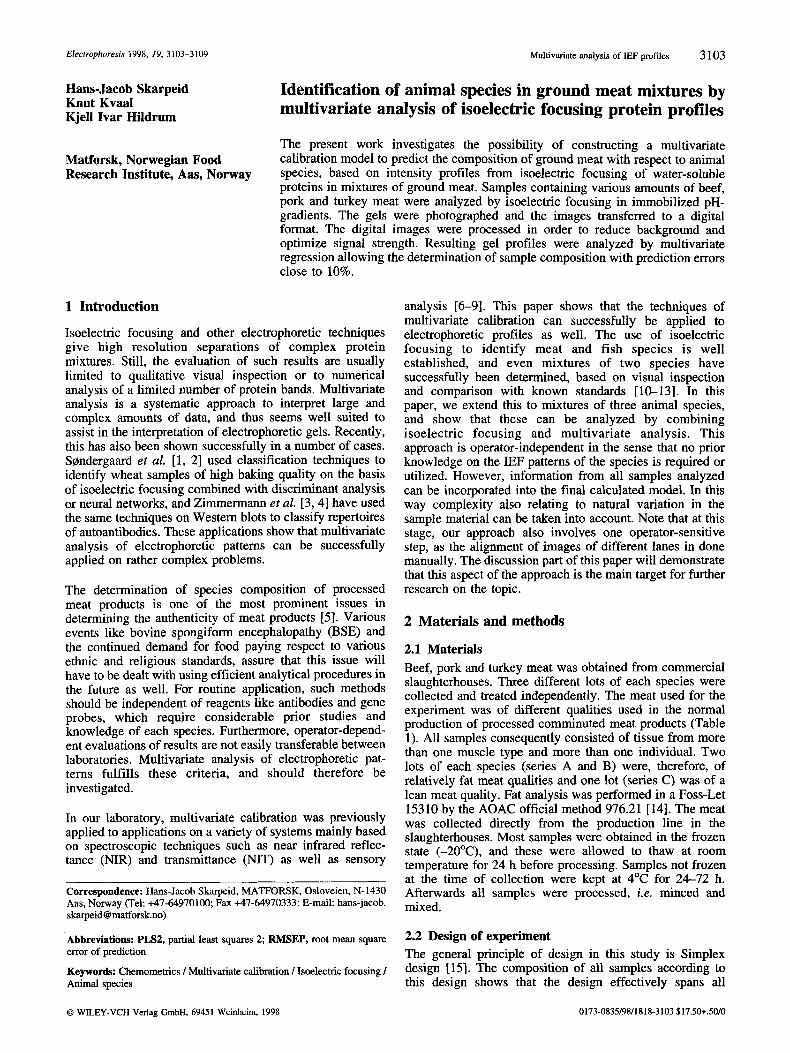
possible combinations of the 3 components at hand, in this case at a resolution of 25% increments of each component (Fig. 1). One simplex, resulting in 15 samples, was composed of meat from one lot (meat production sample) from each species. To enable some generalization about the resulting predictive model, two further sample sets of this kind were produced. The three different sample sets (series A, B and C) were selected to be of low and high fat contents, as detailed above.
2.3 Isoelectric focusing
An Immobiline 4-7 gel plate (Pharmacia Biotech, Uppsala, Sweden) was rehydrated in distilled water on a shaking platform for 2 h (without the optional swelling cassette). Two g of each minced and mixed meat sample was suspended in 10 mL distilled water for 15 min, centrifuged at 20000 X g at 4OC for 10 min, and 1 mL of the supernatant collected. Ten pL of this supernatant was applied onto applicator filter paper strips aligned at the anodic end of the Immobiline 4-7 gel plate. IEF was performed at 3500 V maximum voltage, for a total of
100% Turkey
A
100% Beef 100% Pork
Figure I . Simplex design of set of mixtures containing beef, pork and turkey meat. Numbers 1-15 are identity numbers of samples within one sample set. Each comer represents pure (100%) samples. Lines at equal distances from a comer represent samples of equal concentration of that component. Starting from a given comer, there is one pure sample, two samples at 75%, three samples at 50%, four samples at 25% and five samples without the given component.
15 000 Vh. After completion of IEF, the gels were stained as recommended by Pharmacia [ 161, except that methanol was substituted for ethanol in destaining solutions.
2.4 Image processing procedures
The gels were photographed by 35 mm colour film (Kodak Ektachrome 64). The images were transferred (by Kodak Norge NS, Oslo, Norway) to a digital format (.pcd format) and stored on a CD-ROM. Image processing and analysis steps were performed by use of ImagePro (Vers. 1.3) (Media Cybernetics). The images in .pcd format were used at 5 18 pixels resolution in the migration direction of the gel lanes. Before processing the data, the images were converted to grey scale and the gel lanes oriented in the vertical direction. Background noise and inhomogeneities were corrected in the following way: A background image was constructed from each original image by applying the “dilate” filter with a frame size of 3 X 1 pixels (column). The filter was applied sixfold. The resulting (background) image retained most trends of background and noise, but lost protein band structures. The resulting image was subtracted from the original picture of the gel by the ImageF’ro procedure “background correction”. Signal opti- mization was performed by the following procedure. First, the background-corrected image was filtered by “sculpture” filter and a frame size of 3 X 3 pixels. A given peak in this image consists of one dark and one light side. Each of these sides have a derivative of the same sign. Thus, starting from the dark side, the image becomes gradually darker until the top of the peak, where it suddenly becomes intensely bright. From that point on, the image again becomes gradually darker. Hence, “horizontal edge” filtering (frame size 3 X 3) on this image produces an image which highlights vertical changes (= bands) and largely ignores random noise. A shift in band mobility between samples will cause the same band to be interpreted as different variables in those samples. Consequently, there is a need to align the different gel lanes carefully. The procedure used was to copy a section of an image comprising the complete track of one sample, and subsequently, paste that section onto a result image, using temporary guide lines to maximize the alignment of the three to four most abundant bands located in the central region of the track. The density profile of each gel lane was obtained by the ImagePro tool ‘line profile’, which records the average density across the lane in every pixel length- way. This vector was transferred to Microsoft Excel by Dynamic Data Exchange. The whole matrix consisting of all density profiles was stored in ASCII format.
Multivariate analysis of IEF profiles 3 105 Elecfrophoresis 1998, 19, 3 103-3109
2.5 Multivariate data analysis after background removal is shown in Fig. 3. and thus the
Chemometric analyses were performed using The Unscram- bler (Vers. 6.11) (CAM0 ASA, Norway). Mathematical operations on matrices were performed using MATLAB (Vers. 4 .2~. 1) (The Mathworks, USA). Simultaneous multi- variate calibration of content of all species in the meat mixtures was performed with the partial least squares 2 (PLS2) procedure [ 171. The PLS2 algorithm decomposes the X-matrix (the matrix consisting of all IEF profiles) in a
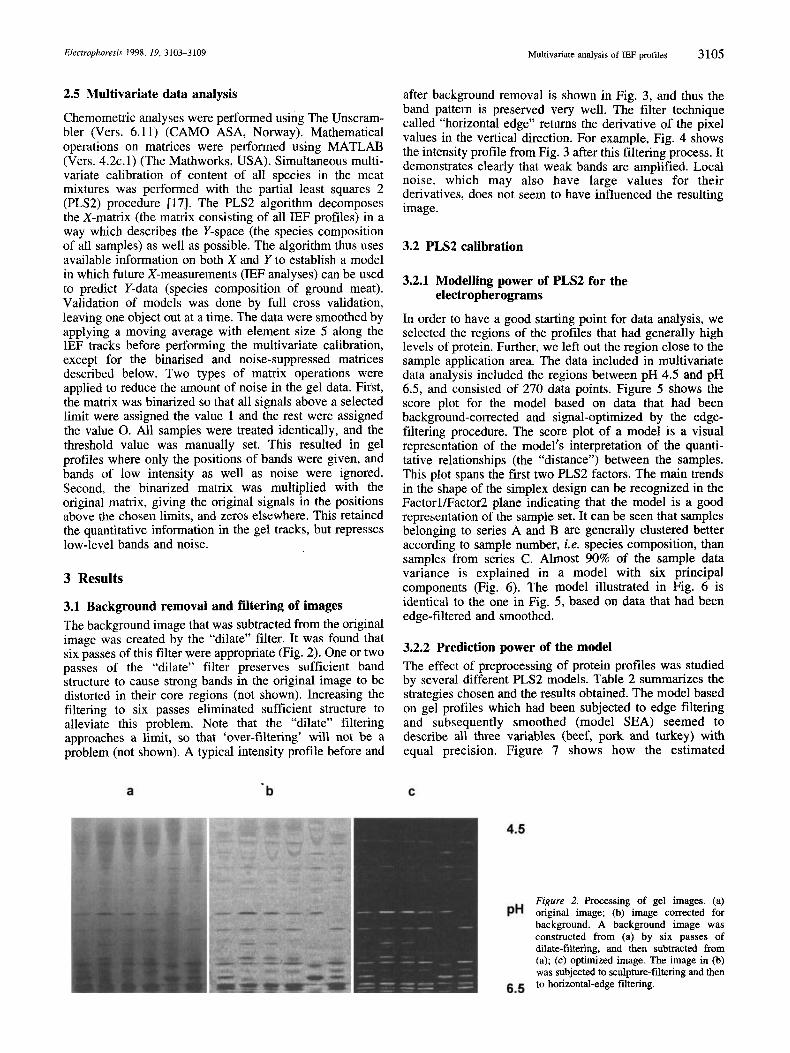
band pattern is preserved very well. The filter technique called “horizontal edge” returns the derivative of the pixel values in the vertical direction. For example, Fig. 4 shows the intensity profile from Fig. 3 after this filtering process. It demonstrates clearly that weak bands are amplified. Local noise, which may also have large values for their derivatives, does not seem to have influenced the resulting image.
way which describes the Y-space <the species-composition of all samples) as well as possible. The algorithm thus uses available information on both X and Y to establish a model
3.2 PLS2 calibration
in which future X-measurements (IEF analyses) can be used to predict Y-data (species composition of ground meat). Validation of models was done bv full cross validation.
3.2.1 Modelling power of pLs2 for the electropherograms
leaving one object out at a time. The data were smoothed by applying a moving average with element size 5 along the IEF tracks before performing the multivariate calibration, except for the binarised and noise-suppressed matrices described below. Two types of matrix operations were applied to reduce the amount of noise in the gel data. First, the matrix was binarized so that all signals above a selected limit were assigned the value 1 and the rest were assigned the value 0. All samples were treated identically, and the threshold value was manually set. This resulted in gel profiles where only the positions of bands were given, and bands of low intensity as well as noise were ignored. Second, the binarized matrix was multiplied with the original matrix, giving the original signals in the positions above the chosen limits, and zeros elsewhere. This retained the quantitative information in the gel tracks, but represses low-level bands and noise.
3 Results
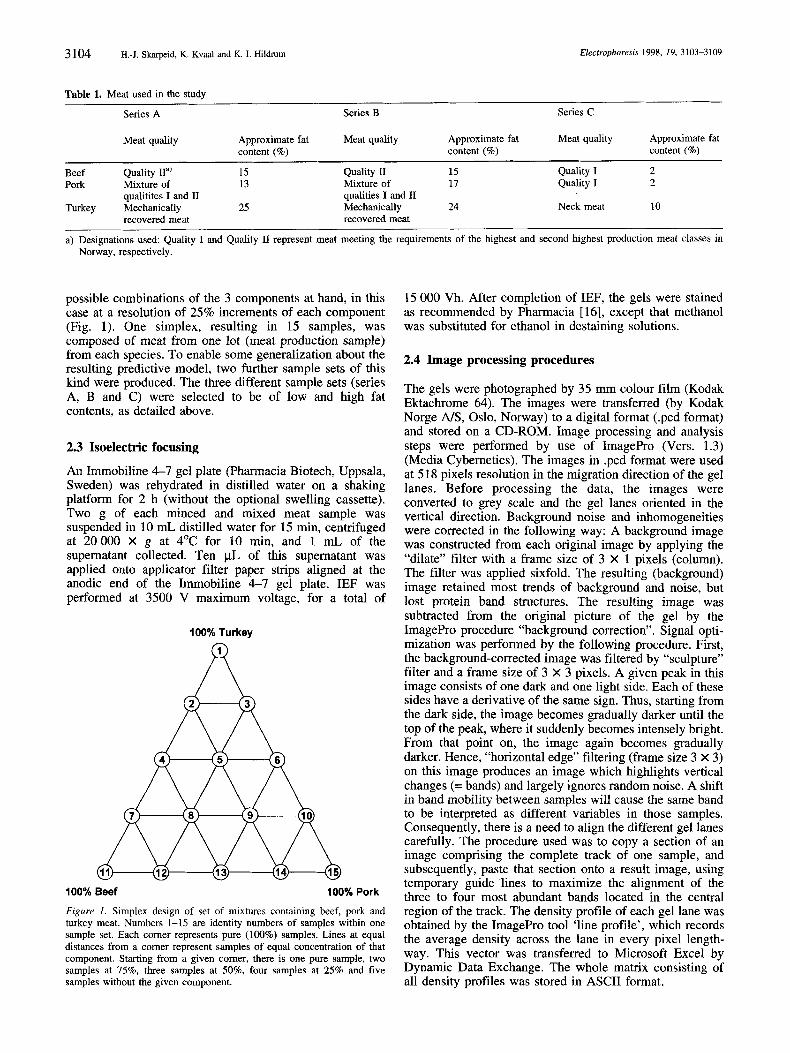
3.1 Background removal and filtering of images The background image that was subtracted from the original image was created by the “dilate” filter. It was found that six passes of this filter were appropriate (Fig. 2). One or two passes of the “dilate” filter preserves sufficient band structure to cause strong bands in the original image to be distorted in their core regions (not shown). Increasing the filtering to six passes eliminated sufficient structure to alleviate this problem. Note that the “dilate” filtering approaches a limit, so that ‘over-filtering’ will not be a problem (not shown). A typical intensity profile before and
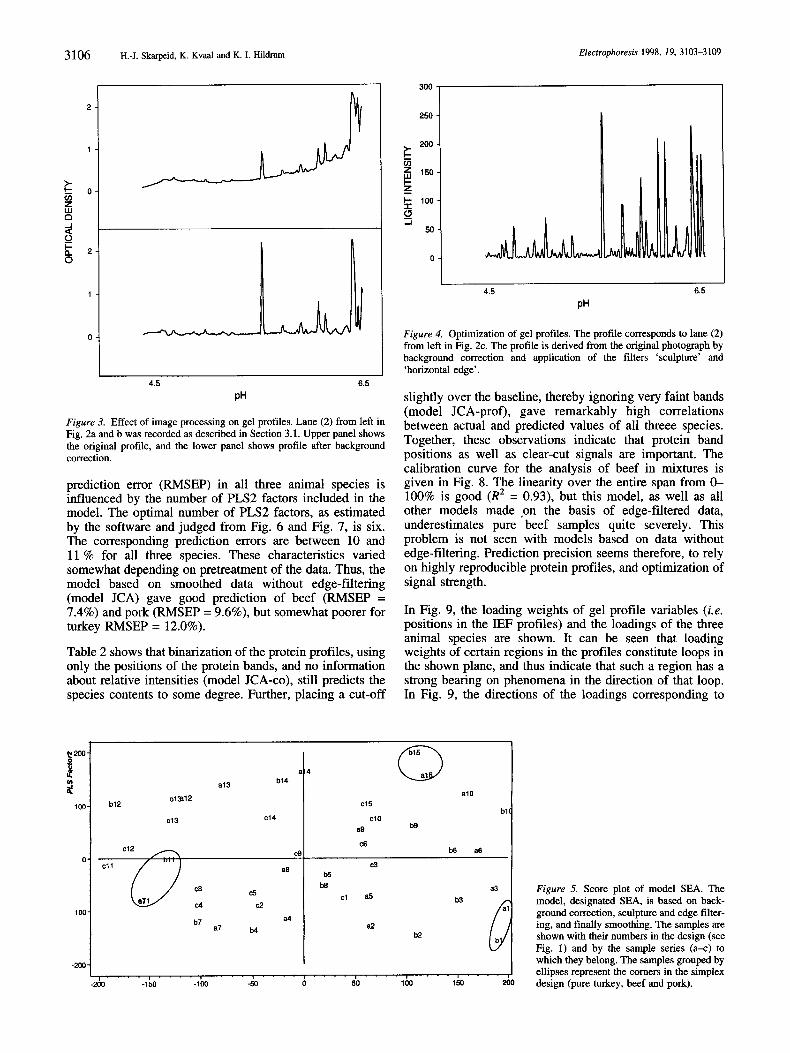
In order to have a good starting point for data analysis, we selected the regions of the profiles that had generally high levels of protein. Further, we left out the region close to the sample application area. The data included in multivariate data analysis included the regions between pH 4.5 and pH 6.5, and consisted of 270 data points. Figure 5 shows the score plot for the model based on data that had been background-corrected and signal-optimized by the edge- filtering procedure. The score plot of a model is a visual representation of the model’s interpretation of the quanti- tative relationships (the “distance”) between the samples. This plot spans the first two PLS2 factors. The main trends in the shape of the simplex design can be recognized in the Factorl/Factor2 plane indicating that the model is a good representation of the sample set. It can be seen that samples belonging to series A and B are generally clustered better according to sample number, i.e. species composition, than samples from series C. Almost 90% of the sample data variance is explained in a model with six principal components (Fig. 6). The model illustrated in Fig. 6 is identical to the one in Fig. 5, based on data that had been edge-filtered and smoothed.
3.2.2 Prediction power of the model The effect of preprocessing of protein profiles was studied by several different PLS2 models. Table 2 summarizes the strategies chosen and the results obtained. The model based on gel profiles which had been subjected to edge filtering and subsequently smoothed (model SEA) seemed to describe all three variables (beef, pork and turkey) with equal precision. Figure 7 shows how the estimated
a b C
4.5
Figure 2. Processing of gel images. (a) original image; (b) image corrected for background. A background image was constructed from (a) by six passes of dilate-filtering, and then subtracted from (a); (c) optimized image. The image in (b) was subjected to sculpture-filtering and then
’”
6.5 to horizontal-edge filtering.
3 106 H.4. Skarpeid, K. Kvaal and K. I. Hildrum
0-
-100-
-200 -
Electrophoresis 1998, 19, 3103-3109
c6 c12 c9 b6 a6
c3 b5
a8 Cl 1
a3 b8
CI a5 b3 c5 C8
c4 c2
b7 c a4 a2
b2 a7 M
I ' " ' " " ~ ~ ~ ' ' I ' ' ' ~ I ' ~ ~ ~ ' ~ . ~ ~ ' ~ ~ '
R
4.5
PH 6.5
Figure 3. Effect of image processing on gel profiles. Lane (2) from left in Fig. 2a and b was recorded as described in Section 3.1. Upper panel shows the original profile, and the lower panel shows profile after background correction.
prediction error (RMSEP) in all three animal species is influenced by the number of PLS2 factors included in the model. The optimal number of PLS2 factors, as estimated by the software and judged from Fig. 6 and Fig. 7, is six. The corresponding prediction errors are between 10 and 11 % for all three species. These characteristics varied somewhat depending on pretreatment of the data. Thus, the model based on smoothed data without edge-filtering (model JCA) gave good prediction of beef (RMSEP = 7.4%) and pork (RMSEP = 9.6%), but somewhat poorer for turkey RMSEP = 12.0%).
Table 2 shows that binarization of the protein profiles, using only the positions of the protein bands, and no information about relative intensities (model JCA-co), still predicts the species contents to some degree. Further, placing a cut-off
300 1 250 1 150
f 2ool I
4.5 6.5
PH
Figure 4. Optimization of gel profiles. The profile corresponds to lane (2) from left in Fig. 2c. The profile is derived from the original photograph by background correction and application of the filters 'sculpture' and 'horizontal edge'.
slightly over the baseline, thereby ignoring very faint bands (model JCA-prof), gave remarkably high correlations between actual and predicted values of all threee species. Together, these observations indicate that protein band positions as well as clear-cut signals are important. The calibration curve for the analysis of beef in mixtures is given in Fig. 8. The linearity over the entire span from & 100% is good (R2 = 0.93), but this model, as well as all other models made con the basis of edge-filtered data, underestimates pure beef samples quite severely. This problem is not seen with models based on data without edge-filtering. Prediction precision seems therefore, to rely on highly reproducible protein profiles, and optimization of signal strength.
In Fig. 9, the loading weights of gel profile variables (i.e. positions in the IEF profiles) and the loadings of the three animal species are shown. It can be seen that loading weights of certain regions in the profiles constitute loops in the shown plane, and thus indicate that such a region has a strong bearing on phenomena in the direction of that loop. In Fig. 9, the directions of the loadings corresponding to
c13
cl5
c14 I c10 ta a9
bl
Figure 5. Score plot of model SEA. The model, designated SEA, is based on back- ground correction, sculpture and edge filter- ing, and finally smoothing. The samples are shown with their numbers in the design (see Fig. 1) and by the sample series (a-c) to which they belong. The samples grouped by ellipses represent the comers in the simplex design (pure turkey, beef and pork).
Electrophoresis 1998, 19, 3103-3109 Multivariate analysis of IEF profiles 3 107
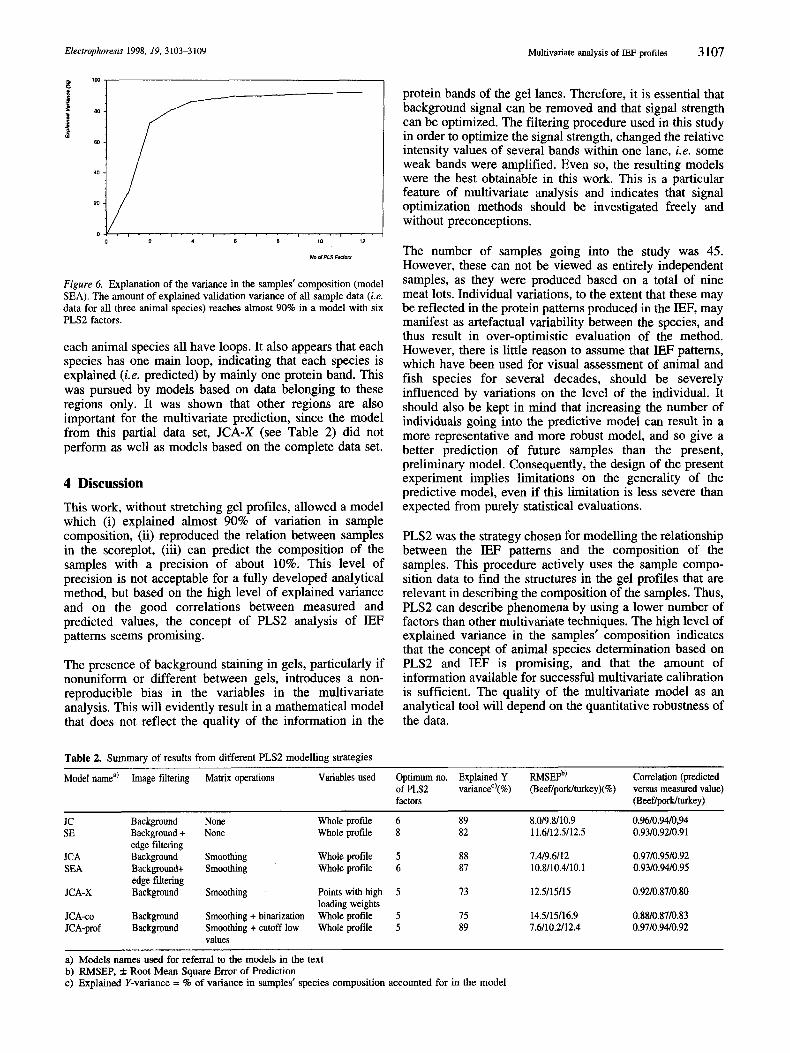
Figure 6. Explanation of the variance in the samples’ composition (model SEA). The amount of explained validation variance of all sample data ( i e . data for all three animal species) reaches almost 90% in a model with six PLS2 factors.
each animal species all have loops. It also appears that each species has one main loop, indicating that each species is explained ( i e . predicted) by mainly one protein band. This was pursued by models based on data belonging to these regions only. It was shown that other regions are also important for the multivariate prediction, since the model from this partial data set, JCA-X (see Table 2) did not perform as well as models based on the complete data set.
4 Discussion This work, without stretching gel profiles, allowed a model which (i) explained almost 90% of variation in sample composition, (ii) reproduced the relation between samples in the scoreplot, (iii) can predict the composition of the samples with a precision of about 10%. This level of precision is not acceptable for a fully developed analytical method, but based on the high level of explained variance and on the good correlations between measured and predicted values, the concept of PLS2 analysis of IEF patterns seems promising.
The presence of background staining in gels, particularly if nonuniform or different between gels, introduces a non- reproducible bias in the variables in the multivariate analysis. This will evidently result in a mathematical model that does not reflect the quality of the information in the
protein bands of the gel lanes. Therefore, it is essential that background signal can be removed and that signal strength can be optimized. The filtering procedure used in this study in order to optimize the signal strength, changed the relative intensity values of several bands within one lane, i.e. some weak bands were amplified. Even so, the resulting models were the best obtainable in this work. This is a particular feature of multivariate analysis and indicates that signal optimization methods should be investigated freely and without preconceptions.
The number of samples going into the study was 45. However, these can not be viewed as entirely independent samples, as they were produced based on a total of nine meat lots. Individual variations, to the extent that these may be reflected in the protein patterns produced in the IEF, may manifest as artefactual variability between the species, and thus result in over-optimistic evaluation of the method. However, there is little reason to assume that IEF patterns, which have been used for visual assessment of animal and fish species for several decades, should be severely influenced by variations on the level of the individual. It should also be kept in mind that increasing the number of individuals going into the predictive model can result in a more representative and more robust model, and so give a better prediction of future samples than the present, preliminary model. Consequently, the design of the present experiment implies limitations on the generality of the predictive model, even if this limitation is less severe than expected from purely statistical evaluations.
PLS2 was the strategy chosen for modelling the relationship between the IEF patterns and the composition of the samples. This procedure actively uses the sample compo- sition data to find the structures in the gel profiles that are relevant in describing the composition of the samples. Thus, PLS2 can describe phenomena by using a lower number of factors than other multivariate techniques. The high level of explained variance in the samples’ composition indicates that the concept of animal species determination based on PLS2 and IEF is promising, and that the amount of information available for successful multivariate calibration is sufficient. The quality of the multivariate model as an analytical tool will depend on the quantitative robustness of the data.
Table 2. Summary of results from different PLS2 modelling strategies
Model namea) Image filtering Matrix operations Variables used Optimum no. Explained Y RMSEPb’ Correlation (predicted of PLS2 variance”’(%) (Beef/porkhrkey)(%) versus measured value) factors (Beef/pork/turkey)
JC SE
JCA SEA
JCA.
Background Background + edge filtering Background Background+ edge filtering
.X Background
JCA-co Background JCA-prof Background
None None
Smoothing Smoothing
Smoothing
Smoothing + binarization Smoothing + cutoff low values
Whole profile 6 89 8.0/9.8/10.9 0.96/0.94/0,94 82 11.6/12.5/12.5 0.93/0.92/0.91 Whole profile 8
Whole profile 5 88 7.4/9.6/12 0.97/0.95/0.92 Whole profile 6 87 10.8/10.4/10.1 0.93/0.94/0.95
Points with high 5 73 12.5/15/15 0.92/0.87/0.80 loading weights Whole profile 5 75 14.5/15/16.9 0.88/0.87/0.83 Whole profile 5 89 7.6/10.2/12.4 0.97/0.94/0.92
a) Models names used for referral to the models in the text b) RMSEP, f Root Mean Square Error of Prediction c) Explained Y-variance = % of variance in samples’ species composition accounted for in the model
3108 H . 4 . Skarpe.id, K. Kvaal and K. I. Hildrum Elecrrophoresis 1998, 19, 3103-3109
1 2 3 4 5 8 7 8 9 10 11 12
PLSZ Factor0
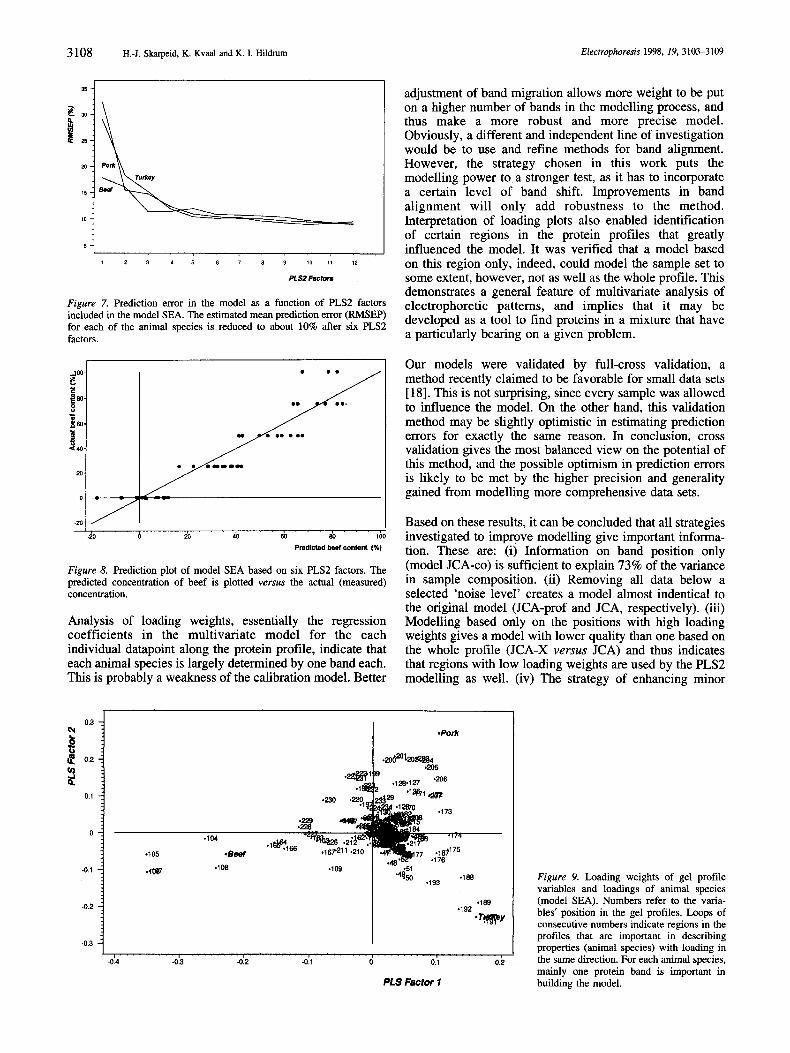
Figure 7. Prediction error in the model as a function of PLS2 factors included in the model SEA. The estimated mean prediction error (RMSEP) for each of the animal species is reduced to about 10% after six PLS2 factors.
/I I -20 0 20 4 60 80 100
Predicted beef content (%I
Figure 8. Prediction plot of model SEA based on six PLSZ factors. The predicted concentration of beef is plotted versus the actual (measured) concentration.
Analysis of loading weights, essentially the regression coefficients in the multivariate model for the each individual datapoint along the protein profile, indicate that each animal species is largely determined by one band each. This is probably a weakness of the calibration model. Better
adjustment of band migration allows more weight to be put on a higher number of bands in the modelling process, and thus make a more robust and more precise model. Obviously, a different and independent line of investigation would be to use and refine methods for band alignment. However, the strategy chosen in this work puts the modelling power to a stronger test, as it has to incorporate a certain level of band shift. Improvements in band alignment will only add robustness to the method. Interpretation of loading plots also enabled identification of certain regions in the protein profiles that greatly influenced the model. It was verified that a model based on this region only, indeed, could model the sample set to some extent, however, not as well as the whole profile. This demonstrates a general feature of multivariate analysis of electrophoretic patterns, and implies that it may be developed as a tool to find proteins in a mixture that have a particularly bearing on a given problem.
Our models were validated by full-cross validation, a method recently claimed to be favorable for small data sets [18]. This is not surprising, since every sample was allowed to influence the model. On the other hand, this validation method may be slightly optimistic in estimating prediction errors for exactly the same reason. In conclusion, cross validation gives the most balanced view on the potential of this method, and the possible optimism in prediction errors is likely to be met by the higher precision and generality gained from modelling more comprehensive data sets.
Based on these results, it can be concluded that all strategies investigated to improve modelling give important informa- tion. These are: (i) Information on band position only (model JCA-co) is sufficient to explain 73% of the variance in sample composition. (ii) Removing all data below a selected ‘noise level’ creates a model almost indentical to the original model (JCA-prof and JCA, respectively). (iii) Modelling based only on the positions with high loading weights gives a model with lower quality than one based on the whole profile (JCA-X versus JCA) and thus indicates that regions with low loading weights are used by the PLS2 modelling as well. (iv) The strategy of enhancing minor
0.3 -4
u c b Q 0.2
5! v)
0.1
0
-0.1
-0.2
-0.3 I , _ _ _ I
-0.4 -0.3 -0.2 -0.1 0 0.1 0.2
PLS Factor 1
Figure 9. Loading weights of gel profile variables and loadings of animal species (model SEA). Numbers refer to the varia- bles’ position in the gel profiles. Loops of consecutive numbers indicate regions in the profiles that are important in describing properties (animal species) with loading in the same direction. For each animal species, mainly one protein band is important in building the model.
Multivariate analysis of IEF profiles 3 109 Elecfrophoresis 1998, 19, 3103-3109
bands by the edge-filtering procedure gives models (SE and SEA) which predict all three components with equal prediction errors and correlation coefficients. To date, this seems to be most robust modelling strategy for the system under investigation. The models seem to be somewhat more complex, as they need more factors to obtain optimum prediction, possibly because they make use of a larger amount of the complex information present in the gel tracks. However, these models underestimate the beef content in the pure beef samples.
The present work demonstrates the feasibility of using multivariate regression as an data-analytical tool to system- atic and operator-independent extraction of information in electrophoretic protein profiles. The chosen model system, identification of animal species in ground meat mixtures, is typical of electrophoretic profiling applications. When one or two components are included, it is possible to interpret the patterns produced visually, although they rely on the personal judgement of an experienced analyst. This study also shows that mixtures of three species can be handled without any prior knowledge of the system when using multivariate regression. It has further pointed out, that all steps involved in this analysis may have to be optimized in order to achieve a method suitable for practical routine use. We are currently pursuing this by investigating key issues that may improve the method. This includes the reproduc- ibility of protein profiles or alternatively some kind of mobility adjustments in the protein profiles, processing of electropherograms in terms of background removal and signal optimization, as well as the actual mathematical modelling process.
The technical assistance of Ms Grete Sereb), Mr @wind Eide and Ms Rita Moe in preparing meat mixtures and performing electrophoretic separations is greatfully
acknowledged. We also want to thank Drxient . Uv G. Indahl for valuable discussions in the course of this work.
Received April 30, 1998
5 References [I] S0ndergaard. I., Jensen, K., Krath, B. N., Electrophoresis 1994, 15,
[21 Jensen, K., Kesmir, C., Sondergaard, I., Electrophoresis 1996, 17,
I31 Zimmermann, C. W., Gms, F. H., Dux, R., Electrophoresis 1995, 16,
[4] Grus, F. H., Zimmermann, C. W., Electrophoresis 1997, 18, 1120- 1125.
[5 ] Lumley, I., in: Ashurst, P. R., Dennis, M. J. (Eds.), Food Authentication, Blackie Academic and Professional, London 1996,
[61 Hildrum, K. I,, Ellekjaer, M. R., Isaksson, T., Meat Focus Interna- tional 1995, 4, 156-160.
[7] Ellekjaer, M. R., Hildrum, K. I., Naes, T., Isaksson, T., J. Near Infrared Spectr. 1993, 1, 65-75.
[8] Kvaal, K. Baardseth, P., Indahl, U., Isaksson, T., in: Naes, T., Risvik. E., (Eds.) Multivariate Analysis in Sensory Science, Elsevier, Amsterdam 1996, pp. 135-157.
584-588.
694-698.
941-947.
pp. 108-139.
[9] Ellekjaer, M., PhD Thesis, Norwegian Agricultural College, 1993. [lo] Malmheden-Yman I., Application Note 380, Pharmacia LKB
[ l I] Bauer, F., Kelner, A., Proceedings of the International Congress of
[12] Jemmi, T., Schlosser, H., Fleischwirtschafi 1991, 71, 1191-1192. [13] Kaiser, K. P., Matheis, G., Knita-Dumnann, C., Belitz, H. H.,
Zeitschr. Lebensm Unters. Forsch, 1980, 171, 415-419. [I41 AOAC Official Methods of Analysis, 1995, 16" ed., 39.1.06. [I51 Scheff6, H., J. Roy. Statist. Soc., Ser. B 1958, 20, 344-360. [16] lmmobiline DryPlate User Manuul, Pharmacia Biotech Publication
[17] Martens, H., Naes, T., Multivariate Calibration, John Wiley & Sons,
[18] Martens, H., J. Chemometr.lntel1. Lab. System 1998, in press.
Biotechnology, Uppsala 1992.
Meat Science and Technology, 1989, 35, Vol. II, 521.
71-7030-01 Edition AB, Uppsala 1995.
New York 1989.