identification of context-dependent expression ... · (pearson r = 0.74) with the percentage of...
TRANSCRIPT

Nature GeNetics VOLUME 49 | NUMBER 1 | JANUARY 2017 139
Genetic risk factors often localize to noncoding regions of the genome with unknown effects on disease etiology1,2. Expression quantitative trait loci (eQTLs) help to explain the regulatory mechanisms underlying these genetic associations3–6. Knowledge of the context that determines the nature and strength of eQTLs may help identify cell types relevant to pathophysiology and the regulatory networks underlying disease7–17. Here we generated peripheral blood RNA–seq data from 2,116 unrelated individuals and systematically identified context-dependent eQTLs using a hypothesis-free strategy that does not require previous knowledge of the identity of the modifiers. Of the 23,060 significant cis-regulated genes (false discovery rate (FDR) ≤ 0.05), 2,743 (12%) showed context-dependent eQTL effects. The majority of these effects were influenced by cell type composition. A set of 145 cis-eQTLs depended on type I interferon signaling. Others were modulated by specific transcription factors binding to the eQTL SNPs.
We created the Biobank-Based Integrative Omics Study (BIOS) data set by sequencing whole peripheral blood mRNA in 2,116 healthy adults from four Dutch cohorts18–21 (Supplementary Table 1 and
Supplementary Note; EGAD00001001623). We quantified gene and exon expression, as well as exon ratios (the proportion of expres-sion of an exon relative to the total expression of all exons of a gene) and poly(A) ratios (the ratio of expression in upstream and down-stream parts of 3′ UTRs separated by annotated polyadenylation (poly(A)) sites), and performed cis-eQTL mapping for all of these (Supplementary Note). We detected cis-eQTL effects for 66% of the protein-coding genes and 19% of the noncoding genes tested. In total, we identified eQTL effects for 23,060 different genes (FDR ≤ 0.05). These eQTLs replicated well in earlier microarray-based data sets from blood samples22 and an RNA–seq data set based on lym-phoblastoid cell lines (LCLs)23 (Supplementary Note), but they also substantially extended the list of genes that are known to be under genetic regulation (replication results are given in the Supplementary Note and Supplementary Table 2). In addition to detecting gene-level eQTLs, we identified 21,888 different genes with one or more exon-level QTL effects and 9,777 and 2,322 genes where SNPs affected the inclusion rate of exons and the usage of poly(A) sites, respectively (Supplementary Table 3). All QTLs can be found using our QTL browser (http://genenetwork.nl/biosqtlbrowser). Multiple unlinked SNPs in the same locus may independently influence expression or
Identification of context-dependent expression quantitative trait loci in whole bloodDaria V Zhernakova1,20, Patrick Deelen1,2,20, Martijn Vermaat3,20, Maarten van Iterson4,20, Michiel van Galen3, Wibowo Arindrarto5, Peter van ’t Hof5, Hailiang Mei5, Freerk van Dijk1,2, Harm-Jan Westra6–8, Marc Jan Bonder1, Jeroen van Rooij9, Marijn Verkerk9, P Mila Jhamai9, Matthijs Moed4, Szymon M Kielbasa4, Jan Bot10, Irene Nooren10, René Pool11, Jenny van Dongen11, Jouke J Hottenga11, Coen D A Stehouwer12,13, Carla J H van der Kallen12,13, Casper G Schalkwijk12,13, Alexandra Zhernakova1, Yang Li1, Ettje F Tigchelaar1, Niek de Klein1, Marian Beekman4, Joris Deelen4, Diana van Heemst14, Leonard H van den Berg15, Albert Hofman16, André G Uitterlinden9, Marleen M J van Greevenbroek12,13, Jan H Veldink15, Dorret I Boomsma11, Cornelia M van Duijn17, Cisca Wijmenga1, P Eline Slagboom4, Morris A Swertz1,2, Aaron Isaacs13,17,18, Joyce B J van Meurs9, Rick Jansen19, Bastiaan T Heijmans4,21, Peter A C ’t Hoen3,21 & Lude Franke1,21
1University of Groningen, University Medical Center Groningen, Genomics Coordination Center, Groningen, the Netherlands. 2University of Groningen, University Medical Center Groningen, Department of Genetics, Groningen, the Netherlands. 3Department of Human Genetics, Leiden University Medical Center, Leiden, the Netherlands. 4Molecular Epidemiology Section, Department of Medical Statistics and Bioinformatics, Leiden University Medical Center, Leiden, the Netherlands. 5Sequence Analysis Support Core, Leiden University Medical Center, Leiden, the Netherlands. 6Divisions of Genetics and Rheumatology, Department of Medicine, Brigham and Women’s Hospital and Harvard Medical School, Boston, Massachusetts, USA. 7Partners Center for Personalized Genetic Medicine, Boston, Massachusetts, USA. 8Program in Medical and Population Genetics, Broad Institute of MIT and Harvard, Cambridge, Massachusetts, USA. 9Department of Internal Medicine, ErasmusMC, Rotterdam, the Netherlands. 10SURFsara, Amsterdam, the Netherlands. 11Department of Biological Psychology, Vrije Universiteit Amsterdam, Neuroscience Campus Amsterdam, Amsterdam, the Netherlands. 12Department of Internal Medicine, Maastricht University Medical Center, Maastricht, the Netherlands. 13School for Cardiovascular Diseases (CARIM), Maastricht University Medical Center, Maastricht, the Netherlands. 14Department of Gerontology and Geriatrics, Leiden University Medical Center, Leiden, the Netherlands. 15Department of Neurology, Brain Center Rudolf Magnus, University Medical Center Utrecht, Utrecht, the Netherlands. 16Department of Epidemiology, ErasmusMC, Rotterdam, the Netherlands. 17Genetic Epidemiology Unit, Department of Epidemiology, ErasmusMC, Rotterdam, the Netherlands. 18Maastricht Centre for Systems Biology (MaCSBio), Maastricht University, Maastricht, the Netherlands. 19Department of Psychiatry, VU University Medical Center, Neuroscience Campus Amsterdam, Amsterdam, the Netherlands. 20These authors contributed equally to this work. 21These authors jointly directed this work. Correspondence should be addressed to L.F. ([email protected]), P.A.C.’t.H. ([email protected]) or B.T.H. ([email protected]).
Received 2 December 2015; accepted 2 November 2016; published online 5 December 2016; doi:10.1038/ng.3737
l e t t e r s

140 VOLUME 49 | NUMBER 1 | JANUARY 2017 Nature GeNetics
l e t t e r s
mRNA processing of the same gene24. This was observed for more than half of the cis-regulated genes (Fig. 1a and Supplementary Fig. 1).
The gene-level cis-eQTL SNPs were strongly enriched for DNase I footprints, various histone marks and binding sites for multiple transcription factors25 (Supplementary Table 4 and Supplementary Note), suggesting the likely detection of causal regulatory variants. Moreover, top eQTL SNPs were significantly enriched for general enhancers and ones specific to blood cell types (taken from ref. 26), but not for enhancers specific to non-blood tissues (Supplementary Table 5). Evidence for the functionality of exon ratio and poly(A) ratio QTLs in mRNA splicing and polyadenylation, respectively, is also presented in the Supplementary Note.
One-third (2,064, or 32.7%) of previously established genetic risk factors for disease or complex traits (derived from the National Human Genome Research Institute (NHGRI) genome-wide association study (GWAS) catalog and a set of reported Immunochip associations, P ≤ 5 × 10⁻⁸; Supplementary Table 6) were in strong linkage disequilib-rium (LD; r2 ≥ 0.8) with a top eQTL SNP (Fig. 1b and Supplementary Table 7). As expected, eQTL effects were predominantly found for SNPs associated with hematological, lipid or immune-related traits. We observed highly significant enrichment of colocalization of eQTL and GWAS SNPs (r2 ≥ 0.8) for many immune disorders in comparison to the 10% overlap found for height, which we considered to repre-sent a conservative background level (inflammatory bowel disease (IBD), 1.6 × 10⁻¹⁰; multiple sclerosis, 9.8 × 10⁻⁹; rheumatoid arthritis, 1.5 × 10⁻⁵ ) (Fig. 1c and Supplementary Note). This indicates that our blood cis-eQTLs are highly informative for diseases such as IBD, multiple sclerosis and rheumatoid arthritis.
Effect sizes for eQTLs often depend on the cell type or tissue under investigation8–11,27,28 and may be modified by external and environmental factors14–17,29,30. We developed a hypothesis-free
strategy to identify which of the observed eQTLs were dependent on intrinsic or extrinsic factors (context-dependent eQTLs) (Fig. 2a,b, Online Methods and Supplementary Fig. 2). Instead of using known factors, such as the percentage of neutrophils in blood in a gene-by-environment interaction model13, we used the expression levels of other genes as interaction factors. We call these genes ‘proxy genes’, as they may reflect the abundance of a cell type or the activity of signaling pathways.
We identified 10 modules of in total 1,842 eQTLs independ-ently affected by 10 largely uncorrelated proxy genes (Fig. 2c and Supplementary Table 8). eQTLs with context-dependent effects can be obtained from our BIOS eQTL browser. An example is shown in Figure 2b, where we found an eQTL effect of SNP rs1981760 (a SNP associated with leprosy susceptibility) on NOD2 expression. Expression of the first top proxy gene, STX3, had a significant inter-action with this eQTL. Samples with very low expression of STX3 showed only a very weak eQTL effect on NOD2, whereas samples with very high STX3 expression showed a stronger eQTL effect. Further analysis demonstrated that STX3 expression was strongly correlated (Pearson r = 0.74) with the percentage of neutrophils in the blood, indicating that STX3 is a proxy for neutrophil levels in blood.
It can be challenging to understand what the proxy genes represent. We first assessed whether they are markers for specific cell types and correlated them with blood cell counts measured in our samples (for neutrophils, lymphocytes, eosinophils, basophils and monocytes) and baseline gene expression levels in purified blood cells from the BLUEPRINT consortium31 (Fig. 2c and Supplementary Fig. 3). Eight of the ten proxy genes likely represent the levels of specific cell types in blood (Supplementary Note). Analysis of eQTL gene expression in BLUEPRINT data (Supplementary Fig. 4a) and eQTL interactions with measured blood cell counts confirmed
Gene eQTLs
Exon eQTLs
Exon ratio QTLs
Poly(A) ratio QTLs
0
0
10
9
8
7
6
5
4
3
2
1 5,000
10,000
15,000
20,000
25,000Previously identified genetic risk factors that are in strong LD (r2 ≥ 0.8) with blood eQTLs
GWAS hits withoutblood eQTL: 67.3%
Gene eQTLs: 1.1%
Exon eQTLs: 6.1%
Multiple-level QTLs: 23.2%
Exon ratio QTLs: 1.7%Poly(A) ratio QTLs: 0.5%
a b c
Enr
ichm
ent o
f col
ocal
izin
g bl
ood
cis-
eQT
Ls (F
ishe
r’s e
xact
test
–lo
g 10 (P
))
Proportion of trait-associated SNPs in strong LD (r 2 ≥ 0.8) with eQTL SNP (%)
0 604020
P = 0.05
150 SNPs0 0 SSSSNNNN0 SN
50 SNPsSSNSNSNSNSNSN
70000 0 SNNNNPs
Num
ber o
f sig
nifc
ant c
is-e
QT
L ge
nes
Num
ber
of Q
TLs
inLD
(r2
≥ 0
.8)
with
kno
wnG
WA
S h
it
1,12
01,
650
736
132
296
482 84 8 95 13
0 25 1 39 54 7 0 33 38 13 1
Primary Secondary Tertiary Quaternary Quinary and up
e
Psoriasis
Mean platelet volume
Crohn's disease
Multiple sclerosis
Corneal structure
Inflammatory bowel disease
Ankylosing spondylitis
UC
Alzheimer diseaseAlzheimer disea
Parkinson disease
Triglycerides
HDL cholesterolType 2 diabetes
Refractive error
Platelet counts
Rheumatoid arthritis
Mean corpuscular hemoglobinPBCBB
Liver enzyme levels (γ-glutamyl transferase)
Type 1 diabetes
LDL cholesterol
Total cholesterol
Mean corpuscular volumAlzheimer disAl h i di
p e
o
RBC
Fibrinogen
Vitiligo
MMenaenan rcrchehee ((ageageg aatt ononsseett))r
Chronic lymphocytic leukemiaBreast cancer
Phospholipid lelevels (plasma)
BMD
dy mass indexSLEColorectal cancerr
Schizophrenia
Metabolic syndrommmmomMM
Prosve ev
trratooe cancer
ac
Atopicdermatitis
IgG glycosylationHeight
BodySchi C-reactive protei
Pieinn
Figure 1 Over 20,000 genes are regulated by cis-eQTLs overlapping with 33% of the entries in the NHGRI GWAS catalog. (a) Number of cis-regulated genes having one, two, three, four, and five or more independent eQTL effects (FDR ≤ 0.05). The number of eQTLs overlapping with SNPs in the GWAS catalog (r2 ≥ 0.8) appears in red. (b) Distribution of GWAS catalog variants over the different types of QTLs. Of the GWAS catalog SNPs, 8% affected exon-level QTLs or poly(A) ratio QTLs but did not affect overall gene expression levels. (c) Risk loci for autoimmune disorders and traits related to blood showed higher colocalization with eQTLs than those for anthropometric traits and diseases without an immune or hematological component. The x axis shows the percentage of GWAS hits colocalizing with eQTLs, and the y axis shows enrichment of overlap (calculated at the gene level), using genes associated with height as a conservative background.

Nature GeNetics VOLUME 49 | NUMBER 1 | JANUARY 2017 141
l e t t e r s
Leprosy risk SNP rs1981760 rs1981760
NO
D2
C/C C/T T/T
NO
D2
C/C C/T T/T C/C C/T T/T
NO
D2
NO
D2
STX3
STX3
Neutrophils 1
CD4+ T cells
NK cells/CD8+ T cells
Monocytes/macrophages
Erytrocytes
Type 1 interferon
Neutrophils 2
B cells
Eosinophils
Unknown
GO biol
ogica
l pro
cess
to
p en
riche
d pa
thway
Correlation to measured cell counts
1
2
3
4
5
6
7
8
9
10
75
25
19
8
11
10
11
3
11
7
971
337
226
188
181
156
145
121
123
120
Detection of bacterium
T cell selection
Cellular defense response
Hemoglobin metabolic process
Defense response to virus
Nerve growth factor receptorsignaling pathway
Regulation of defense response
Detection of bacterium
B cell receptor signaling pathway
Regulation of myeloid-leukocyte-mediated immunity
NOD2 eQTL in 106 samples with low STX3 gene expression levels
NOD2 eQTL in 106 samples with high STX3 gene expression levels
NOD2 eQTL in whole peripheral blood
a
b
c
Low High
rs1981760
rs1981760
Coexpression of top 100 genes per interaction module
–1 0 1
Correlation
Gene expression of top gene inpurified cell types (BLUEPRINT)
BLUEPRINT P value
17,291cis-eQTLs
29,750 expressedgenes
Calculate interactionfor all eQTL–gene
combinations
Identify gene, affecting most
cis-eQTLs
Regress outinteraction of
top gene
Determine eQTLs withsigni�cant interaction
with top gene
Determine whether gene is proxy for
cell type or stimulusRepeat 10×
Neu
trop
hil p
erce
ntag
e
1
1 × 10
–30
1 × 10
–60
80
30
50
40
60
70
• In�uences 971 eQTLs• Strongly correlated with neutrophil percentage (r = 0.74) • Highly expressed in puri�ed neutrophils
• Coexpressed genes involved in bacterium detection
First top gene: STX3
Conclusion: STX3 is a proxy forneutrophil granulocytes
NOD2 eQTL interaction analysis,STX3 interacts with rs1981760
Interaction
P = 1.1 × 10–69
C/C
C/T
T/T
P = 1.11 × 10–294 P = 7.27 × 10⁻¹⁰ P = 7.52 × 10⁻²⁵
Mod
ule n
umbe
r
Mod
ule d
escr
iption
Numbe
r of a
ffecte
d eQ
TLs
# eQ
TLs in
stro
ng L
D with
kn
own
GWAS h
its
Neutro
phil %
Lym
pocy
te %
Mon
ocyte
%
Eosino
phil %
Basop
hil %
CD8– n
aive
B cell
Mem
ory B
cell
Mac
roph
age
Infla
mm
ator
y mac
roph
age
Mat
ure
neut
roph
il
Eryth
robla
st
CD14+ CD16
– clas
sical
mon
ocyte
Regula
tory
T ce
ll
Altern
ative
ly ac
tivat
ed m
acro
phag
e
Effecto
r mem
ory C
D4+ , a
lpha−
beta
T ce
ll
Centra
l mem
ory C
D4+ , a
lpha−
beta
T ce
ll
CD4+ , a
lpha−
beta
T ce
ll
Effecto
r mem
ory C
D8+ , a
lpha−
beta
T ce
ll
Centra
l mem
ory C
D8+ , a
lpha−
beta
T ce
ll
Cytoto
xic C
D56dim
nat
ural
killer
cell
Class s
witche
d m
emor
y B ce
ll
Figure 2 Identification of the strongest modifiers of eQTL effects. (a) Overview of the method used to annotate eQTLs as context dependent: each highly expressed gene (with at least one read in all samples) was tested for its ability to modify each of the 17,291 eQTLs affecting highly expressed genes. For each of the identified proxy genes, we determined the overall strength of the interaction effects with all eQTLs. We selected the strongest proxy gene and regressed its effects from the data. We did this for ten iterations, allowing the identification of ten independent proxy genes that affect the strength of eQTLs. (b) An example of a context-dependent eQTL effect is rs1981760, a strong eQTL for the NOD2 gene. This SNP is in strong LD (r2 = 0.99) with rs9302752, a variant associated with leprosy susceptibility. The leprosy risk allele (T) results in decreased expression of NOD2. In samples with low STX3A expression, only a weak eQTL effect is observed, whereas in samples with high STX3A expression a strong eQTL effect is observed. In accordance with these findings, using the STX3A gene as a covariate in an interaction model shows a very strong interaction effect. STX3A is the first proxy gene we identified, and its expression correlates strongly with neutrophil percentage (Pearson r = 0.72). Gene enrichment analysis of STX3A and other genes exhibiting similar interaction patterns shows involvement in antibacterial response. Furthermore, individuals carrying the leprosy risk allele have significantly weaker NOD2 upregulation in neutrophils than non-carriers. This is in line with earlier reports showing this eQTL to be stronger in FACS-sorted neutrophils than in monocytes27. Box plots show the median, the first and third quartiles, and 1.5 times the interquartile range. (c) We annotated each of our 10 proxy genes using the top 100 proxy genes from each module with similar effects and showed that, as expected, these top 100 genes are strongly correlated in each module. These sets of the top 100 proxies were used for gene function enrichment analysis (for full results, see supplementary table 12) and are correlated to known cell proportions. We used BLUEPRINT expression data for sorted populations of blood cells to validate cell-type-specific expression in each module; n = 2,116 individuals were used in the analysis.
142 VOLUME 49 | NUMBER 1 | JANUARY 2017 Nature GeNetics
l e t t e r s
the cell-type-dependent effects of neutrophils and eosinophils (Supplementary Fig. 5 and Supplementary Tables 9 and 10), but our unbiased analysis also identified effects for cell types for which actual cell counts were not available (erythroblasts, CD4+
T cells and natural killer (NK) cells/CD8+ T cells). Replication of our cell-type-dependent eQTLs in eQTL data sets from purified cell types supported these observations (Supplementary Fig. 4b,c and Supplementary Table 11).
a Coexpression of top 100 genes per interaction module
–1 0 1
Correlation
Module 7
Upregulated eQTL genesinterferome database annotation
Module 7, top 100 genes
eQTLs with significant interaction with module 7 top covariate gene SP140Module 7 top covariate gene
STAT1 6 h after IFN-αOverlap with ChIP–seq
STAT2 6 h after IFN-α
Positive correlation to SP140
Negative correlation to SP140
STAT3
SP140
Gene
Gene
7 0
0
0
20
Type I interferon Type II interferon
11
Type IIIinterferon
b
c
GO biological processPhagocytosis
EndocytosisMembrane invagination
Regulation of interleukin-8production
ReactomeInterferon signalingCytokine signaling in immune systemInterferon-alpha/beta signalingViral dsRNA:TLR3:TRIF complexActivates RIP1RIG–I/MDA5-mediated induction ofinterferon-alpha/beta pathways
GO biological processResponse to virus
Response to type I interferonCellular response to type I interferonType I interferon–mediated signaling
pathwayInduction of programmed cell death
ReactomeThe NLRP3 in�ammasomePlatelet activation, signaling andaggregationAdvanced glycosylationendproduct receptor signalingIn�ammasomes
Upregulated eQTL genes Downregulated eQTL genes
GO biological processResponse to type I interferon
Type I interferon productionCellular response to type I interferonType I interferon–mediated signaling
pathwayResponse to cytokine stimulus
ReactomeInterferon signalingInterferon-alpha/beta signalingCytokine signaling in immune systemRegulation of interferon-alpha signalingTRAF6-mediated IRF7 activation
GO biological processRegulation of exocytosis
Activation of protein kinase C activity by G-protein-coupled receptor protein
signaling pathwayEndosome to lysosome transport
Regulation of vesicle-mediated transportExocytosis
ReactomeERK/MAPK targetsMuscle contractionSema4D-induced cell migration andgrowth-cone collapseStriated muscle contractionCreation of C4 and C2 activators
KCTD12, ENSG00000264908
LY75, CD302, LY75-CD302
MFSD1SLC36A4
FAM105ATRIQK, ENSG00000212999
CMTM4PPM1F
GNAQIFNGR1
NACC2H2AFY, C5orf66
KRR1, GLIPR1
IRAK3, ENSG00000256072
CARD9
TSPAN4
CRTAP
HNMT
COMT, ARVCF
SGK3, C8orf44-SGK3
OAF
RCAN1
RAP2B
CPNE8
CECR5
SGK1
LYZ
TMEM167A AP1S2RGS18
GALNT1
LYZ, ENSG00000257764
PDGFC
MARVELD1
SLC27A1
MYCL, ENSG00000236546
LRP3
SGMS2, ENSG00000245293
CDK2AP1, ENSG00000235423
CYBRD1
CORO1C
ZDHHC7
KBTBD11
TUBGCP3SOX4
SNX30CCNY
BAIAP2-AS1
CEACAM1
NUB1
TAP2, ENSG00000250264
RNASEL
KIAA0040, ENSG00000265365
SELL
C7orf49, TMEM140
ISG20
TAP2
KPNB1
AP2B1
SEPT6
GART
TRIM26
EXOSC10
APOBEC3D
CNOT1
CACNA1A
PARP1SUPT5H
ITGB7SF3B2
ALDH18A1
ENSG00000230438IL2RG
APOBEC3GC9orf91
GTPBP1, ENSG00000203583, ENSG00000257034
SP140
ACSL5 APOBEC3F
CNDP2CUL1 SP110
C5orf56, ENSG00000234290
FANCASP140, SP110, ENSG00000243565
C5orf56
GTPBP1
CEACAM1, LIPE-AS1
SP100
GON4L
POLR2A
TFIP11ZHX2
THRAP3
IRF2
STAT3TRANK1
MIA3
TAPBPCCDC97
••••
•
••••
•
•••••
••••
•
•••••
••
•
•
••
••
•••
••
Regulation of phagocytosis
ADCK4TNFRSF11A
CSTB RECQL5, ENSG00000188126, MYO15B
ENSG00000203739
SLC22A7, CRIP3
PPIL3
RNASEH2B
NDUFA12FSTL3
C5orf45, TBC1D9B
ACCS
NPFF, ATF7, ENSG00000267281
OSGEP
OBFC1
VPS52, RPS18
HLA-DQA2
CPT1B, CHKB-CPT1B
UBAC2 PMM1
EDEM2
CD300E
LGALS9
CACNA1ATOR1A
SCIMP, ENSG00000261879SNX20, ENSG00000260249
LMNB1
LAP3 EXOSC9, CCNA2
NOD2
ZNF767
APOA1BP
CCDC137VAMP5SP100
DBF4BODF3B
BCAT1
P4HB, ENSG00000262831
S100A12CTNS
ENSG00000188126, MYO15B
CLEC4D
SLC46A2
SLC25A29, ENSG00000258504, ENSG00000259052
EPHB4ZNF117, ERV3-1
CLN6SLC25A29, ENSG00000258504
FCGR2B, ENSG00000234211
HCG27
PHOSPHO1
AATKMGAM
EIF4E3
PTK2B
RBM23
CRISPLD2
NKX3-1 PGM2
SLC35A5
CYB5R3
MAP1LC3B
ATXN1
DDX60L
CPD SPTLC2
MAX, ENSG00000259118
LPIN2
MPZL2LOXHD1
CCDC9
SELL
RAB3D, ENSG00000267174, ENSG00000267576
FAM212B
CREB5
TMEM184B, ENSG00000251267, ENSG00000256873
BAIAP2, AATK
AFF4ARHGAP24
H3F3B, UNK, MIR4738
LPAR1TMOD1
OR2W3
ABCC3
MUC20, LINC00969
LEF1-AS1CDC25B
SEL1L3
COQ6, ENTPD5CRYZ
SCML4
ENSG00000245556
CYB5B, ENSG00000260108
CCDC101
ST8SIA1ENSG00000228506CHCHD7
AFG3L2, TUBB6ALDH3A2
UBA7KRI1GBP5, ENSG00000237568
UNC93B1
KIAA0226
MT2ATOR1B
P4HB
HES4
OAS1SESTD1
PDK2
CD101
MYOF
ENSG00000223960
STAT1,GLSMYO15B AGPAT3
MASTL GOSR2
ATP9BTRGV3
TRAV35
ENSG00000260306LINC00667
LRRC8B, ENSG00000231999, ENSG00000251289 PDSS2 GP5 ZFP28ACAD8 ENSG00000223704FBXW8ENDOD1
PPM1KTXK
MTF2SPATA13
SLFN5CHERP, C19orf44 IMPACT
WDR3
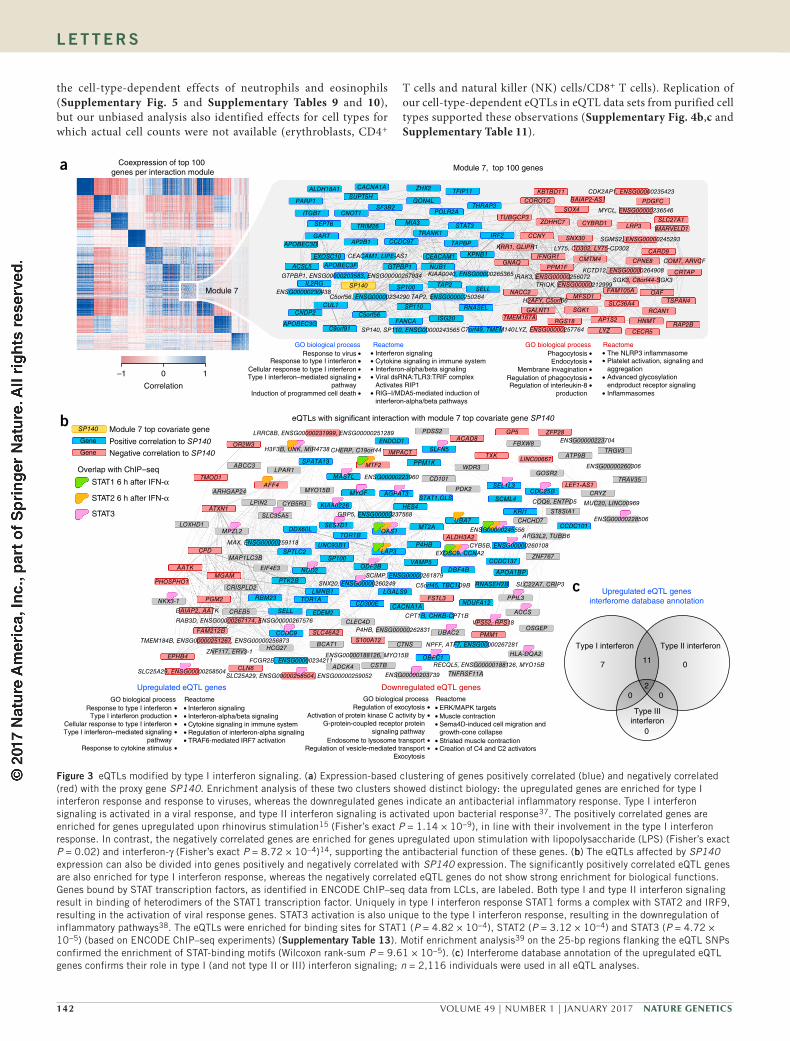
Figure 3 eQTLs modified by type I interferon signaling. (a) Expression-based clustering of genes positively correlated (blue) and negatively correlated (red) with the proxy gene SP140. Enrichment analysis of these two clusters showed distinct biology: the upregulated genes are enriched for type I interferon response and response to viruses, whereas the downregulated genes indicate an antibacterial inflammatory response. Type I interferon signaling is activated in a viral response, and type II interferon signaling is activated upon bacterial response37. The positively correlated genes are enriched for genes upregulated upon rhinovirus stimulation15 (Fisher’s exact P = 1.14 × 10⁻⁹), in line with their involvement in the type I interferon response. In contrast, the negatively correlated genes are enriched for genes upregulated upon stimulation with lipopolysaccharide (LPS) (Fisher’s exact P = 0.02) and interferon-γ (Fisher’s exact P = 8.72 × 10⁻⁴)14, supporting the antibacterial function of these genes. (b) The eQTLs affected by SP140 expression can also be divided into genes positively and negatively correlated with SP140 expression. The significantly positively correlated eQTL genes are also enriched for type I interferon response, whereas the negatively correlated eQTL genes do not show strong enrichment for biological functions. Genes bound by STAT transcription factors, as identified in ENCODE ChIP–seq data from LCLs, are labeled. Both type I and type II interferon signaling result in binding of heterodimers of the STAT1 transcription factor. Uniquely in type I interferon response STAT1 forms a complex with STAT2 and IRF9, resulting in the activation of viral response genes. STAT3 activation is also unique to the type I interferon response, resulting in the downregulation of inflammatory pathways38. The eQTLs were enriched for binding sites for STAT1 (P = 4.82 × 10⁻⁴), STAT2 (P = 3.12 × 10⁻⁴) and STAT3 (P = 4.72 × 10⁻⁵) (based on ENCODE ChIP–seq experiments) (supplementary table 13). Motif enrichment analysis39 on the 25-bp regions flanking the eQTL SNPs confirmed the enrichment of STAT-binding motifs (Wilcoxon rank-sum P = 9.61 × 10⁻⁵). (c) Interferome database annotation of the upregulated eQTL genes confirms their role in type I (and not type II or III) interferon signaling; n = 2,116 individuals were used in all eQTL analyses.

Nature GeNetics VOLUME 49 | NUMBER 1 | JANUARY 2017 143
l e t t e r s
Cell-type-specific eQTL genes were enriched in cell-type- specific signaling pathways (Fig. 2c and Supplementary Table 12). For example, the genes for which cis-eQTL effects were particularly strong in erythroblasts (represented by proxy gene TSPAN5) are enriched for erythrocyte-specific functions. They were also enriched in binding sites for transcription factors involved in erythrocyte development, on the basis of Encyclopedia of DNA Elements (ENCODE) ChIP–seq data (GATA1, TAL1, GATA2 and MAFK, each with an enrichment P value ≤1 × 10⁻⁵)32–34. A well-established cis-eQTL for SMIM1, an erythrocyte-specific gene encoding a protein that determines the Vel blood group4, was contained in the set of eQTLs affected by TSPAN5 expression. For eQTLs affected by other proxy genes, we also identi-fied specific transcription factors with established functions in the corresponding cell types (Supplementary Table 13).
In Supplementary Figure 6 and the Supplementary Note, we show examples of how eQTLs can be used to gain insights into five autoim-mune disorders. Clustering of the eQTL genes based on coexpression identified sets of genes hinting at specific cell types and biological functions. For IBD, for instance, the clustering identified a T cell clus-ter and a neutrophil cluster. Adding the cell-type-dependent eQTLs further corroborated the cell type annotations of the clusters. In total, we found 138 context-dependent eQTLs for GWAS-identified variants (Supplementary Table 14).
The identified interaction modules are not restricted to cell-type-specific effects. One of the proxy genes, SP140, is not a proxy for cell type but is a proxy for type I interferon response, as demonstrated by pathway enrichment of genes that correlated positively with SP140 expression levels (Supplementary Note). Genes that correlated nega-tively with SP140 expression are involved in antibacterial response and inflammation (Fig. 3a). Likewise, the affected eQTL genes can be divided into two groups: those positively and those negatively cor-related with SP140 expression (Fig. 3b). Gene annotations from the interferome database35 confirmed that the upregulated eQTL genes are indicative of type I, but not of type II, interferon response (Fig. 3c). In support of the modifying effects of viral cues on this set of eQTLs, eQTL genes that were recently reported as rhinovirus response QTLs15 typically demonstrated higher SP140 interaction effects than other eQTL genes (Wilcoxon P = 0.02).
Each of the ten aforementioned proxy genes demonstrated effects on many (>120) eQTLs. However, some other factors may also exist
that affect more limited numbers of eQTLs. To identify these factors, we first corrected the expression data for the ten proxy genes and their eQTL interaction effects and then ascertained for each gene-level eQTL whether the size of the eQTL effect was significantly depend-ent on the expression of any other gene. This analysis resulted in the identification of an additional set of 901 context-dependent eQTLs (FDR ≤ 0.05) (Supplementary Table 15). Of these eQTL interactions, 113 could also be detected in Geuvadis LCLs (FDR ≤ 0.05; 94% with the same direction of interaction) (Supplementary Table 16). These LCLs are homogeneous cell populations, so any interaction effect that replicates is unlikely to be due to cell-type-specific eQTL effects but rather reflects external stimulation or activation of core biological processes. A few of these context-dependent eQTLs enable inference of regulatory networks.
An example is the cis-eQTL (rs968567) effect on the lipid-biosynthe-sis-related gene FADS2 that is modified by expression of the sterol reg-ulatory element–binding transcription factor gene SREBF2 (P = 4.1 × 10⁻¹⁴, P value in Geuvadis = 0.002) (Fig. 4a,b). The eQTL SNP is in close proximity to an SREBF2-binding site (ENCODE ChIP–seq data; Fig. 4c), and it is therefore likely that the SNP modifies the affinity of the FADS2 promoter for SREBF2. SREBF2 showed a significant negative correlation with HDL cholesterol levels (Pearson r = −0.18, P = 5.1 × 10⁻⁶) and a positive correlation with lymphocyte percentage (Pearson r = 0.19, P = 1.6 × 10⁻⁶). Partial correlation analyses showed that the correlation with HDL cholesterol levels was independent of the correlation with lymphocyte percentage (Pearson r on residuals of HDL cholesterol after correcting for lymphocyte percentage = −0.17, P = 2.7 × 10⁻⁵), showing that the correlation with HDL cholesterol is not driven by cell type composition. We propose a model where extracellular (HDL) cholesterol levels modify SREBF2 binding to the FADS2 promoter, which in turn has effects on the expression of FADS2 and lipid desaturase activity in the cell. This SNP also increases risk for rheumatoid arthritis, blood metabolite levels and lipid levels; using our method, we now implicate altered binding of SREBF2 as a possible functional mechanism behind these associations.
Another example is a cis-eQTL effect on the MYBL2 gene, encoding a known transcription factor that controls cell division and a tumor suppressor36 (Fig. 5a–c). According to ENCODE ChIP–seq data, the top eQTL SNP, rs285205, is located in an EBF1-binding site (Fig. 5d). EBF1 is a known player in B cell differentiation and proliferation.
44
0
SR
EB
F2
ChI
P–s
eq b
indi
ng
FADS2 transcripts
rs968567
a c
b61.57 61.58 61.59 61.60 61.61 61.62 61.63
FADS2 locus (11q12.2) (Mb)SREBF2
rs968567 (G/A)
rs968567
FADS2Sterol-binding factor
Genetic risk factor for rheumatoid arthritis, blood metabolite levels and lipid levels
Fatty acid desaturase 2
FA
DS
2 ex
pres
sion
SREBF2 expression
A/A
G/A
G/G
Interaction P = 4.1 × 10⁻¹⁴
Figure 4 FADS2 eQTL modulated by SREBF2 expression. (a) The eQTL SNP rs968567 is located in a SREBF2-binding site in the FADS2 promoter. (b) The eQTL is modulated by SREBF2 expression and is stronger in samples with low SREBF2 expression. The nominal P value for the interaction effect is given; n = 2,116 individuals were used in the eQTL analysis. (c) rs968567 is located in an ENCODE ChIP–seq peak of SREBF2 binding.

144 VOLUME 49 | NUMBER 1 | JANUARY 2017 Nature GeNetics
l e t t e r s
Although FCRLA expression was the strongest modifier of the eQTL, EBF1 expression was highly correlated with FCRLA expression and showed a significant interaction effect on the MYBL2 eQTL (P = 1.8 × 10⁻¹⁴) (Fig. 5c). The eQTL SNP therefore likely affects the binding affinity of EBF1.
In conclusion, we greatly expanded the catalog of SNPs that have a known regulatory function. To gain a better understanding of the biol-ogy behind these regulatory variants, we assessed the context depend-ency of the eQTLs and determined 2,743 to be context dependent. With future increases in sample size, we expect that it will become possible to identify more unanticipated intrinsic factors and external stimuli that modify the downstream effects of genetic risk factors. As such, our approach complements perturbation experiments in gain-ing better insight into regulatory networks and their stimuli, and it can easily be applied to other tissues. A caveat of our hypothesis-free approach is that it is not always straightforward to understand
which internal or external cues the proxy genes represent. Integration with other expression or transcription factor binding data, as we have done here, is therefore instrumental for the interpretation of context-dependent eQTLs.
METHODSMethods, including statements of data availability and any associated accession codes and references, are available in the online version of the paper.
Note: Any Supplementary Information and Source Data files are available in the online version of the paper.
ACKNoWLEDGMENTSThis work was performed within the framework of the Biobank-Based Integrative Omics Studies (BIOS) consortium funded by BBMRI-NL, a research infrastructure financed by the Dutch government (NWO 184.021.007). Samples were contributed
MYBL2 transcripts
–1 −0.5 0 0.5 1
Pearson rGO biological process
Positive regulation of B cell proliferationPositive regulation of �lopodium assembly
GO biological processB cell receptor signaling pathwayResponse to �uid shear stress
GO biological processChromatin remodelingDNA recombinationRegulation of transcription involved in G1/S phase of mitotic cell cycle
GO biological processExit from mitosisRegulation of exit from mitosis
GO biological processLymphocyte proliferationER-associated protein catabolic processLeukocyte proliferationMononuclear cell proliferationRegulation of lymphocyte proliferation
GO biological processNot enough genes for enrichment analysis
a
d
b
c
Correlation matrix of proxy genes affecting the rs285205 (MYBL2) eQTL
MYBL2 locus (20q13.12) (Mb)
MY
BL2
exp
ress
ion
IGH
G2
IGH
G2,
EN
SG
0000
0253
364
IGH
G4
IGH
G3
IGH
G1
IGH
GP
IGK
V1−
39IG
KV
1D−
39IG
KV
1−13
IGK
V1D
−12
IGK
V1−
12IG
KV
1−6
IGK
V1−
17IG
KV
1−5
IGK
J2,E
NS
G00
0002
4004
0IG
KJ1
,EN
SG
0000
0231
486
IGK
C,E
NS
G00
0002
3148
6IG
HV
3−30
IGH
V3−
33IG
HV
4−61
IGH
V4−
59IG
HV
3−11
IGH
J6IG
HV
1−18
IGH
J3IG
KV
4−1
IGH
V3−
23IG
HJ4
IGH
J5IT
M2C
DE
RL3
MZ
B1
TXN
DC
5,B
LOC
1S5−
TXN
DC
5B
MP
6,TX
ND
C5,
BLO
C1S
5−TX
ND
C5
IGJ
EN
AM
,IGJ
IGH
A2
IGH
A1
IGLV
3−21
IGLJ
3IG
LC2
IGLC
3IG
LV2−
23IG
LJ1,
IGLL
5B
IKC
LPTM
1LB
MP
8BC
D38
AP
OB
EC
3BF
AM
46C
SLC
1A4
IRF
4B
UB
1TY
MS
KIF
C1
CC
NB
2TK
1B
IRC
5,E
NS
G00
0002
6831
0C
DC
20TP
X2
TOP
2AM
KI6
7R
RM
2N
US
AP
1C
DC
A5
SH
CB
P1
KIF
2CC
CN
A2
CC
NB
1K
IF11
WD
R76
PR
C1
DH
FR
CTL
A4
HM
GB
3C
EN
PU
MC
M6
MC
M2
MC
M4
SP
AG
5,E
NS
G00
0002
5847
2S
TMN
1F
EN
1P
LK1
ER
N2,
PLK
1R
AD
54L
CD
CA
8O
RC
1A
UR
KB
CE
NP
ME
SP
L1P
KM
YT1
CD
T1N
CA
PH
PTT
G1
RA
D51
EZ
H2
CH
EK
1TE
SK
1,C
D72
CD
22C
D22
,MIR
5196
CD
72C
D79
BF
AM
129C
P2R
X5
LCN
10,E
NS
G00
0002
0400
3B
AN
K1
MS
4A1
FC
RLA
CD
19
EBF1 expression
A/A
C/A
C/C
EBF1EBF1
rs285205 (C/A)
rs285205
MYBL2Myb-related protein B
Early B cellfactor 1
42.30 42.31 42.32 42.33 42.34
208
0
rs285205
EB
F1
ChI
P–s
eq b
indi
ngInteraction P = 1.8 x 10⁻¹⁴
••
•••
••
••
•••••
Figure 5 A MYBL2 eQTL is modulated by the B cell proliferation gene EBF1. (a) Heat map of the coexpression of 109 proxy genes that modulate the eQTL effect on MYBL2 expression. Gene functional enrichment analyses on the genes in these clusters show that all are related to proliferation or cell cycle checkpoints. Interestingly, only one cluster increases the magnitude of the MYBL2 eQTL effect, in contrast to the other clusters, which all repress this eQTL. This eQTL-activating cluster is strongly enriched for ‘positive regulation of B cell proliferation’ (P = 1 × 10⁻⁷), and the strongest proxy gene in this cluster is FCRLA, which is known to be highly expressed in proliferating B cells residing in the germinal center of the lymph nodes (centroblasts)40,41. (b) Regulation of MYBL2 by the different cell cycle clusters is likely modulated via EBF1 and rs285205. In our analysis, we had initially only considered genes that were expressed in each of our individuals (Online Methods) and therefore had not studied low-abundance transcription factor genes. When also including these genes, we observed that this cluster of genes is strongly coexpressed with EBF1, a gene encoding a transcription factor that binds at the site of the eQTL SNP, suggesting that EBF1 might drive the eQTL interaction effect for MYBL2. EBF1 is a known player in B cell differentiation and proliferation, and its expression is positively correlated with expression of both MYBL2 (r = 0.11, P = 6.99 × 10⁻⁷) and FCRLA (r = 0.8, P ≤ 2.2 × 10⁻¹⁶). (c) Interaction plot showing that EBF1 expression modifies the eQTL effect of rs285205. The nominal P value is given. (d) ENCODE ChIP–seq data in LCLs show strong binding of EBF1 at rs285205; n = 2,116 individuals were used in all eQTL analyses.

Nature GeNetics VOLUME 49 | NUMBER 1 | JANUARY 2017 145
l e t t e r s
10. Francesconi, M. & Lehner, B. The effects of genetic variation on gene expression dynamics during development. Nature 505, 208–211 (2014).
11. Powell, J.E. et al. Genetic control of gene expression in whole blood and lymphoblastoid cell lines is largely independent. Genome Res. 22, 456–466 (2012).
12. Deelen, P. et al. Calling genotypes from public RNA-sequencing data enables identification of genetic variants that affect gene-expression levels. Genome Med. 7, 30 (2015).
13. Westra, H.-J. et al. Cell specific eQTL analysis without sorting cells. PLoS Genet. 11, e1005223 (2015).
14. Fairfax, B.P. et al. Innate immune activity conditions the effect of regulatory variants upon monocyte gene expression. Science 343, 1246949 (2014).
15. Çalıskan, M., Baker, S.W., Gilad, Y. & Ober, C. Host genetic variation influences gene expression response to rhinovirus infection. PLoS Genet. 11, e1005111 (2015).
16. Lee, M.N. et al. Common genetic variants modulate pathogen-sensing responses in human dendritic cells. Science 343, 1246980 (2014).
17. Barreiro, L.B. et al. Deciphering the genetic architecture of variation in the immune response to Mycobacterium tuberculosis infection. Proc. Natl. Acad. Sci. USA 109, 1204–1209 (2012).
18. van Greevenbroek, M.M.J. et al. The cross-sectional association between insulin resistance and circulating complement C3 is partly explained by plasma alanine aminotransferase, independent of central obesity and general inflammation (the CODAM study). Eur. J. Clin. Invest. 41, 372–379 (2011).
19. Tigchelaar, E.F. et al. Cohort profile: LifeLines DEEP, a prospective, general population cohort study in the northern Netherlands: study design and baseline characteristics. BMJ Open 5, e006772 (2015).
20. Schoenmaker, M. et al. Evidence of genetic enrichment for exceptional survival using a family approach: the Leiden Longevity Study. Eur. J. Hum. Genet. 14, 79–84 (2006).
21. Hofman, A. et al. The Rotterdam Study: 2014 objectives and design update. Eur. J. Epidemiol. 28, 889–926 (2013).
22. Westra, H.-J. et al. Systematic identification of trans eQTLs as putative drivers of known disease associations. Nat. Genet. 45, 1238–1243 (2013).
23. Lappalainen, T. et al. Transcriptome and genome sequencing uncovers functional variation in humans. Nature 501, 506–511 (2013).
24. Wood, A.R. et al. Allelic heterogeneity and more detailed analyses of known loci explain additional phenotypic variation and reveal complex patterns of association. Hum. Mol. Genet. 20, 4082–4092 (2011).
25. Ritchie, G.R.S., Dunham, I., Zeggini, E. & Flicek, P. Functional annotation of noncoding sequence variants. Nat. Methods 11, 294–296 (2014).
26. Andersson, R. et al. An atlas of active enhancers across human cell types and tissues. Nature 507, 455–461 (2014).
27. Naranbhai, V. et al. Genomic modulators of gene expression in human neutrophils. Nat. Commun. 6, 7545 (2015).
28. Raj, T. et al. Polarization of the effects of autoimmune and neurodegenerative risk alleles in leukocytes. Science 344, 519–523 (2014).
29. Idaghdour, Y. et al. Geographical genomics of human leukocyte gene expression variation in southern Morocco. Nat. Genet. 42, 62–67 (2010).
30. Yao, C. et al. Sex- and age-interacting eQTLs in human complex diseases. Hum. Mol. Genet. 23, 1947–1956 (2014).
31. Adams, D. et al. BLUEPRINT to decode the epigenetic signature written in blood. Nat. Biotechnol. 30, 224–226 (2012).
32. Doré, L.C. & Crispino, J.D. Transcription factor networks in erythroid cell and megakaryocyte development. Blood 118, 231–239 (2011).
33. Hall, M.A. et al. The critical regulator of embryonic hematopoiesis, SCL, is vital in the adult for megakaryopoiesis, erythropoiesis, and lineage choice in CFU-S12. Proc. Natl. Acad. Sci. USA 100, 992–997 (2003).
34. Pevny, L. et al. Erythroid differentiation in chimaeric mice blocked by a targeted mutation in the gene for transcription factor GATA-1. Nature 349, 257–260 (1991).
35. Rusinova, I. et al. Interferome v2.0: an updated database of annotated interferon-regulated genes. Nucleic Acids Res. 41, D1040–D1046 (2013).
36. Heinrichs, S. et al. MYBL2 is a sub-haploinsufficient tumor suppressor gene in myeloid malignancy. eLife 2, e00825 (2013).
37. Platanias, L.C. Mechanisms of type-I- and type-II-interferon-mediated signalling. Nat. Rev. Immunol. 5, 375–386 (2005).
38. Ivashkiv, L.B. & Donlin, L.T. Regulation of type I interferon responses. Nat. Rev. Immunol. 14, 36–49 (2014).
39. McLeay, R.C. & Bailey, T.L. Motif Enrichment Analysis: a unified framework and an evaluation on ChIP data. BMC Bioinformatics 11, 165 (2010).
40. Facchetti, F., Cella, M., Festa, S., Fremont, D.H. & Colonna, M. An unusual Fc receptor–related protein expressed in human centroblasts. Proc. Natl. Acad. Sci. USA 99, 3776–3781 (2002).
41. Rosén, A. et al. Lymphoblastoid cell line with B1 cell characteristics established from a chronic lymphocytic leukemia clone by in vitro EBV infection. OncoImmunology 1, 18–27 (2012).
by LifeLines (http://lifelines.nl/lifelines-research/general), the Leiden Longevity Study (http://www.healthy-ageing.nl/ and http://www.leidenlangleven.nl/), the Rotterdam Studies (http://www.erasmus-epidemiology.nl/research/ergo.htm) and the CODAM study (http://www.carimmaastricht.nl/). We thank the participants of all aforementioned biobanks and acknowledge the contributions of the investigators to this study (Supplementary Note). This work was carried out on the Dutch national e-infrastructure with the support of SURF Cooperative and the Groningen Center for Information Technology (G.J.C. Strikwerda, W. Albers, R. Teeninga, H. Gankema and H. Wind) and Target storage (E. Valentyn and R. Williams). Target is supported by Samenwerkingsverband Noord Nederland, the European Fund for Regional Development, the Dutch Ministry of Economic Affairs, Pieken in de Delta, and the provinces of Groningen and Drenthe. This work is supported by a grant from the European Research Council (ERC Starting Grant agreement 637640 ImmRisk) to L.F. The Rotterdam Study is funded by Erasmus Medical Center and Erasmus University, Rotterdam, the Netherlands Organization for Health Research and Development (ZonMw), the Research Institute for Diseases in the Elderly (RIDE), the Ministry of Education, Culture and Science, the Ministry for Health, Welfare and Sports, the European Commission (DG XII) and the municipality of Rotterdam. The authors are grateful to the study participants, the staff from the Rotterdam Study, and the participating general practitioners and pharmacists. The generation and management of GWAS genotype data for the Rotterdam Study are supported by the Netherlands Organization for Scientific Research NWO Investments (175.010.2005.011, 911-03-012). This study is funded by the Research Institute for Diseases in the Elderly (014-93-015; RIDE2) and Netherlands Genomics Initiative (NGI)/Netherlands Organization for Scientific Research (NWO) project 050-060-810. We thank P. Arp, M. Jhamai, M. Verkerk, L. Herrera and M. Peters for their help in creating the GWAS database. Work on cell count estimation was funded by NWO 863.13.011. The LifeLines Deep cohort is made possible by grants from the Top Institute of Food and Nutrition (TiFN GH0001), an ERC advanced grant (FP/2007-2013/ERC grant 2012-322698) and a Spinoza prize (NWO SPI 92-266) to C.W.
AUTHoR CoNTRIBUTIoNSB.T.H., P.A.C.’t.H., J.B.J.v.M., A.I., R.J. and L.F. formed the management team of the BIOS consortium. D.I.B., R.P., J.v.D., J.J.H., M.M.J.V.G., C.D.A.S., C.J.H.v.d.K., C.G.S., C.W., L.F., A.Z., E.F.T., P.E.S., M.B., J.D., D.v.H., J.H.V., L.H.v.d.B., C.M.v.D., A.H., A.I. and A.G.U. managed and organized the biobanks. J.B.J.v.M., P.M.J., M. Verkerk and J.v.R. generated RNA–seq data. H.M., M.v.I., M.v.G., W.A., J.B., D.V.Z., R.J., P.v.’t.H., P.D., M. Verkerk, M. Vermaat, I.N., M.A.S., P.A.C.’t.H., B.T.H. and M.M. were responsible for data management and the computational infrastructure. D.V.Z., P.D., M. Vermaat, M.v.I., F.v.D., M.v.G., W.A., M.J.B., N.d.K., H.-J.W., S.M.K., Y.L., M.A.S., P.A.C.’t.H. and L.F. performed the data analysis. D.V.Z., P.D., P.A.C.’t.H. and L.F. drafted the manuscript.
CoMPETING FINANCIAL INTERESTSThe authors declare no competing financial interests.
Reprints and permissions information is available online at http://www.nature.com/reprints/index.html.
1. Schaub, M.A., Boyle, A.P., Kundaje, A., Batzoglou, S. & Snyder, M. Linking disease associations with regulatory information in the human genome. Genome Res. 22, 1748–1759 (2012).
2. Hindorff, L.A. et al. Potential etiologic and functional implications of genome-wide association loci for human diseases and traits. Proc. Natl. Acad. Sci. USA 106, 9362–9367 (2009).
3. Musunuru, K. et al. From noncoding variant to phenotype via SORT1 at the 1p13 cholesterol locus. Nature 466, 714–719 (2010).
4. Cvejic, A. et al. SMIM1 underlies the Vel blood group and influences red blood cell traits. Nat. Genet. 45, 542–545 (2013).
5. Smemo, S. et al. Obesity-associated variants within FTO form long-range functional connections with IRX3. Nature 507, 371–375 (2014).
6. Claussnitzer, M. et al. FTO obesity variant circuitry and adipocyte browning in humans. N. Engl. J. Med. 373, 895–907 (2015).
7. Fu, J. et al. Unraveling the regulatory mechanisms underlying tissue-dependent genetic variation of gene expression. PLoS Genet. 8, e1002431 (2012).
8. Fairfax, B.P. et al. Genetics of gene expression in primary immune cells identifies cell type–specific master regulators and roles of HLA alleles. Nat. Genet. 44, 502–510 (2012).
9. Andiappan, A.K. et al. Genome-wide analysis of the genetic regulation of gene expression in human neutrophils. Nat. Commun. 6, 7971 (2015).

Nature GeNetics doi:10.1038/ng.3737
ONLINE METHODSCohort descriptions. The four cohorts used in our BIOS study are briefly described below. The age range of the individuals differed for the different biobanks (Supplementary Fig. 7). The number of samples per cohort used in our study can be found in Supplementary Table 1.
CODAM. The Cohort on Diabetes and Atherosclerosis Maastricht (CODAM)18 consists of a selection of 547 subjects from a larger population-based cohort42. Inclusion of subjects into CODAM was based on a moderately increased risk of developing cardiometabolic diseases such as type 2 diabetes and/or cardiovascular disease. Subjects were included if they were of European descent, over 40 years of age and additionally met at least one of the following criteria: increased body mass index (BMI; >25), a positive family history of type 2 diabetes, a history of gestational diabetes and/or glycosuria, or use of antihypertensive medication.
LLD. The LifeLines-DEEP (LLD) cohort19 is a subcohort of the LifeLines cohort43 with additional molecular data on 1,500 participants. LifeLines is a multidisciplinary prospective population-based cohort study examining the health and health-related behaviors of 167,729 individuals living in the northern parts of the Netherlands using a unique three-generation design. It employs a broad range of investigative procedures assessing the biomedical, sociodemographic, behavioral, physical and psychological factors contribut-ing to health and disease in the general population, with a special focus on multi-morbidity and complex genetics.
LLS. The aim of the Leiden Longevity Study (LLS)20 is to identify genetic factors influencing longevity and examine their interaction with the environ-ment to develop interventions by which to increase health at older ages. To this end, long-lived siblings of European descent were recruited together with their offspring and their offspring’s partners, on the condition that at least two long-lived siblings were alive at the time of ascertainment. For men, the age criterion was 89 years or older; for women, the age criterion was 91 years or older. These criteria led to the ascertainment of 944 long-lived siblings from 421 families, together with 1,671 of their offspring and 744 partners.
RS. The Rotterdam Study21 is a single-center, prospective population-based cohort study conducted in Rotterdam, the Netherlands. Subjects were included in different phases from the start of the study in 1998, with a total of 14,926 men and women aged 45 years and over included as of late 2008. The main objective of the Rotterdam Study is to investigate the prevalence and incidence of and risk factors for chronic diseases to contribute to better prevention and treatment of such diseases in the elderly.
Ethical approval. The ethical approval for this study lies with the individual participating cohorts (CODAM, LLD, LLS and RS)18–21.
RNA data preparation and sequencing. Total RNA from whole blood was depleted of globin transcripts using the Ambion GLOBINclear kit and subse-quently processed for sequencing using the Illumina TruSeq version 2 library preparation kit. Paired-end sequencing of 2 × 50-bp reads was performed using the Illumina HiSeq 2000 platform, pooling ten samples per lane and aiming for >15 million read pairs per sample. Finally, the read sets were generated for each sample using CASAVA, retaining only reads passing the Illumina Chastity Filter for further processing.
Preprocessing. The quality of the raw reads was checked using FastQC (http://www.bioinformatics.babraham.ac.uk/projects/fastqc/). The adaptors identified by FastQC (v0.10.1) were clipped using cutadapt (v1.1), applying default settings (min overlap 3, min length 25). Sickle (v1.200) (https://github.com/najoshi/sickle) was used to trim low-quality ends from the reads (min length 25, min quality 20).
Alignment. Read alignment was performed using STAR 2.3.0e (ref. 44). To avoid reference mapping bias, all Genome of the Netherlands (GoNL) SNPs with minor allele frequency (MAF) >0.01 in the reference genome were masked as N’s (ref. 45). Read pairs with at most eight mismatches, mapping to at most five positions, were used.
Alignment statistics. Mapping statistics from the BAM files were acquired through SAMtools flagstat (v0.1.19-44428cd). The 5′ and 3′ coverage bias, duplication rate and insert sizes were assessed using Picard tools (v1.86).
Expression quantification. We estimated expression on the gene, exon, exon ratio and poly(A) ratio levels using Ensembl v.71 annotation (which corre-sponds to GENCODE v.16).
Overlapping exons (on either of the two strands) were merged into meta-exons, and expression was quantified for the whole meta-exon. Custom scripts were developed for this purpose that use coverage per base from coverageBed and intersectBed from the BEDtools suite (v2.17.0)46 and R (v2.15.1). This resulted in base counts per exon or meta-exon.
Gene expression, as base count per gene, was calculated as the sum of the expression values for all exons of each gene (excluding meta-exons). Overlapping gene parts were counted separately from unique gene parts throughout this manuscript.
Expression of exons relative to their gene (exon ratio) was calculated by dividing the exon base counts by the summed base counts for all exons of the same gene. Meta-exons overlapping with multiple genes were discarded.
Overlapping 3′ UTRs for the same gene, as annotated in Ensembl, were merged by gene. A collection of poly(A) sites was retrieved from PolyA_DB, and the annotated 3′ ends of transcripts were obtained from Ensembl. These poly(A) sites were used to split the merged 3′ UTRs into bins. To avoid small bins, which tend to give noisy ratios, we applied some filtering to the poly(A) sites. Poly(A) sites located no more than 10 bp from the start or from the end of the 3′ UTR were discarded. Additionally, sites that were no more than 10 bp apart were merged (if the number of sites was even, the first site downstream was used). For all genes with at least two bins (corresponding to at least two potential poly(A) sites), we calculated the ratio of base counts for every two neighboring bins (poly(A) ratio).
Genotype data. Data generation. Genotype data were generated for each cohort individually. Details on the methods used can be found in the indi-vidual papers (CODAM42, LLD19, LLS47 and RS21).
Imputation and quality control. The genotype data were harmonized to GoNL48 using Genotype Harmonizer49 and were subsequently imputed per cohort with IMPUTE2 (ref. 50) using the GoNL reference panel51 (v5). Quality control was also performed per cohort. We removed SNPs with an imputation info score below 0.5, a Hardy–Weinberg equilibrium P value smaller than 1 × 10⁻⁴, a call rate below 95% or a MAF smaller than 0.05. In total, 9,333,740 SNPs passed quality control in at least one data set.
Quality control. To identify low-quality samples, we applied several quality metrics and used a combination of them to decide whether to exclude a sample from further analyses.
Read counts. For each sample, the total number of mapped reads was used as a quality measure. Samples for which these counts were less than 70% were flagged and excluded from the analysis.
Exon and gene expression correlation. For each pair of samples, the Spearman cor-relation of their expression was calculated on the gene and exon levels. From these values, the median Spearman correlation for each sample was calculated (D statis-tic). Samples with D statistics lower than 0.85 were excluded from the analysis.
Genotype concordance. As an extra quality control step, we compared imputed genotypes to those derived from RNA–seq. Concordance is expected to be low in cases of poor-quality RNA–seq or imputed genotype data or in cases of sample mix-up.
RNA–seq genotypes were called using SAMtools mpileup52 (with the fol-lowing parameters: -A -B -Q 0 -s -d10000000; calling only GoNL SNPs with MAF >0.01) and SNVMix2 (ref. 53). Only genotypes with posterior probabili-ties higher than 0.8 were included. We determined the genotype concordance per sample as the genotype correlation of high-confidence SNPs (SNPs with a mean genotype correlation across all samples of no lower than 0.9). Outlier samples, for which the genotype concordance was less than 0.9, were flagged and excluded from the analysis.
Heterozygosity rate. A maximum heterozygosity rate of 0.52 was used to exclude contaminated RNA–seq samples. This rate was calculated using the same high-quality genotypes used for the genotype concordance calculations.
Mix-up mapping. Previously, we showed that sample mix-ups occur fre-quently in genomics data sets, introducing noise into subsequent analyses54. We checked the data for mix-ups using this published method and flagged possibly mixed samples.
QTL mapping. We used our previously described pipeline22 to perform eQTL mapping. We mapped QTLs using Spearman rank correlation on imputed

Nature GeNeticsdoi:10.1038/ng.3737
genotype dosages in each cohort and then ran a meta-analysis combining the results by weighted z-score method. To control the FDR at 0.05, we created a null distribution by permuting sample labels for the expression data, repeating this process ten times.
Expression data normalization. Expression data on the gene and exon levels were first normalized using trimmed mean of M (TMM) values55. Expression values were then log2 transformed, probe and sample means were centered to zero, and their standard deviation was scaled to one. To correct for batch effects, principal-component analysis (PCA) was run on the sample Spearman correlation matrix and the first 25 principal components were removed22. We observed that removing these principal components resulted in detection of the highest number of eQTLs. To verify that none of these 25 principal components were under genetic control, we ran separate QTL mapping on each principal component and ensured that there were no SNPs associated with them.
Exon ratio and poly(A) ratio expression data were not normalized, as ratios are not dependent on library size and we used non-parametric statistics.
Cis-QTL mapping. To run cis-QTL mapping, we tested genes (or exons, exon ratios or poly(A) ratios) and SNPs located within 250 kb of a gene (or exon) center. Only SNPs with MAF ≥0.05, call rate ≥0.95 and Hardy–Weinberg equilibrium P value ≥0.001 were included. We identified independent QTL effects by stepwise regression: we found secondary QTLs by regressing out the primary QTLs and identified tertiary QTLs by regress-ing out primary and secondary QTLs. This procedure was repeated until no more independent effects were found. We acknowledge that it might be possible that some of the identified independent effects might actually tag untyped variants.
Set of background SNPs for functional enrichment analyses. To assess the functional enrichment of expression SNPs (eSNPs) for each QTL, we created a list of background SNPs that we compared to the real set. For each eQTL SNP, we selected the variants within a 50,000-bp window with a MAF differing by no more than 0.05 from that of the eQTL SNP and LD r2 ≤0.5. From the variants that met these criteria, we selected the one that was physically closest to the eQTL SNP as the background SNP.
Replication of cis-eQTLs. The first replication data set comprised Geuvadis RNA–seq data from LCLs23. For replication, we obtained raw RNA–seq reads from 373 European samples and processed them using the same alignment and quality control pipeline as we used on the BIOS data. For eQTL mapping, we regressed out the first 20 principal components from the expression data (because of the smaller sample size of the Geuvadis data set). To replicate BIOS eQTLs in Geuvadis, we took all significant eQTLs (the top SNP for each gene) from BIOS and ran eQTL mapping in Geuvadis, testing only these eQTLs. We then checked how many eQTLs out of all those tested were replicated and for how many of the replicated eQTLs the allelic direction was opposite. We performed the same analysis in the other direction, testing how many of the Geuvadis eQTLs were replicated in the BIOS data.
The second data set for replication comprised a meta-analysis of 5,311 peripheral blood samples analyzed by microarray22. As raw data were not available for this data set, we used all significant eQTLs (FDR < 0.05) identified in the meta-analysis, mapped the microarray probes to genes and exons using Ensembl v71 gene annotation, and then tested these SNP–gene and SNP–exon combinations in the BIOS data.
GWAS annotation. To annotate eQTLs with known disease or trait associa-tions, we used a set of 6,321 SNPs derived from the NHGRI GWAS catalog and a set of reported Immunochip associations, each with reported P ≤ 5 × 10⁻⁸ (Supplementary Table 6).
Interaction analysis. For an overview of the method used for the interaction analysis, see Supplementary Figure 2. The interaction analysis was performed using the following linear model
Y I G P P G≈ + + + ×b b b1 2 3
where Y is the eQTL gene expression, G is the eQTL SNP genotype, P is the proxy gene, P × G is the interaction term between the proxy gene and the genotype, I is the intercept, and β1, β2 and β3 are regression coefficients.
As a linear model is parametric and thus more sensitive to outliers and non-normal distributions than our non-parametric eQTL model, we performed stricter quality control. We found that several metrics introduced outliers in our data that confounded the linear regression analyses. These metrics were the percentage of coding bases, the median 3′ bias, the percentage of uniquely mapped reads and the percentage of mRNA bases (Supplementary Fig. 8). On the basis of these metrics, we removed 75 samples and used the remaining 2,041 samples in the interaction analyses. We confined the interaction analysis to genes with at least one mapped read in all samples; this criterion was used for both the proxy genes and the eQTL genes. As a result, we tested 29,750 genes as potential proxies and 17,291 eQTL effects.
Normalization for the expression of eQTL genes is different from that for the expression of proxy genes. The gene expression data for eQTL genes were corrected using covariates for the source biobank, the first 25 principal components, sex, the median 3′ bias, the median 5′ bias, GC content and the percentage of intronic bases. To detect biologically meaningful interaction effects, we also regressed out the interaction effects for sex, the median 3′ bias, the median 5′ bias, GC content and the percentage of intronic bases. The expression data used in the interaction term were processed in a similar manner, with the exception that we did not correct for principal components, as this would have removed correlations with cell type, and we did not correct for interactions with technical covariates.
We excluded interactions where the eQTL SNP showed a significant eQTL effect on the tested proxy gene, as we wanted to exclude cases in which the gene giving the interaction effect was in the same locus as the tested eQTL gene.
We then performed an iterative interaction analysis by regressing the top covariate in a stepwise manner. After the first round of interaction analysis, we identified the covariate having the highest chi2sum
zee E
2
∈∑
where e is an eQTL from the set of all eQTLs (E) and ze2 is the squared inter-
action z score of the current covariate with the eQTL e, over all interaction z scores. We regressed out this covariate from the covariate and gene expression data and repeated the interaction analysis. This procedure was repeated ten times. For each top covariate, we identified a set of covariates (module) with a similar interaction pattern by taking the top 100 covariates having the highest chi2sum difference between the current interaction analysis step and the pre-vious step (effectively identifying coexpressed genes). These covariates were mostly highly coexpressed with the top covariate in the module (Fig. 2c).
To determine the significance level of interactions, we permuted genotype sample labels and ran the interaction analysis. This enabled us to determine which eQTLs significantly interacted with the top covariate of the module with FDR ≤ 0.05.
We ran interaction analysis at the exon and exon ratio levels in a similar manner as for the gene level. The implementation and manual for our method can be found at https://github.com/molgenis/systemsgenetics/wiki/Discovery-of-hidden-confounders-of-QTLs.
Interaction module functions. To find the prevalent cell type for each mod-ule, we used several sources of information. Some of the BIOS biobanks had cell counts available, making it possible to correlate the top 100 covariates of each module with cell type percentages.
As an additional source of evidence, we used expression profiles for iso-lated populations of 17 of the major cell types in blood generated by the BLUEPRINT consortium31.
To determine the putative function of each module, we performed pathway enrichment analysis using GeneNetwork56,57 on the top 100 covariates in the module and on all eQTL genes having a significant interaction with the top covariate of the module.
To gain more insight into the function of the modules we identified, we overlapped the interaction results with those from several previous studies of stimulated cells and response QTLs (reQTLs), including a study of peripheral blood mononuclear cells infected with rhinovirus15 and a study of monocytes

Nature GeNetics doi:10.1038/ng.3737
treated with LPS (collected at 2 and 24 h after treatment) and interferon14. To investigate whether each interaction module represented an antiviral or antibac-terial response, we checked for enrichment of the differentially expressed genes reported for each stimulation (with −1 < log(fold change) < 1) within the top 100 covariates for each interaction module by performing a one-tailed Fisher’s exact test to determine the significance. We also determined whether the reported reQTLs showed significantly stronger interaction with the top covariate of each module by performing a Wilcoxon rank-sum test on interaction z scores.
We checked whether there was enrichment of binding for particular tran-scription factors using ChIP–seq data from ENCODE58. First, we determined which transcription factors overlapped with the eQTL SNP or a variant in very strong LD (r2 ≥ 0.99). Then, using a Fisher’s exact test, we determined whether there was any enrichment in overlap between the genes assigned to a module and the genes not significantly assigned to this module.
Using interaction modules to better understand disease mechanisms. We extracted the genes regulated by any type of top QTL variant in strong LD (r2 ≥ 0.8) with top GWAS hits. Coexpression was assessed for these genes in our data, and Cytoscape 3.2.1 (ref. 59) was used to create network plots. Assignment to specific clusters was performed using the R implementation of Affinity Propagation60,61. Cell-type-specific expression levels were based on the RNA–seq data generated by the BLUEPRINT consortium31 and were plotted using gplots. We performed gene function enrichment analysis using GeneNetwork56.
Cell-type-specific eQTL mapping. Cell-type-specific eQTLs were identi-fied using the same method we used for the gene-based interaction analyses. However, here we used cell type percentages instead of the expression of other genes. As not all cohorts measured cell counts, we estimated counts for cohorts without this information. RNA–seq and cell count data for 628 samples from the LLD cohort and 650 samples from the LLS cohort were used to build prediction models for cell count using an in-house predictor for neutrophils, lymphocytes, monocytes, eosinophils and basophils. We evaluated this method using cross-validation (Supplementary Fig. 9). The models were applied to RNA–seq data for 185 samples from the CODAM cohort and 14 samples from the LLS cohort to predict cell counts for the five cell types. In addition, the pre-diction models were applied to estimate cell counts for neutrophils, eosinophils and basophils, using RNA–seq data from 652 samples from the RS cohort in which cell counts for lymphocytes and monocytes were available.
BLUEPRINT tissue-specific expression data analysis. BLUEPRINT data was downloaded from their ftp site (ftp://ftp.ebi.ac.uk/pub/databases/blueprint). All RNA–seq data from venous blood, myeloid cell and erythroblast samples were downloaded. Read counts were obtained according to the gene quan-tification performed by the Center for Genomic Regulation. Subsequently, TMM normalization55 was performed. Averaged normalized log-transformed counts per million per cell type were used to draw heat maps. For each module, we extracted corresponding genes on the basis of their Ensembl gene identi-fiers (for meta-exons, we used the first Ensembl identifier; three noncoding RNAs could not be extracted from the BLUEPRINT data). Furthermore, the R package pheatmap (1.0.7) was used to generate heat maps.
Data availability. Raw RNA–seq data can be obtained from the European Genome-phenome Archive (EGA; accession EGAD00001001623). Genotype data are available from the respective biobanks: LLS (http://www.leidenlangleven.nl/en/home; e-mail: [email protected]), LifeLines (https://lifelines.nl/lifelines-research/access-to-lifelines; e-mail: [email protected]), CODAM (e-mail: [email protected]) and RS (http://www.erasmusmc.nl/epi/research/The-Rotterdam-Study/?lang=en; e-mail: [email protected]). eQTL results can be accessed via our web browser (http://genenetwork.nl/biosqtlbrowser/).
42. van Dam, R.M., Boer, J.M., Feskens, E.J.M. & Seidell, J.C. Parental history of diabetes modifies the association between abdominal adiposity and hyperglycemia. Diabetes Care 24, 1454–1459 (2001).
43. Scholtens, S. et al. Cohort profile: LifeLines, a three-generation cohort study and biobank. Int. J. Epidemiol. 44, 1172–1180 (2015).
44. Dobin, A. et al. STAR: ultrafast universal RNA–seq aligner. Bioinformatics 29, 15–21 (2013).
45. Liu, Z. et al. Comparing computational methods for identification of allele-specific expression based on next generation sequencing data. Genet. Epidemiol. 38, 591–598 (2014).
46. Quinlan, A.R. & Hall, I.M. BEDTools: a flexible suite of utilities for comparing genomic features. Bioinformatics 26, 841–842 (2010).
47. Deelen, J. et al. Genome-wide association meta-analysis of human longevity identifies a novel locus conferring survival beyond 90 years of age. Hum. Mol. Genet. 23, 4420–4432 (2014).
48. Genome of the Netherlands Consortium. Whole-genome sequence variation, population structure and demographic history of the Dutch population. Nat. Genet. 46, 818–825 (2014).
49. Deelen, P. et al. Genotype harmonizer: automatic strand alignment and format conversion for genotype data integration. BMC Res. Notes 7, 901 (2014).
50. Howie, B.N., Donnelly, P. & Marchini, J. A flexible and accurate genotype imputation method for the next generation of genome-wide association studies. PLoS Genet. 5, e1000529 (2009).
51. Deelen, P. et al. Improved imputation quality of low-frequency and rare variants in European samples using the ‘Genome of The Netherlands’. Eur. J. Hum. Genet. 22, 1321–1326 (2014).
52. Li, H. et al. The Sequence Alignment/Map format and SAMtools. Bioinformatics 25, 2078–2079 (2009).
53. Goya, R. et al. SNVMix: predicting single nucleotide variants from next-generation sequencing of tumors. Bioinformatics 26, 730–736 (2010).
54. Westra, H.-J. et al. MixupMapper: correcting sample mix-ups in genome-wide datasets increases power to detect small genetic effects. Bioinformatics 27, 2104–2111 (2011).
55. Robinson, M.D. & Oshlack, A. A scaling normalization method for differential expression analysis of RNA–seq data. Genome Biol. 11, R25 (2010).
56. Fehrmann, R.S.N. et al. Gene expression analysis identifies global gene dosage sensitivity in cancer. Nat. Genet. 47, 115–125 (2015).
57. Pers, T.H. et al. Biological interpretation of genome-wide association studies using predicted gene functions. Nat. Commun. 6, 5890 (2015).
58. Landt, S.G. et al. ChIP–seq guidelines and practices of the ENCODE and modENCODE consortia. Genome Res. 22, 1813–1831 (2012).
59. Cline, M.S. et al. Integration of biological networks and gene expression data using Cytoscape. Nat. Protoc. 2, 2366–2382 (2007).
60. Frey, B.J. & Dueck, D. Clustering by passing messages between data points. Science 315, 972–976 (2007).
61. Bodenhofer, U., Kothmeier, A. & Hochreiter, S. APCluster: an R package for affinity propagation clustering. Bioinformatics 27, 2463–2464 (2011).