identification of cpps based on cqas & mechanistic process...
TRANSCRIPT

1
Identification of CPPs basedon CQAs & Mechanistic Process & Product Understanding: A Case Study
Ajit S. Narang, Ph.D.Bristol-Myers Squibb, Co.
2nd FDA/PQRI Conference on Advancing Product Quality
Bethesda, MD
October 5-7, 2015
Overview
� Identification of Drug Product CQAs and CPPs:→Prior knowledge→Risk assessment→Product & process knowledge
� Correlational studies, e.g., DoE� Mechanistic studies, e.g., degradation kinetic modeling
� Case study: Brivanib Alaninate tablet development, wet granulation→Stability risk assessment: impact of residual water
� Control strategy during processing→Bioavailability risk assessment
� Drug-excipient binding interaction� Drug self-association
→Process monitoring and control strategy� PATs: FBRM probe, DFF sensor, & NIR

Pharmaceutical Development
Bioavailability
ManufacturabilityStability

4
Composition of Brivanib Alaninate Tablets
Ingredient % w/w
Intra-granular
Brivanib alaninate 50
Hydroxypropyl cellulose 4
Croscarmellose sodium 3
Microcrystalline cellulose 23.50
Water for Granulation 46
Extra-granular
Crospovidone 3
Microcrystalline cellulose 14.75
Colloidal silicon dioxide 0.5
Magnesium stearate 1.25
Opadry reddish brown or yellow 3% (weight gain)
Tablet strength: 400 mg (800 mg core tablet weight)

Mix
Add BMS-582664-02,
Intra-granular MCC,
HPC and CCSHigh Shear Mixer
25 L Fuji high
shear granulator
Granulation High Shear Mixer
Wet Mill
Fluid bed drying
Milling
Add EG MCC,
xPVP, Cab-O-Sil
Bin
Blender
Add Mg
Stearate
and blend
Compress
into Tablets
Manufacturing Process Flowchart
5

6
QbD Methodology
RA• Perform product risk analysis to identify CQAs
PPs & MAs
• List relevant material attributes and process parameters that can potentially impact CQAs
Unit Ops
• Perform process risk analysis to identify attributes and parameters to be studied
DoE etc.• Conduct development studies
CQAs & CPPs
• Identify critical attributes and parameters
CS• Establish control strategy
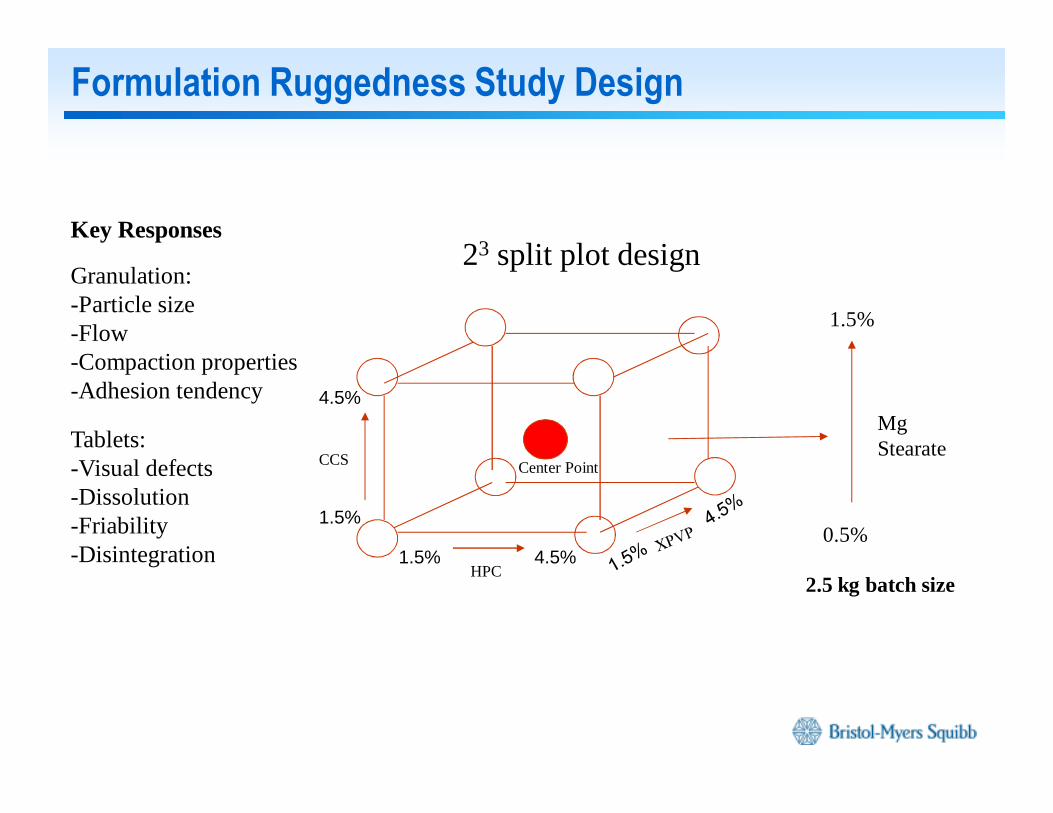
Formulation Ruggedness Study Design
23 split plot design
Center Point
1.5%
1.5%
4.5%
4.5%
HPC
CCS
Mg Stearate
1.5%
0.5%
2.5 kg batch size
Key Responses
Granulation: -Particle size -Flow-Compaction properties-Adhesion tendency
Tablets:-Visual defects -Dissolution-Friability -Disintegration

Design Space Studied During Process DoE
Impeller Tip Speed
44%
49%
Wat
er L
evel
10s 50s
3.6m/s 6m/s
Wet Massing Time
High Shear Granulation
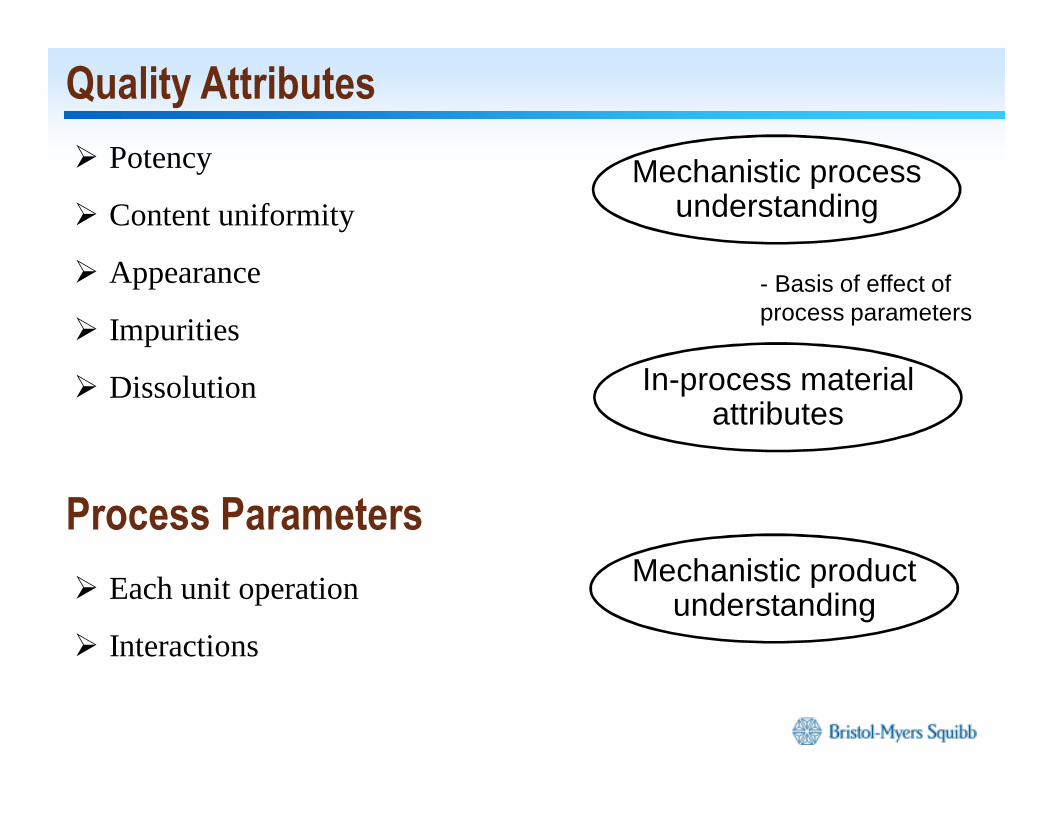
Quality Attributes
� Potency
� Content uniformity
� Appearance
� Impurities
� Dissolution
Process Parameters
� Each unit operation
� Interactions
In-process material attributes
Mechanistic process understanding
Mechanistic product understanding
- Basis of effect of process parameters

10
RA: Tablet Potency & Content Uniformity

11
RA: Tablet Appearance
12
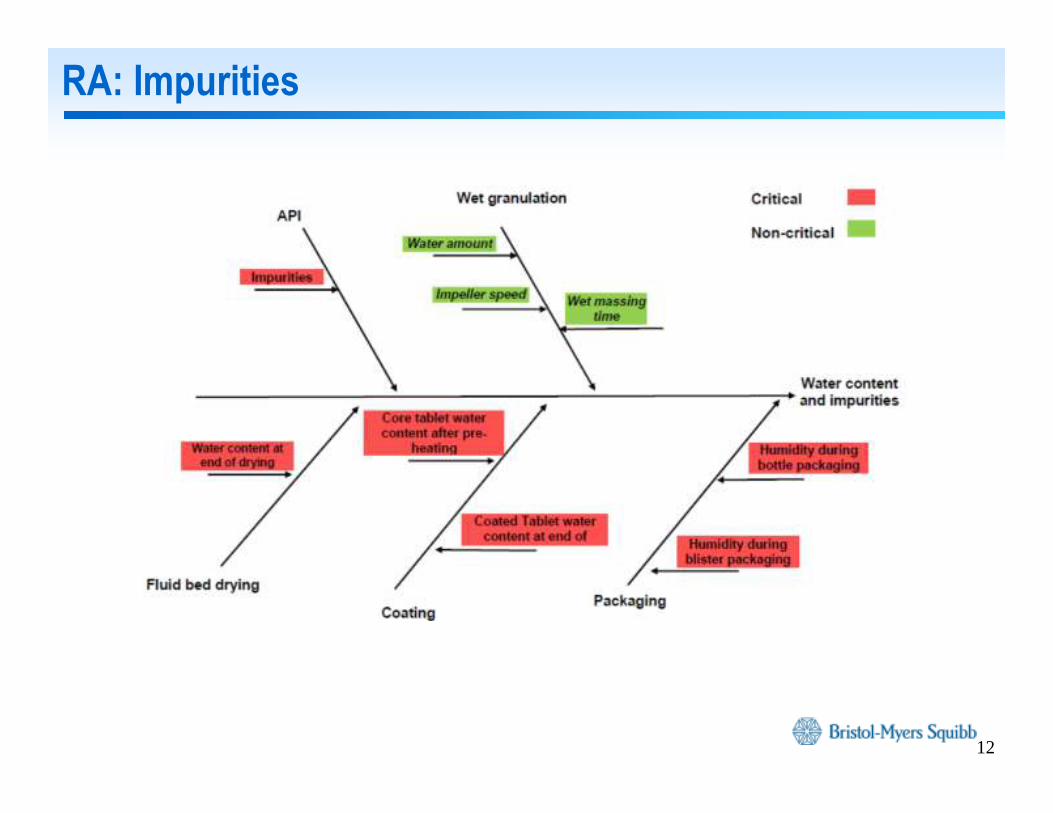
RA: Impurities

Water Content: Hydrolysis of Prodrug
• Moisture in core tablets posses long term stability risk� Brivanib Alaninate is moisture sensitive � Degradation rate increases when the moisture level is high� This poses a risk to stability over long periods of time
• Over short periods of time (~24h) Brivanib Alaninate is stable in the presence of water
• Control of tablet moisture before packaging is essential to slow degradation rate
00.020.040.060.080.1
0.120.140.160.180.2
0 0.2 0.4 0.6 0.8
Ra
te o
f hyd
roly
sis
% RH/100
13

Target Moisture Level
0
2
4
6
8
0 0.1 0.2 0.3 0.4 0.5 0.6 0.7 0.8
Moi
stur
e C
onte
nt
(%w
t. g
ain/
wt.
dry)
%RH/100
25°C
0
0.05
0.1
0.15
0.2
0 0.1 0.2 0.3 0.4 0.5 0.6 0.7 0.8
Rat
e of
form
atio
n of
P
aren
t (%
/day
)
% RH/100
Parent Formation RateAcceptable Degradation
Rate (Parent below limit for 2 years)
Final Moisture Target
Desorption Isotherm
14
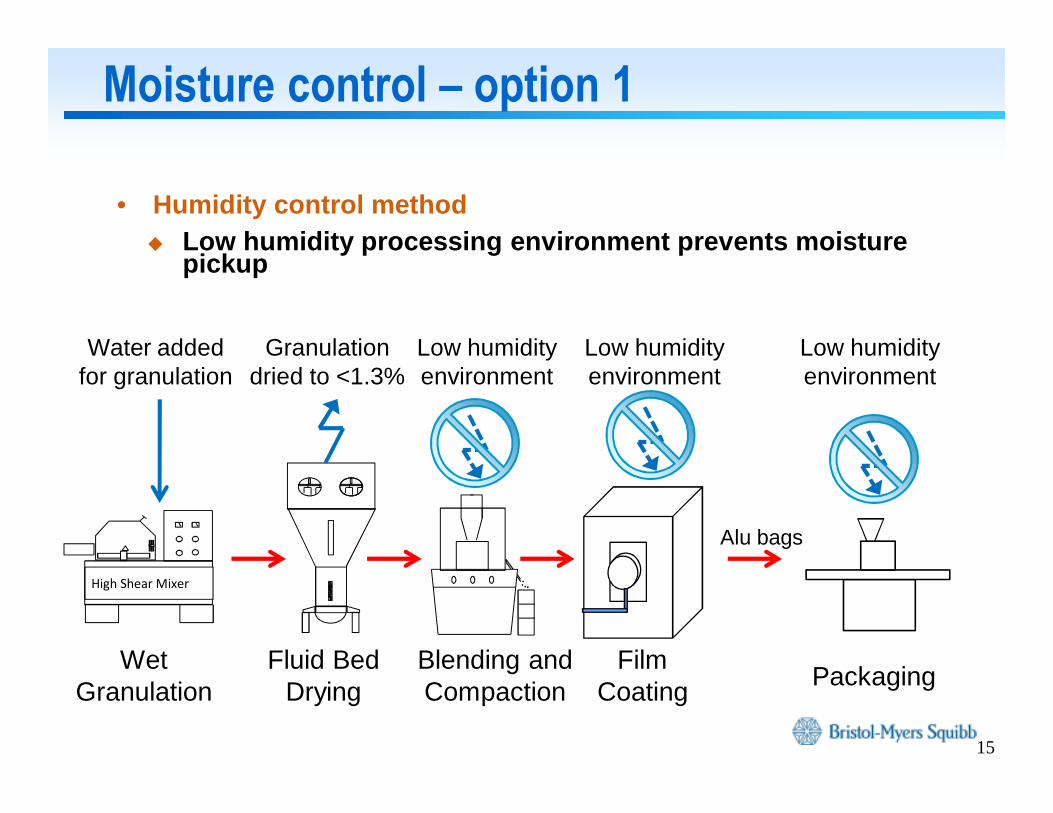
Moisture control – option 1
• Humidity control method� Low humidity processing environment prevents moisture
pickup
High Shear Mixer
Water added for granulation
Granulation dried to <1.3%
Low humidity environment
Wet Granulation
Fluid Bed Drying
Blending and Compaction
Film Coating
Packaging
Alu bags
Low humidity environment
Low humidity environment
15

Moisture control – option 2
• Coating control method� Uses coating step to remove moisture absorbed during previous
process steps� Does not require current facilities to be modified
High Shear Mixer
Water added for granulation
Granulation dried to <1.3%
Potential for moisture pickup
Moisture driven off
during coating
Low humidity environment
Wet Granulation
Fluid Bed Drying
Blending and Compaction
Film Coating
Packaging
Preheating: <1.6%Final: <1.8%
Alu bags
Limits:
16

17
RA: Dissolution
Effect of Material Attributes & Process Parameters
18
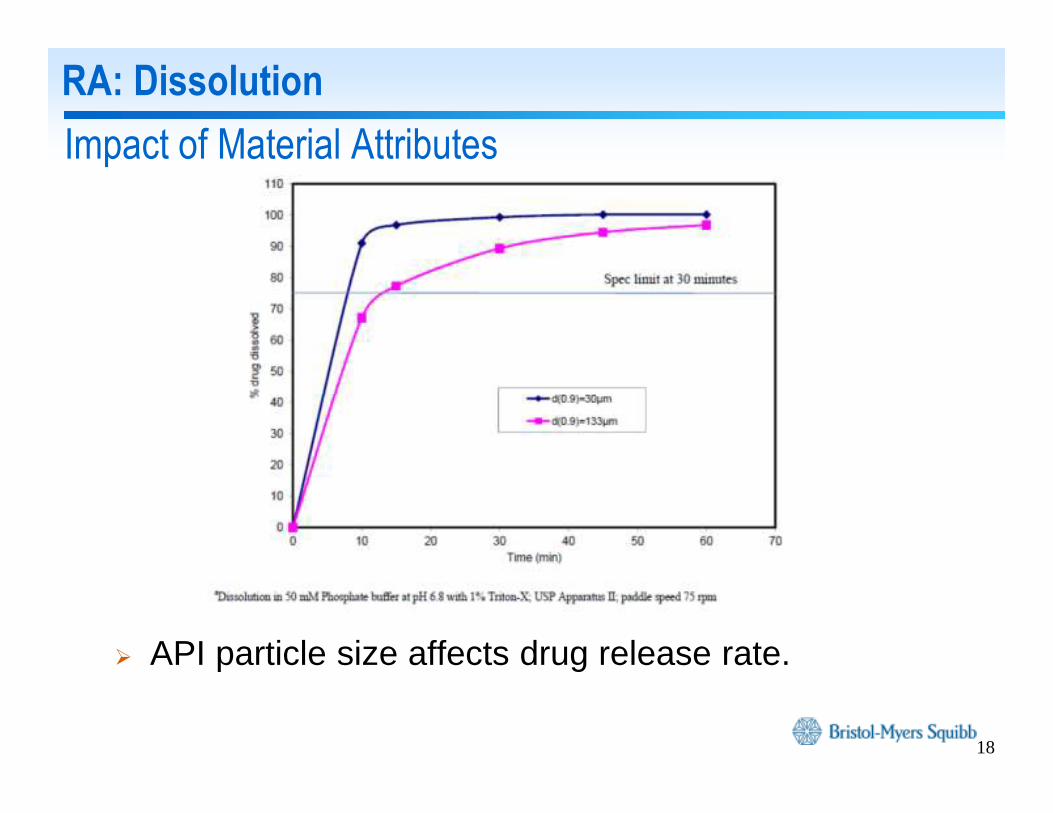
RA: Dissolution
Impact of Material Attributes
� API particle size affects drug release rate.

19
RA: Dissolution: Wet Granulation Process Parameters
� DoE study enabled the identification of process parameters that impact product dissolution.

20
RA: Dissolution
Impact of Process Parameters w/Material Attributes
� Dissolution of tablets manufactured with worst case combination of API particle size & wet granulation process parameters

21
RA: Dissolution: Material Attributes
Mechanistic Basis of Effect of Process Parameters
� Identification of in-process MAs that impact DP Qas enables focus of control strategy development.

22
PAT Tools to Support Control Strategy
NIR for Granule Water Content during Fluid Bed Drying
� Real-time measurement of granule water content during drying.

Probe Tip Enlargement
• Rotating focused-laser measures chord length• Proven technology for particles suspended in liquids• Measures particles in contact with probe sapphire tip• Probe placed directly in solution or powder flow
Lasentech FBRM C35 Probe “Chord Length”
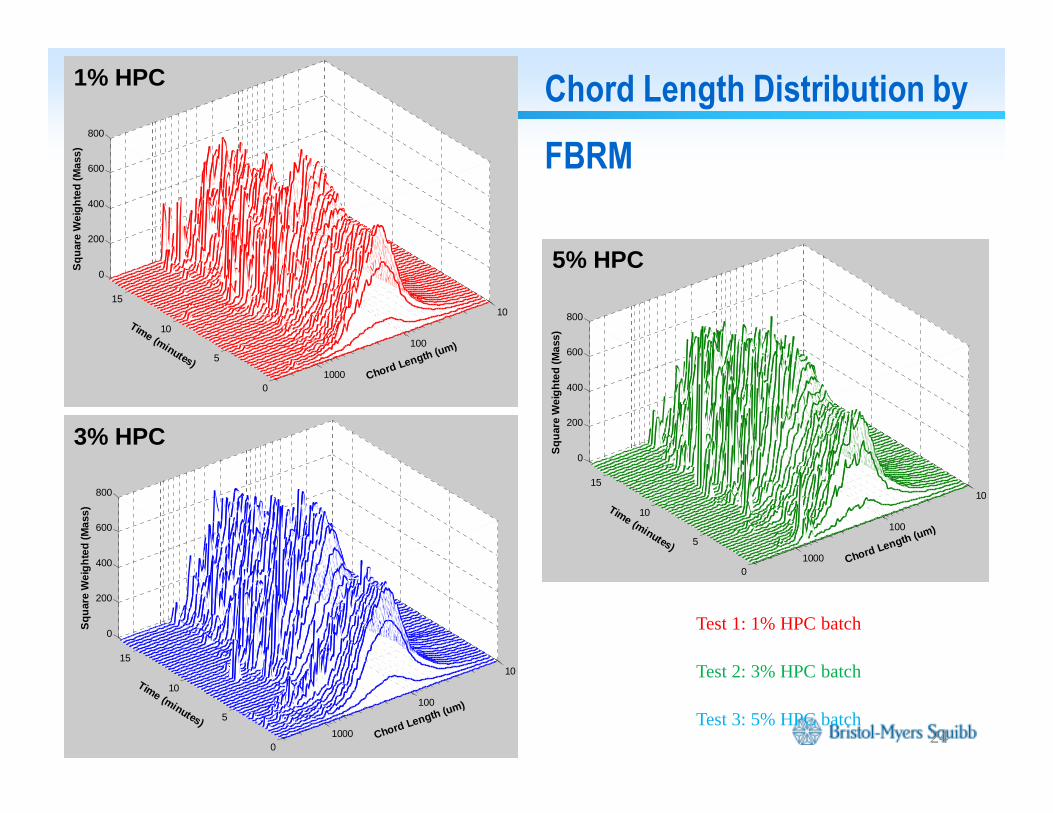
Chord Length Distribution by
FBRM
24
Test 1: 1% HPC batch
Test 3: 5% HPC batch
Test 2: 3% HPC batch
10
100
10000
5
10
15
0
200
400
600
800
Chord Length (um)
1% HPC-Dry A: Water - 40% HPC - 1% PH102
Time (minutes)
Sq
uar
e W
eig
hte
d (M
ass)
10
100
10000
5
10
15
0
200
400
600
800
Chord Length (um)
3% HPC-Dry B: Water - 40% HPC - 3% PH102
Time (minutes)S
qu
are
Wei
gh
ted
(Mas
s)
10
100
10000
5
10
15
0
200
400
600
800
Chord Length (um)
5% HPC-Dry C: Water - 40% HPC - 5% PH102
Time (minutes)
Sq
uar
e W
eig
hte
d (M
ass)
1% HPC
3% HPC
5% HPC

25
(i) (ii) (iii)
Drag Flow Force (DFF) Sensor
� Measures ‘wet mass consistency’ that correlated with granule densification/porosity
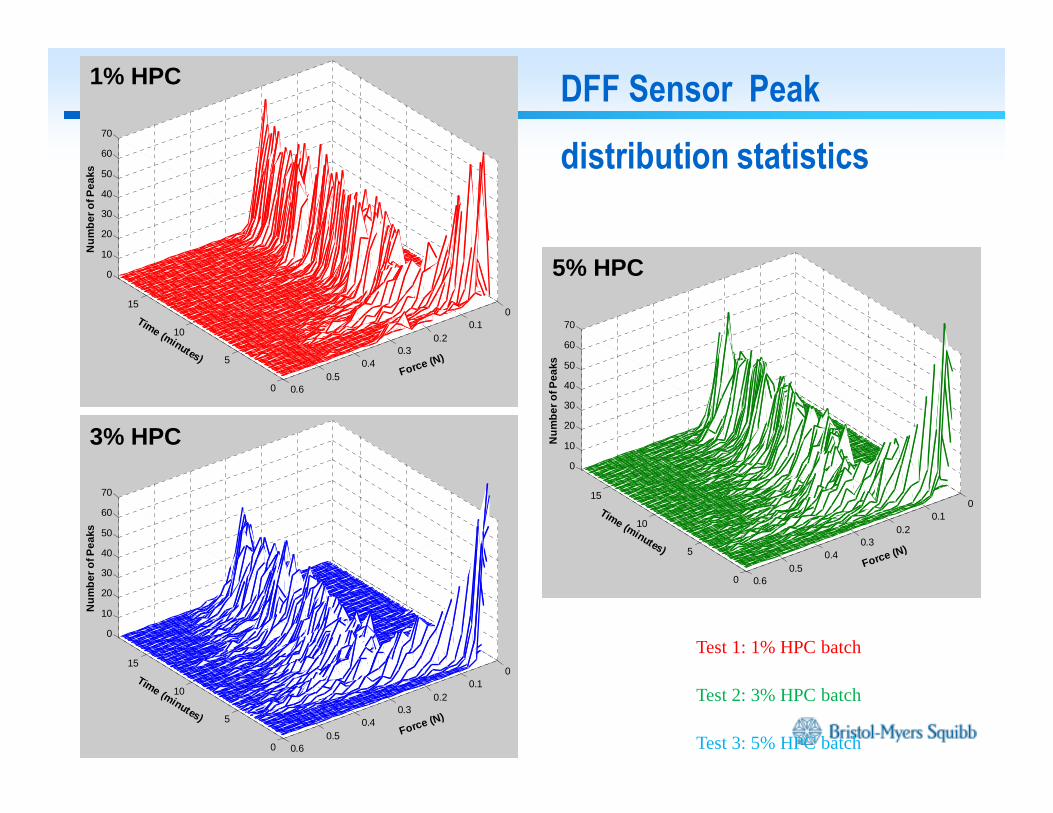
DFF Sensor Peak
distribution statistics
Test 1: 1% HPC batch
Test 3: 5% HPC batch
Test 2: 3% HPC batch
00.1
0.20.3
0.40.5
0.60
5
10
15
0
10
20
30
40
50
60
70
Force (N)
1% HPC-Dry A: Water - 40% HPC - 1% PH102
Time (minutes)
Nu
mb
er o
f Pea
ks
00.1
0.20.3
0.40.5
0.60
5
10
15
0
10
20
30
40
50
60
70
Force (N)
3% HPC-Dry B: Water - 40% HPC - 3% PH102
Time (minutes)N
um
ber
of P
eaks
00.1
0.20.3
0.40.5
0.60
5
10
15
0
10
20
30
40
50
60
70
Force (N)
5% HPC-Dry C: Water - 40% HPC - 5% PH102
Time (minutes)
Nu
mb
er o
f Pea
ks1% HPC
3% HPC
5% HPC

27
Control Strategy
Acknowledgements
� Sherif Badawy
� Kevin Macias
� Tim Stevens
� Sailesh Varia
� Dilbir Bindra
� Keirnan LaMarche
� Ganeshkumar Subramanian
� Judy Lin
� Pankaj Shah
� Valery Shevrev & Vadim Stepnaiuk, Lenterra, Inc.
Selected Publications and Acknowledgements• Panakanti R and Narang AS (2012) Impact of excipient interactions on drug bioavailability from solid dosage
forms. Pharm Res 29: 2639.
• Narang A, Yamniuk A, Zhang L, Comezoglu SN, Bindra DS, Varia S, Doyle M, and Badawy S (2012) Reversible and pH-dependent weak drug-excipient binding does not affect oral bioavailability of high dose drugs. J PharmPharmacol 64:553-65.
• Badawy SIF, Narang AS, LaMarche K, Subramanian G, and Varia SA (2012) Mecahnistic basis for the effects of process parameters on quality attributes in high shear wet granulation. Int J Pharm 439: 324-333.
• Narang AS, Badawy S, Ye Q, Patel D, Vincent M, Raghavan K, Huang Y, Yamniuk A, Vig B, Crison J, Derbin G, Xu Y, Ramirez A, Galella M, and Rinaldi F (2015) Role of self-association and supersaturation on oral absorption of a poorly soluble weakly basic drug. Pharm Res 32: 2579-2594.
• Badawy SIF, Narang AS, LaMarche KR, Subramanian G, Varia SA, Lin J, Stevens T, and Shah PA (2015) Integrated application of quality-by-design principles to drug product development: case study of brivanb alaniante film coated tablets. J Pharm Sci (under revision).
• Narang AS, Sheverev VA, Stepaniuk V, Badawy S, Stevens T, Macias K, Wolf A, Pandey P, Bindra D, and Varia S (2015) Real-time assessment of granule densification in high shear wet granulation and application to scale-up of a placebo and a Brivanib Alaninate formulation. J Pharm Sci 104: 1019-1034.
• Narang AS, Sheverev V, Freeman T, Both D, Stepaniuk V, Delancy M, Millington-Smith D, Macias K, and Subramanian G (2015) Process analytical technology for high shear wet granulation: wet mass consistency reported by in line drag flow force sensor is consistent with powder rheology measured by at line FT4 powder rheometer®. J Pharm Sci (under revision).