identification of eurycea using cytochrome b
TRANSCRIPT

Identification of Eurycea 1
Running head: IDENTIFICATION OF EURYCEA
Identification of Eurycea Using Cytochrome b
Karis Myers
A Senior Thesis submitted in partial fulfillment
of the requirements for graduation in the Honors Program
Liberty University Fall 2009
Identification of Eurycea 2
Acceptance of Senior Honors Thesis
This Senior Honors Thesis is accepted in partial
fulfillment of the requirements for graduation from the Honors Program of Liberty University.
______________________________ Mark Hemric, Ph.D.
Thesis Chair
______________________________ Paul Sattler, Ph.D.
Committee Member
______________________________ Nancy Richardson, Ph.D.
Committee Member
______________________________ James Nutter, D.A.
Honors Director
______________________________ Date
Identification of Eurycea 3
Abstract
Genomic sequencing is a powerful tool that has many applications for research, one of
which is in the field of taxonomy and the identification of species. This thesis discusses
the mitochondrial gene cytochrome b and its utility in population genetics and
identification of larval amphibians. The development of the Polymerase Chain Reaction
and primers are an integral part of the modern DNA sequencing process. The
Polymerase Chain Reaction is used to amplify a target DNA sequence, and the protocol
for this procedure must be optimized for the specific sequence of target DNA. Primers
must also be designed and modified for a selected portion of the DNA to be copied. This
thesis also discusses the application of these techniques in a current study of a population
of Eurycea. Three species of Eurycea, the Cave Salamander (E. lucifuga), Long-tailed
Salamander (E. longicauda longicauda), and Three-lined Salamander (E. guttolineata)
were discovered in an abandoned mine shaft near Riverville, Amherst County, Virginia in
1999. The population is unusual, as E. longicauda longicauda and E. lucifuga are outside
their normal distribution and this was the first syntopic occurrence in Virginia of E.
guttolineata and E. longicauda longicauda, the species usually indigenous to the
Piedmont physiographic region. In addition, there is possible hybridization between E.
guttolineata and E. longicauda. The larvae of these species are difficult to identify
morphologically; so the paper discusses the use of cytochrome b sequencing for species
identification among this population of Eurycea.

Identification of Eurycea 4
Identification of Eurcyea Using Cytochrome b
Introduction
Not only does DNA contain the instructions for life-enabling metabolic processes,
but this molecule also contains the information determining the characteristics unique to
each individual species. At a molecular level, sequence analysis allows for a better
understanding of the function and shape of the protein for which a gene encodes and at
the macroscopic level, information concerning the phylogeny, phylogeography, and
maternal ancestry can be derived. DNA sequencing is a powerful tool that has made
enormous advancements in the last twenty years. Currently more than 260,000
organisms have at least some section of their genome sequenced and available for
comparison in on-line gene Databases (Benson et al., 2008). This has made it possible for
researchers across the globe to conduct comparative studies fairly easily and has had
dynamic impacts in a number of fields, including population ecology and taxonomy.
Another application of this technology is the identification of species from tissue
samples, as discussed in this paper.
DNA sequencing has been particularly useful in the identification of larval
amphibians. Amphibians have complex life cycles that include a larval stage that is
radically different in morphology from the adult animal (Vences et al., 2005). The larvae
of many amphibians are difficult to identify because many species are conservative in
their anatomy and display close similarities in the larval stage (Parmelee, Knutson, &
Lyon, 2002). Larval morphology can also vary geographically and with developmental
stages and the immediate physical and biotic environment can influence the anatomy of
Identification of Eurycea 5
the larvae as well (Parmelee et al.). Genomic sequencing provides an alternative method
of identification and can be a valuable asset in the correct identification of larvae species.
Mitochondrial DNA
The variability in DNA sequences can be considered on the level of individual
genes or whole genotypes (Sunnucks, 2000). Mitochondrial DNA has many advantages
as a molecular marker because it evolves faster than nuclear DNA, mostly likely due to
inefficient replication repair (Kvist, 2000). While nuclear DNA is inherited from both
parents, mitochondrial DNA is only inherited maternally and has a lower Ne, or effective
population size, meaning that it is subject to greater genetic drift than nuclear markers, so
variants consequently have become a more rapid diagnostic of taxa (Sunnucks).
Different regions of the mitochondrial genome evolve at different rates which allows for
the selection of a region suitable for the question under investigation (Kvist).
Mitochondrial DNA is also ideal for identification of species because it can be used in
degraded tissue samples as MtDNA is present in the cell in a much higher copy number
(=1000) than nuclear DNA, and short fragments, ranging from 200-250 base pairs, can be
used (Teletchea et al., 2008). MtDNA is a sensitive indicator of population level
processes, and analysis of its divergence can reveal geographic clusters of related
individuals or matrilineal genealogies and can even be used to trace historical events such
as bottlenecks or hybrid zones (Kvist). MtDNA can also divulge phylogenetic
relationships between two closely related taxa (Kvist).
Animal mitochondrial DNA is composed of about thirty-seven genes and is a
small circular molecule consisting of 15-20 kilobase pairs (Kvist, 2000). Arranged very
efficiently, the mitochondrial genome lacks introns, has small intergenic spacers, and

Identification of Eurycea 6
even has occasionally overlapping reading frames (Kvist). Twenty-two of the thirty-
seven genes in the mitochondria code for transfer RNAs, there are two ribosomal RNAs,
and thirteen messenger RNAs coding for proteins involved in the electron transport chain
and oxidative phosphorylation in the mitochondria (Kvist, 2000). MtDNA is made up of
a light strand and a heavy strand, the heavy strand being differentiated by a higher
proportion of thymine and guanine residues giving it a larger mass (Lu et al, 2007). The
heavy strands codes for the two rRNAs and all the structural proteins except one. The
mtDNA also contains a non-coding region called the control region that carries the light
and heavy strand promoters, in addition to the displacement loop and replication elements
(Lu et al.).
Mitochondrial genes are inherited by a non-mendelian mechanism called
cytoplasmic inheritance (Alberts et al., 2008). Cytoplasmic inheritance is the passage of
traits, such as mitochondrial genes, to daughter cells through the division of the
cytoplasm in the parent cells (Alberts et al.). In lower organisms, such as yeast, both
haploid cells are equal in size and donate equal amounts of mitochondrial DNA to the
zygote, but in higher animals the egg cell is much larger than the sperm and contributes
much more cytoplasm to the zygote (Alberts et al.). MtDNA rarely recombines, though
some recombination events have been recorded (Kvist, 2000). This type of inheritance
results in each molecule of mitochondrial DNA being comprised of a single genealogical
history though the maternal lineages (Kvist, 2000), which means a cross between animals
results in the offspring only inheriting mitochondrial DNA from the female (Alberts et
al.).

Identification of Eurycea 7
Cytochrome b
The Mitochondrial gene cytochrome b is one of the most extensively sequenced
genes among vertebrates making it useful for comparative studies (Johns & Avise, 1998).
The evolution dynamics of this gene and the biochemistry of its protein product are also
better characterized that most of the other molecular systems (Johns & Avise).
Furthermore, the level of genetic divergence typically associated with sister species,
congeners, and confamilial genera are in a range at which the cytochrome b gene is
phylogenetically informative and unlikely to be compromised by saturation effects from
superimposed nucleotides substitutions (Johns & Advise) making this mitochondrial gene
one of the most suitable markers for vertebrate identification (Telechea et al., 2008). The
cytochromes are a family of colored proteins that are related by the presence of a bound
heme group and carry one electron at a time through the inner membrane of the
mitochondria (Aberts et al., 2008). Cytochrome b contains eight transmembrane helices
which are connected by extramembrane or intramembrane domains (Kvist, 2000).
Even though this gene evolves slowly in terms of non-synonymous substitutions
which cause different amino acids to be coded in the protein, cytochrome b gene is
excellent for phylogenetic work because the rate of evolutions in the silent positions
which do not change the amino acid sequence of the translated protein is relatively fast
(Kvist, 2000). The cytochrome b gene also contains large regions of interspecies
sequence diversity with little or no intraspecific variation, as well as several regions that
are conserved, allowing for short fragments along its entire length to be amplified using
trans-vertebrate primers (Telechea et al., 2008). This is extremely helpful when dealing
with tissue that has been degraded. Cytochrome b is thought to be conserved enough to

Identification of Eurycea 8
clarify deeper phylogenetic relationships while still being variable enough for population
level dynamics (Kvist). The range at which cytochrome b is phylogenetically
informative encompasses the levels of genetic divergence typically associated with
confamiliar genera, congeners, and sister species because the gene is not likely to be
severely compromised by saturation effects involving superimposed nucleotide
substitutions (Johns and Avise, 1998). Some parts of the gene are more conserved than
others as a result of functional limitations, resulting in evolutionary constraints but the
variable regions of the gene evolve at a high enough rates to cause detectable divergence
(Kvist). The coding regions of transmembrane domains and the amino- and carboxy-
terminal ends appear to be the most variable positions (Kvist).
Cytochrome b has gained the status of a universal metric because of its world-
wide use, allowing for easy comparison of studies conducted at differing times and
locations (Kvist, 2000). Differences in nucleotide sequences reflect varying amounts of
divergence depending on the phyla being analyzed. For example, when comparing the
mean genetic distances between species in the same genus for each of the five major
vertebrate classes, fish, reptiles, and amphibians show larger variances between species
than do birds (Johns & Avise, 1998). The values of mammals lie intermediate to the two
extremes (Johns & Avise). Amphibians and reptiles also have significantly larger genetic
distances between genera within a family than do birds and mammals at that same
taxonomic rank (Johns and Avise).
Statistical analysis of frequency distributions in cytochrome b of sister species, or
monophyletic pairs, among vertebrate classes reveals a tendency for larger genetic
distances between sister species of mammals than for those of birds or fish (Johns &
Identification of Eurycea 9
Avise, 1998). The genetic distances between taxa increase as the taxonomic rank
increases; there are larger distances for confamilial genera than for congeneric species,
and for congeneric species than for sister species (Johns & Avise). This is to be expected
if the cytochrome b genetic distances is not overly truncated by saturation effects at these
levels (Johns & Advise). These differences in genetic variation between classes must be
taken into account when interpreting cytochrome b data in order to arrive at accurate
conclusions.
The frequencies for the nucleotide bases adenine (A), guanine (G), cytosine (C),
and thymine (T) in cytochrome b are similar among mammals, birds, reptiles,
amphibians, and fish, although birds show a higher percentage of cytosine than the other
groups at all sites, and reptiles show higher frequencies of guanine in third-codon
positions (Johns & Avise, 1998). The genetic similarities expected in randomized
sequences of a given base composition are equal for the five vertebrate classes which
suggests that the effects of saturation dynamics are not largely different (John & Avise).
Strong biases in the bases composition of a class could theoretically lead to faster
saturation and thus give lower percentages of sequence divergence for a given period of
time, but the amount of base compositional differences observed in the vertebrate
families does not suggest that this is the case (Johns & Avise).
Polymerase Chain Reaction
The Polymerase Chain Reaction (PCR) has arguably been one of the most
important developments for advancing genomic sequencing. This revolutionary method
was developed by Kary Mullis in 1983 and is a highly sensitive method of amplifying
minute quantities of specific DNA (McPherson & Møller, 2000). Before the invention of

Identification of Eurycea 10
PCR, the amplification of specific DNA segments was accomplished by inserting the
target DNA into a vector to be expressed by bacteria, a process that required weeks. Now
PCR can make millions of copies of a sequence in a matter of hours. PCR is
accomplished in three steps: denaturation, annealing, and elongation.
In the denaturation step, the reaction mixture containing the DNA to be copied is
heated to 94 degrees Celsius. At this temperature the DNA double helix melts separating
the two strands. The annealing step follows denaturation and primers pair up with
corresponding segments of DNA at a temperature around 54ºC (McPherson & Møller,
2000). Primers are short segments of single-stranded nucleic acids that correspond to
segments of known sequence on the opposite strands of the template DNA and the 3’ end
of each primer points towards the other primer. They bind to the template DNA strand to
give the DNA polymerase the starting point it requires to initiate synthesis. The annealing
temperature can vary depending on the base content of the DNA. DNA that is G-C rich
is more difficult to pull apart because of the greater stability between the base pair due to
three hydrogen bonds between the two bases, as compared an A-T base pair which only
has two hydrogen bonds. Following the annealing step is the elongation step in which
DNA polymerase attaches at the primers and copies the DNA template in both directions
using the bases adenosine, guanine, cytosine, and thymine present in the PCR reaction
mixture. These three steps can be repeated 25-40 times depending on the specific
purpose for the amplified DNA. PCR uses Taq polymerase, which works optimally at
approximately 72ºC because it is from Therumus auquaticus, a bacterium native to hot
springs (McPherson & Møller).
Identification of Eurycea 11
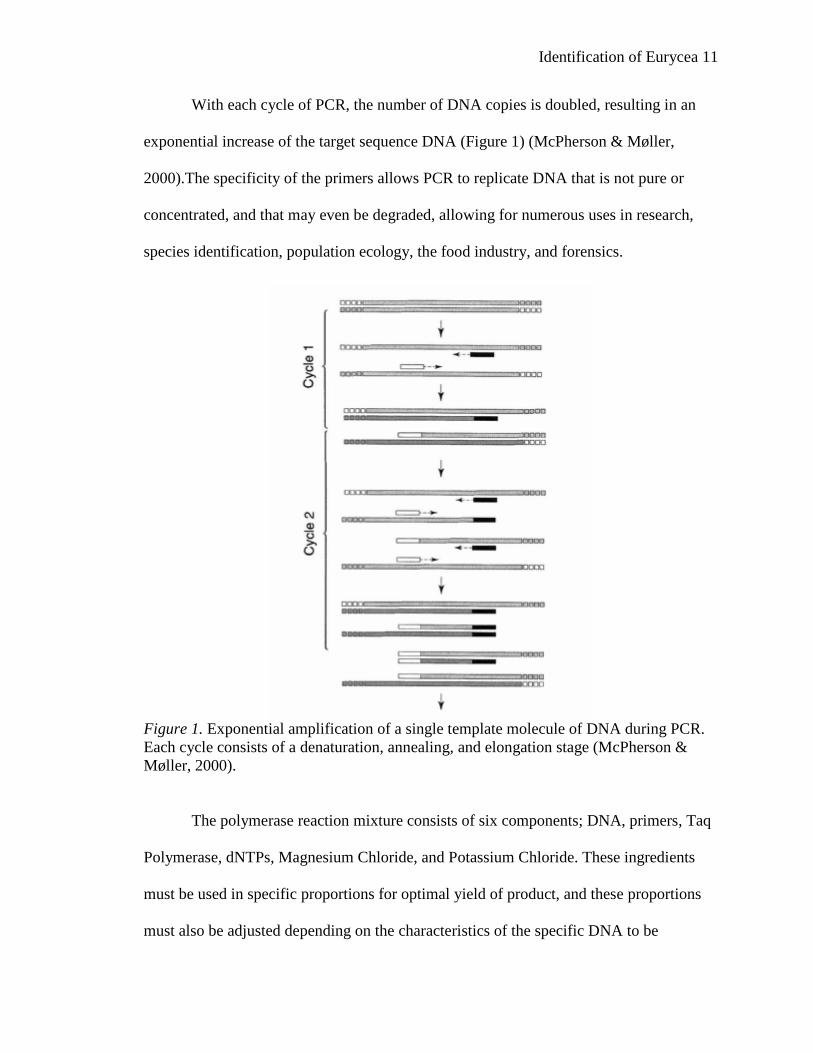
With each cycle of PCR, the number of DNA copies is doubled, resulting in an
exponential increase of the target sequence DNA (Figure 1) (McPherson & Møller,
2000).The specificity of the primers allows PCR to replicate DNA that is not pure or
concentrated, and that may even be degraded, allowing for numerous uses in research,
species identification, population ecology, the food industry, and forensics.
Figure 1. Exponential amplification of a single template molecule of DNA during PCR. Each cycle consists of a denaturation, annealing, and elongation stage (McPherson & Møller, 2000).
The polymerase reaction mixture consists of six components; DNA, primers, Taq
Polymerase, dNTPs, Magnesium Chloride, and Potassium Chloride. These ingredients
must be used in specific proportions for optimal yield of product, and these proportions
must also be adjusted depending on the characteristics of the specific DNA to be
Identification of Eurycea 12
sequenced. As a general rule, low concentrations of primer, target DNA, Taq and
nucleotides are recommended in order to produce a cleaner product and lower
background (Altshuler, 2006).
There are two types of DNA in a PCR reaction; the target sequence to be amplified
and the non-target DNA, which is also known as “burden” DNA. It is possible to have
too much total DNA in the reaction, which causes poor DNA synthesis because the Taq
polymerase is obstructed by the densely packed DNA. In addition, the concentration of
the target DNA should be balanced with the number of cycles in the reaction. An elevated
concentration of target DNA with a normal to high number of cycles may cause the rapid
accumulation of nonspecific products. When the total amount of the DNA in the PCR
reaction is extremely small, there is a higher likelihood of loss due to chemical or
enzymatic degradation, and a small amount of target DNA also has an increased risk
from contamination from impurities that may come into contact with the DNA solution.
The DNA diluents, dust in the air, exhalations or skin particles carry DNA and DNA-
degrading substances such as nucleases. Nucleases are a major source of DNA
degradation and are ubiquitous, as they are abundant on the human skin and can be found
everywhere else as well (Altshuler, 2006).
The concentration of dNTPs should range from 200 µM to 400M each, as excessive
dNTPs and suboptimal concentrations will cause premature termination of DNA
synthesis or incomplete primer elongation. Primers should be present in concentrations
between 0.1 µM and 1.0 µM. Higher concentrations of primers lead to the formation of
primer-dimers if the primers are capable of forming dimers, or if the primers do not form
dimers then non-specific primer binding may occur and spurious, non target PCR
Identification of Eurycea 13
products will be created. The only exception is when amplifying a short sequence of
DNA. When the target sequence is short, such as 100 base pairs in length, a larger
number of PCR product molecules are necessary to provide the target yield of amplified
DNA (Altshuler, 2006).
Optimal Taq concentration is 1 unit of Taq enzyme per 25 µl of reaction. Too little
Taq may result in incomplete primer elongation or premature termination of PCR product
synthesis, and excessive Taq can produce a high amount of unwanted background DNA
fragments that will cause a smear on gel, and an enormous excess will can the reaction to
fail completely (Altshuler, 2006).
Magnesium in the PCR mixture works as a cofactor to stabilize the double stranded
DNA and thus raises the melting temperature which is required for thermostable DNA
polymerases. The concentration of the magnesium ions controls the specificity of the
reaction because a suboptimal concentration results in a low yield of PCR product and
excess ions increase non-specific products and misincorporations which appear as smears
or ladders on gels. The concentration of MgCl2 should usually be between 1 mM and 4
mM in the reaction mixture, although changes in dNTP and KCl-based buffer
concentrations, or other mixture components may require a slight adjustment (Altshuler,
2006). The concentration of potassium chloride is usually 50 mM for the reaction
mixture, although a concentration of 70-100 mM is sometimes recommended for target
DNA in the range of 100-1000 bp. Generally, the amplification of longer sequences is
more efficient at a lower salt concentration, and the amplification of short products works
better at higher concentrations (Altshuler).
Primers
Identification of Eurycea 14
Primer sequence may be the most critical factor in successful amplification.
Primers should range between 18 and 30 nucleotides long, with the optimal length being
20-25 nucleotides (McPherson & Møller, 2000). In addition, the G-C content of the
primer should be 40-60% and the optimal melting temperature between 55ºC and 75 ºC.
Primers that are self-complementary and can form more than four consecutive bonds with
itself or eight bonds total are problematic primers because they can self-hybridize and
form dimers. Also, primers that are A-T rich at the 3’ end tend to be more specific in
action (McPherson & Møller). Usually a pair of primers is chosen that amplifies a target
sequence in opposite directions with the target sequence in between the two primer sites.
The direction the primers amplify is often designated either “H” for heavy strand or “L”
light strand. Heavy strand primers amplify in the opposite direction of light strand
primers (Jackman, Applebaum, & Wake, 1997).
Highly conserved primer sequences are beneficial because they can amplify
conserved sequence sites among diverse taxa, although primers for highly conserved
regions also have the potential for amplifying DNA from contaminants rather than the
target DNA (Goebel, Donnelly, & Atz, 1999). Primers do not work on some taxa because
of gene rearrangements and some DNA regions of interest do not have conserved
segments of a size appropriate for primers (Goebel et al.). The utility of primers for use
in a taxon, such as amphibians, can be estimated by comparing the sequence data from
other species within that taxa, as well as within more distant taxa (Goebel et al.). There
are many conserved primer sites among both amphibians and distant vertebrates such as
humans or mice (Goebel et al.). Utility can also be estimated by identifying all taxa in
which primers are presently successful (Goebel et al.). The primer with the greatest utility

Identification of Eurycea 15
will be one that is useful within many taxa which are contained in the smallest, but still
most inclusive phylogenetic rank within which primers have been useful to the present
(Goebel et al., 1999).
Maps of all published primers are useful for identifying new combinations of
primers originally mapped in alternate sources (Goebel et al., 1999). Cytochrome b is 5’
to the control region in all amphibians whose mitochondrial gene arrangement is known
(Goebel et al.) and is amplified by the primers Cyt-b2 and MVZ-16 in a wide variety of
vertebrates (Jackman et al., 1997). Primers MVZ-15, -18, and -25 were designed to match
sequences from Ensatina but also amplify DNA in other amphibians (Jackman et al.).
Other primers that amplify cytochrome b in amphibians include, but are not limited to
DB1-L, CB2-H, CB3-H, CB1Xen-L, CB2Xen-H, CB3Xen-H, CytbAR-H, CytbA-L,
ControlW-H, and Ctyb18R-L (Figure 2) (Goebel et al., 1999).
Figure 2. Published primers for the Cytochrome b gene (Goebel, Donnelly, &
Atz, 1999).
The primers used in this study of Eurycea, MVZ 15 (5’-
GAACTAATGGCCCACACW WTACGNAA-3’) and MVZ 16 (5’- AAATAGGAART
ATCAVTCTGGTTTRAT-3’) (Mayhew, 2008), were designed by Moritz, Schneider, and
Wake (1992) to evaluate the evolutionary relationships within the Salamanders in the
Ensatina eschscholtizii complex. These primers amplify up to 784 base pairs of

Identification of Eurycea 16
cytochrome b as a single fragment (Jockusch & Wake, 2002) and have been used with
success in numerous studies of many taxa within the family Plethodontidae such as
Bolitoglossa, Batrachoseps, Hydromanaates, and Ensatina (Jackman Applebaum, &
Wake, 1997). This made MVZ-15 and -16 an ideal choice for the amplification of
cytochrome b in Eurycea, which are also in the subfamily Plethodontidae.
Current Research Using Cytochrome b Sequencing
Cytochrome b sequencing is currently being used for species identification in
three species of Eurycea discovered in an abandoned mine shaft near Riverville, Amherst
County, Virginia in 1999. The three species of salamanders were Cave Salamanders (E.
lucifuga), Long-tailed Salamanders (E. longicauda longicauda), and Three-lined
Salamanders (E. guttolineata). The discovery of the Long-tailed Salamander and Cave
Salamander in this region extended the distribution of these species 60 km from the usual
Ridge and Valley and Blue Ridge Mountain physiographic region into the Piedmont
physiographic region (Reichenbach, LeMon, & Hinson, 2006). In addition, this was that
first syntopic occurrence in Virginia of Long-tailed and Three-lined Salamanders, a
species usually indigenous to the Piedmont physiographic region (Reichenbach et al.).
Identification of Eurycea 17
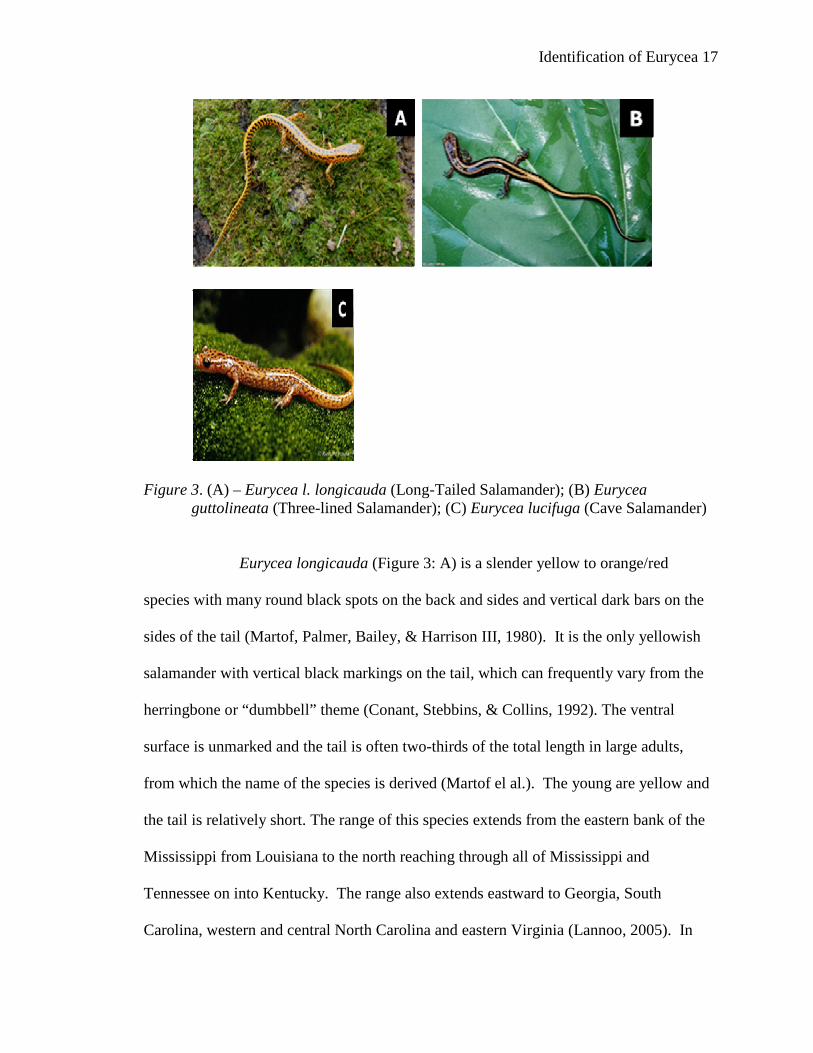
Figure 3. (A) – Eurycea l. longicauda (Long-Tailed Salamander); (B) Eurycea guttolineata (Three-lined Salamander); (C) Eurycea lucifuga (Cave Salamander)
Eurycea longicauda (Figure 3: A) is a slender yellow to orange/red
species with many round black spots on the back and sides and vertical dark bars on the
sides of the tail (Martof, Palmer, Bailey, & Harrison III, 1980). It is the only yellowish
salamander with vertical black markings on the tail, which can frequently vary from the
herringbone or “dumbbell” theme (Conant, Stebbins, & Collins, 1992). The ventral
surface is unmarked and the tail is often two-thirds of the total length in large adults,
from which the name of the species is derived (Martof el al.). The young are yellow and
the tail is relatively short. The range of this species extends from the eastern bank of the
Mississippi from Louisiana to the north reaching through all of Mississippi and
Tennessee on into Kentucky. The range also extends eastward to Georgia, South
Carolina, western and central North Carolina and eastern Virginia (Lannoo, 2005). In
Identification of Eurycea 18
Virginia, the Long-tailed salamander is found West of the Blue Ridge; and, in North
Carolina, this species is known in the Watauga, Nantahala and Little Tennessee river
basins (Martof et al.). Eurycea longicauda can be found along rocky streams and is
usually associated with limestone and shale substrates, in addition to commonly
inhabiting damp caves (Martof et al.). The Long-tailed salamander lays eggs in late fall.
Females will deposit an average of ninety eggs in an underground site attached to rocks
or logs suspended above or in the water. The eggs hatch during the winter and
metamorphosis takes place by early summer (Wilson, 1995).
Eurycea guttolineata, known as the Three-lined salamander, resembles the Long-
tailed salamander in size and shape (Figure 3:B) (Martof et al., 1980). In fact, three-lined
salamanders were considered a subspecies of the long-tailed salamanders until recently.
In 1998, Carlin elevated E. guttolineata to full specific status with morphological and
genetic data (Carlin, 1997). The three-lined species has a black median stripe with tan
stripes on the sides (Martof et al.). The sides of the salamander are dark with a light
streak between the limbs (Martof et al.), and the ventral surface is mottled with yellow to
greenish gray pigmentation (Conant, Stebbins, & Collins, 1992). This salamander
hybridizes with Long-tails in certain areas, including northern Gerogia, Alabama and
Mississippi (Martof et al.). The hybrid between the three-lined salamander and the long-
tailed salamander has an intermediate morphology of the two salamanders, with three
dorsal lines, characteristics of a three-lined salamander, and also a light ventral color and
herring-bone marks on the tail, characteristics of long-tail morphology. The range of the
Three-lined salamander extends from Virginia to extreme western Tennessee and south to
northern Florida (Wilson, 1995). Eurycea guttolineata, like the Long-tailed salamander,
Identification of Eurycea 19
also inhabits river and creek bottoms, seepage areas at springs, swamps and the
undersides of rocks in small creeks. Three-lined salamanders can also be found
substantial distances apart from standing water as long as it is in a damp environment, as
would be the case in many caves (Wilson). Breeding for this species occurs in the winter,
and eggs are deposited in early spring. The young undergo metamorphosis in four to five
months and attain sexual maturity the following summer (Wilson).
The Cave Salamander has coloration which ranges from dull yellow to orange and
bright orange-red (Figure 3:C) (Conant, Stebbins, & Collins, 1992). Black spots, which
are usually irregularly scattered, can also form 2 to 3 longitudinal rows (Conant et al.).
The tail of the cave salamander is long and lacks the vertical markings of the Long-tailed
(Martof et al., 1980). The ventral surface is unmarked and ranges from colorless to
yellow (Smith, 1978). It also has a much broader head with bulging eyes (Martof et al.).
This species range includes extreme western Virginia, to Georgia and Alabama, north to
southern Indiana and areas of Illinois, Missouri, Kansas and Oklahoma (Wilson, 1995).
Information is sparse concerning the breeding habits of the Cave salamander, although a
study in southern Illinois showed they deposited eggs from fall through early December
and the larval period is estimated to be six-eighteen months (Ringia & Lips, 2007). The
study recorded a peak in number of larvae in November with their numbers gradually
falling off as larvae leave the pools into streams until few were left in the pools in June
(Ringia & Lips). Females are known to deposit up to sixty eggs on the undersides of
rocks in pools or streams, and may lay multiple clutches (Wilson, 1995) (Ringia & Lips).
The larvae of these species, especially the three-lined and Long-tailed salamander
are very difficult to distinguish morphologically, and before a certain age are virtually
Identification of Eurycea 20
impossible to classify with certainty. The Cave Salamander larvae have dark
pigmentation on the throat and feet as a distinguishing feature, but the other two species
are highly difficult to distinguish with certainty before metamorphosis. This is where
genomic sequencing discussed previously may prove helpful. Currently cytochrome b
sequences for the Cave and the Long-tailed are in the online CoreNucleotide gene bank,
but none have been submitted for the three-lined salamander.
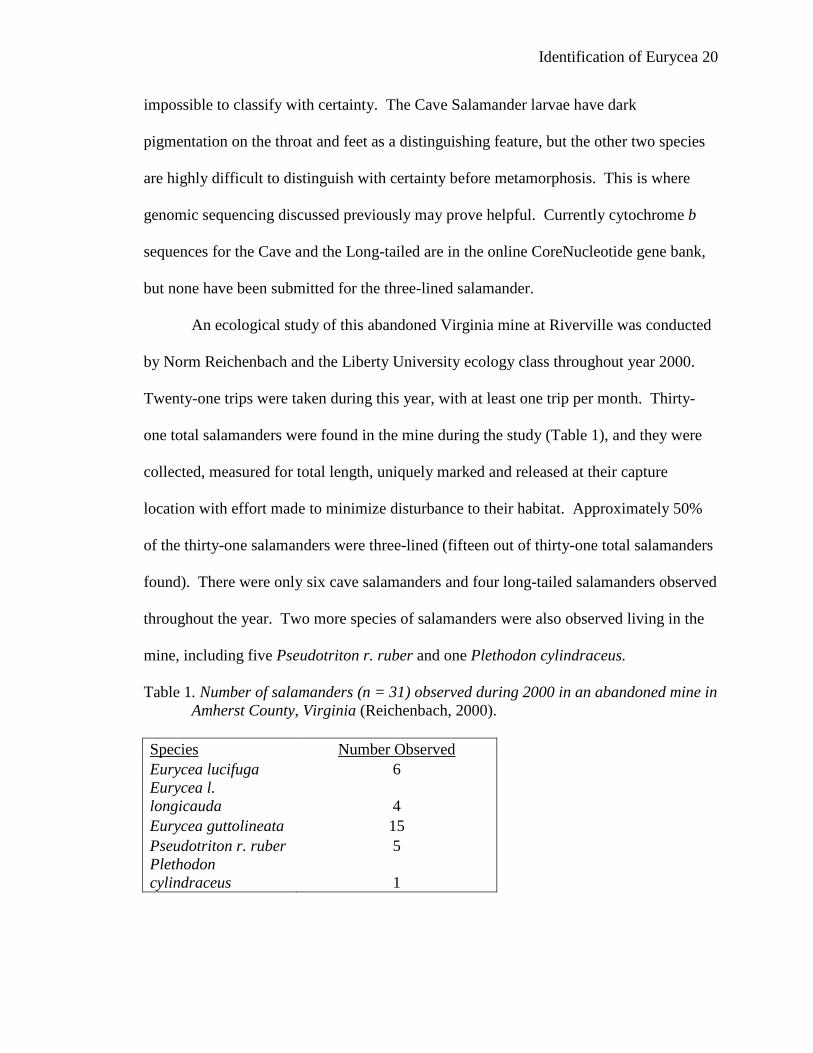
An ecological study of this abandoned Virginia mine at Riverville was conducted
by Norm Reichenbach and the Liberty University ecology class throughout year 2000.
Twenty-one trips were taken during this year, with at least one trip per month. Thirty-
one total salamanders were found in the mine during the study (Table 1), and they were
collected, measured for total length, uniquely marked and released at their capture
location with effort made to minimize disturbance to their habitat. Approximately 50%
of the thirty-one salamanders were three-lined (fifteen out of thirty-one total salamanders
found). There were only six cave salamanders and four long-tailed salamanders observed
throughout the year. Two more species of salamanders were also observed living in the
mine, including five Pseudotriton r. ruber and one Plethodon cylindraceus.
Table 1. Number of salamanders (n = 31) observed during 2000 in an abandoned mine in Amherst County, Virginia (Reichenbach, 2000).
Species Number Observed Eurycea lucifuga 6 Eurycea l. longicauda 4 Eurycea guttolineata 15 Pseudotriton r. ruber 5 Plethodon cylindraceus 1
Identification of Eurycea 21
Reichenbach’s study showed the populations of E. lucifuga and E. l. longicauda
appeared to be sparse without recruitment. Field studies showed that the number of
salamander larvae peaked during the month of March (Figure 4), after which the number
of larvae steadily declined until none were observed in the month of November.
Mortality of the larvae could be due to predation by crayfish or the large P .r. ruber
larvae observed in the cave. Starvation could also be a factor since common prey items
for larval Eurycea were never observed in the mine pools throughout the year. The total
lengths of the salamanders are all within the adult size range for these species and there
was a lack of recently metamorphosed individuals. The lack of recruitment was
hypothesized to be due to larval mortality as evidenced by the declines in the number of
Eurycea larvae seen over time. This study cast doubt as to how long the sparse
populations of the cave salamander and the long-tailed salamander could continue in the
mine without recruitment (Reichenbach, 2000).
Identification of Eurycea 22
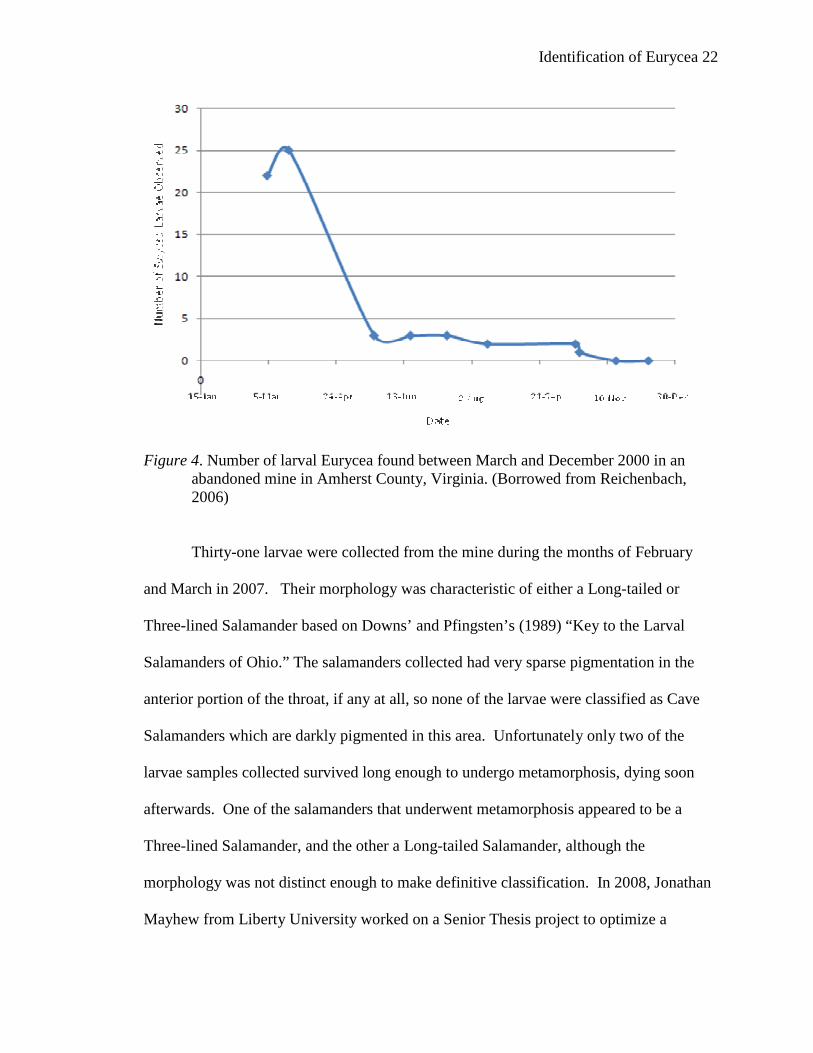
Figure 4. Number of larval Eurycea found between March and December 2000 in an abandoned mine in Amherst County, Virginia. (Borrowed from Reichenbach, 2006)
Thirty-one larvae were collected from the mine during the months of February
and March in 2007. Their morphology was characteristic of either a Long-tailed or
Three-lined Salamander based on Downs’ and Pfingsten’s (1989) “Key to the Larval
Salamanders of Ohio.” The salamanders collected had very sparse pigmentation in the
anterior portion of the throat, if any at all, so none of the larvae were classified as Cave
Salamanders which are darkly pigmented in this area. Unfortunately only two of the
larvae samples collected survived long enough to undergo metamorphosis, dying soon
afterwards. One of the salamanders that underwent metamorphosis appeared to be a
Three-lined Salamander, and the other a Long-tailed Salamander, although the
morphology was not distinct enough to make definitive classification. In 2008, Jonathan
Mayhew from Liberty University worked on a Senior Thesis project to optimize a
Identification of Eurycea 23
technique using MtDNA that would enable species identification of larval salamanders
collected from the mine. His protocol used Polymerase Chain Reaction to amplify a
target region of the cytochrome b gene from larval salamanders collected from the mine
to compare with gene sequences of reference animals for identification. The cytochrome
b gene was sequenced from ten of the unknown larvae, along with the two salamanders
that survived to metamorphosis and two Three-lined Salamanders from Pittsylvania
County used as positive controls.
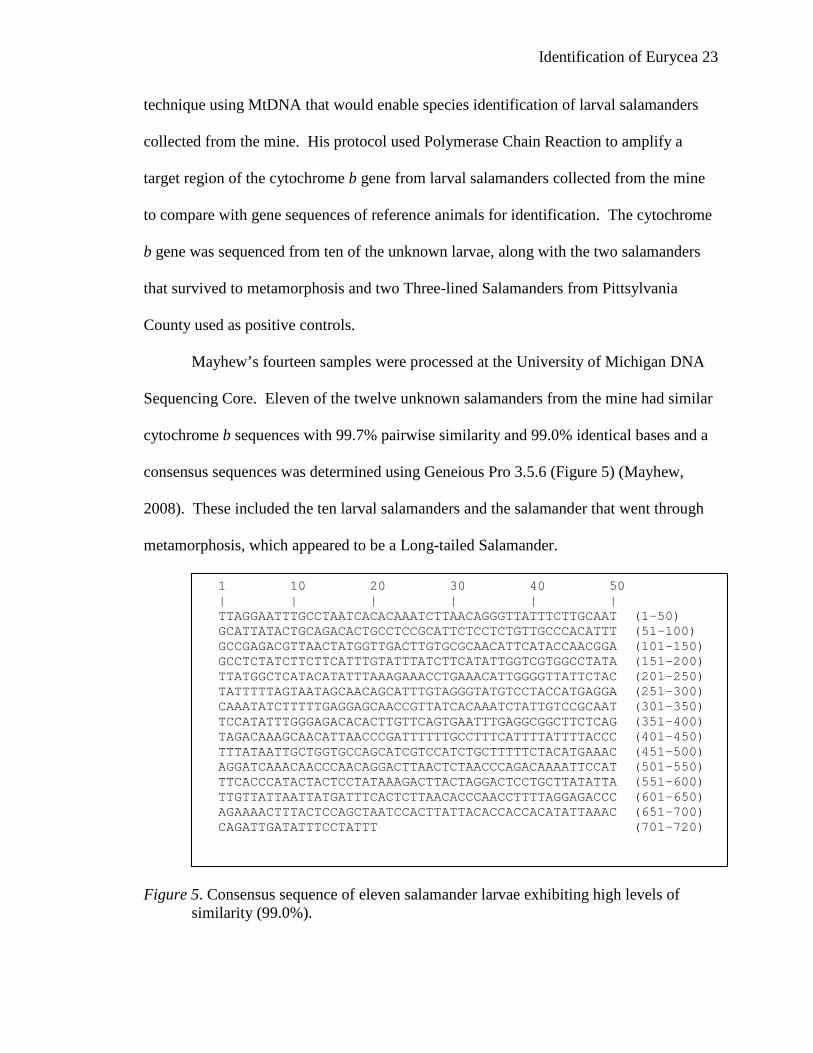
Mayhew’s fourteen samples were processed at the University of Michigan DNA
Sequencing Core. Eleven of the twelve unknown salamanders from the mine had similar
cytochrome b sequences with 99.7% pairwise similarity and 99.0% identical bases and a
consensus sequences was determined using Geneious Pro 3.5.6 (Figure 5) (Mayhew,
2008). These included the ten larval salamanders and the salamander that went through
metamorphosis, which appeared to be a Long-tailed Salamander.
Figure 5. Consensus sequence of eleven salamander larvae exhibiting high levels of
similarity (99.0%).
1 10 20 30 40 50 | | | | | | TTAGGAATTTGCCTAATCACACAAATCTTAACAGGGTTATTTCTTGCAAT (1-50) GCATTATACTGCAGACACTGCCTCCGCATTCTCCTCTGTTGCCCACATTT (51-100) GCCGAGACGTTAACTATGGTTGACTTGTGCGCAACATTCATACCAACGGA (101-150) GCCTCTATCTTCTTCATTTGTATTTATCTTCATATTGGTCGTGGCCTATA (151-200) TTATGGCTCATACATATTTAAAGAAACCTGAAACATTGGGGTTATTCTAC (201-250) TATTTTTAGTAATAGCAACAGCATTTGTAGGGTATGTCCTACCATGAGGA (251-300) CAAATATCTTTTTGAGGAGCAACCGTTATCACAAATCTATTGTCCGCAAT (301-350) TCCATATTTGGGAGACACACTTGTTCAGTGAATTTGAGGCGGCTTCTCAG (351-400) TAGACAAAGCAACATTAACCCGATTTTTTGCCTTTCATTTTATTTTACCC (401-450) TTTATAATTGCTGGTGCCAGCATCGTCCATCTGCTTTTTCTACATGAAAC (451-500) AGGATCAAACAACCCAACAGGACTTAACTCTAACCCAGACAAAATTCCAT (501-550) TTCACCCATACTACTCCTATAAAGACTTACTAGGACTCCTGCTTATATTA (551-600) TTGTTATTAATTATGATTTCACTCTTAACACCCAACCTTTTAGGAGACCC (601-650) AGAAAACTTTACTCCAGCTAATCCACTTATTACACCACCACATATTAAAC (651-700) CAGATTGATATTTCCTATTT (701-720)

Identification of Eurycea 24
This consensus sequence was compared to sequences in the CoreNucleotide database for
E. lucifuga (Zigler & Harlan, 2006) and E. l. longicauda (Bonett & Chippindale, 2004)
because no cytochrome b sequence is currently available for E. guttolineata. A consensus
sequence of ten Cave Salamanders from Franklin County, Tennessee listed in
CoreNucleotide was determined using Geneious Pro 3.5.6 (Figure 6) and the cave
salamander sequences had 99.5% pairwise similarity and 97.9% identical bases
(Mayhew, 2008).
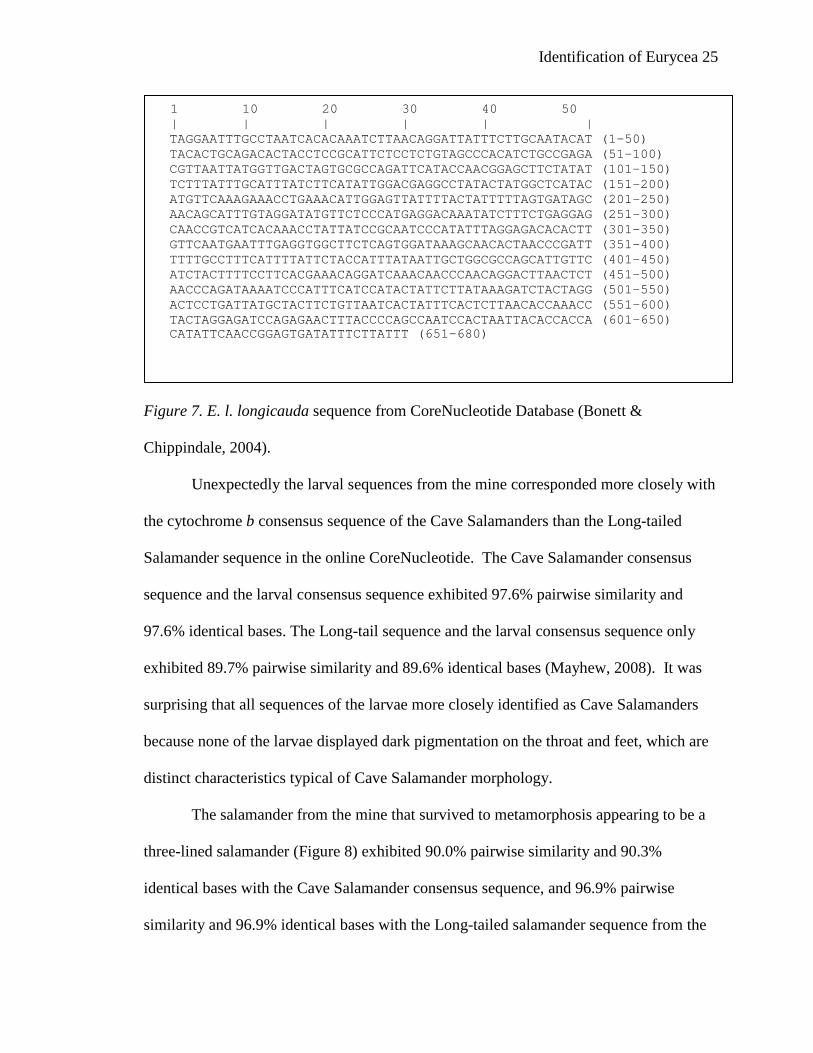
Figure 6. Consensus sequence of ten E. lucifuga from Franklin County, Tennessee. (Zigler & Harlan, 2006). The E. l. longicauda only had one sequence available in the database (Figure 7), because
the second sequence of 335 nucleotides was too short for comparison.
1 10 20 30 40 50 | | | | | | TTAGGAATTTGCCTAATTACACAAATCTTAACAGGGTTATTTCTTGCAAT (1-50) GCATTATACTGCAGACACTGCCTCCGCATTCTCCTCTGTAGCCCACATTT (51-100) GCCGAGACGTTAACTATGGTTGACTTGTGCGCAACATTCATACCAACGGA (101-150) GCCTCTATCTTCTTCATTTGTATTTATCTTCATATTGGTCGCGGCCTATA (151-200) TTATGGCTCATACATATTTAAAGAAACCTGAAACATCGGGGTTATTCTAC (201-250) TATTTTTAGTAATAGCAACAGCATTTGTAGGATATGTCCTACCATGAGGA (251-300) CAAATATCTTTTTGAGGAGCAACCGTTATCACAAATCTATTGTCCGCAAT (301-350) TCCATAYTTGGGAGACACACTTGTTCAATGAATTTGAGGCGGCTTTTCAG (351-400) TAGACAAGGCAACATTAACCCGATTTTTTGCCTTTCATTTTATTTTACCA (401-450) TTTATAATTGCTGGTGCCAGCATCGTCCATCTGCTTTTTCTACATGAAAC (451-500) AGGATCAAACAACCCAACAGGACTTAACTCTAACCCAGACAAAATTCCAT (501-550) TTCACCCATACTACTCATATAAAGACTTACTAGGACTCCTGCTTATATTA (551-600) TTATTACTAATTATGATTTCACTCTTAACACCCAACCTTTTAGGAGACCC (601-650) AGAAAACTTTACTCCAGCTAATCCACTTATTACACCACCACATATTCAAC (651-700) CAGAGTGATACTTCTTATTT (701-720)
Identification of Eurycea 25
Figure 7. E. l. longicauda sequence from CoreNucleotide Database (Bonett &
Chippindale, 2004).
Unexpectedly the larval sequences from the mine corresponded more closely with
the cytochrome b consensus sequence of the Cave Salamanders than the Long-tailed
Salamander sequence in the online CoreNucleotide. The Cave Salamander consensus
sequence and the larval consensus sequence exhibited 97.6% pairwise similarity and
97.6% identical bases. The Long-tail sequence and the larval consensus sequence only
exhibited 89.7% pairwise similarity and 89.6% identical bases (Mayhew, 2008). It was
surprising that all sequences of the larvae more closely identified as Cave Salamanders
because none of the larvae displayed dark pigmentation on the throat and feet, which are
distinct characteristics typical of Cave Salamander morphology.
The salamander from the mine that survived to metamorphosis appearing to be a
three-lined salamander (Figure 8) exhibited 90.0% pairwise similarity and 90.3%
identical bases with the Cave Salamander consensus sequence, and 96.9% pairwise
similarity and 96.9% identical bases with the Long-tailed salamander sequence from the
1 10 20 30 40 50 | | | | | | TAGGAATTTGCCTAATCACACAAATCTTAACAGGATTATTTCTTGCAATACAT (1-50) TACACTGCAGACACTACCTCCGCATTCTCCTCTGTAGCCCACATCTGCCGAGA (51-100) CGTTAATTATGGTTGACTAGTGCGCCAGATTCATACCAACGGAGCTTCTATAT (101-150) TCTTTATTTGCATTTATCTTCATATTGGACGAGGCCTATACTATGGCTCATAC (151-200) ATGTTCAAAGAAACCTGAAACATTGGAGTTATTTTACTATTTTTAGTGATAGC (201-250) AACAGCATTTGTAGGATATGTTCTCCCATGAGGACAAATATCTTTCTGAGGAG (251-300) CAACCGTCATCACAAACCTATTATCCGCAATCCCATATTTAGGAGACACACTT (301-350) GTTCAATGAATTTGAGGTGGCTTCTCAGTGGATAAAGCAACACTAACCCGATT (351-400) TTTTGCCTTTCATTTTATTCTACCATTTATAATTGCTGGCGCCAGCATTGTTC (401-450) ATCTACTTTTCCTTCACGAAACAGGATCAAACAACCCAACAGGACTTAACTCT (451-500) AACCCAGATAAAATCCCATTTCATCCATACTATTCTTATAAAGATCTACTAGG (501-550) ACTCCTGATTATGCTACTTCTGTTAATCACTATTTCACTCTTAACACCAAACC (551-600) TACTAGGAGATCCAGAGAACTTTACCCCAGCCAATCCACTAATTACACCACCA (601-650) CATATTCAACCGGAGTGATATTTCTTATTT (651-680)
Identification of Eurycea 26
online Data Base (Mayhew, 2008). This sequence only exhibited 88.9% pairwise
similiarity and 73.8 % identical bases with the consensus sequence from the larvae from
the mine. Currently, there are no cytochrome b sequences in online databases for E.
guttolineata for comparison, but this salamander has a high probability of being a Three-
lined salamander based on morphology and because the gene sequences are expected to
be similar for closely related species like E. guttolineata and E.l.longicauda. The
sequences from the two Three-lined positive controls from Pittsylvania County were
ambiguous because they showed no similarity to the cytochrome b gene of Eurycea
salamanders BLAST (nucleotide collection database). This could be due to amplification
of the wrong PCR product, or to the incorrect gene product insertion into the plasmid sent
into the University of Michigan DNA Sequencing Facility. The restriction digest with
EcoRI on a 1.0% agarose gel showed that these two samples (JM-3L+1 and JM-3L+2B)
had slightly different plasmid inserts than the rest of the samples, a possible indicator that
the wrong gene product was inserted (Figure 9).

Identification of Eurycea 27
Figure 8. The cytochrome b sequence of the salamander that survived to metamorphosis appearing to be a Three-lined Salamander (Mayhew, 2008)
Figure 9. Restriction digest with EcoRI on a 1.0% agarose gel. (Mayhew, 2008)
1 10 20 30 40 50 | | | | | | GAACTAATGGCCCACACTTTACGTAAGACTCACCCTATACTTAAGATTAT (1-50) TAATAACTCCTTTATTGATCTCCCCGCCCCATCAAGCTTATCCTACCTAT (51-100) GAAACTTTGGATCCCTCTTAGGAATTTGCCTAATCACACAAATCTTAACA (101-150) GGATTATTTCTTGCAATACATTACACTGCAGACACTACCTCCGCATTCTC (151-200) CTCTGTAGCCCATATCTGCCGAGACGTTAATTATGGTTGACTAGTGCGCA (201-250) GCATTCATACTAATGGAGCTTCTATATTCTTTATTTGCATTTATCTTCAT (250-300) ATTGGACGAGGCTTATACTATGGCTCATACATGTTCAAAGAAACCTGAAA (301-350) CATTGGAGTTATTCTACTATTTTTAGCGATAGCAACAGCATTTGTAGGAT (351-400) ATGTTCTCCCATGAGGACAAATATCTTTCTGAGGAGCAACCGTCATCACA (401-450) AACCTATTATCCGCAATCCCATATTTAGGAGACACACTTGTTCAATGAAT (451-500) TTGAGGTGGCTTCTCAGTGGATAAAGCAACACTGACCCGATTTTTTGCCT (501-550) TTCATTTTATTCTACCATTTATAATTGCTGGCGCCAGCATTGTTCATCTA (551-600) CTTTTCCTCCACGAAACAGGATCAAACAACCCAACAGGACTTAACTCTAA (601-650) CCCAGATAAAATCCCATTTCATCCATATTATTCTTATAAAGATCTACTAG (651-700) GACTCCTGATCATGCTACTTCTATTAATCACTATTTCACTCTTAACACCA (701-750) AACCTACTGGGAGATCCAGAGAACTTTACCCCAGCCAATCCACTAATTAC (751-800) ACCGCCACATAT (801-812)

Identification of Eurycea 28
Materials and Methods
Frozen larval tissue samples from the mine were collected May 14, 2008 and were
stored at -20ºC. 20-25 mg of tissue samples were purified using DNeasy® Blood and
Tissue Kit (50) according to protocol. The last elution step with 200 ul buffer AE was
performed twice for maximum yield as recommended in the protocol. The cytochrome b
gene was then amplified in the purified DNA using the polymerase chain reaction using
the primers MVZ 15 (5’- GAAC TAATGGCCCACACWWTACGNAA-3’) and MVZ16
(5’- AAATAGGAART ATCAV TCTGGTTTRAT-3’) designed to amplify a region
approximately 800 nucleotides long in the cytochrome b gene of the salamander Taricha
tarosa (Moritz, Schneider & Wake, 1992). The PCR reaction mixture consisted of 0.5 ul
of purified DNA, 1 ul dNTPs, 1.6 ul primer MVZ 15 and 1.6 ul primer MVZ 16, 1.5 ul
MgCl2, 5 ul of 10X PCR buffer and 36.3 ul ultrapure Distilled Water (Gibco) and 0.5 ul
Taq Polymerase for a final volume of 50 ul for each sample. The specifications for the
polymerase chain reaction for these samples was 38 cycles of denaturation for 1 minute at
94 OC, annealing for 1 minute at 50OC, and elongation for 1 minute at 72 OC using a PTC-
100 Peltier Thermal Cycler.
Gel Electrophoresis was used to verify the presence the PCR products. 10 ul
aliquots of amplified DNA was electrophoresed in 1.0% agarose (1 X TAE) gel stained
with Ethidium Bromide (EtBr) in TAE buffer (0.04 M Tris base, 0.02 M glacial acetic
acid, 0.001 M EDTA, pH 8.0) for two hours at 75 V. The DNA band in the gel were then
assessed under UV light using EpiChem3 Darkroom (UVP BioImaging Systems) to
verify the presence of the 800 bp fragment indicating successful amplification of the
Cytochrome b gene.
Identification of Eurycea 29
TA cloning was used to clone the amplified gene product using the TOPO TA
clonging® kit according to protocol. Individual colonies of transformed cells were
selected and the plasmids were purified using QIAprep® Spin Miniprep Kit according to
protocol. The purity of the DNA was spectroscopically analyzed using the absorbance
ratio of the sample at 260 nm and 280 nm and the presence of the plasmid was accessed
with electorphoresis using 1.0% agarose (1 X TAE) gel stained with Ethidium Bromide
(EtBr) in TAE buffer (0.04 M Tris base, 0.02 M acetic acid, 0.001 M EDTA, pH 8.0) for
two hours at 75 V and visualized under UV light.
The purified plasmid DNA from the samples was then digested with EcoR1 to
verify the subcloning of the cytochrome b gene segment into the vector. EcoR1 is a
restriction endonuclease that cleaves the vector on either side of the location of the insert.
Gel electrophoresis was confirmed the presence of a ~800 bp fragment, which indicated
the insertion of the correct DNA. The samples were then sent to the University of
Michigan DNA Sequencing Facility for Sequencing and analyzed using BLAST.
Discussion
The identification of the larval species from the mine was not definitive due in
part to a lack of a comparison sequence available for the Three-lined salamander. Figure
10 below illustrates a diagram showing the sequence similarities between the species
under study based on available data. A Three-lined positive control sequence could reveal
that the larvae from the mine are more similar to a Three-lined salamander than a cave
salamander, although this is not likely due to the close taxonomic rank between E.
longicauda and E. guttolineata. A Three-lined positive control would also be able to
verify the identification of the Three-lined metamorph from the mine. Furthermore, there

Identification of Eurycea 30
was only one Long-tail sequence available for comparison with the larvae on the online
CoreNucleotide database, thus providing a very limited variety for assessment. All three
species of salamanders examined here have highly similar DNA because they are from
the same genus, Eurycea, so even slight differences will be important for indentification.
More accurate and definitive identification will require more positive controls for
comparison, and a larger sampling of specimens from the cave.
Figure 10. Diagram showing Sequence similarities from available data.
Currently samples of Three-lined and Long-tailed salamanders have been
obtained from Pulaski County, Virginia, and Breaks Interstate Pack, Virginia. These
samples should be sequenced and compared to the salamander sequences from the
Amherst County mine. There will be differences in the sequences due to geographic

Identification of Eurycea 31
separation of the populations but comparison could still prove to be beneficial for
identification. Additionally, there are four additional specimens from the mine, two of
which are thought to be Long-tailed Salamanders and one a Three-lined salamander,
based on morphology. The salamanders are juveniles, so the identifications based on
morphology are not definitive. The fourth specimen was obtained from the mine is an
adult Three-lined salamander and its morphology clearly revealed three-lined
characteristics. These should be sequenced in addition to six larvae salamanders of
unknown species collected from the mine in May of 2008. This data could prove to be
highly beneficial in the species identification of this population of Eurycea in the mine.
Conclusion
Genetic sequencing can be a highly useful tool for the purpose of species
identification. Only a small tissue sample is needed to perform the analysis as a result of
the amplification technique of PCR, and in some cases the tissue can be degraded or even
from a fossil. Sequencing allows for the comparison of individuals at the genomic level,
where mutations not resulting in morphological differences are made apparent, thus more
detailed knowledge of the true divergences of species is made available.
Although genetic sequencing is a useful tool, many problems can arise when
attempting to carry out the sequencing process. A region of a gene must be selected to
analyze and compare that will have mutations at a rate that will be phylogenetically
informative. As discussed above, the mitochondrial genome is often a prime choice,
although genetic material in many species is only passed down though the maternal
lineage. After an applicable gene is selected, primers must be developed that will
efficiently and correctly amply the chosen gene. This can be difficult because a primer

Identification of Eurycea 32
sequence must be chosen that will be conserved enough to amplify the variety of targeted
individuals, but that will not also amplify contaminates in the PCR reaction. The primers
must also have the correct C-G content, and lack the ability for self-hybridization and the
formation of dimers. Also the PCR reaction must be optimized, with variable
concentrations of Taq Polymerase, Primers, Target DNA, dNTPs, Magnesium Chloride,
and potassium chloride so that a minimum amount of background DNA is produced with
maximum yield of target DNA. Often containments can be a problematic when
attempting to amplify and specific segment.
Despite the difficulties, the value of the information gained from genomic
sequencing is clear. Genetic markers can be highly informative, not only for correct
species identification but also concerning the population dynamics, the phylogeny,
phylogeography, and matrilineal ancestry of a species. Furthermore, correct species
identification of larvae is an important indicator of population vitality, as the presence of
larvae denotes successful reproduction (Parmelee, Knutson, & Lyon, 2002). Information
gained from this research can be used to better understand complex population dynamics
like those of the Eurycea in the Riverville mine.

Identification of Eurycea 33
References
Alberts, B., Johnson, A., Lewis, J., Raff, M., Raoberts, K., & Walter, P. (2008).
Molecular biology of the cell (5th ed.). New York: Garland Science.
Altshuler, M.L. (2006). PCR troubleshooting: The essential guide. Norwich, United
Kingdom: Caister Academic Press.
Benson, D.A., Karsch-Mizrachi, I., Lipman., D.J., Stell, J., & Wheeler, D.L. (2008).
GenBank. Nucleic Acids Res, 36, D25-30.
Bonett, R.M. & Chippindale, P.T. (2004). Speciation, phylogeography and evolution of
life history and morphology in plethodontidae salamanders of the Eurycea
multiplicata complex. Molecular Ecology, 13 (5), 1189-1203.
Carlin, J.L. (1997). Genetic and morphological differentiation between Eurycea
longicauda longicauda and E. guttolineata (Caudata: Plethodontidae).
Herpetologica, 53, 206-217.
Conant, R., Stebbins, R.C., & Collins, J.T. (1992). Peterson first guide to reptiles and
amphibians. Boston: Houghton Mifflin Company.
Downs, F.L. & Pfingsten, R.A. (Eds.). (1989). Salamanders of Ohio. (Vol. 7, 2nd Ed.).
College of Biological Sciences: The Ohio State University Press.
Goebel, A.M., Donnelly, J.M., & Atz, M.E. (1999). PCR primers and amplification
methods, for 12S ribosomal DNA, the control region, cytochrome oxidase I, and
cytochrome b in Bufonids and other frogs, and an overview of PCR primers
which have amplified DNA in amphibians successfully. Molecular Phylogenetic
and Evolution, 11(1), 163-199.

Identification of Eurycea 34
Jackman, T. R., Applebaum, G., and Wake, D.B. (1997). Phylogenetic relationships of
bolitoglossine salamanders: A demonstration of the effects of combining
morphological and molecular data sets. Mol. Biol. Evol, 14, 883–891.
Jockusch, E.L. & Wake & D.B. (2002). Falling apart and merging: Diversification of
slender salamanders (Plethodontidae: Batrachoseps) in the American west.
Biological Journal of the Linnean Society, 76, 361-391.
Johns, G.C. & Avise, J.C. (1998). A comparative summary of genetic distances from the
mitochondrial cytochrome b gene. Molecular Biology and Evolution, 15, 1481-
1490.
Kuchta, S. R. and D. B. Wake. (2005). Ensatina Ensatina eschscholtzii Gray. Pp. 110-113
in Jones, L. L. C., Leonard, W. P. & Olson, D. H. Amphibians of the Pacific
Northwest. Seattle: Seattle Audubon Society.
Kvist, Laura. (2000, March). Phylogeny and phylogeography of Eurpean Parids.
Retrieved September 16, 2009, from the University of Oulu, Oulu, Finland, Oulu
University Web site http://herkules.oulu.fi/isbn9514255364/html/index.html
Lannoo, M. (Eds.). (2005). Amphibian declines: The conservation status of United States
Species. Berkeley: University of California Press.
Lu, B., Yadav, S., Shah, P.G., Liu, T., Tian, B., Pukszta, S., Villaluna, N., Kutejova, E.,
Newlon, C.S., Santos, J.H., & Suzuki, C.K. (2007). Roles for the human ATP-
dependent Lon protease in mitochondrial DNA maintenance. The Journal of
Biological Chemistry, 292 (24), 17363-17372.

Identification of Eurycea 35
Martof, B. S., Palmer, W. M., Bailey, J. R., & Harrison III, J. R. (1980). Amphibians and
reptiles of the Carolinas and Virginia. Chapel Hill: The University of North
Carolina Press.
Mayhew, J. (2008). Identification of Eurycea larvae in an abandoned mine using
Cytochrome B Sequence Comparisons. Unpublished.
McPherson M.J. & Møller, S.G. (2000). PCR: The basics for background to bench. New
York: BIOS Scientific Publishers.
Moritz, C., & Faith, D. P. (1998). Comparative phylogeography and the identification of
genetically divergent areas for conservation. Molecular Ecology, 7, 419-429.
Moritz, C., Schneider, C.J., and Wake, D.B. (1992). Evolutionary relationships within the
Ensatina eschscholtzii complex confirm the ring species interpretation. Syst. Biol.
41, 273-291.
Parmelee, J., Knutson, M., & Lyon, J. (2002) A field guide to amphibian larvae and eggs
of Minnesota, Wisconsin, and Iowa. Washington, DC: U.S. Geological Survey,
Biological Resources Division, Information and Technology Report
USGS/BRD/ITR-2002-0004.
Reichenbach, N. (2000). Syntopic occurrence of Eurycea lucifuga (Cave salamander), E.
longicauda longicauda (Long-tailed salamander), and E. guttolineata (Three-
lined salamander) in the Piedmont of Virginia. Catesbeiana, 20, 32-33.
Reichenbach, N., LeMon, M., & Hinson, J. (2006). Ecology of a salamander
assemblage, including disjunct populations of Eurycea lucifuga and E. l.
longicauda, in an abandoned Virginia mine. Banisteria, 28, 1-5.
Identification of Eurycea 36
Ringia, A.M. & Lips, K.R. (2007). Oviposition, early development and growth of the
cave salamander Eurycea lucifuga: surface and subterranean influences on a
troglophilic species. Herpetologica, 63(3), 258-268.
Smith, Hobart M. (1978). A Guide to Field Identification: Amphibians of North America.
Wisconsin: Western Publishing Company.
Sunnucks, Paul. (2000). Microsatellite frequencies in different taxa. Trends in Ecology
and Evolution, 15 (9), 376-377.
Teletchea, F., Bernillon, J., Duffraisse, M., Laudet, V., & Hänni, C. (2008) Molecular
identification of vertebrate species by oligonucleotide microarrary in food and
forensic samples. Journal of Applied Ecology, 45, 967-975.
Vences, M., Thomas, M., Bonett, R.M., & Vieites, D.R. (2005). Deciphering amphibian
diversity through DNA barcoding: Chances and challenges. Philosophical
Transactions of the Royal Society B, 360, 1859-1868.
Wilson, L.A.(1995). The land manager's guide to the amphibians and reptiles of the
south. Chapel Hill, NC: The Nature Conservancy, Southeastern Region.
Zigler, K.S. & Harlan, A.J. (2006). The Phylogenetic Position of the Cave Salamander,
Eurycea lucifuga. Unpublished.