identification of fluvial stratigraphy using shallow subsurface ... 9 (girish).pdf ·...
TRANSCRIPT

Identification of fluvial stratigraphy using shallow subsurface geophysical and field investigations: a case study from Sabarmati River terraces, mainland Gujarat
659
Identification of fluvial stratigraphy using shallow subsurface geophysical and field investigations: a case study from Sabarmati
River terraces, Mainland GujaratGirish Ch Kothyari1*, Raj Sunil Kandregula1, Vasu Pancholi1, and Nirmit Sah2
1Institute of Seismological Research, Raisan, Gandhinagar (Gujarat), India2Kumaun University, Nainital, Uttarakhand, India
*Corresponding Author: [email protected]
ABSTRACTThe present investigation is an attempt to understand stratigraphic correlation of fluvial terrace deposits using Ground Penetrating Radar (GPR) and field evidences. The vertical as well as lateral variations in the lithofacies and the continuity of the bounding surfaces are delineated using the conventional geological and high resolution shallow sub-surface GPR profiles. The field investigations revealed presence of three levels of fluvial terraces of 16 m height that are preserved at a section near Gandhinagar along the Sabarmati River. Field examination of these terrace exposures show well developed fluvial facies in the area. The GPR image of lower terraces (T1) indicates depositional minor changes in velocity in the upper two layers giving rise to fining upward planar cross-stratified sand facies, which is typical of a point-bar sequence. The 2D GPR image of upper terraces (T2 and T3) show velocity changes because of high degree lateral and vertical heterogeneity. This heterogeneity in sedimentary facies possibly occurred because of the sediment deposition by high stage flood events.
Key words: Sabarmati River; GPR; Fluvial stratigraphy; Fluvial terraces; Mainland Gujarat.
INTRODUCTION
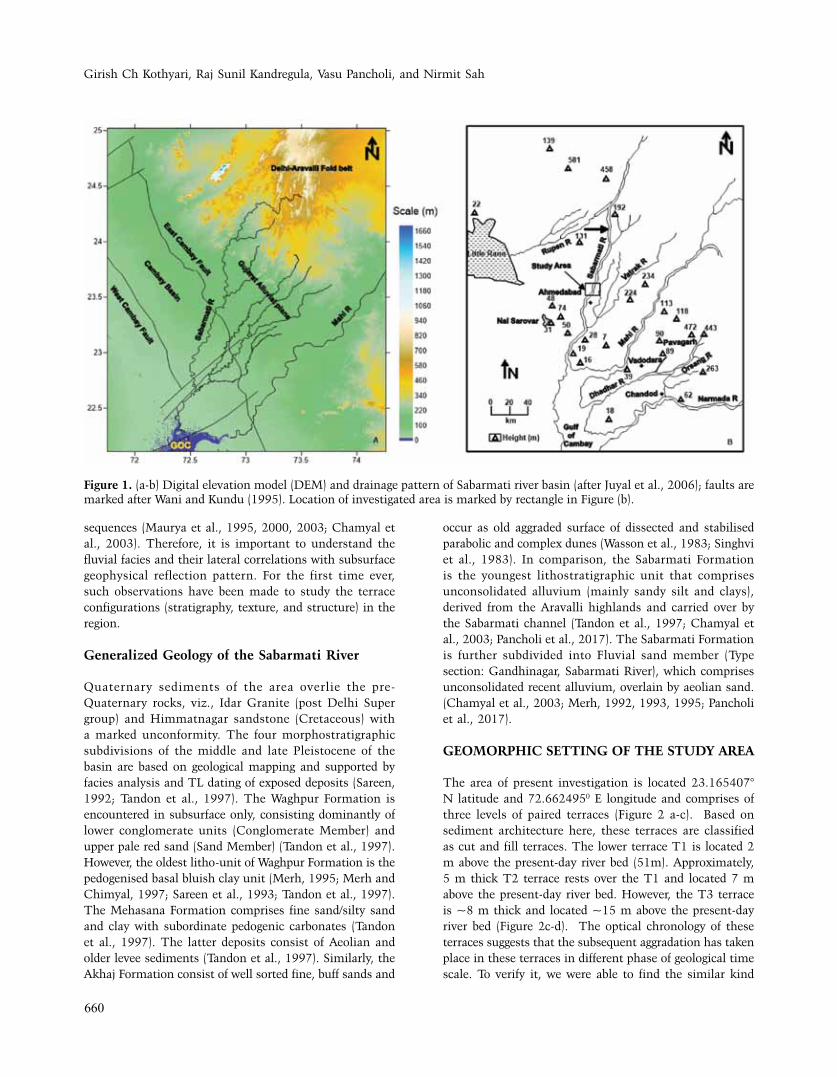
The River Sabarmati in the north Mainland Gujarat, flows through a semi-arid to sub-humid region with a mean annual rain fall of ~ 600-750 mm (Srivastava et al., 2001; Jain et al., 2004; Juyal et al., 2006). The river originates from the southern slope of the Aravalli Hills, crossing a large alluvial plain and then disappears into the Gulf of Cambay (GOC). The Sabarmati basin covers almost 21,477 km2 area. The basin can be divided into four major stratigraphic divisions, namely Waghpur, Mahesana, Akhaj and Sabarmati formations (Tandon et al., 1997; Jain et al., 2004; Srivastava et al., 2001; Zeuner, 1950). Zeuner (1950) investigated the Sabarmati basin and suggested that the repeated dry and wet climate facilitated the sedimentation in the basin, which shifted its course gradually to the east during the Quaternary. Based on lineament and drainage studies, Sareen et al., (1993) suggested that while the regional drainage in the Gujarat alluvial plain follows the NE-SW regional slope, the River Sabarmati follows a NS to NNE-SSW trend. The region comprises of three distinct geomorphic surfaces namely, (i) the upland terraces and associated fossil dunes, (ii) the river valley terraces and scroll plain and (iii) the eastern piedmont plain (Srivastava et al., 2001; Juyal et al., 2003). On the basis of sedimentological and geomorphological studies, Sridhar et al., (1994) suggested that the Quaternary sediments in the Sabarmati Basin are unrelated to the present-day river. Studies shows that the basin is under the influence of tectonic deformation during middle to late Holocene
and the landforms are significantly modified by climatic fluctuations during the Holocene period (Juyal et al., 2006). The land cover changes due to tectonic movements, were analysed by Srivastava et al., (2001) in the central portion of basin near Mahudi. Further, Srivastava et al., (2001) believe that the river basin was modified by two pulses of tectonic movement between 3 ka and 0.3 ka. In Sabarmati River basin, limited studies have been done and therefore the understanding of the sedimentary architecture in semi-arid region of Gujarat is lacking.
To understand the lithofacies assemblage, multi-disciplinary studies along the fluvial terraces have been taken up to unravel the depositional nature. In this light, the ground penetrating radar (GPR) is considered an ideally suited tool to identify the buried sedimentological architecture which provides high resolution profiles of the shallow subsurface ‘blind zone’ (~20 m depth), that cannot be studied by any other geophysical technique (Davis and Annan, 1989; Jol, 1995; Maurya et al., 2013; Sridhar and Patidar, 2005). Here, we present the results of a GPR survey carried out over the fluvial terraces deposits of Sabarmati River in a semi-arid climatic zone. Detailed field and Ground Penetrating Radar (GPR) studies have been proved to be extremely useful tool in carrying out similar studies in India and various other parts of the globe (Rashed et al., 2003; Ferry et al., 2004; Patidar et al., 2007; McClymont et al., 2008; Carpentier et al., 2012; Joshi et al., 2012; Zarroca et al., 2016).
The central part of Sabarmati River basin is mostly occupied by well-preserved Quaternary sedimentary
J. Ind. Geophys. Union ( November 2018 )v.22, no.6, pp: 659-668
Girish Ch Kothyari, Raj Sunil Kandregula, Vasu Pancholi, and Nirmit Sah
660
sequences (Maurya et al., 1995, 2000, 2003; Chamyal et al., 2003). Therefore, it is important to understand the fluvial facies and their lateral correlations with subsurface geophysical reflection pattern. For the first time ever, such observations have been made to study the terrace configurations (stratigraphy, texture, and structure) in the region.
Generalized Geology of the Sabarmati River
Quaternary sediments of the area overlie the pre-Quaternary rocks, viz., Idar Granite (post Delhi Super group) and Himmatnagar sandstone (Cretaceous) with a marked unconformity. The four morphostratigraphic subdivisions of the middle and late Pleistocene of the basin are based on geological mapping and supported by facies analysis and TL dating of exposed deposits (Sareen, 1992; Tandon et al., 1997). The Waghpur Formation is encountered in subsurface only, consisting dominantly of lower conglomerate units (Conglomerate Member) and upper pale red sand (Sand Member) (Tandon et al., 1997). However, the oldest litho-unit of Waghpur Formation is the pedogenised basal bluish clay unit (Merh, 1995; Merh and Chimyal, 1997; Sareen et al., 1993; Tandon et al., 1997). The Mehasana Formation comprises fine sand/silty sand and clay with subordinate pedogenic carbonates (Tandon et al., 1997). The latter deposits consist of Aeolian and older levee sediments (Tandon et al., 1997). Similarly, the Akhaj Formation consist of well sorted fine, buff sands and
occur as old aggraded surface of dissected and stabilised parabolic and complex dunes (Wasson et al., 1983; Singhvi et al., 1983). In comparison, the Sabarmati Formation is the youngest lithostratigraphic unit that comprises unconsolidated alluvium (mainly sandy silt and clays), derived from the Aravalli highlands and carried over by the Sabarmati channel (Tandon et al., 1997; Chamyal et al., 2003; Pancholi et al., 2017). The Sabarmati Formation is further subdivided into Fluvial sand member (Type section: Gandhinagar, Sabarmati River), which comprises unconsolidated recent alluvium, overlain by aeolian sand. (Chamyal et al., 2003; Merh, 1992, 1993, 1995; Pancholi et al., 2017).
GEOMORPHIC SETTING OF THE STUDY AREA
The area of present investigation is located 23.165407° N latitude and 72.6624950 E longitude and comprises of three levels of paired terraces (Figure 2 a-c). Based on sediment architecture here, these terraces are classified as cut and fill terraces. The lower terrace T1 is located 2 m above the present-day river bed (51m). Approximately, 5 m thick T2 terrace rests over the T1 and located 7 m above the present-day river bed. However, the T3 terrace is ~8 m thick and located ~15 m above the present-day river bed (Figure 2c-d). The optical chronology of these terraces suggests that the subsequent aggradation has taken place in these terraces in different phase of geological time scale. To verify it, we were able to find the similar kind
Figure 1. (a-b) Digital elevation model (DEM) and drainage pattern of Sabarmati river basin (after Juyal et al., 2006); faults are marked after Wani and Kundu (1995). Location of investigated area is marked by rectangle in Figure (b).

Identification of fluvial stratigraphy using shallow subsurface geophysical and field investigations: a case study from Sabarmati River terraces, mainland Gujarat
661
of lithology, sedimentary structures and clast composition on the opposite side of our studied terraces (Figure 2c). The detailed description of each terraces are given below.
TERRACE DESCRIPTION
Youngest terrace (T3):
The 8 m high youngest terrace T3 comprises of total 12 stratigraphic units. The lowermost unit-1 is approximately 30 cm thick layer of matrix supported gravel overlain by 0.70 m thick cross bedded clast supported by gravel of unit
2. The unit 2 is overlain by 1.5 m thick laminated massive sand (of unit-3) (Figure 3a). Unit-4 shows 1 m thick sand with disperse gravel. The unit-5 is 0.60 m thin containing fine laminated massive sand. Further, unit-6 comprises 0.05 m clast supported gravel. Unit-7 is juxtaposed above it and shows a 0.20 m laminated massive sand, overlain by 0.05 m thin gravel bed (unit-8). The unit-9 consists of 0.50 m massive laminated sand. Unit-10 is a clay horizon of 0.20 m thin (laminations seen) which is further overlain by unit-11 of massive cross bedded sand having 2 m thickness. The topmost unit-12 comprises 2.5 m thick pedogenised sand (Figure 3b-c).
Figure 2. (a) Location and drainage map of Sabarmati river basin, (b) Digital elevation model (DEM) of the study area shows geomorphic development along Sabarmati river basin. (c) Detail geomorphic map of the study area (d) details of paired terraces configuration.

Girish Ch Kothyari, Raj Sunil Kandregula, Vasu Pancholi, and Nirmit Sah
662
Terrace T2.
The terrace T2 is 5 m thick sedimentary sequence, comprising of total 5 stratigraphic units. The litholog is prepared based on lithology, petrographic and clast orientation. The lowermost unit-1 is 2 m thick massive gravel matrix supported which is sub angular-sub rounded in nature (clast differentiates itself as sandstone, shale, quartz, granite, basalt) resulting in weak grading (Figure 4a). Unit-2 is 1.3 m of planar cross bedded (grouped) with the presence of alternate gravel and sand beds (3-3.5 cm thick) having angular –very angular gravel with sand matrix (mica seen in matrix as well). Unit-3 is 0.35 m comprising red sand with calcium carbonate nodules (palaeosol) and overlain by unit-4 of 0.95 m cross bedded with weakly stratified gravels having sand matrix and clast supported (Figure 4a). The topmost unit-5 is 1.2 m thick showing fine to medium grained pedogenised sand with laminations seen in few places. However, these latter deposits are Aeolian and older levee sediments in which massive bedding is visible, fractures are seen due to the exerting forces via rootlets of trees) in which patches of clay has been observed (Figure 4 b-c).
Oldest Terrace T1
This is the oldest terrace of our studied section; this section is 2m thick, starting with the lowermost unit-1 approximately 1m thick containing poorly graded massive matrix supported gravel (unit-1). It is overlain by 0.06 m crudely laminated sand with dispersed gravel (unit-2). The unit-3 is approximately 0.07 m. thick matrix supported gravel bed, which is capped by 0.06 m cross laminated sand (unit-4). The unit-4 is covered by 0.06 m thick fine sand unit (unit-5), further overlain by 0.02 m thick rounded to sub-rounded clast supported gravel (unit-6). The unit-7 is 0.09 m thick fine sand, which is overlain by 0.03 m thick laminated (unit-8) clay horizon. This unit is covered by 0.3m thick cross laminated micaceous sand (unit-9), which is overlain by clast supported sub-angular to sub-rounded gravels (unit-10). The unit-10 is capped by 0.2 cm thick cross laminated sand (unit-11) (Figure 5).
Ground Penetrating Radar (GPR) data acquisition
The 200 MHz mono-static GPR is used for the survey. The data is recorded on channel-1 with sampling rate
Figure 3 (a) Composite stratigraphy of youngest T3 terraces showing major 12 stratigraphic units, (b and c) are the field photographs showing textural composition of the terrace.

Identification of fluvial stratigraphy using shallow subsurface geophysical and field investigations: a case study from Sabarmati River terraces, mainland Gujarat
663
Figure 4. (a) Composite stratigraphy of T2 terraces showing major 5 stratigraphic units, (b and c) are field photographs showing textural composition of Terrace.
Figure 5. (a) Composite stratigraphy of T1 terraces showing major 11 stratigraphic units, (b) field photograph showing lithology of the terrace.

Girish Ch Kothyari, Raj Sunil Kandregula, Vasu Pancholi, and Nirmit Sah
664
of 2048 samples/scan, and 164 scans/unit. The range varies 25.5– 175 ns and based on sedimentary units. Dielectric constant of 6.5 kV/mm was found suitable for the survey. The interpretation of GPR data is based on the characterization of specific signal patterns received from the interface of stratigraphic units (Maurya et al., 2013; Sridhar and Patidar, 2005). External noises owing to presence of the wires, metallic bodies and pipelines may be present. The uppermost high- amplitude continuous reflections occur because of direct air waves and ground waves generated from ground air interface. The first continuous return occurs as the energy travels directly from transmitter to receiver through the air with high velocity (at near the speed of light, 2.998 × 10⁸ m/ns). The next continuous returns occur due to the changes in dielectric properties of the medium (air to ground). The 2D GPR plot is termed as wiggle mode, is used to delineate the lithological features and sedimentary structures in the strata deposited by the Sabarmati River.
We carried out 2D GPR surveys with a GSSI SIR-20 system using a 200 MHz antenna along N-S oriented transects at three terraces for studying the fluvial deposits. After taking 18 test profiles, the parameter found suitable for collection of GPR profile are Scan: 2048; Bits /sample: 16; Scan/sec: 30; Scans/m: 112.76; Dielectric constant: 6.5; Range gain 0-4; Position Correction: -29.2 ns. The stratigraphy and texture of the exposed fluvial terrace sections are shown above (Figures 3-5). We used N-S and E-W GPR transects for stratigraphic correlation with the vertically exposed terraces sections. The 2D-GPR profiles were acquired with an average velocity of 0.11 m/ns, which
was used for the time–depth conversion. The post-survey processing of GPR data was done using the RADAN 6.2 software. For processing of GPR image, we applied band-pass filter, static correction, stacking and amplification of weak signals. All profiles shown here are time-zero corrected and presented in 2D GPR image. The details of GPR transects are highlighted in figure 6.
RESULTS AND INTERPRETATION
The shallow subsurface geophysical technique is an important method for characterization and identification of sedimentary facies (Neal et al., 2002). Geophysically, the sedimentary facies are generally characterised by continuity of reflector pattern, shape of reflectors and amplitude of wiggles reflectors (Maurya et al., 2005). These reflectors are interpreted in terms of the sedimentary characteristics (texture and structure), by correlating interface and waveform behaviour with respect to exposed stratigraphic horizons (Maurya et al., 2005). The results of GPR data generated from the present study is thus interpreted with the help of exposed terrace sections.
GPR stratigraphy of Terrace T3 The youngest terraces T3 is approximately 8 m thick in which four different radar facies is observed. The top most GPR facie depicts parallel continuous reflector in which very less attenuation is observed owing to presence of homogeneous litholog facies representing aeolian sand which is well corroborated with field observations
Figure 6. Digital elevation model of the study area. The transects are highlighted by thick brown lines (A B C).

Identification of fluvial stratigraphy using shallow subsurface geophysical and field investigations: a case study from Sabarmati River terraces, mainland Gujarat
665
(Figure 7). The second radar facie depicts high and low amplitude discontinuous horizontal and inclined reflectors, corresponding to cross bedded sand. The third radar facie depicts parallel continuous reflectors. The low amplitude difference in attenuation is caused by varying degree of induration in the lithology and presence of gravel have elevated the dispersive nature of wave trespassing. The fourth radar facie depicts high amplitude discontinuous reflector. The inclined reflection is caused by the cross bedding. Further attenuation of radar waves has been observed, which could be caused by presence of massive gravels present; which has affected the wave’s penetration through it, thus the amplitude of reflection decreases subsequently (Figure 7).
GPR stratigraphy of Terrace T2
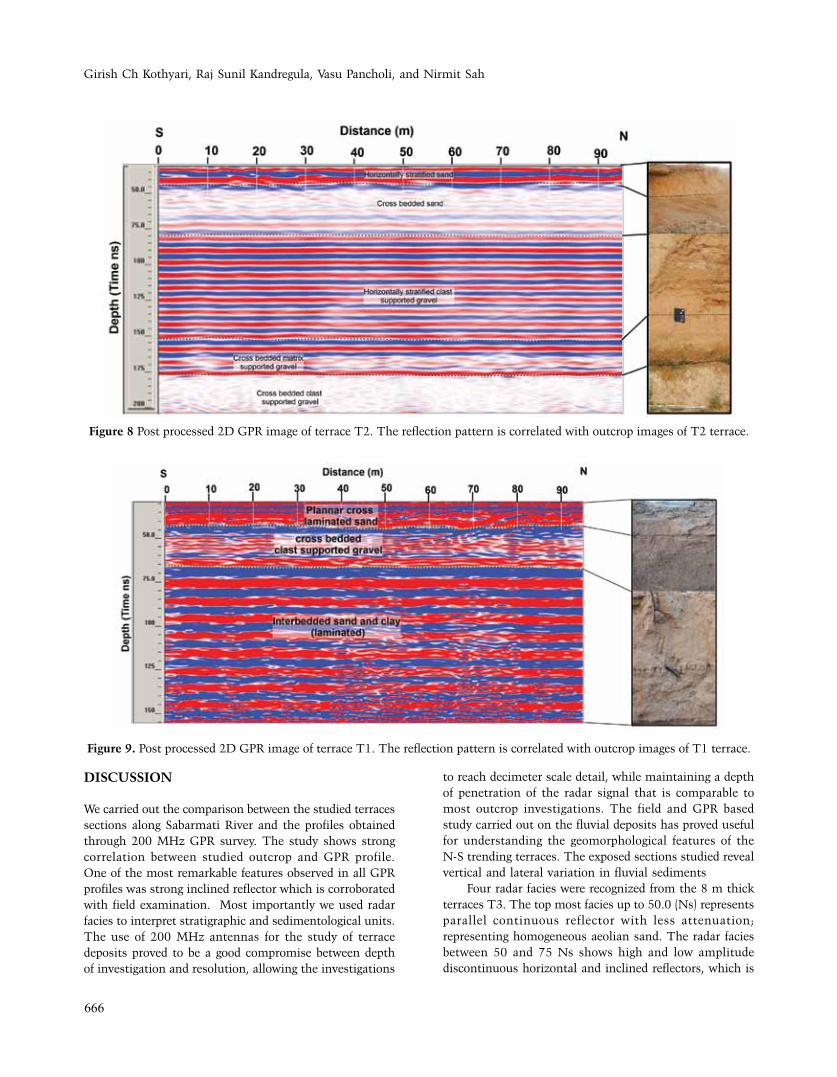
The T2 terrace is located above the T1 terrace with a vertical separation of 5 m. Five distinct radar facies have been observed based on their reflection patterns. The topmost radar facie (between 32 ns and 40 ns depicts parallel and consistent reflection. Low magnitude attenuation has been observed in the GPR image, which could be because of stratified nature of sediment corresponding to horizontal stratified sand (Figure 8). The inclined reflector between depth between 50 ns and 65 ns is due to presence of cross bedded sand. The third radar facie (depth between 80 ns and 160 ns) depicts low amplitude parallel and continuous reflectors, representing horizontally stratified clast supported gravel, slight hyperbolic attenuation is observed due to the dispersion and scattering of radar
waves due to presence of conductive nature of clasts (Figure 8). The next radar facies show low amplitude discontinuous inclined reflectors representing cross bedded matrix supported gravel. The lowermost radar facie (depth) depicts high amplitude discontinuous reflector representing cross bedded clast supported gravel. However, radar waves are attenuated, this dispersion compared with presence of alternate sand lenses of gravel (Figure 8).
GPR stratigraphy of Terrace T1
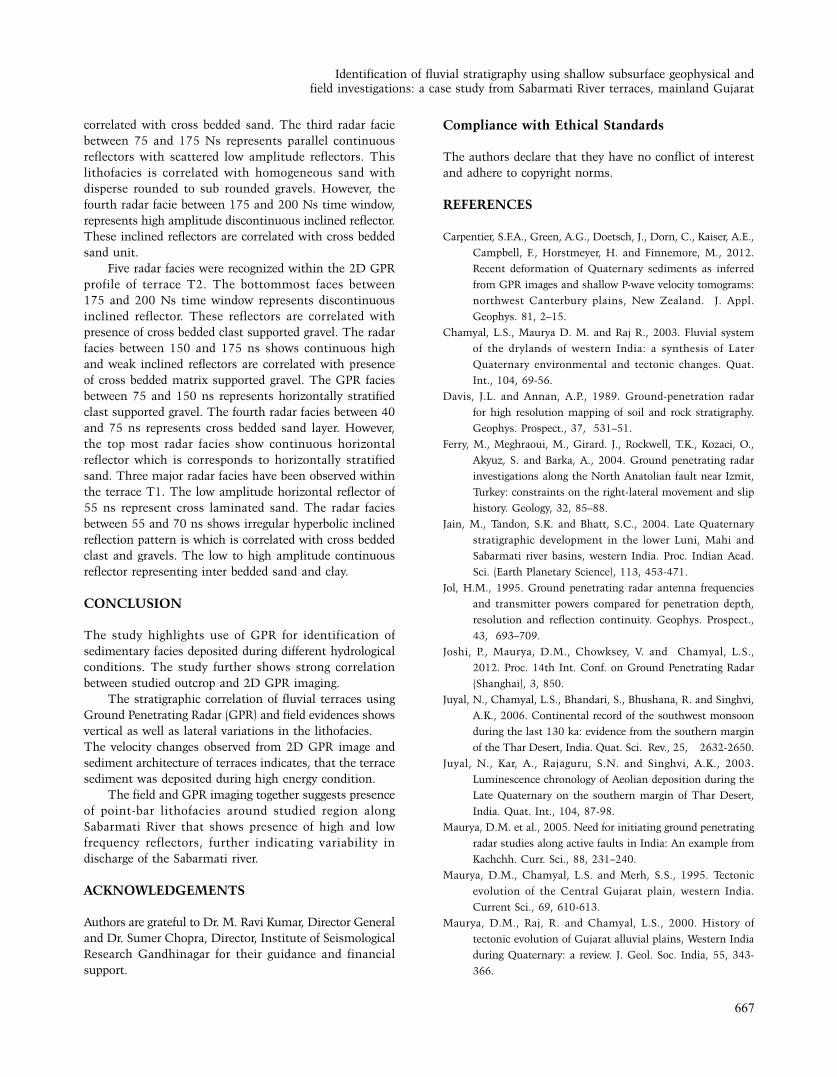
GPR survey was carried out along the N-S transect over the 2.5 m thick T1 terrace, which is the oldest. Three major radar facies have been identified. The topmost radar facie up to the depth of 55 ns depicts low amplitude horizontal reflectors consisting of cross laminated sand. In the later part of the transect the irregular hyperbolic reflection pattern is visible in GPR reflection, which is correlated with presence of clast and gravels (Figure 9). The second radar facie between the depth range of 55 ns and 70 ns depicts inclined low amplitude discontinuous reflectors has been observed all along the profile, infers presence of cross bedded strata that is clearly seen in the profile. The fluvial layers in the deposits attained low dip in conformity with the unevenness of the available surface. The radar signals are very much attenuated due to the presence of clay horizons (Figure 9). Here, it may be due northward dipping of clay layers. The third radar facie depicts low amplitude sub parallel to sub inclined reflectors representing inter bedded sand and clay lamination radar facies depicts low amplitude parallel reflectors.
Figure 7. 2D GPR image showing stratigraphy of oldest terrace T3. The reflection pattern is correlated with outcrop images of T3 terrace.
Girish Ch Kothyari, Raj Sunil Kandregula, Vasu Pancholi, and Nirmit Sah
666
DISCUSSION
We carried out the comparison between the studied terraces sections along Sabarmati River and the profiles obtained through 200 MHz GPR survey. The study shows strong correlation between studied outcrop and GPR profile. One of the most remarkable features observed in all GPR profiles was strong inclined reflector which is corroborated with field examination. Most importantly we used radar facies to interpret strati graphic and sedimentological units. The use of 200 MHz anten nas for the study of terrace deposits proved to be a good compromise between depth of investigation and resolution, allowing the investigations
to reach decimeter scale detail, while maintaining a depth of penetration of the radar signal that is comparable to most outcrop investigations. The field and GPR based study carried out on the fluvial deposits has proved useful for understanding the geomorphological features of the N-S trending terraces. The exposed sections studied reveal vertical and lateral variation in fluvial sediments
Four radar facies were recognized from the 8 m thick terraces T3. The top most facies up to 50.0 (Ns) represents parallel continuous reflector with less attenuation; representing homogeneous aeolian sand. The radar facies between 50 and 75 Ns shows high and low amplitude discontinuous horizontal and inclined reflectors, which is
Figure 9. Post processed 2D GPR image of terrace T1. The reflection pattern is correlated with outcrop images of T1 terrace.
Figure 8 Post processed 2D GPR image of terrace T2. The reflection pattern is correlated with outcrop images of T2 terrace.
Identification of fluvial stratigraphy using shallow subsurface geophysical and field investigations: a case study from Sabarmati River terraces, mainland Gujarat
667
correlated with cross bedded sand. The third radar facie between 75 and 175 Ns represents parallel continuous reflectors with scattered low amplitude reflectors. This lithofacies is correlated with homogeneous sand with disperse rounded to sub rounded gravels. However, the fourth radar facie between 175 and 200 Ns time window, represents high amplitude discontinuous inclined reflector. These inclined reflectors are correlated with cross bedded sand unit.
Five radar facies were recognized within the 2D GPR profile of terrace T2. The bottommost faces between 175 and 200 Ns time window represents discontinuous inclined reflector. These reflectors are correlated with presence of cross bedded clast supported gravel. The radar facies between 150 and 175 ns shows continuous high and weak inclined reflectors are correlated with presence of cross bedded matrix supported gravel. The GPR facies between 75 and 150 ns represents horizontally stratified clast supported gravel. The fourth radar facies between 40 and 75 ns represents cross bedded sand layer. However, the top most radar facies show continuous horizontal reflector which is corresponds to horizontally stratified sand. Three major radar facies have been observed within the terrace T1. The low amplitude horizontal reflector of 55 ns represent cross laminated sand. The radar facies between 55 and 70 ns shows irregular hyperbolic inclined reflection pattern is which is correlated with cross bedded clast and gravels. The low to high amplitude continuous reflector representing inter bedded sand and clay.
CONCLUSION
The study highlights use of GPR for identification of sedimentary facies deposited during different hydrological conditions. The study further shows strong correlation between studied outcrop and 2D GPR imaging.
The stratigraphic correlation of fluvial terraces using Ground Penetrating Radar (GPR) and field evidences shows vertical as well as lateral variations in the lithofacies. The velocity changes observed from 2D GPR image and sediment architecture of terraces indicates, that the terrace sediment was deposited during high energy condition.
The field and GPR imaging together suggests presence of point-bar lithofacies around studied region along Sabarmati River that shows presence of high and low frequency reflectors, further indicating variability in discharge of the Sabarmati river.
ACKNOWLEDGEMENTS
Authors are grateful to Dr. M. Ravi Kumar, Director General and Dr. Sumer Chopra, Director, Institute of Seismological Research Gandhinagar for their guidance and financial support.
Compliance with Ethical Standards
The authors declare that they have no conflict of interest and adhere to copyright norms.
REFERENCES
Carpentier, S.F.A., Green, A.G., Doetsch, J., Dorn, C., Kaiser, A.E.,
Campbell, F., Horstmeyer, H. and Finnemore, M., 2012.
Recent deformation of Quaternary sediments as inferred
from GPR images and shallow P-wave velocity tomograms:
northwest Canterbury plains, New Zealand. J. Appl.
Geophys. 81, 2–15.
Chamyal, L.S., Maurya D. M. and Raj R., 2003. Fluvial system
of the drylands of western India: a synthesis of Later
Quaternary environmental and tectonic changes. Quat.
Int., 104, 69-56.
Davis, J.L. and Annan, A.P., 1989. Ground-penetration radar
for high resolution mapping of soil and rock stratigraphy.
Geophys. Prospect., 37, 531–51.
Ferry, M., Meghraoui, M., Girard. J., Rockwell, T.K., Kozaci, O.,
Akyuz, S. and Barka, A., 2004. Ground penetrating radar
investigations along the North Anatolian fault near Izmit,
Turkey: constraints on the right-lateral movement and slip
history. Geology, 32, 85–88.
Jain, M., Tandon, S.K. and Bhatt, S.C., 2004. Late Quaternary
stratigraphic development in the lower Luni, Mahi and
Sabarmati river basins, western India. Proc. Indian Acad.
Sci. (Earth Planetary Science), 113, 453-471.
Jol, H.M., 1995. Ground penetrating radar antenna frequencies
and transmitter powers compared for penetration depth,
resolution and reflection continuity. Geophys. Prospect.,
43, 693–709.
Joshi, P., Maurya, D.M., Chowksey, V. and Chamyal, L.S.,
2012. Proc. 14th Int. Conf. on Ground Penetrating Radar
(Shanghai), 3, 850.
Juyal, N., Chamyal, L.S., Bhandari, S., Bhushana, R. and Singhvi,
A.K., 2006. Continental record of the southwest monsoon
during the last 130 ka: evidence from the southern margin
of the Thar Desert, India. Quat. Sci. Rev., 25, 2632-2650.
Juyal, N., Kar, A., Rajaguru, S.N. and Singhvi, A.K., 2003.
Luminescence chronology of Aeolian deposition during the
Late Quaternary on the southern margin of Thar Desert,
India. Quat. Int., 104, 87-98.
Maurya, D.M. et al., 2005. Need for initiating ground penetrating
radar studies along active faults in India: An example from
Kachchh. Curr. Sci., 88, 231–240.
Maurya, D.M., Chamyal, L.S. and Merh, S.S., 1995. Tectonic
evolution of the Central Gujarat plain, western India.
Current Sci., 69, 610-613.
Maurya, D.M., Raj, R. and Chamyal, L.S., 2000. History of
tectonic evolution of Gujarat alluvial plains, Western India
during Quaternary: a review. J. Geol. Soc. India, 55, 343-
366.

Girish Ch Kothyari, Raj Sunil Kandregula, Vasu Pancholi, and Nirmit Sah
668
Maurya, D.M., Bhandari, S., Thakkar, M.G. and Chamyal., 2003.
Late Quaternary fluvial sequences of Southern Mainland
Kachchh, Western India. Current Sci. 84, 1056-1064.
Maurya, D.M., Chouksey, V., Joshi, P.N. and Chamyal, L.S., 2013.
Application of GPR for delineating the neotectonic setting
and shallow subsurface nature of the seismically active Gedi
Fault, Kachchh, Western India. J. Geophys. Engg., 10, DOI:
10.1088/1742-2132/10/3/034006.
McClymont, A.F., Green, A.G., Streich, R., Horstmeyer, H.,
Tronicke, G., Nobes, D.C., Pettinga, J., Campbell, J. and
Langridge, R., 2008. Visualization of active faults using
geometric attributes of 3D GPR data: an example from the
alpine fault zone, New Zealand. Geophysics, 73, 11–23.
Merh, S.S., 1992. Quaternary sea level changes along Indian coast.
Proc. Indian National Sci. Acad., 58, 461–472.
Merh, S.S., 1993. Neogene Quaternary sequences in Gujarat:a
review. J. Geol. Soc. India, 21, 259–276.
Merh, S.S., 1995. Geology of Gujarat, Geological Society of India.,
Bangalore. 1-220.
Merh, S.S. and Chamyal, L.S., 1997. The Quaternary Geology of
Gujarat Alluvial Plain. Indian National Science Academy,
New Delhi, 98.
Neal, A., Pontee, N. I., Pye, K. and Richards, J., 2002. Internal
structure of mixed-sand-and-gravel beach deposits revealed
using ground penetrating radar. Sedimentology, 49,
789–804.
Pancholi, V., Kothyari, G.C., Prizomwala, S., Sukumaran, P.,
Shah, R.D., Bhatt, N.Y., Chauhan M. and Kandregula, K.R.,
2017. Morphotectonic of Sabarmati-Cambay basin, Gujarat,
Western India. J. Indian Geophys. Un., 21(5), 371-383.
Patidar, A.K., Maurya, D.M., Thakkar, M.G. and Chamyal, L.S.,
2007. Fluvial geomorphology and neotectonic activity based
on field and GPR data, Katrol hill range, Kachchh, western
India. Quat. Int., 159, 74–92.
Rashed, M., Kawamura, D., Nemoto, H., Miyata, T. and Nakagawa,
K., 2003. Ground penetrating radar investigations across the
Uemachi fault, Osaka, Japan. J. Appl. Geophys., 53, 63–75.
Sareen, B.K., 1992. Geomorphology, neotectonics, late Quaternary
sedimentation patterns and TL chronology of the semiarid
Sabarmati basin Gujarat Alluvial Plan, India, Thesis, Univ.
Delhi.
Sareen, B.K., Tandon, S.K. and Bhola, A.M., 1993. Slope deviatory
alignment, stream network and lineament orientation of
Sabarmati river system. Neotectonic activity in the mid-late
Quaternary. Current Sci., 64, 827-836.
Singhvi, A.K., Sharma, Y.P., Agrawal, D.P. and Dhir, R.P.,
1983. Thermoluminescence dating of dune sands: some
refinements. PACT, 9, 499-504.
Sridhar, A. and Patidar, A., 2005. Ground penetrating radar studies
of a point-bar in the Mahi River Basin, Gujarat. Current
Sci., 89, 183-189.
Sridhar, V., Chamyal, L.S. and Merh, S.S., 1994. North Gujarat
rivers: Remnants of super fluvial system. J. Geol. Soc. India
44, 427–434.
Srivastava, P., Juyal, N., Singhvi, A.K., Wasson, R.J. and Bateman,
D., 2001. Luminescence chronology of river adjustment
and incision of Quaternary sediments in the alluvial plain
of Sabarmati river, north Gujarat, India. Geomorphology,
36, 217-229.
Tandon, S.K., Sareen, B.K., Someshwararao, M. and Singhvi, A.K.,
1997. Aggradation history and luminescence chronology of
Late Quaternary semi-arid sequences of the Sabarmati basin,
Gujarat, western India. Palaeogeogeograp. Palaeoclimatol.
Palaeoecol. .128, 339-357.
Wani, M.R. and Kundu. J., 1995. Tectonostratigraphcal analysis
in Cambay rift basin: Leads for future exploration, In
proceedings first international Petrol Conference. B.R.
Publishing Corporation, Delhi, pp. 147-174.
Wasson, R.J., Rajaguru, S.N., Misra, V.N., Agrawal, D.P., Dhir, R.P.,
Singhvi, A.K. and Rao, K.K., 1983. Geomorphology, late
Quaternary stratigraphy and paleoclimatology of the Thar
field. Z. Geomorphol. Suppl., 45, 117-151.
Zarroca, M., Comas, X., Gutierrez F., Carbonel, D., Linares
R., Roque C., Mozafari, M., Guerrero, J. and Pellicer X.,
2016. The application of GPR and ERI in combination
with exposure logging and retrodeformation analysis to
characterize sinkholes and reconstruct their impact on
fluvial sedimentation: Preconstructing sinkhole impact on
Fluvial sediment Earth Surface Process and Landforms DOI:
10.1002/esp.4069.
Zeuner, F.E., 1950. Stone Age Pleistocene chronology of Gujarat.
Deccan College Monograph 6, pp. 46.
Received on: 14.5.18; Revised on: 7.8.18; Accepted on: 19.9.18