identification of genomic differences between laboratory and ......studying gene expression and...
TRANSCRIPT

Identification of genomic differences between laboratory
and commercial strains of Saccharomyces cerevisiae
by
Anthony John Heinrich
B. Biotech. (Hons)
Thesis submitted for the degree of
Doctor of Philosophy
March 2006
Faculty of Sciences
School of Agriculture, Food and Wine
Discipline of Wine and Horticulture
The University of Adelaide

Table of Contents
Declaration ............................................................................................................................................. i
Thesis summary .................................................................................................................................... ii
Acknowledgments................................................................................................................................ iv
Abbreviations .........................................................................................................................................v
CHAPTER 1 Introduction .............................................................................................................1 1.1. INTRODUCTION ....................................................................................................................1 1.2. SIGNAL TRANSDUCTION PATHWAYS ARE ACTIVATED UNDER STRESSFUL CONDITIONS ........2 1.3. THE RESPONSE OF SACCHAROMYCES CEREVISIAE AFTER ENCOUNTERING A STRESSFUL
ENVIRONMENT .....................................................................................................................5 1.3.1. Stress related genes ........................................................................................................5 1.3.2. Proteins that are differentially expressed after stress. ...................................................8 1.3.3. Cell membrane and lipid modifications of yeast under stress ......................................10 1.3.4. Physiological changes to the yeast cell after stress response ......................................11
1.4. COMPARING STRAINS.........................................................................................................12
CHAPTER 2 Materials and Methods .........................................................................................15 2.1. PREPARATION OF DNA......................................................................................................15 2.2. COMPARING STRAINS USING AFLP....................................................................................15 2.3. CLONING OF POLYMORPHIC BANDS....................................................................................16 2.4. SEQUENCING OF POLYMORPHIC FRAGMENTS .....................................................................17 2.5. COMPARING POLYMORPHIC FRAGMENTS TO S288C DATABASE .........................................18 2.6. VECTORETTE PCR TO ESTABLISH FULL GENE SEQUENCE...................................................18 2.7. INTERNAL TRANSCRIBED SPACER (ITS) AMPLIFICATION AND RFLP OF RDNA: ................19 2.8. SOUTHERN ANALYSIS ........................................................................................................19 2.9. METABOLOME FERMENTATIONS AND ANALYSIS BY HIGH PERFORMANCE LIQUID
CHROMATGRAPHY (HPLC) ................................................................................................21 2.10. ISOLATING TOTAL PROTEIN EXTRACTS FROM YEAST..........................................................22 2.11. TWO-DIMENSIONAL GEL ELECTROPHORESIS (2D GELS) TO IDENTIFY DIFFERENCES IN
YEAST PROTEOMES.............................................................................................................23 2.11.1. Waite Campus Gels ......................................................................................................23 2.11.2. Australian Proteome Analysis Facility (APAF) 2D gels ..............................................24 2.11.3. Silver Stain ...................................................................................................................25 2.11.4. Colloidal Coomassie Staining ......................................................................................25
2.12. WESTERN BLOT ANALYSIS ................................................................................................26 2.13. PROTEIN IDENTIFICATION ..................................................................................................28
2.13.1. Matrix-assisted laser desorption ionisation time-of-flight mass spectrometry (MALDI-TOF) .............................................................................................................................28
2.13.2. Tandem Mass Spectrometry (MS/MS) ..........................................................................29 2.14. RNA EXTRACTIONS ...........................................................................................................29 2.15. CDNA SYNTHESIS..............................................................................................................30 2.16. REAL-TIME QUANTITATIVE PCR........................................................................................31 2.17. CONTINUOUS FERMENTATIONS IN THE PRESENCE OF ETHANOL ........................................32
2.17.1. Yeast strain and media used .........................................................................................32 2.17.2. Continuous fermentation ..............................................................................................32

2.18. MICROARRAY ANALYSIS ...................................................................................................33 2.18.1. RNA purification for cDNA microarray analysis .........................................................33 2.18.2. Microarray cDNA and dye coupling preparation ........................................................34 2.18.3. Data and statistical analysis (bioinformatics)..............................................................36
2.19. NEAR INFRA-RED SPECTROSCOPY (NIRS)..........................................................................36 2.19.1. Anaerobic fermentations ..............................................................................................36 2.19.2. Spectra analysis............................................................................................................37 2.19.3. Multivariate data analysis............................................................................................37
CHAPTER 3 Identifying genome variation in Saccharomyces cerevisiae strains....................38 3.1. INTRODUCTION ..................................................................................................................38 3.2. RESULTS ............................................................................................................................39
3.2.1. Phenotypic differences exist between strains ...............................................................39 3.2.2. AFLP reveals novel sequences in wine strains.............................................................42 3.2.3. Confirming AWRI 1116 is a progenitor strain of UVAFERM CEG.............................47
3.3. DISCUSSION .......................................................................................................................53 3.4. CONCLUSION .....................................................................................................................57
CHAPTER 4 Comparative proteomics: Identifying differentially expressed proteins between two Saccharomyces cerevisiae strains...................................................................58
4.1. INTRODUCTION ..................................................................................................................58 4.2. RESULTS ............................................................................................................................60
4.2.1. Phenotypic differences demonstrate genetic variation in wine strains ........................60 4.2.1.1. Plate Assays – tolerance plates.............................................................................................. 60 4.2.1.2. Metabolic differences exist between laboratory and commercial strains .............................. 61
4.2.2. Proteomic comparison shows protein expression differences between strains ............65 4.2.2.1. Global proteome differences appear minimal between strains .............................................. 65 4.2.2.2. Expanding the observed proteome reveals more differences in protein expression .............. 67 4.2.2.3. Identification of proteins that appear wine strain-specific..................................................... 70 4.2.2.4. Protein modifications are present in AWRI 838 ................................................................... 73
4.3. DISCUSSION .......................................................................................................................76 4.4. CONCLUSION .....................................................................................................................81
CHAPTER 5 Characterising the role and function of proteins that are differentially expressed in wine strains.......................................................................................83
5.1. INTRODUCTION ..................................................................................................................83 5.2. RESULTS ............................................................................................................................85
5.2.1. Confirmation of increased Tdh3p expression in AWRI 838 using Western blot analysis ......................................................................................................................................85 5.2.2. Real-time PCR suggests post-transcriptional control may exist in wine strains ..........86 5.2.3. Replication of 2D gels confirms Shm2p and Tdh3p are expressed more highly in wine
strain AWRI 838 than S288C .......................................................................................89 5.2.4. Further examination of SHM2......................................................................................90
5.2.4.1. Near infra-red spectroscopy reveals SHM2 impacts on the metabolome .............................. 90 5.2.4.2. Southern analysis shows multiple alleles are not present in the wine strain genome ............ 93 5.2.4.3. Sequencing of the SHM2 gene shows seven base substitutions in wine strains .................... 94 5.2.4.4. Wine strains exhibit differential SHM2 gene expression in varying environmental conditions .............................................................................................................................................. 97
5.3. DISCUSSION .......................................................................................................................99 5.4. CONCLUSION ...................................................................................................................105

CHAPTER 6 Acclimatisation of Saccharomyces cerevisiae to ethanol in continuous culture 107
6.1. INTRODUCTION ................................................................................................................107 6.2. RESULTS ..........................................................................................................................109
6.2.1. 6% ethanol inhibits growth in batch culture ..............................................................109 6.2.2. 6% ethanol effects gene expression in continuous culture conditions........................111 6.2.3. Promoter analysis ......................................................................................................112
6.3. DISCUSSION .....................................................................................................................117 6.4. CONCLUSION ...................................................................................................................123
CHAPTER 7 Overall Conclusions and Future Studies ...........................................................124
Appendix One REAGENTS AND SOLUTIONS USED IN THIS STUDY ...........................................................................128
Appendix Two OLIGONUCLEOTIDE PRIMERS USED IN THIS STUDY ..........................................................................139
Appendix Three STRAINS USED IN THIS STUDY .........................................................................................................140
Appendix Four POLYMORPHIC SEQUENCES ISOLATED BY AFLP .............................................................................141
Appendix Five ISOELECTRIC FOCUSING PROGRAMS FOR DIFFERENT PH STRIPS.......................................................145
Appendix Six PGEM-T VECTOR USED FOR CLONING OF AFLP POLYMORPHIC FRAGMENTS..................................146
Bibliography .....................................................................................................................................147

Declaration
This work contains no material which has been accepted for the award of any other
degree or diploma in any university or other tertiary institution and, to the best of my
knowledge and belief, contains no material previously published or written by
another person, except where due reference has been made in the text.
I give consent to this copy of my thesis, when deposited in the University Library,
being available for loan and photocopying.
Anthony John Heinrich
March 2006
i

Thesis summary
The yeast Saccharomyces cerevisiae is used in many industrial applications
including beer brewing, bread making, and winemaking. Winemaking yeast strains
have the ability to convert grape sugars into alcohol and other metabolites consistent
with good wine. An exploratory comparative approach was undertaken to identify
the genes and corresponding proteins that give wine yeast strains of S. cerevisiae
their distinctive phenotype, with a focus on studying genes that provide tolerance to
ethanol.
A genomic and proteomic approach has been used to identify potential ‘wine
specific’ genes. By using amplified fragment length polymorphism (AFLP)
techniques, it has been demonstrated that commercial winemaking strains have
genetic sequences within their genome that may have arisen from other
Saccharomyces sensu stricto yeasts. This is the first known report of a wine strain
having Saccharomyces kudriavzevii genetic sequences encoded within its genome.
To further explore the phenotypic characters distinguishing wine yeast strains from
other S. cerevisiae strains, a comparative proteomics approach was taken. A
proteomics platform using two-dimensional gel electrophoresis (2D gels) has
elucidated target proteins for future research, including a glycolytic protein, Tdh3p
(glyceraldehyde 3-phosphate dehydrogenase), as well as a one-carbon pool protein,
Shm2p (serine hydroxymethyltransferase). The latter protein was characterised
ii
further to determine its possible role and function in wine strains, with results
indicating a potential role in wine flavour. It has also been shown that certain wine
strains may have different mechanisms for transcription/translation control of SHM2.
Using the comparative proteomic approach above, no differences were seen between
laboratory strains and wine strains after exposure to an ethanol stress. To ascertain
the genes that enable S. cerevisiae strains to counteract the high ethanol
concentrations encountered during grape juice fermentation, a continuous culture
approach was utilised. Ultimately, this will reveal genes that are important to S.
cerevisiae strains to acclimatise to a high ethanol environment, as opposed to a
short-term ethanol stress. The continuous culture approach identified 34 genes that
significantly changed expression in the ethanol-containing cultures, suggesting their
involvement in ethanol tolerance of S. cerevisiae.
iii

Acknowledgments
I would like to thank my principal supervisor Dr Miguel de Barros Lopes and my
co-supervisor Dr Vladimir Jiranek for their guidance and assistance throughout my
degree. The work presented would not have been possible without them. I would
also like to thank Dr Paul Chambers as a pseudo-supervisor for his help with the
ethanol stress studies.
I would like to acknowledge my laboratory colleagues in Dr Shauna Brown, Jenny
Bellon and Dr Kate Howell for their friendship and support throughout the past five
years. I also thank past and present members of the Molecular team, and indeed
everybody at The Australian Wine Research Institute for making my PhD more
bearable.
I would like to acknowledge the contribution of all my collaborators, most of which
have moved on to other projects after dealing with me: Jelle Lahnstein of the
University of Adelaide for his patience with me in developing proteomics at the
Waite Campus; Dr Graeme Currie and Kris Ferguson at the University of Melbourne
for assistance with mass spectrometry; Derek Van Dyk and Angela Connolly of the
Australian Proteome Analysis Facility were instrumental in achieving results with
proteomics; and Emmie Heeren from the Technical University of Delft for her help
with the ethanol stress, continuous culture fermentations.
I would also like to thank the Cooperative Research Centre for Viticulture for
funding the project and for scholarship provision.
Finally, I would like to acknowledge the unconditional support of my two best
friends, my parents Ray and Judy Heinrich. Simply put, without them the research
work would not have been completed and this thesis could not be formulated. I
cannot thank them enough for getting me this far in life.
iv

Abbreviations
2D gel Two-dimensional polyacrylamide gel electrophoresis
AFLP amplified fragment length polymorphism
APAF Australian Proteome Analysis Facility
AWRI Australian Wine Research Institute
cDNA complementary deoxyribonucleic acid
DIG digoxigenin
DNA deoxyribonucleic acid
FBA1 fructose bis-phosphate aldolase
GC-MS gas chromatography - mass spectrometry
HPLC high performance liquid chromatography
HSP heat shock protein
HSTF heat shock transcription factor
IEF isoelectric focusing
ITS RFLP internal transcribed spacer restriction fragment length polymorphism
MALDI-TOF matrix-assisted laser desorption ionisation time-of-flight spectrometry
MAP mitogen activated protein
mRNA messenger ribonucleic acid
MS/MS tandem mass spectrometry
NIRS near infra-red spectroscopy
ORF open reading frame
PCA principle component analysis
v

PCR polymerase chain reaction
PI isoelectric point
rDNA ribosomal deoxyribonucleic acid
RNA ribonucleic acid
RP ribosomal protein
RPM revolutions per minute
SAGE serial analysis of gene expression
SC synthetic complete
SDS sodium dodecyl sulphate
SGD Saccharomyces Genome Database
SHM2 serine hydroxymethyltransferase
SPI1 stationary phase induced
STRE stress response element
TBS-T tris buffered saline – Tween 20
TDH3 glyceraldehyde 3-phosphate dehydrogenase
TRIS tris(hydroxymethyl)aminoethane
WUGSC Washington University Genome Sequencing Centre
YPD yeast extract/peptone/dextrose medium
vi

CHAPTER 1
Introduction
1.1. INTRODUCTION
The budding yeast Saccharomyces cerevisiae is an important model organism for
studying gene expression and function. As a result, there has been a great deal of
research carried out with this organism with regards to its life cycle, mating abilities,
genome evolution and gene expression. In fact, the S. cerevisiae laboratory strain
S288C was the first eukaryote to have its genome completely sequenced and
available to the public (Cherry et al., 1997).
Yeast have been one of the most exploited organisms used in human societies
throughout the ages. Beer brewing, sake making, baking, and winemaking industries
all use S. cerevisiae in the production of goods for human consumption. Each of
these activities use yeast strains that have been selected over time for their particular
properties, such as tolerance to a high ethanol concentration (Attfield, 1997;
reviewed in Casey and Ingledew, 1986), the ability to use certain sugars (Bell et al.,
2001), and osmotolerance (Blomberg and Adler, 1989). It has been shown that
considerable differences exist between the genome of commercial strains and
laboratory strains of S. cerevisiae (Azumi and Goto-Yamamoto, 2001; Bidenne et
al., 1992; Carlson and Botstein, 1983; de Barros Lopes et al., 1999; Hauser et al.,
2001; Perez-Ortin et al., 2002) but the genes and proteins that generate the different
phenotypes remain to be established.
1

The yeasts used to ferment grape juice to wine encounter a number of stresses
including a high sugar concentration (200 g/L or more), low pH (ca 3-4), and a high
ethanol concentration at the end of fermentation (often greater than 15%). It would
be valuable to identify and characterise the genes and corresponding proteins that
give rise to the wine strain phenotype, including those involved in stress tolerance
mechanisms of wine strains. Hauser et al. (2001) have identified several genes that
differed in expression between a wine and a laboratory strain under standard
laboratory growth conditions, while Rossignol et al. (2003) have extended this
research to investigate the transcriptional differences between strains during
fermentation in a synthetic wine medium. By integrating the outcomes of this
research, together with all the available published data, the information could then
enable the accurate monitoring of yeast performance during fermentation, allow the
prediction of wine yeast strain attributes, and permit the selection and production of
new and improved strains for commercial use.
1.2. SIGNAL TRANSDUCTION PATHWAYS ARE ACTIVATED UNDER STRESSFUL
CONDITIONS
Yeast cells have the ability to elicit a response to external stimuli, such as
environmental changes and signal molecules (eg. pheromones), by inducing genes in
response to the changing surroundings. The receptors that sense these stimuli and the
associated transcription factors that activate a response are essential for cell survival
under stressful conditions (Brewster et al., 1993). Signalling pathways are activated
by different stimuli, but commonly comprise a receptor to sense the stimuli, and an
2

intracellular factor that promotes the initiation of a cellular response. The assembly
and regulation of signalling components that control the intensity and specificity of a
signal is an emerging area of investigation and that the complete pathways have not
yet been revealed (Dohlman and Thorner, 2001). One signalling pathway of
relevance to wine-related studies is the high osmolarity glycerol (HOG) pathway.
The phosphorylation of protein kinases in this cascade regulates transcription factors
that initiate transcription of genes necessary for a stress response (Figure 1). When
activated independently, three MAP kinase kinase kinases, Ssk2p, Ssk22p, and
Ste11p, are able to phosphorylate a MAP kinase kinase, Pbs2p, which in turn
activates by phosphorylation a single MAP kinase Hog1p. The activated Hog1p, by
mechanisms currently not fully understood, induces the expression of genes. It
appears though that two transcription factors, Msn2p and Msn4p, are involved in
binding to stress response elements in the promoter region of stress-related genes to
activate the response (Martinez-Pastor et al., 1996).
It has been shown that MAP kinases function identically in two separate MAPK
cascades, or operate independently in a single cascade. For example, the HOG
pathway, invasive growth, and the pheromone response pathways all share the
MAPKK kinase Ste11p (O'Rourke and Herskowitz, 1998). However, a second MAP
kinase, Fus3p, only functions as a MAP kinase in the pheromone response pathway
(Lee and Elion, 1999). To support the concept of independent MAP kinases, Maeda
et al., (1995) demonstrated that Pbs2p was activated differently depending on the
upstream signal. Both a putative transmembrane osmosensor Sho1p, and
3
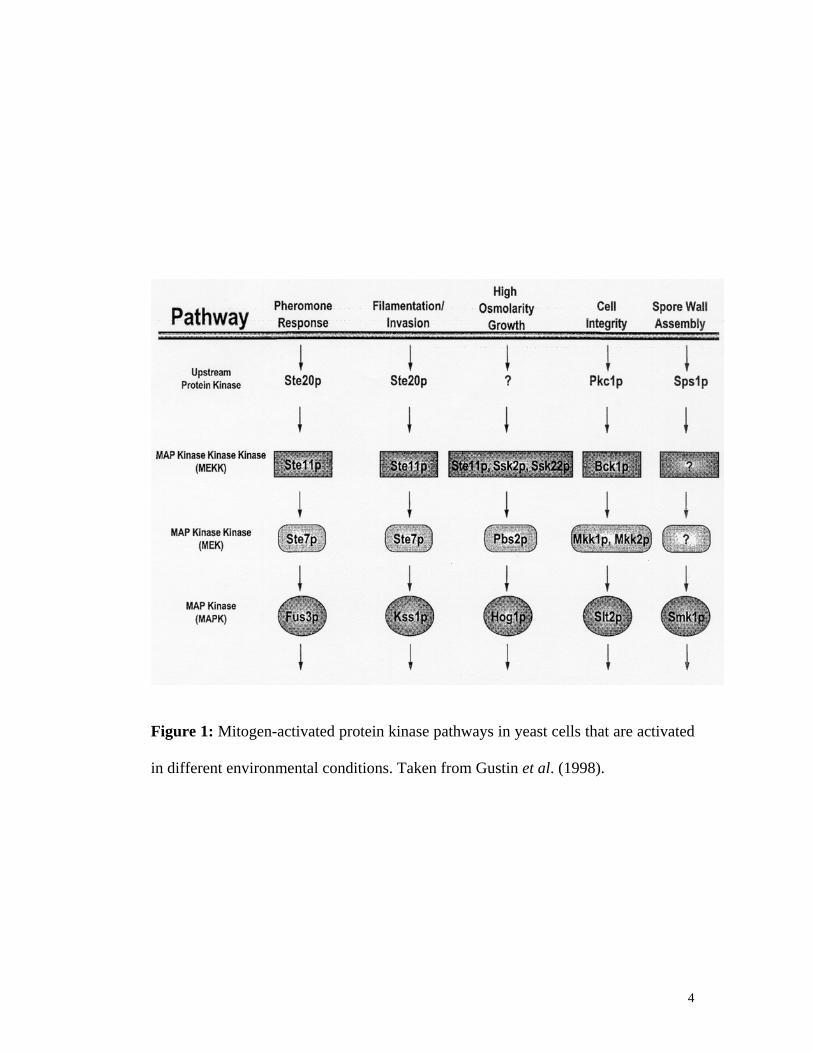
Figure 1: Mitogen-activated protein kinase pathways in yeast cells that are activated
in different environmental conditions. Taken from Gustin et al. (1998).
4

MAPKKK's Ssk2p and Ssk22p under the control of the SLN1-SSK1 two component
osmosensor, are osmosensors in the cell membrane that send two different upstream
signals to Pbs2p. In addition, it has been shown that by deleting the PBS2 gene, there
was a decreased or delayed response in proteins known to be upregulated under an
osmotic shock (Akhtar et al., 1997). It should be noted that the research in each of
these published studies has used laboratory strains, and the mechanisms of signal
transduction in wine strains may differ, thereby resulting in their unique phenotypes.
1.3. THE RESPONSE OF SACCHAROMYCES CEREVISIAE AFTER ENCOUNTERING A
STRESSFUL ENVIRONMENT
1.3.1. Stress related genes
The change of external environment for a yeast cell can result in many changes in
gene expression as a result of a signal being sent from the cell membrane to the
nucleus. A study using DNA microarrays looking at various environmental stresses
such as temperature shock, chemicals and nutrient depletion showed changes in
expression of approximately 900 out of the 6200 genes in S. cerevisiae (Gasch et al.,
2000). The gene expression patterns of yeast exposed to these different
environmental stresses were remarkably similar. For each stress, approximately 50
genes with a stress response element (STRE) promoter sequence, recognised by the
transcription factors Msn2p and Msn4p, were induced. After a temperature shift
from 250C to 370C, approximately 600 genes were repressed. Two distinct clusters
were evident amongst the repressed genes. The first of these include genes for RNA
processing, translation initiation, nucleotide biosynthesis, cell growth and other
5

metabolic processes. The second cluster involved genes almost exclusively encoding
ribosomal proteins, and have been shown previously to be regulated by the
transcription factor Rap1p (Li et al., 1999). Of the induced genes, only 40% have a
defined function and consist of genes involved in cell wall modification, protein
folding and degradation, DNA damage repair, and intracellular signaling. It should
be noted that a similar data set has been seen with other stresses, such as hydrogen
peroxide treatment, nitrogen starvation, and hyper- and hypo-osmotic shock
(Causton et al., 2001).
The ability of commercial yeast strains such as brewing and winemaking strains to
endure stress during fermentation is well documented (Attfield, 1997; reviewed in
Casey and Ingledew, 1986). One established response by S. cerevisiae to endure
stress is the induction and expression of heat shock proteins (HSPs). HSPs can aid in
the folding and unfolding of proteins by binding to polypeptide chains, and facilitate
in the assembly of multiple peptides to form larger structures. They are normally
present at low levels and their quantities increase during stress to stabilise proteins
(Parsell and Lindquist, 1993). HSPs have been shown to be highly expressed in the
presence of elevated temperatures (hence their name), (Brosnan et al., 2000;
Lindquist and Kim, 1996; Sanchez and Lindquist, 1990; Sanchez et al., 1992),
solvent tolerance (Alexandre et al., 2001; Aranda et al., 2002; Betz et al., 2004;
Carrasco et al., 2001; Garay-Arroyo et al., 2004; Palhano et al., 2004; Rossignol et
al., 2003), and most other stresses (Causton et al., 2001; Gasch et al., 2000).
Furthermore, it has been illustrated that the HSP70 genes that are induced with
6

exposure to heat stress are also induced with a high ethanol concentration (Piper et
al., 1994). Moreover, HSPs are produced during early stationary phase of yeast
growth in alcoholic fermentation (Piper et al., 1994; Werner-Washburne et al.,
1996). These studies are relevant for commercial wine yeast strains where one of the
major end products of grape juice fermentation is ethanol.
Ethanol as an extracellular stress is of interest to the wine industry as it can be one of
the major reasons for stuck wine fermentations. The complete genetic and cellular
response of yeast to an ethanol stress has not been described, although recent
published studies by Alexandre et al., (2001) and Chandler et al., (2004) have
examined the genetic response of a laboratory strain to a 7% and a 5% ethanol stress
respectively. The genes up-regulated after an ethanol stress in these studies include
metabolic genes, ionic homeostasis related genes, protein destination genes, and
stress response genes such as heat shock protein genes. Other genes are also
implicated to play a role in ethanol stress from studies at the genetic level of the
inherent high ethanol tolerance of sake yeast. Using microarrays that contain all
6,200 open reading frames of the S. cerevisiae laboratory strain S288C, Ogawa et
al., (2000) identified several genes whose expression was elevated in the ethanol-
tolerant sake strain, but not in the laboratory strain. Those induced were a glycerol
synthesis gene (GPD1), a gene with cytoplasmic catalase activity (CTT1), iso-2-
cytochrome c (CYC7), a heat shock protein (HSP12), and a gene that encodes a
protein located in the cell wall with an unknown molecular function (SPI1). This is
consistent with other studies looking at heat, peroxidase, osmotic and ethanol
7

stresses, where it has been concluded that these environmental stress response genes
are activated by different transcription factors depending on the environmental stress
(Alexandre et al., 2001; Gasch et al., 2000; Rep et al., 1999). In addition, the
identity of genes with a role in ethanol tolerance has been investigated using S.
cerevisiae mutant strains obtained by transposon mutagenesis (Takahashi et al.,
2001). Disruption of BEM2 (encoding a GTPase activating protein), PAT1 (a
topoisomerase II-associated protein), ROM2 (GDP-GTP exchanging factor for
Rho1p), VPS34 (required for vacuolar protein sorting), and ADA2 (component of the
histone acetyltransferase complex) produced ethanol sensitive mutants that could not
grow in medium containing 6% ethanol. These mutants were also sensitive to
Calcofluor white, a drug that affects cell wall structure, and zymolyase, showing the
necessity of these genes to maintain cell wall integrity after an ethanol stress. By
identifying genes induced with an ethanol stress response, the behaviour of wine
yeast strains during grape juice fermentation and how these strains are able to
tolerate the high ethanol concentrations toward the end of fermentation may be
better understood.
1.3.2. Proteins that are differentially expressed after stress.
After a yeast cell experiences an environmental stress, many processes occur such as
transcription, translation, post-translational modifications, and folding and cleaving
of proteins. Methods such as two-dimensional gel electrophoresis (2D gels),
antibody probing, and the latest technology of protein kinase chips (Zhu et al., 2000)
are invaluable to analyse protein biological activity. The regulation of osmotolerance
8

in yeast is well characterised as a result of much investigation using these strategies.
2D gel experiments have shown that many proteins were induced more than eight
fold in the presence of a high salt concentration (Blomberg, 1995). These proteins
were assigned as predominantly glycolytic enzymes, and comprise those required to
produce glycerol (Gpd1p) and trehalose (Tps1p) in order to rebalance osmolyte
levels (Andre et al., 1991; Blomberg, 1995). Other proteins that changed expression
include glycolytic proteins such as Tdh3p, Eno1p, and Pdc1p, a heat shock protein
Ssa1p, and Act1p, which is involved in cell structure. In addition, a study by
Norbeck and Blomberg (2000) found that the modified expression of these genes is
dependent on protein kinase A (PKA) activity. An osmotic stress also fully repressed
the expression of PKA-dependent glycolytic proteins (Pgi1p and Gdh1p), and a
protein in methionine metabolism (Sam1p), while partly repressing other PKA-
dependent glycolytic proteins (Pdc1p and Hxk2p), and a heat shock protein (Ssb1p).
This is consistent with the previous findings by Gasch et al. (2000) who studied the
mRNA expression of stressed yeast cells by microarray experiments.
In comparison, it has been shown that the level of messenger RNA in the cell is not
necessarily directly proportional to the amount of protein produced by the transcript
(Gygi et al., 1999). 150 proteins were identified by using 2D gel electrophoresis and
mass spectrometry (hence looking directly at the outcome of the message) and
compared to serial analysis of gene expression frequency tables that display
corresponding mRNA levels. It was noted that some proteins varied up to 20-fold in
9

expression compared to the calculated mRNA level, showing the importance of post-
translational regulation in controlling protein expression.
1.3.3. Cell membrane and lipid modifications of yeast under stress
The yeast cell membrane and cell wall have been shown to reconfigure in response
to stress. It has been reported that yeast adjust to elevated levels of extracellular
ethanol by altering the fatty acid composition of the membrane (Alexandre et al.,
1994; Chi and Arneborg, 1999; Guerzoni et al., 1999; Heipieper et al., 2000). Chi
and Arneborg (1999) reported that a strain highly tolerant to ethanol incorporated
significantly more long-chain fatty acids into total phospholipids than a less ethanol
tolerant strain, and that the ethanol tolerant strain had the ability to increase
membrane fluidity in response to ethanol by increasing the proportion of unsaturated
fatty acids. It has also been reported that when phosphatidylcholine (a component of
the yeast phospholipid cell membrane) is added to sake yeast cultures, the ethanol
tolerance of sake yeast was enhanced (Shin et al., 1995). An interesting observation
of relevance to winemaking is the finding that ethyl esters in lipid extracts
accumulate when yeast are exposed to 6% ethanol (Guerzoni et al., 1999). Ethyl
esters are an important sensory component of wine, and if produced during
fermentation as ethanol concentrations rise, may be important in the total
composition of the wine after fermentation. Apart from compositional changes in the
membrane, the activity of the H+ATPase increases in response to ethanol or heat
shock, resulting in enhanced proton efflux that enables the stress-induced
permeability of the membrane to be countered (Coote et al., 1994).
10

1.3.4. Physiological changes to the yeast cell after stress response
The yeast stress response leads to a number of physiological changes. Glycerol is
one of the first compounds to accumulate in cells exposed to high ethanol, heat
shock, and increased salt levels, and has been shown to maintain turgor pressure and
the structural composition of yeast cells (Ansell et al., 1997; Blomberg and Adler,
1989; Rep et al., 1999). It has also been suggested that accumulated trehalose within
the cell can function as an anti-stress compound (Lucero et al., 2000; Mansure et al.,
1994). This finding is supported by Ogawa et al. (2000) who noted a substantial
increase in intracellular glycerol and trehalose in two sake strains able to tolerate
ethanol concentrations of up to 20%. To support the idea of trehalose as a protectant
in the presence of high ethanol, this study showed an induction of the trehalose-6-
phosphate synthase (TPS1) and trehalose-6-phosphatase (TPS2) genes with the
addition of 10% ethanol to the growth medium. Both of these genes contain multiple
stress response elements in their promoter regions (Winderickx et al., 1996).
Furthermore, this study showed ethanol tolerant strains isolated from a sake mash
were resistant to K1 killer toxin and zymolyase, suggesting a change in the
conformation of the cell wall with increased ethanol tolerance. The gene encoding a
cell wall protein that binds to glucans and covers the cell wall, SPI1, was found to be
induced strongly in the ethanol tolerant strains under stress conditions, and it was
hypothesized that an increased level of Spi1p may provide resistance to killer toxin,
zymolyase, and increased concentrations of ethanol (Ogawa et al., 2000).
Contradictory to these studies, research by Swan and Watson, (1999) did not show
any consistent relationship between trehalose accumulation and the stress tolerance
11

of yeast cells. These authors noted that an ethanol and heat tolerant strain had
cellular membranes with high levels of oleic acid, indicating the importance of this
fatty acid to the ethanol and heat stress response (Swan and Watson, 1999).
1.4. COMPARING STRAINS
The development of DNA microarrays has been revolutionary for the comparative
analysis of S. cerevisiae strains and may be used to decipher genetic differences that
exist between phenotypes (reviewed in Duggan et al., 1999). The genetic variation
between a commercial wine strain and the laboratory strain S288C has been
examined using microarrays, with most of the S288C genes present in the wine
strain (Hauser et al., 2001). The results of this study showed that more than 40 genes
significantly differed in their regulation in the wine strain, and where analysed, these
were attributed to small variations in the promoter region or changes in gene copy
number. Two genes that were studied further were SSU1, which encodes a plasma
membrane protein involved in sulphite resistance and was shown to be upregulated
in the wine strain. The other gene, YHB1, encodes a flavohaemoglobin whose
expression is related to the level of oxygen and was not detected in the wine strain
by microarray analysis. This suggests that these two genes may be linked to the
physiology of this wine strain, reflecting the adaption of this strain for wine
fermentation (Hauser et al., 2001).
It has been shown that microarrays can also be used to monitor the genome content
of different strains (Winzeler et al., 1999). To assess this idea, genomic DNA of a
12

clinical yeast isolate taken from an AIDS patient was digested and probed against an
array containing each open reading frame of S288C. By hybridising several molar
amounts of each genome to arrays, it was shown that this isolate was missing a
number of S288C genes, as well as displaying several differences in gene copy
number. Furthermore, these experiments illustrated the polymorphic nature of the
telomeric regions of each strain, with 55% of changes located within 50kb of the
telomeres of chromosomes (Winzeler et al., 1999).
Amplified fragment length polymorphism (AFLP) is also an effective differential
technique for comparing genomes. This technique involves three main steps: 1) the
digestion of DNA by restriction endonucleases and ligation of oligonucleotide
adapters, 2) selective amplification of digested fragments using PCR, and 3) analysis
of amplified fragments using gel electrophoresis (Vos et al., 1995). It has been
utilised for applications in molecular clinical microbiology (Arnold et al., 1999;
Jiang et al., 2000), bacterial epidemiology (Aarts et al., 1998; Janssen et al., 1997),
and yeast strain comparative studies (Azumi and Goto-Yamamoto, 2001; de Barros
Lopes et al., 1999; Ganter and de Barros Lopes, 2000). By using AFLP analysis, it is
possible to discriminate yeast species and yeast strains based on their genome
sequence. Azumi and Goto-Yamamoto (2001) and de Barros Lopes et al. (1999)
used AFLP analysis to group Saccharomyces cerevisiae industrial strains such as
wine and baking strains, while also grouping laboratory strains together. Identifying
the DNA sequence of the polymorphic fragments could lead to the isolation and
13

discovery of genetic sequence variations that result in the physiological differences
in strains.
It is also possible to compare yeast strains with distinctive phenotypes using a
proteomics approach. Joubert et al. (2000) have compared a lager brewing yeast and
type strains of S. cerevisiae, S. monacensis, S. carlsbergensis, S. bayanus and S.
pastorianus to discover the ancestors of the commercial lager strain. By identifying
protein spots that had varying intensities, this group were able to conclude that the
lager yeast strain was a hybrid of a S. cerevisiae-like parent while the other parent
was best represented by a particular S. pastorianus strain (Joubert et al., 2000). It
should be noted however that a comparative analysis of two S. cerevisiae strains has
not been reported in the literature. Commercial winemaking strains of S. cerevisiae
having distinctive phenotypes that allow them to undergo grape juice fermentation,
while other S. cerevisiae strains such as a laboratory strain, S288C, cannot do this as
efficiently. Therefore, with the advent of new technologies, it may be possible to
identify phenotype-linked genes that exist between two S. cerevisiae strains with
almost identical genomes.
14

CHAPTER 2
Materials and Methods
2.1. PREPARATION OF DNA
For all strains (Appendix 3), DNA was purified using mechanical breakage with
glass beads (Ausubel, 1994). Yeast cells were disrupted using a Mini-Beadbeater®
(BioSpec) for 3 minutes with glass beads. DNA was purified using
phenol:chloroform:isoamyl alcohol (25:24:1), and a dried pellet resuspended in
sterile MilliQ water. All media and reagents are listed in Appendix 1.
2.2. COMPARING STRAINS USING AFLP
Amplified fragment length polymorphism (AFLP) was used to identify polymorphic
fragments between strains. The AFLP reactions were performed as previously
described (de Barros Lopes et al., 1999; Vos et al., 1995). Initially, primers Pst1-AA
(FAM) (5'-GACTGCGTACATGCAGAA-3'), Pst-AC (HEX) (5'-
GACTGCGTACATGCAGAC-3') and Pst1-AT (TET) (5'-
GACTGCGTACATGCAGAT-3') were used in combination with Mse1-C (5'-
GATGAGTCCTGAGTAAC-3') (Appendix 2). 20 µl of each reaction mix was
evaporated off and resuspended in 2 µl of 1x gel loading buffer (98% formamide, 10
mM EDTA, 0.05% bromophenol blue, 0.05% xylene cyanol). Samples were then
denatured at 90°C for 3 minutes and placed directly on ice for a further 3 minutes.
All 2 µl was loaded onto a 6% polyacrylamide Hoefer sequencing gel (0.1 mm
15
thick). The gel was run at constant power (40W) for 140 minutes. Once
electrophoresis was complete, the gel plates were separated with the gel adhering to
the small glass plate. The gel was silver stained according to the Silver SequenceTM
DNA Sequencing System Technical Manual (TM023, Promega) with some
modifications. Briefly, the gel was fixed for 30 minutes in 10% glacial acetic acid.
After washing the gel 3 times for 2 minutes each in water and drained, the gel was
stained (1 g/L silver nitrate, 5.5% formaldehyde) for 30 minutes. At the completion
of staining, the gel was rinsed in water for 5 seconds before placing it into
developing solution (30 g/L sodium carbonate, 2 mg/ml sodium thiosulphate, 5.5%
formaldehyde) until bands could be visualised. Development was stopped using 10%
glacial acetic acid, and the gel then rinsed thoroughly with Milli-Q water (Millipore,
USA). Gels were then scanned while adhered to the glass plate on a HP ScanJet
6100C/T scanner.
2.3. CLONING OF POLYMORPHIC BANDS
Polymorphisms in commercial strains were identified by visually comparing each
strain on the same gel to the sequenced laboratory strain, S288C. The polymorphic
band was excised with a sterile scalpel and the gel fragment crushed in a 0.5 ml
eppendorf tube with a yellow micropipette tip in the presence of 15 µl of sterile
Milli-Q water. The tubes were then subjected to 7 freeze-thaw cycles from liquid
nitrogen to a 37°C water bath to extract the DNA from the gel. After pelleting the
polyacrylamide, 2 µl of the supernatant was used for PCR to check if the DNA had
been extracted efficiently. The PCR products were then confirmed to be of correct
16

size when matched to the original polymorphic fragment on an agarose gel. Once
polymorphic bands had been checked for correct size, the bands were blunt-end
cloned into the vector pGEM-T Easy Vector® (Promega, Appendix 6). 10 µL of
PCR product was evaporated down to 1.5 µL and added to the ligation mix. The
ligation mix contained 2x ligation buffer (Promega), 1U of T4 DNA ligase, and 50
ng pGEM-T Easy Vector®. This ligation mix was then incubated at 4°C for 16
hours. 5 µl of ligation reaction was added to JM109 high efficiency competent
Escherichia coli cells as per instructions (Stratagene). After incubating
transformation plates for 17 hours at 37°C, white colonies (indicative of the presence
of a DNA insert) were picked. Plasmid DNA was isolated using standard protocols
(Sambrook and Russell, 2001). Each was checked for the correct insert by PCR
using the original AFLP primers above.
2.4. SEQUENCING OF POLYMORPHIC FRAGMENTS
Sequencing of polymorphic fragments was carried out at the Nucleic Acid and
Protein Chemistry Unit of the University of Adelaide. 30 ng of plasmid DNA was
placed in a sequencing master mix (8 µl Terminator Ready Reaction Mix, 9.6 pmol
T7 primer). Thermal cycling was as follows: (96°C x 10s, 50°C x 5s, 60°C x 4 min)
x 25 cycles, then held at 4°C. The resultant amplification mix was ethanol
precipitated (3 M sodium acetate (pH 4.6), 100% ethanol), the pellet washed with
70% ethanol, and vacuum centrifuged to dryness. This sample was rehydrated in
sterile water, loaded onto a sequencing gel, and run on an Applied Biosystems 373
17

DNA Stretch sequencer. The bands were assigned and a sequence generated
automatically using ABI software.
2.5. COMPARING POLYMORPHIC FRAGMENTS TO S288C DATABASE
Once the polymorphic sequences were analysed and amended for correct base
incorporation, the sequence was probed against the Saccharomyces Genome
Database (SGD, www.yeastgenome.org) using the BLAST software with default
parameters. For further comparisons, the Washington University Genome
Sequencing Centre (WUGSC) BLAST search engine was used for other
Saccharomyces species (Cliften et al., 2001; http://genome.wustl.edu), and the
European Bioinformatics Institute WU-Blast2 protein database was used for
comparing protein sequences translated from the polymorphic DNA sequences
against other species (http://www.ebi.ac.uk/blast2/).
2.6. VECTORETTE PCR TO ESTABLISH FULL GENE SEQUENCE
Vectorette PCR was used to acquire upstream and downstream sequence of fragment
1116-2 (Gecz et al., 1997; Munroe et al., 1994). Briefly, 10 µg of genomic DNA
was digested with EcoRV and Dra1 and the prehybridised sequences AJHBUB1
(5’GAAGGAGAGGACGCTGTCTGTCGAAGGTAAACGGACGAGAGAAGGG
AGAG3’) and AJHBUB2
(5’CTCTCCCTTCTGCGGCCGCAGTTCGTCAACATAGCATTTCTGTCCTCTC
CTTC3’) were ligated. This was achieved by heating the two oligos to 100°C for 10
minutes in the presence of 2x SSC buffer (0.3 M NaCl, 0.03 M Na citrate, pH 7.0)
18

and 1 M Tris [pH 8.0], then slowly cooling at room temperature to 25°C. The
adaptor sequences were then ligated to 1 µg of digested DNA with 1 unit of T4
DNA ligase. This product was then PCR amplified using adaptor-specific primer
AJHBUB3 (5’GCGGCCGCAGTTCGTCAACATAGCATTTCT3’) and a primer
designed within the digested sequence. The PCR product was then gel isolated with
a QIAGEN gel purification kit and sequenced. The sequences obtained were then
probed against multiple databases, including the S288C, EMBL and EMBLNEW
databases.
2.7. INTERNAL TRANSCRIBED SPACER (ITS) AMPLIFICATION AND RFLP OF
RDNA.
Ribosomal DNA was analysed using an ITS PCR/RFLP method (Esteve-Zarzoso et
al., 1999). Genomic DNA was amplified using the primers ITS1 5'-
TCCGTAGGTGAACTGCGG-3' and ITS4 5'-TCCTCCGCTTATTGATATGC-3'.
The fragment was then digested with HaeIII and resolved on a 1.5% agarose gel.
2.8. SOUTHERN ANALYSIS
Southern analysis was used to confirm the presence of isolated polymorphic
sequences from commercial strains. Initially, 800 ng of genomic DNA was
restriction digested with EcoR1 and HindIII in separate reactions and run on 1%
agarose gels respectively. Each gel was then denatured twice in denaturing solution
(0.5 M NaOH, 1.5 M NaCl) for 15 minutes each with gentle agitation at room
temperature. After rinsing with Milli-Q water, the gel was neutralised twice in
19
neutralising solution (0.5 M Tris-Cl (pH7.4), 3 M NaCl) for 15 minutes each at room
temperature. The gel was then placed upside down on a sheet of 3MM Whatman
filter paper soaked in 20x SSC, with the ends of the filter paper resting in a 20x SSC
reservoir. A piece of H Bond membrane wetted in 2x SSC was then placed on top of
the gel, and topped with three sheets of wetted filter paper and 8 cm of paper towel
with a weight on top to maintain downward pressure on the gel/membrane. The
transfer was left overnight, with the wells marked the following morning. The
membrane was then rinsed in 6x SSC and placed on filter paper wetted with 6x SSC.
The DNA was cross-linked to the membrane on both sides using a UV cross-linker
(Uvitec).
The membrane was placed between 2 pieces of plastic mesh and put in a
hybridisation bottle. Prehybridisation was carried out in 20 ml of Easy Hyb solution
(Roche) at 42°C for 2 hours. A digoxigenin (DIG) probe prepared earlier was heated
for 10 minutes at 95°C, cooled on ice, and extra Easy Hyb added to a total of 6 ml.
The contents of the hybridisation bottle were removed and the DIG probe solution
added, then left overnight at 42°C in a hybridisation oven to hybridise. The
membrane was washed twice with 2x SSC / 0.1% SDS at room temperature,
followed by two washes in 0.5x SSC / 0.1% SDS at 68°C and one wash in washing
buffer (1x Maleic acid buffer, 0.03% Tween 20). The membrane was then blocked in
blocking buffer (10x block solution in Maleic acid buffer) for 45 minutes at room
temperature with gentle agitation. Once blocked, the membrane was incubated for
60 minutes in fresh blocking buffer with 2.5 µl anti-DIG-alkaline phosphatase
20

added. The antibody solution was removed and the membrane washed twice in 100
ml of washing buffer for 15 minutes, followed by equilibration in 50 ml of CSPD®
(Roche Molecular Biochemicals) detection buffer for 5 minutes. The membrane was
placed in a plastic bag and 0.5 ml of enhanced chemifluorescence (ECF) detection
solution (Amersham Biosciences) carefully dribbled over the entire membrane,
sealed, and incubated for 5 minutes at room temperature. The bag was the sealed and
incubated for 10 minutes at 37°C to develop. The membrane was then scanned on a
Amersham Biosciences STORM 860 phosphoimager.
2.9. METABOLOME FERMENTATIONS AND ANALYSIS BY HIGH PERFORMANCE
LIQUID CHROMATGRAPHY (HPLC)
To determine the metabolic differences that may exist between a laboratory strain
S288C, a commercial wine strain AWRI 838 and a commercial sake strain Kyokai 7
after fermentation, HPLC was used. Briefly, 1 x 10⁶ cells/ml were inoculated in
Synthetic Complete (SC) medium with 80 g/l glucose and grown anaerobically at
28°C at 200 rpm until all glucose was consumed. The yeast were removed by
centrifugation, and the supernatant was stored at -20°C until ready for analysis.
HPLC analysis was carried out using an Agilent 1100 series HPLC system.
Pretreatment of a OA-HY organic acids column (51272, Merck) was done with
polypore organic acid mix (Activon BLPPH-GU). The mobile phase was 0.005 M
H2SO4 using an injection volume of 10 ml; the flow rate was 0.6 ml/min and the
column temperature was 65°C. The flow rate was maintained at 0.6 ml/min and the
21

eluant detected at 214 nm using a photodiode array detector and a refractive index
detector.
2.10. ISOLATING TOTAL PROTEIN EXTRACTS FROM YEAST
This protein extraction protocol is adjusted from Garrels et al. (1994). Yeast cells
were grown in 50 mls of minimal media to 1 x 10⁷ cells/ml and centrifuged to collect
cells. The cells were washed with 10 mls of ice cold Milli-Q water, pelleted, and
resuspended in 150 µl of lysis buffer (20 mM Tris-Cl (pH 7.6), 10 mM sodium
fluoride, 10 mM sodium pyrophosphate, 0.5 mM EDTA, 0.1% deoxycholate)
containing 2µl Protease Inhibitor Cocktail for fungal and yeast cells (AEBSF 100
mM, 1,10-Phenanthroline 500 mM, Pepstatin A 2.2 mM, E-64 1.4 mM; P8215,
Sigma). This mix was then transferred to a 1.5 ml screw cap eppendorf containing
0.28 g of acid-washed glass beads (425-600 micron). This slurry was vortexed for
one minute and then placed on ice for one minute, repeating six times with tubes on
ice between vortexing. The tubes then had a small hole poked in the bottom with a
25g needle, placed on top of a fresh sterile eppendorf tube, and centrifuged for 30
seconds at 4000 rpm to push the protein mix through. 1/10 volume of ice-cold
RNase/DNase mix (0.5 mg/ml DNase 1, 0.25 mg/ml RNase A, 25 mM MgCl2) was
added to each tube, mixed, and placed on ice for 10 minutes. Protein mixes were
stored at 4°C to avoid continual freeze-thaw cycles in the freezer, which may
degrade proteins and give rise to poor quality 2D gels. Protein concentration was
then measured by Bradford assays and checked further on coomassie stained 4-20%
iGel polyacrylamide gels (Gradipore).
22
2.11. TWO-DIMENSIONAL GEL ELECTROPHORESIS (2D GELS) TO IDENTIFY
DIFFERENCES IN YEAST PROTEOMES
2.11.1. Waite Campus Gels
For 2D gel analysis using our own facilities, yeast at 1x10⁷ cells/ml were taken and
the protein extracted as above (adapted from Garrels et al., 1994). 250 µg of protein
was taken and added to a total volume of 350µL with rehydration stock solution (8
M Urea, 2% CHAPS, 0.5% or 2% IPG buffer). First dimension strips of pH 3-10 NL
were used initially, however to separate individual proteins more accurately
(Wildgruber et al., 2000), pH 3.5-4.5, 5-6, 4-7 and 6-11 strips were used. The strips
were then gently caressed over the suspension in 18 cm ‘coffin-like’ wells to absorb
the liquid into the agarose strip and a thin layer of mineral oil added. Programs used
for isoelectric focusing of proteins were dependent on the pH of the strip and are
outlined in Appendix 5. Active rehydration was done at 20°C with 50µA of current
applied per strip.
Once isoelectric focusing was complete, strips were placed in 10 mls of equilibration
buffer (50 mM Tris-Cl (pH 8.8), 6 M urea, 30% glycerol, 2% SDS) containing 10
mg/ml dithiothreitol to enable protein reduction and shaken for 15 minutes at 25
rpm. The strips were then removed and placed in a further 10 mls of equilibration
buffer containing 12.5 mg/ml iodoacetamide for alkylation of proteins. After 15
minutes at 25 rpm, the strips were placed on top of a 12% polyacrylamide gel and
sealed with an agarose overlay. The gels were run in a Hoefer DALT tank
(Amersham Biosciences) at 100 mA each in SDS-PAGE running buffer until the
23

bromophenol blue dye reached the end of the gel. The gels were then either silver
stained according to Heukeshoven and Dernick (1988), colloidal coomassie
(modified from Neuhoff et al., 1988) or SYPRO Ruby® (Bio-Rad) stained.
2.11.2. Australian Proteome Analysis Facility (APAF) 2D gels
The gels produced at APAF were run with modifications to the above protocol. 500
µg of protein sample was added to a total of 150 µl of thiourea/urea rehydration
buffer (2 M thiourea, 7 M Urea, 4% CHAPS (w/v), 1% DTT (w/v), 2% ampholytes
6-11) and cup loaded on pH 6-11 strips (prehydrated overnight in rehydration
buffer). A Pharmacia Biotech Multiphor II system powered by a Consort E752
Microcomputer electrophoresis power supply was used for isoelectric focusing and
run for 31,900 Volthours at 20°C. The following program was used: 100V x 3h,
300V x 3h, 600V x 2h, 1000V x 2h, 2500V x 1h, 5000V x 5h. When the focusing
was complete, the strips were equilibrated in equilibration buffer for 20 minutes and
then placed on top of a 12% polyacrylamide gel. The strips were sealed with 0.5%
agarose with bromophenol blue, and the gels run in a Protean II Multi-Cell
electrophoresis unit maintained at 4°C. The gels were run at 50 mA per gel using a
Bio-Rad PowerPac 3000 until the dye reached the end of the gel. Gels were then
removed and placed into fixative solution (40% methanol, 10% acetic acid) for one
hour, the fixative removed, and replaced with SYPRO Ruby® stain and left
overnight. After destaining three times in destain solution (10% methanol, 7% acetic
acid), the gels were scanned on a Molecular Imager® FX scanner (Molecular
24

Dynamics). To isolate and identify proteins, the gels were placed in colloidal
coomassie solution and left overnight.
2.11.3. Silver Stain
For silver staining (Heukeshoven and Dernick, 1988), the gels were placed in
fixative (40% ethanol, 10% acetic acid) overnight, and following a brief 5 minute
wash, gels were placed in sensitising solution (0.3% sodium thiosulphate
pentahydrate, 30% ethanol, 6.8% sodium acetate) with gentle agitation for 60
minutes. To prepare for the silver stain, gels are thoroughly washed through 6 x 10
minute washes in Milli-Q water and then the silver nitrate solution (0.1% silver
nitrate, 0.05% formaldehyde) added and left for 30 minutes. The gels were then
briefly rinsed with 3x 20 second washes of Milli-Q water, followed by the addition
of developer (3% sodium carbonate, 0.025% formaldehyde) and left until even
protein staining was observed. To stop development, the gels were washed briefly
with Milli-Q water and 1% glycine added.
2.11.4. Colloidal Coomassie Staining
To visualise proteins before extraction and identification, 2D gels were firstly
stained with SYPRO Ruby®, then placed into colloidal coomassie stain (modified
from Neuhoff et al., 1988). Approximately 550 ml of Milli-Q water was placed in a
1 L beaker, warmed in a microwave, and 170 g of ammonium sulfate dissolved until
crystals disappeared completely. 330 ml of methanol was then added very slowly
while stirring. When all traces of ammonium sulfate precipitation had dissipated, 36
25

ml of orthophosphoric acid was added slowly and the solution left stirring for five
minutes. Once cooled to room temperature, 10 ml of coomassie stock solution (10 g
coomassie brilliant blue G-250 in 100 ml of methanol) was added. The colloidal
coomassie stain was left to stir for a short time, but no more than 10 minutes to
reduce colloids combining and precipitating out. The gels were then subjected to this
stain overnight or longer, then rinsed briefly in 1% acetic acid until clear blue spots
were seen with little background interference.
2.12. WESTERN BLOT ANALYSIS
Western blot analysis was carried out as described elsewhere (Sambrook and
Russell, 2001). Total protein extracts were mixed with 5x SDS-PAGE sample
buffer, vortexed, boiled at 100°C for 5 minutes and allowed to cool to room
temperature before loading on the gel. 4-20% gradient Tris-glycine polyacrylamide
gels (Gradipore) were run in SDS-PAGE running buffer at 100 Volts (constant
voltage), 60 mA, until the dye front had run off the end of the gel.
Wet transfer of proteins onto nitrocellulose membrane (BA83, Schleicher and
Schuell) was done using the Bio-Rad Mini Trans-Blot Electrophoretic Transfer Cell
following the manufacturer’s instructions. Immediately after the SDS-PAGE gel had
finished running, the gel was equilibrated in cold Western transfer buffer (25 mM
Tris-base (pH 8.0) 192 mM glycine, 20% (v/v) methanol) for 15 minutes. The fibre
pads (Bio-Rad), filter paper (3MM, Whatman) and nitrocellulose were also soaked
in Western transfer buffer for 15 minutes. The transfer cassette was assembled as
26

described by the manufacturer. Transfer was conducted at 100 Volts (constant
voltage) for 1 hour in Western transfer buffer.
After transfer, the membrane was covered with Ponceau S solution (0.1% (w/v)
Ponceau S, 5% (v/v) acetic acid) for five minutes and rinsed with MilliQ water until
the background was removed to ensure that the proteins had transferred. This is
referred to as “Schiff staining” and ensures that equal amounts of protein have been
loaded (hence not relying purely on absorbance readings of protein concentration,
eg. Bradford assays). The remaining Ponceau S was washed from the membrane
with TBS-T. The membrane was blocked in blocking buffer either overnight at 4°C
or for 2 hours at room temperature, with gentle rocking. This was followed by a
rinse and 4x 10 minute washes in TBS-T. The blot was probed with the primary
antibody using various dilutions in blocking buffer for at least 1 hour at room
temperature. The membrane was then washed with 4x 10 minutes in TBS-T. The
secondary antibody was also diluted in blocking buffer and the membrane was
incubated for at least 1 hour at room temperature. The membrane was then washed
with 2x 10 minutes in TBS-T, followed by 2x 10 minute rinses in MilliQ water.
To develop the blot, the membrane was incubated in the presence of nitro blue
tetrazolium/5-bromo-4-chloro-3-indolyl-phosphate (NBT/BCIP, Promega) in
alkaline phosphate buffer (100 mM Tris-HCl (pH 9.0), 150 mM NaCl, 1 mM
MgCl2) until bands appeared. The membrane was gently blotted with filter paper and
allowed to dry before scanning using a HP ScanJet 6100C/T scanner.
27

2.13. PROTEIN IDENTIFICATION
2.13.1. Matrix-assisted laser desorption ionisation time-of-flight mass spectrometry
(MALDI-TOF)
Proteins of interest were excised with a sterile scalpel and put into either individual
eppendorf tubes or separate wells in a 96-well plate. 120 µL of wash solution (50%
v/v acetonitrile, 25 mM NH4HCO3, pH 7.8) was added and the tube or plate shaken
at 37°C for 10 minutes. The solution was removed, wash solution again added,
shaken, and drained. This was repeated three to four times until no blue colour of the
coomassie stain could be seen in the gel piece, followed by drying in a speedvac for
15 minutes. When dry, 8 µl of sequencing grade trypsin (Promega) at 15 ng/µl in 25
mM NH4HCO3 (pH 7.8) was added to each sample and incubated at 37°C for 16
hours. Extraction of the peptides was achieved by adding 8 µl of extract solution
(10% v/v acetonitrile, 1% TFA v/v trifluoroacetic acid), the plate or tube sonicated
for 20 minutes in a water bath sonicator, and the resultant peptide solution removed
with a sterile pipette tip. Peptides were then purified, concentrated and desalted with
Millipore Zip-Tips, mixed with matrix (8 mg/ml α-cyano-4-hydroxycinnamic acid
in 50% v/v acetonitrile, 1% v/v TFA), and spotted onto a MALDI target. Once air-
dried, samples were analysed with a Micromass® MALDI time of flight
spectrometer. The spectra were acquired in reflectron mode in the mass range 750 to
3500 Da. Peptide masses were searched against Yeast using ProteinProbe® on
MassLynx® and positive identification made based on sequence coverage, number of
missed cleavages, and how well the molecular weight and isoelectric point match to
the original position of the isolated protein from the 2D gel.
28
2.13.2. Tandem Mass Spectrometry (MS/MS)
Proteins to be identified by MS/MS were excised from the gels, washed and tryptic
digested as above. The resulting peptides were purified using a Geloader
microcolumn to concentrate and desalt the sample. The peptides were then analysed
by electrospray ionisation MS/MS using a Micromass® Q-TOF MS. The instrument
was operated in manual nanospray mode, with samples sprayed from borosilicate
capillaries. Data was initially acquired (MS analysis) over the mass-to-charge m/z
range 400-1600 Th to select peptides for MS/MS analysis. After peptides were
selected, the instrument was switched to MS/MS mode and data collected over the
m/z range required by the precursor mass and charge state, with variable collision
energy settings.
2.14. RNA EXTRACTIONS
This procedure was adjusted from Chandler et al. (2004). 100 mls of yeast culture
grown to 1 x 10⁷ cells/ml was collected, washed with ice-cold DEPC-treated water,
and stored at -80°C until ready for extractions. Tubes were then thawed on ice with
the addition of 0.28 g of chilled acid-washed glass beads, 300 µl of RNA buffer (0.5
M sodium chloride, 0.2 M Tris-Cl (pH 7.5), 10 mM EDTA) and 300 µl of
phenol/chloroform/isoamyl alcohol (25:24:1) with brief shaking. Tubes were then
vortexed 3x for 1 minute each, placing on ice between vortexing. After centrifuging
for 2 minutes at 12,000 rpm, the upper aqueous phase was carefully removed from
the protein interface into a new sterile eppendorf tube. 3 volumes of 100% chilled
ethanol were added and placed at –80°C overnight. The following morning the tubes
29

were centrifuged at 4°C at 12,000 rpm for 2 minutes and the supernatant discarded.
The pellet was washed in 100 µl of 70% ethanol, spun down again, and the
supernatant removed with care so as not to dislodge the pellet. After air-drying in a
laminar flow for 10 minutes, the pellet was resuspended in 25 µl of DEPC-treated
water. DNase reaction mix (2.5 µl of 1 M Tris (pH 7.5), 20 µl of 25 mM MgCl2, 2 µl
of RNase-free DNase (10 U/µl), 0.5 µl of RNasin (40 U/µl)) was added, flick mixed,
and incubated at 37°C for 30 minutes. After incubation, 2 µl of 2 M sodium acetate
(pH 4), 50 µl of DEPC-treated water saturated phenol, and 10 µl of
chloroform/isoamyl alcohol (49:1) were added and placed on ice for 10 minutes.
Tubes were then microfuged at 14,000 rpm for 5 minutes and the supernatant
transferred to a fresh tube with the addition of 15 µl 3 M sodium acetate (pH 5) and
1 ml 100% ethanol before mixing and putting tubes at –80°C for 20 minutes. A
pellet was obtained by centrifuging at 14,000 rpm for 10 minutes at 4°C and the
fluid discarded carefully. The pellet was then washed with 70% ethanol, centrifuged,
the supernatant removed and the pellet air-dried. The final pellet was resuspended in
12 µl of DEPC-treated water, with 1 µl visualised on a 1.6% MOPS/formaldehyde
agarose gel, and the concentration determined by spectrophotometry by measuring
the absorbance ratio of 260nm and 280nm (A260/A280).
2.15. CDNA SYNTHESIS
In a 0.2 ml PCR tube, 5µg of total RNA was combined with 1 µl each of gene
specific primers (10 µM), 1µl of 10 mM dNTPs mix, and DEPC-treated water to 10
µl, then incubated at 65°C for 5 minutes. Tubes were placed on ice for 3 minutes to
30

cool, followed by the addition of 10 µl of cDNA synthesis mix (2µl of 10x RT
buffer, 4µl of 25 mM MgCl2, 2µl of 0.1 M DTT, 1µl of RNaseOUTTM (40U/µl), 1µl
of SuperScriptTM III RT (200U/µl)). The 20 µl was gently mixed, collected by brief
centrifugation, and incubated at 50°C for 50 minutes. The reactions were terminated
at 85°C for 5 minutes, chilled on ice, and collected again by centrifugation. 1 µl of
RNase H (10U/µl) was added to each tube and incubated for a further 20 minutes at
37°C. cDNA reactions were then stored at –20°C until ready for PCR.
2.16. REAL-TIME QUANTITATIVE PCR
To compare gene expression between two different samples, real-time quantitative
PCR was utilised. Initially, a standard curve with each primer set was established
using 10-fold dilutions. Real-time PCR reactions contained 1 µl of cDNA sample,
0.6 µl of forward primer (10 µM), 0.6 µl of reverse primer (10 µM), 7.8 µl of sterile
MilliQ water, and 10 µl of 2x SYBR Green PCR mix (AB Gene). Each reaction was
flick mixed, spun down, and placed in a Corbett 4000 quantitative real-time PCR
machine. The reaction times were as follows: 95°C x 15 min; (95°C x 30 sec, 58°C x
30 sec, 72°C x 30 sec) x 40 cycles; 72°C x 5 min; melt curve 50°C to 95°C, 1°C per
5 sec. The melt curve confirms the correct melting temperature (Tm) for one PCR
product. Using the standard curve for each primer set an equation was derived
(based on the equation y=mx+c, where m is the average slope of the curve for each
dilution), with the fold-change in expression between two samples reported.
31

2.17. CONTINUOUS FERMENTATIONS IN THE PRESENCE OF ETHANOL
2.17.1. Yeast strain and media used
Strain BY4742 (MATα his3∆1 leu2∆0 lys2∆0 ura3∆0) from the EUROSCARF
deletion collection was used. Synthetic Complete (SC) media with all amino acids
was used for continuous fermentation.
2.17.2. Continuous fermentation
Steady-state continuous fermentation was carried out using 1.5L Applikon
fermenters (School of Chemical Engineering, University of Adelaide, Australia).
Triplicate fermentations were under the control of the FC4 DOS Software and the
FC-4 controller. Cultures were grown at 28°C and pH 5.0, with stirring at 800 rpm
and sparging sterile air at 0.5L per minute. When the turbidity within the fermenter
was on the increase (eg. cell numbers are increasing), the feed rate of fresh medium
was increased to dilute the turbidity back to its setpoint. When the turbidity of the
culture fell, the feed rate was lowered so that turbidity was restored to its setpoint.
This enabled the cells to achieve a relatively homogeneous population over time at
the same cell phase and cellular state. After 10-14 generations, cells were harvested
and the SC Complete media was changed to SC Complete media supplemented with
6% ethanol (v/v). The dilution rate was maintained at 0.35 h-1 for SC media without
ethanol, while the dilution rate was lowered to 0.08 h-1 with SC 6% (v/v) ethanol-
supplemented media. Cells were harvested again after 10-14 generations, snap-
frozen in an ice-ethanol bath and stored at -800C until ready for RNA isolation.
32

2.18. MICROARRAY ANALYSIS
2.18.1. RNA purification for cDNA microarray analysis
To purify high quality RNA for cDNA synthesis, fluorescent labeling and
microarray analysis, the QIAGEN RNeasy Mini protocol for RNA cleanup was
used. Briefly, total RNA was prepared as normal with some modifications. After the
first air-drying of the nucleic acid pellet, the pellet was resuspended in 100 µl of
RNase-free water. 350 µl of Buffer RLT (QIAGEN) and 250 µl of 100% ethanol
were added and mixed thoroughly. This mix was then added to a RNeasy mini
column (QIAGEN) and centrifuged for 15 seconds at 12,000 rpm, with the flow-
through discarded. 350 µl of Buffer RW1 (QIAGEN) was added to wash the column
and centrifuged for 15 seconds at 12,000 rpm, with the flow through discarded. 10 µl
of DNase 1 (27 Kunitz units) was added to 70 µl of Buffer RDD (QIAGEN),
pipetted directly onto silica-gel membrane, and left at room temperature for 15
minutes. 350 µl of Buffer RW1 (QIAGEN) was then added to the column, followed
by 15 seconds of centrifugation at 12,000 rpm and the flow through again discarded.
The column was transferred to a new collection tube, with two washes with 500 µl
of Buffer RPE (QIAGEN), the column centrifuged and flow through discarded
again. The column was then transferred to a new collection tube, and centrifuged
briefly to remove any contaminating Buffer RPE (QIAGEN). Elution of RNA was
carried out by adding 45 µl of RNase-free water directly onto the membrane in the
column, which was then centrifuged and the eluant collected. A further 45 µl of
RNase-free water was run through the column to increase yield.
33

To reduce the volume of total RNA for cDNA synthesis, the RNA was precipitated
by adding 9 µl of 3 M sodium acetate (pH 5.2) and 180 µl of 100% ethanol. This
mix was incubated at –80°C for 1 hour and pelleted by centrifugation at 12,000 rpm
for 15 minutes at 4°C. The pellet was washed with 70% ethanol, and the pellet air-
dried for an hour. The dried pellet was resuspended in 22 µl of RNase-free water,
with 1 µl used for spectrophotometric measurements (A260/A280 ratio), and 1 µl used
for gel analysis to ensure quality and quantity was high.
2.18.2. Microarray cDNA and dye coupling preparation
For microarray analysis, procedures for cDNA synthesis and dye coupling were as
follows. Total RNA (20 µg) was taken up to a total volume of 20 µl with RNase-free
water. 2 µl of anchored polyT(V)N (2 µg/µl) was added and the mixture incubated at
70°C for 10 minutes, then placed on ice. 6 µl of 5x Superscript II buffer, 2 µl of 0.1
M DTT, 2 µl of Superscript II (200 U/µl) and 0.6 µl of aminoallyl dNTP mix (25
mM dATP, 25 mM dGTP, 25 mM dCTP, 10 mM dTTP, and 15 mM dUTP) were
added, mixed, and incubated at 42°C for 150 minutes. The RNA was hydrolysed by
adding 10 µl of 0.25 M NaOH, 10 µl of 0.5 M EDTA (pH 8) and incubated at 65°C
for 15 minutes. This reaction was neutralised by adding 15 µl of 0.2 M acetic acid.
The resultant cDNA was purified using a QIAquick PCR purification kit. Briefly,
the cDNA mix was mixed with 300 µl of Buffer PB (QIAGEN), then applied to the
QIAGEN column and centrifuged at 6500 rpm for 1 minute. The eluant was re-
passed through the column, followed by washing 2x with 600 µl of Buffer PE
(QIAGEN), with the residual buffer removed by centrifuging again at 6500 rpm for
34

1 minute. The sample was eluted into a clean tube with 90 µl of sterile Milli-Q
water. The purified cDNA was dried under reduced pressure then dissolved in 9 µl
of 0.1 M NaHCO3 (pH 9). The mixture was added to a Cy3 or Cy5 dye, mixed, and
left to incubate at room temperature for one hour in the dark. The labeled cDNA was
mixed with 41 µl of Milli-Q water, then purified using the QIAquick PCR
purification kit as above. The purified labeled cDNA samples appeared purple after
being dried under reduced pressure, indicating a successful synthesis and coupling.
The samples were stored at room temperature in a dark cupboard with alfoil covers.
Labeled cDNA was mixed with 0.7 µl of 25 mg/ml yeast tRNA, 4 µl of 2 mg/ml
polyA and 20 µl of 1 mg/ml Cot-1 DNA. The mix was dried under reduced pressure
then dissolved in 14 µl of formamide and 14 µl of 6.25x SSC. The mixture was
heated to 100°C for 3 minutes, transferred to ice, then 0.2 µl of 10% SDS added
before the solution was applied to the centre of a 50 x 24 mm cover slip. The array
(pre-blocked by incubating in 95°C Milli-Q water for 90 seconds) was lowered onto
the cover slip and incubated at 42°C overnight in a humidified chamber.
Prior to scanning the arrays, the slides were washed for 1 minute in 0.5x SSC with
0.01% SDS, 3 minutes with 0.5x SSC, 3 minutes with 0.06x SSC, and finally rinsed
5x with Milli-Q water. The slides were then dried in a centrifuge at 800 rpm for 5
minutes and scanned immediately using a Genepix 4000 scanner (Axon Instruments,
USA).
35

2.18.3. Data and statistical analysis (bioinformatics)
Microarray images were analysed using the SPOT software (CSIRO Image Analysis
Group, Australia), and results tabulated by the University of Adelaide Microarray
Analysis Group (Ashley Connolly, University of Adelaide). For up-regulated genes,
a region spanning 800 bp upstream of start sites was recovered using the Regulatory
Sequence Analysis Tools (RSAT) database (http://rsat.ulb.ac.be/rsat/). Upstream
sequences were then searched for specific sequence motifs using MATCH at
TRANSFAC (http://www.gene-regulation.com/). The sensitivity cut-off for
detecting consensus sequences was chosen to minimise false positive matches.
2.19. NEAR INFRA-RED SPECTROSCOPY (NIRS)
2.19.1. Anaerobic fermentations
Single gene deletion strains of the parental strain BY4742 (S288C background) were
taken from the deletion collection (EUROSCARF), inoculated in duplicate in 1 ml
of SC medium, and grown to stationary at 28°C. 20 µl of each culture were then
inoculated into 2 ml of SC medium in 96-well plates in duplicate and sealed with a
breathable film. The 96-well plate was then placed in an anaerobic hood and left
non-shaking until each microfermentation reached dryness (no detectable glucose by
Clinitest (anhydrous Benedict's reagent) after 48 hours). Each strain was transferred
to a 1.5 ml eppendorf tube, the yeast removed by centrifugation, and the
supernatants analysed by NIRS.
36

2.19.2. Spectra analysis
The visible (VIS) and NIR spectra (400 - 2500 nm) were acquired with an FOSS-
NIRSystems6500 (Foss NIRSystems, Australia), in transmittance mode and with a 1
mm path length. Samples were temperature equilibrated at 33°C in the instrument
before scanning, as temperature effects need to be accounted for in NIRS calibration
methods. A total of 1050 data points were collected.
2.19.3. Multivariate data analysis
Spectra was exported on NSAS format into The Unscrambler software (CAMO,
Norway) for multivariate analysis. Principal Component Analysis (PCA) is a
mathematical procedure for resolving sets of data into orthogonal components whose
linear combinations approximate the original data to any desired degree of accuracy.
PCA was used to derive the first 20 principal components from the spectral data and
used in further analysis to examine the natural groupings of the samples as well as to
detect outlier samples. Before performing PCA, all the sample spectra were pre-
processed using the second derivative to reduce baseline variation and enhance the
spectral features. In order to visualise the relative distribution of the different yeast
strains, samples were graphically displayed by means of the first pair of components,
the second pair, and the third pair of components.
37

CHAPTER 3
Identifying genome variation in Saccharomyces cerevisiae strains
3.1. INTRODUCTION
Saccharomyces cerevisiae wine yeast strains have been selected over thousands of
years of winemaking for properties that include fast growth in high-sugar grape
juices, high yield and tolerance to ethanol and, more recently, the biosynthesis of
flavour and aroma compounds at concentrations beneficial for wine quality.
However, few of the genes that contribute to these important properties have been
elucidated. The identification of DNA sequences that are unique and characteristic to
wine strains may provide an insight into the genetic basis for these phenotypes.
Ultimately, this will provide increased knowledge of how wine strains are able to
undergo grape juice fermentation.
The budding yeast Saccharomyces cerevisiae S288C was the first eukaryote to have
its genome completely sequenced (Cherry et al., 1997). The publishing of the S288C
genome has promoted a great deal of research with this organism with regards to its
life cycle, mating abilities, genome evolution and gene expression. It has been
shown that considerable genetic variation exists between the genome of S288C and
commercial strains of S. cerevisiae (Azumi and Goto-Yamamoto, 2001; Bidenne et
al., 1992; Carlson and Botstein, 1983; de Barros Lopes et al., 1999; Hauser et al.,
2001; Perez-Ortin et al., 2002; Winzeler et al., 1999). In this chapter, the sequenced
38

strain S288C is compared with commercial strains of Saccharomyces cerevisiae
using amplified fragment length polymorphism (AFLP). Using this technique, in
combination with silver-stained gels for the isolation of polymorphic fragments in
commercial strains, it is envisaged that novel sequences within commercial strains
will be isolated and identified. These polymorphic sequences can then be
investigated further for their possible role in providing the ‘wine strain phenotype’.
3.2. RESULTS
3.2.1. Phenotypic differences exist between strains
Using fluorescent AFLP, it has been shown that commercial wine strains are
genetically similar to each other, yet distinct from other commercial strains (Azumi
and Goto-Yamamoto, 2001; Heinrich et al., 2005). Figure 2 shows the grouping of
commercial strains with similar phenotypic properties (eg. high ethanol tolerance,
the ability to consume high amounts of sugar), as well as the grouping of commonly-
used laboratory strains that do not have these attributes of commercial strains.
To demonstrate further that the phenotype exhibited by wine strains is related to
genotype, plate assays with wine strains and the laboratory strain S288C were
conducted. Figure 3 shows two commercial strains used in the AFLP study (3.2.2)
are more tolerant than S288C to high concentrations of glucose and ethanol using a
simple plate assay using SC medium with 200 g/l glucose and 10% (v/v) ethanol.
This may reflect the environment from where these wine strains were isolated, such
as high sugar grape juices (Fleet and Heard, 1993). It is noted these plate assays are
39

Factor 2 Factor 1
Fact
or 3
Figure 2: Principle component analysis (PCA) plot of S. cerevisiae laboratory and
commercial strains. The PCA plot summarises the number of polymorphic
sequences between strains based on pairwise correlation coefficients calculated from
the presence-absence matrix of AFLP bands. The first three PCA axes are presented,
as these were the only axes with eigen values over 1.
40

41
(A)
S288C
AWRI 1116
AWRI 838
10-1 10-2 10-3 10-4
AWRI 1116
AWRI 838
10-1 10-2 10-3 10-4
S288C
(B)
(C) 10-1 10-2 10-3 10-4
S288C
AWRI 838
AWRI 1116
Figure 3: Demonstration of the higher stress tolerance of wine strains AWRI 838
and AWRI 1116 to growth on SC medium containing (A) 200 g/l glucose and (B)
10% (v/v) ethanol. A control plate (C) has been shown which contains 20 g/l glucose
and 0% (v/v) ethanol. Cultures were plated in 10-fold serial dilutions at exponential
phase (1 x 10⁷ cells/ml) and plates incubated overnight at 28ºC.
not a true representation of the wine environment, however they provide an
indication of the phenotypic properties of a wine strain. The phenotypic differences
that exist between the wine and laboratory strains in this study do reflect the widely
recognised dogma for the phenotypic differences between these strains and provided
confidence to proceed with a comparative genomics approach using AFLP to isolate
and identify genes specific to wine yeast strains.
3.2.2. AFLP reveals novel sequences in wine strains.
AFLP was used in an attempt to identify key genetic elements in commercial wine
strains that give rise to their unique properties. Using a combination of oligo primer
sets (Appendix 2), a total of 27 polymorphic bands were isolated from silver-stained
gels. The results of subsequent sequencing (Appendix 4) and probing against the
Saccharomyces Genome Database (SGD) can be seen in Table 1. It should be noted
that commercial wine strain sequences are not publically available like the
laboratory strain S288C. Nineteen sequences had between 95% and 100% identity to
the corresponding sequences in S288C, which indicates that a polymorphism has
occurred at the restriction site in order to visualise these bands as putative novel
sequences. Eight bands had less than 95% identity to the S288C sequences, with
several of these investigated further. Fragments 1116-1, -2, -3, -4, and 939-1
(Appendix 4) were chosen for further studies based on their reduced homology to
sequences in the S288C database.
42

Table 1: Sequence similarity between fragments isolated by AFLP in commercial
strains and the Saccharomyces Genome Database (SGD).
Fragment number Yeast % similarity to SGD
Homologous gene name
838-1 AWRI 838 95% 5’ of APC11 838-2 AWRI 838 99% YIL121W
939-1 AWRI 939 60% 3’ of CDH1
939-2 AWRI 939 97% HOS3
939-3 AWRI 939 97% YGR237C
939-4 AWRI 939 98% 5’ of YAL064W-B
939-5 AWRI 939 100% YPR158W
939-6 AWRI 939 100% PIF1
1017-1 AWRI 1017 90% YML125C
1017-2 AWRI 1017 96% 5’ of MAK10
1017-3 AWRI 1017 97% YKL187C
1017-4 AWRI 1017 97% 3’ of YPS7
1017-5 AWRI 1017 98% CDC4
1017-6 AWRI 1017 98% TAF14
1017-7 AWRI 1017 98% SPT6
1017-8 AWRI 1017 99% CCT5
1017-9 AWRI 1017 99% PCM1
1017-10 AWRI 1017 100% 3’ of YDL218W
1116-1 AWRI 1116 77% KIN1
1116-2 AWRI 1116 79% YGR131W
1116-3 AWRI 1116 79% YIL137C
1116-4 AWRI 1116 85% UGP1 1116-5 AWRI 1116 85% YMR310C 1116-6 AWRI 1116 86% 5’ of YOX1 1116-7 AWRI 1116 98% CNE1 1116-8 AWRI 1116 98% YGR043C 1116-9 AWRI 1116 98% 5’ of SOD2
43

To determine the origin of these sequences and confirm the presence of the sequence
in other yeast, primers specific to the sequences of interest were used to probe the
original yeast from which they were isolated, as well as other sensu stricto yeast.
The PCR results indicate that 1116-2 and 939-1 are present in two wine strains
AWRI 1116 and AWRI 939 respectively (Figure 4). An interesting observation from
the PCR results was the amplification of the 1116-2 sequence in the newly described
sensu stricto species Saccharomyces kudriavzevii (Naumov et al., 2000). Previous
studies using fluorescent AFLP as a molecular typing technique suggest that AWRI
1116 is an S. cerevisiae strain (de Barros Lopes et al., 1999). The results in this
study imply that AWRI 1116 is a S. cerevisiae / S. kudriavzevii hybrid yeast. To
examine this possibility, further sequence surrounding 1116-2 upstream and
downstream was obtained using vectorette PCR.
The 1116-2 sequence was extended upstream and downstream to a total of 911 bp,
which incorporated 340 bp of upstream sequence, a 525 bp open reading frame, and
46 bp of downstream sequence (Figure 5). The 911 bp sequence was then probed
against all available databases to check for homologous sequences, with the results
showing a 100% identity match to an S. kudriavzevii contig sequence (Washington
University Genome Sequencing Centre (WUGSC) database; Cliften et al., 2001). To
determine the origin and presence of this S. kudriavzevii sequence isolated from
AWRI 1116, Southern analysis was used. Using a variety of yeast strains, genomic
DNA was prepared from each yeast, digested with a restriction enzyme (EcoR1 or
HindIII), the resultant fragments run on a gel and hybridised to a nylon membrane.
44
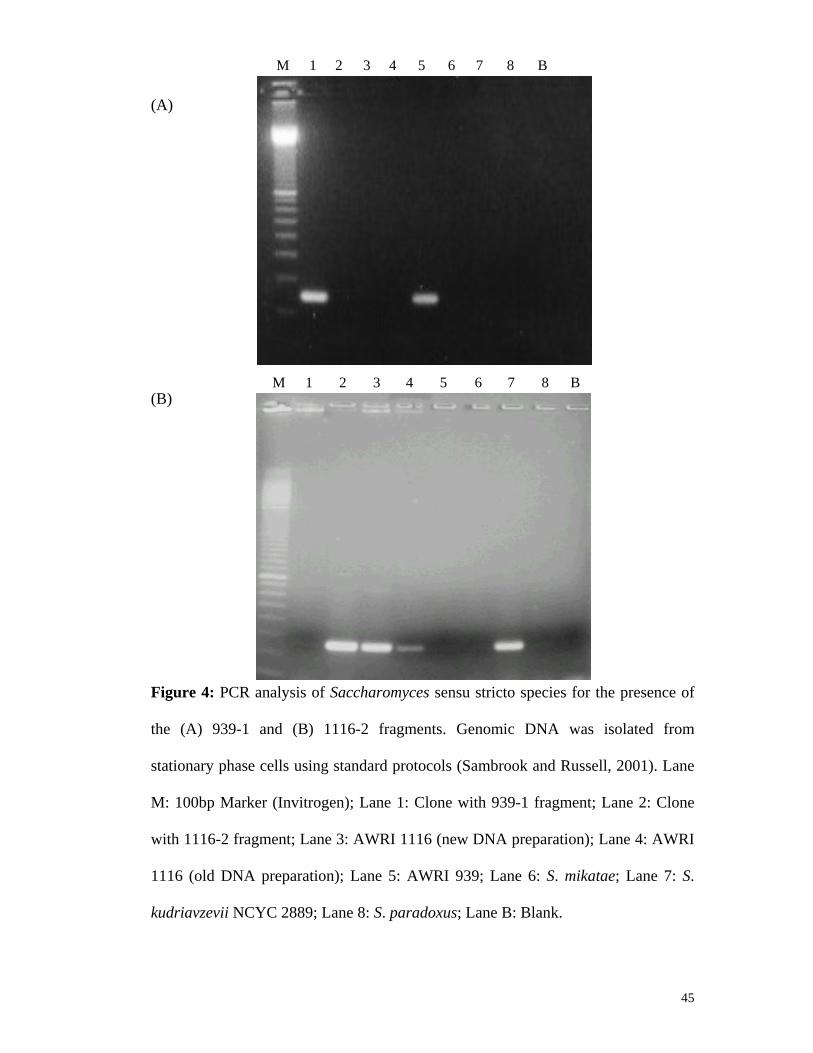
M 1 32 4 5 6 7 8 B
(A)
M 1 32 4 5 6 7 8 B
(B)
Figure 4: PCR analysis of Saccharomyces sensu stricto species for the presence of
the (A) 939-1 and (B) 1116-2 fragments. Genomic DNA was isolated from
stationary phase cells using standard protocols (Sambrook and Russell, 2001). Lane
M: 100bp Marker (Invitrogen); Lane 1: Clone with 939-1 fragment; Lane 2: Clone
with 1116-2 fragment; Lane 3: AWRI 1116 (new DNA preparation); Lane 4: AWRI
1116 (old DNA preparation); Lane 5: AWRI 939; Lane 6: S. mikatae; Lane 7: S.
kudriavzevii NCYC 2889; Lane 8: S. paradoxus; Lane B: Blank.
45

5' GTCGGTGATCAGTGCCGCTAAAATATTGCGCATGTGTTTTCAAGGATTTTTAGCCTTTTACGAACAATTTGGCGGCAGGCCGTTTAGAATCTGTTGAAGATTCCTTTTACGAATGACAAAGCTGTGTGTCAGCCAAGCGGCCCAAAAGCAAGATCTGTATTGCGCCTAGGGTGTAGATAGATATAAGATCAAAATTATTGAATACATATCAGTATAAACTTGTAGTAGTTTGTGTTAATTCTTATTCGTGTAATGAGAGTAAGTGAAAAGAGACTATCAGGCTTTTGGAAGACTTTGTATTCACACAATCGCGATAATAACAATTAAATAACAACAATATATGTTATCTGCTGCAGACAACCTAATACGCATTGTGAGCGCTGTTTTCCTCATCATATCGATAGGCCTAATCGGCGGCTTGATGGACACACAAACAAACGGTAGTTCCCGAGTGAACTTTTGTATGTTTGCCGCGGCTTACGGTCTAATCACTGATTCATTTTACGGGTTTTTGGCAAATTTTTGGTCATCGTTAACATATCCGGCAATTTTGCTTGTTCTGGATTTTCTAAATTTTCTATTTACGTTTGCAGCAGCTACTGCTTTAGCCGTCGGTATAAGATGCCATTCGTGCAAAAACAAAACTTACCTGGAGCAGAATAACATCACTCAAGGTTCAAGTTCCAGATGTCATCAATCACAAGCTGCTGTAGCATTTTTCTATTTTTCCTGTTTCCTGTTTCTGATTAAAGTGACGGTTTCGGTAGCTGGTATGATGCAAAATGGCGGATTTGGCTTTAATACCGGTTACGGTAGAAGAAGGGCAAGAAGACAGATGGGAGTGCCCACCATTTCTCAAGTTTAGGTCAGCCAGGTCAAACGAAAGGCGCTCGGTATTTGAAGGAAAGGAC 3’
Figure 5: Extended sequence of fragment 1116-2 using vectorette PCR. This
sequence includes the promoter region (340 bp), an open reading frame (525 bp,
shown in blue), and downstream sequence (46 bp). The 1116-2 fragment isolated by
AFLP is underlined.
46

A DIG (digoxigenin)-labelled DNA Molecular Weight Marker VII (Roche) was
used. A DIG probe of the 1116-2 fragment from AWRI 1116 (Table 1) was
prepared, hybridised to the membrane, and detected using a chemiluminescent assay.
The results in Figure 6 show the 1116-2 fragment was present in AWRI 1116, S.
kudriavzevii NCYC 2889, and the tri-brid CID1 (Groth et al., 1999). The size of this
fragment is approx 2600bp, which is close to the expected band size from theortical
EcoR1 restriction digests of upstream and downstream sequence of AWRI 1116-2 in
S. kudriavzevii of 2593bp. However, this fragment was not present in UVAFERM
CEG (Lallemand). This was an unexpected result, as AWRI 1116 is thought to be
the progenitor strain of UVAFERM CEG (Manfred Grossman, personal
communication). To check the similarity of AWRI 1116 and UVAFERM CEG, and
to determine if genome rearrangement of UVAFERM CEG had taken place, the
genetic composition of these strains was examined further.
3.2.3. Confirming AWRI 1116 is a progenitor strain of UVAFERM CEG
The possibility of a commercial winemaking strain being a naturally occurring
hybrid is of great interest for the wine industry and for ecological yeast research.
Although UVAFERM CEG was not used in the initial AFLP screen for novel genes,
this strain was expected to have the 1116-2 sequence and be genetically similar to
AWRI 1116, as both arise from the Epernay region in France and have been listed as
Epernay 2 (Manfred Grossman, personal communication). To test if the gene
containing the 1116-2 fragment had undergone horizontal gene transfer, primers
were targeted to amplify sequences in genes on both sides of the 1116-2 fragment, as
47

UV
AFE
RM
CEG
NC
YC
288
9
AW
RI 1
353
AW
RI 1
116
AW
RI 1
017
Mar
ker V
II
AW
RI 9
39
AW
RI 7
96
AW
RI 7
29
AW
RI 8
38
BR
YC
32
N17
-78a
YJM
789
CB
S395
S288
C
CID
1
T73
8576bp
6106bp7427bp
4899bp 3639bp
2799bp 1953bp1882bp 1515bp
1164bp1482bp
992bp
Figure 6: Southern analysis of genomic DNA from several Saccharomyces strains for
the presence of the 1116-2 fragment. A digoxigenin probe of the 1116-2 fragment was
hybridised to EcoR1 restriction enzyme digested genomic DNA, followed by
hybridisation of an anti-DIG-alkaline phosphatase secondary antibody. The marker is
DIG-labelled DNA Molecular Weight Marker VII (Roche). The chemiluminescence
after development was scanned by a STORM 860 phosphoimager.
48

well as primers at the ends of Chromosome XII and Chromosome III (each
homologous to genes either side of the 1116-2 S. kudriavzevii open reading frame).
If only S. kudriavzevii sequences amplify in AWRI 1116, there may be a single
horizontal gene transfer. If both S. kudriavzevii and S. cerevisiae sequences above
amplify, it is more likely to be a hybrid strain of the two species. All sequences were
amplified in both AWRI 1116 and UVAFERM CEG, hinting that these strains were
hybrids with two sets of chromosomes: S. cerevisiae and S. kudriavzevii. To ensure
we are dealing with a single strain, UVAFERM CEG was colony purified. PCR
using 1116-2 fragment specific primers and internal transcribed spacer restriction
fragment length polymorphism (ITS RFLP) were performed on these colonies. ITS
RFLP is able to distinguish between Saccharomyces species based on restriction
enzyme sites in the ITS region. Restriction digest fragments are run on an agarose
gel, with each Saccharomyces sensu stricto species having a distinct banding pattern
(Figure 7). Interestingly, the ITS RFLP results of UVAFERM CEG colonies show
there are two distinct patterns – one with a predominant S. cerevisiae pattern and
less intense S. kudriavzevii pattern (CEGSc), the other with a predominant S.
kudriavzevii pattern and less intense S. cerevisiae pattern (CEGSk). Although the
non-quantitative nature of PCR is recognised, these two patterns were consistently
obtained. PCR using 1116-2 fragment specific primers indicated the colonies with
the CEGSk ITS RFLP pattern were positive for fragment 1116-2, whereas the
colonies with the CEGSc pattern were 1116-2 negative.
49
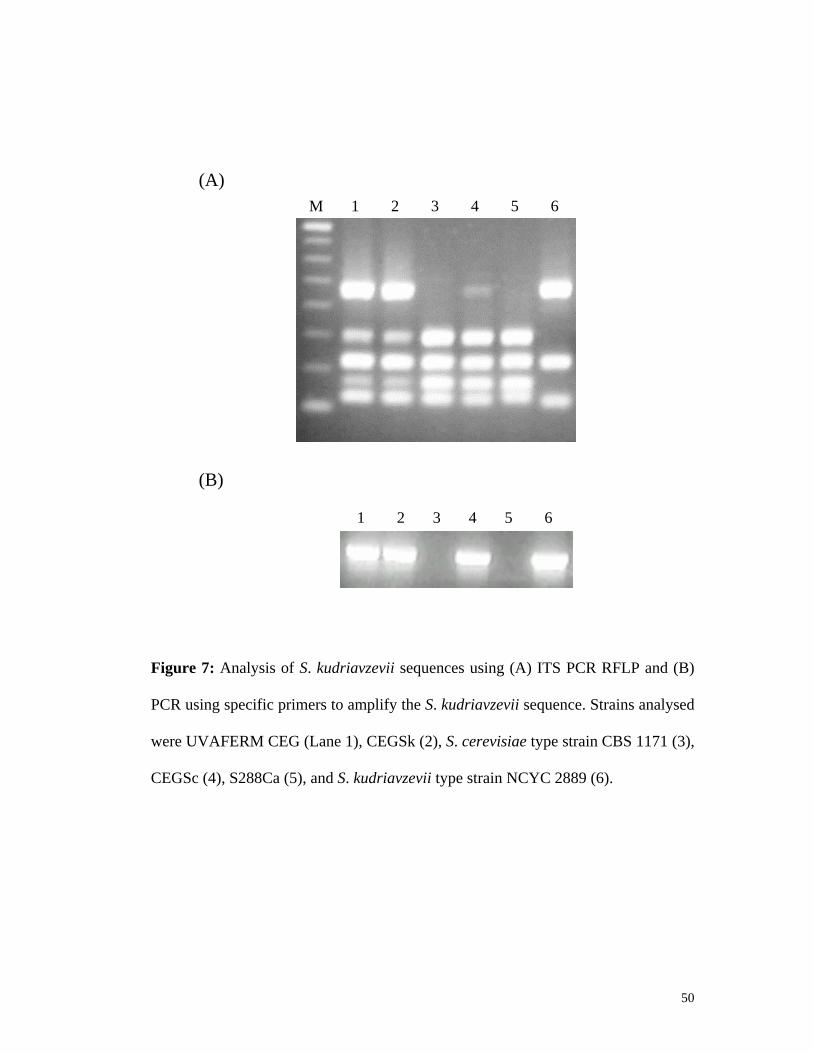
(A)
1 2 3 4 5 6
M 1 2 3 4 5 6
(B)
Figure 7: Analysis of S. kudriavzevii sequences using (A) ITS PCR RFLP and (B)
PCR using specific primers to amplify the S. kudriavzevii sequence. Strains analysed
were UVAFERM CEG (Lane 1), CEGSk (2), S. cerevisiae type strain CBS 1171 (3),
CEGSc (4), S288Ca (5), and S. kudriavzevii type strain NCYC 2889 (6).
50

The hybrid nature of strain AWRI 1116 was not perceived in the initial AFLP
experiments. To study this further, AFLP patterns of AWRI 1116, the UVAFERM
CEG colonies, S. kudriavzevii and S. cerevisiae strains were compared. The results
indicate that AWRI 1116 and the UVAFERM CEG isolates produce most of the
AFLP fragments generated by other S. cerevisiae strains (Figure 8), suggesting that
they possess most or all of the S. cerevisiae genome. The AFLP fingerprints of
AWRI 1116 and the colonies with the CEGSk pattern also possess distinct fragments
that are consistent with these DNAs being derived from S. kudriavzevii. This
amounts to approximately 10% of the amplified bands in AWRI 1116 and the
CEGSk pattern colonies. The results indicate that these yeast are unequal hybrids
between the two related Saccharomyces sensu stricto species, although it is not
possible to determine exactly how much of the genome is derived from each yeast as
these species share many AFLP fragments (de Barros Lopes et al., 2002). The AFLP
fragments amplified in the CEGSc pattern colonies were a subset of the AWRI 1116
and UVAFERM CEG fingerprints, with the S. kudriavzevii specific fragments
absent. Therefore, although this yeast does possess S. kudriavzevii DNA as
demonstrated by the rDNA ITS analysis, the CEGSc colonies may have lost a
greater part of this second genome. It could also be suggested that CEGSc colonies
have undergone loss of the repeats in the rDNA ITS region, as loss of ribosomal
RNA genes is not uncommon in species hybrids (Casaregola et al., 2001).
51

Figure 8: AFLP electropherogram of S. cerevisiae type strain S288Ca (blue), S.
kudriavzevii type strain NCYC 2889 (red), AWRI 1116 (green), CEGSc (pink) and
CEGSk (black). AFLP was performed as per Materials and Methods section 2.2,
with fragments analysed using the GeneScan® Analysis Software (Applied
Biosystems).
52

3.3. DISCUSSION
The physiological variability between industrial strains and the sequenced laboratory
yeast is evident. These traits include the ability to undergo grape juice fermentation,
increased stress resistance, the synthesis of distinct metabolites, and homothallism.
The genetic basis for these altered phenotypes include translocations that lead to
altered gene expression and chimeric proteins (Perez-Ortin et al., 2002), the
presence or absence of telomeric repeated genes, including several sugar utilisation
loci (Carlson et al., 1981; Michels et al., 1992; Pretorius et al., 1986) and the RTM
(resistance to the toxicity of molasses) genes (Ness and Aigle, 1995) and single
nucleotide changes, such as in the HO gene (Meiron et al., 1995). Generally,
however, the genetic basis for the phenotypic variation that exists between S.
cerevisiae strains remains to be established. Comparison of the known sequence of
S288C with that of strains from different habitats may make it possible to search for
adaptation by querying the genome directly. Winzeler et al., (1998) have used DNA
microarrays to identify genes that are missing or present at higher or lower copy
number in the clinical isolate strain YJM789. Using this method the authors were
able to show that deletion of PDR5, a multi-drug resistance gene, was responsible
for cyclohexamide sensitivity in strain YJM789. Genome and transcriptome
comparisons between a laboratory strain and a commercial wine yeast have also
been made (Hauser et al., 2001). In addition, Cavalieri et al. (2000) have
demonstrated allelic variation between vineyard isolate populations using genome-
wide transcriptional profiling. Unfortunately, the use of microarrays is limited to the
study of already identified sequences. The finding that almost 1% of the
53

approximately 6200 genes in a laboratory strain are missing from the clinical isolate
(Winzeler et al., 1999), and the reduced complexity of the AFLP fingerprint of the
sequenced laboratory strains compared to several of the other strains studied,
indicates that more S. cerevisiae genes remain to be identified.
Using AFLP as a measure of genetic variability between S. cerevisiae strains, it was
found that the commercial wine strains and natural isolates exhibited genetic
differences to S288C. It was assumed that, given the small genome size of S.
cerevisiae and the large percentage of coding DNA, characterising the variable
AFLP fragments would be useful for identifying novel genes in unsequenced
industrial strains. Of the 27 different sequences identified in this study, 19 are
similar to regions of known S. cerevisiae ORFs. Five of the 27 fragments show
substantial nucleic acid sequence variation (between 77% and 85% similarity) to
known ORFs posted on the SGD, while a sequence isolated from AWRI 939 shows
little homology to S. cerevisiae (60%). These sequences appear to have distinct
origins. Fragments 1116-2, 1116-3, 1116-5 and 1116-6 are identical to sequences in
S. kudriavzevii and were most likely acquired by horizontal gene transfer.
Allopolyploidy in Saccharomyces sensu stricto species has been previously
described (de Barros Lopes et al., 2002; Delneri et al., 2003; Masneuf et al., 1998;
Nguyen et al., 2000). For example, lager brewing strains, generally referred to as
Saccharomyces pastorianus or Saccharomyces carlsbergensis, are hybrids between
S. cerevisiae and a Saccharomyces bayanus-like yeast. In addition, a cider yeast has
been shown to possess DNA from three species: S. cerevisiae, S. bayanus and S.
54

kudriavzevii (de Barros Lopes et al., 2002; Groth et al., 1999). While a hybrid wine
yeast has also been described previously (Masneuf et al., 1998), this is the first
reported example of a wine yeast possessing S. kudriavzevii DNA. Also, unlike the
other hybrids studied to date, only a minor fraction of non-S. cerevisiae DNA is
present in AWRI 1116, so the initial hybrid seems to have undergone extensive
DNA loss. The commercial wine yeast UVAFERM CEG, believed to be derived
from AWRI 1116, is a mixture of at least two strains, one very similar to AWRI
1116 and a second that has undergone further loss of S. kudriavzevii DNA.
Two fragments, also isolated from strain AWRI 1116, show 77% and 85% sequence
similarity to regions in the KIN1 and UGP1 genes respectively. The UGP1 gene
(UDP-glucose pyrophosphorylase) is involved in both glucose metabolism and
protein glycosylation, where it is thought to be essential for the proper formation of
the cell wall. The KIN1 gene encodes a protein kinase of unspecified function (Lamb
et al., 1991). Whereas the predicted amino acid sequence of the UGP1 fragment is
similar to the sequence in the laboratory strain (96% identity), the KIN1 homologue
shows only 79% sequence identity. Unlike the S. kudriavzevii fragments described
above, these sequences do not show identity to other Saccharomyces sensu stricto
sequences, and therefore their derivation remains unknown. One possibility is that
they originate by gene duplication and sequence divergence. Not only have specific
genes, especially in subtelomere regions, been shown to be duplicated, the
sequencing of the S. cerevisiae genome has provided evidence for an ancient
autopolyploidy event that has resulted in approximately 13% gene duplication in the
55
sequenced laboratory strain (Wolfe and Shields, 1997). Interestingly, both the
fragments showed slightly higher similarity to the S. bayanus KIN1 and UGP1
homologues than to the S. cerevisiae genes, thereby suggesting a common ancestor
or preceding mating event between these two strains. Alternatively, the fragments
are derived from an as yet uncharacterised species.
Although strain AWRI 939 produces an AFLP fingerprint that is the most different
to S288C, the polymorphic fragments sequenced from this yeast were generally very
similar to the sequenced yeast (97-100%). One of the fragments, however, showed
only 60% similarity to a non-coding region in S288C. Although not characterised
further, it is clear that sequence disparity in non-coding regions could alter gene
expression and by doing so, modify the properties of particular strains.
In yeast, laboratory strains may not require loci that are needed for success in other
habitats where adaptive mechanisms to environmental changes are necessary and
competition with other species for resources is prevalent. Mechanisms of adaptation
to different environments involve the expansion and contraction of the genome,
potentially by either gene duplication or hybridisation. Following gene duplication,
one of the gene copies is freed from stabilizing selection, creating the potential for
evolution of a new function (Ohno, 1970). DNA alterations can influence either the
protein activity or its expression. Similarly, allopolyploidy, which is widespread in
plants and vertebrates, is predicted to improve adaptability under selective
56
conditions (Matzke et al., 1999). The variability in hybrid genomes caused by DNA
instability enhances the genetic diversity.
3.4. CONCLUSION
The genome sequence of several eukaryotic organisms, including S. cerevisiae,
Giardia lamblii, Arabidopsis thaliana, Drosophila melanogaster, Caenorhabditis
elegans and humans has been completed or is close to completion. One of the
challenges in genome research is to relate the phenotypic variation that exists within
a species to genetic variation. In this study, AFLP was used to determine the genetic
diversity that exists between strains of S. cerevisiae. Isolating and sequencing
polymorphic AFLP fragments has proven useful in identifying sequences not present
in laboratory strains. Furthermore, AFLP has been used to further classify a
commercial winemaking strain as a hybrid between S. cerevisiae and a recently
classified species S. kudriavzevii (Naumov et al., 2000). At this stage, it is not clear
whether these hybrids have advantageous winemaking properties. Studying the
consequences of these genome changes will be useful for further understanding
genotype-phenotype relationships.
57

CHAPTER 4
Comparative proteomics: Identifying differentially expressed proteins between
two Saccharomyces cerevisiae strains
4.1. INTRODUCTION
Extensive phenotypic variation can exist between individuals of a single species.
Elucidating the genetic basis for this variation, especially in the post genome era, has
received considerable attention in view of its importance in a broad range of
objectives including predicting human disease, defining biodiversity and improving
agricultural yield. There is clear evidence that differences exist in the genome of
winemaking strains compared to other strains of S. cerevisiae (Azumi and Goto-
Yamamoto, 2001; Carlson and Botstein, 1983; de Barros Lopes et al., 1999; de
Barros Lopes et al., 2002; Hauser et al., 2001; Heinrich et al., 2005; Perez-Ortin et
al., 2002), however, how this relates to the phenotype and physiological processes
within the cell is unclear.
As described in Chapter 3, there are many genome differences between laboratory
and commercial strains, but determining the role or function of these sequences is
difficult. The DNA comparisons do provide evidence that novel sequences exist in
wine strains. To determine whether such sequences translate to changes in protein
expression, or the synthesis of novel or modified proteins, a comparative proteome
58

approach was taken. There have been initial explorations by many groups to define
the proteome of yeast under defined environmental conditions. These studies have
lead to the construction of a two-dimensional polyacrylamide gel (2D gel) protein
database of S. cerevisiae (Boucherie et al., 1996), the protein expression response of
yeast subjected to environmental stresses (Akhtar et al., 1997; Hu et al., 2003;
Norbeck and Blomberg, 1996), and a comparison between a hybrid lager strain and
its parental species (Joubert et al., 2000; Joubert et al., 2001). More recently, the
proteome of an indigenous wine strain has been reported (Trabalzini et al., 2003a),
as well as the adaptive response of the same wine strain to glucose exhaustion in the
surrounding medium (Trabalzini et al., 2003b).
In this study, a proteomic approach was taken to compare protein expression
between laboratory and commercial strains of S. cerevisiae. It was expected that
such an approach would identify differences in post-translational modification and
proteins not present in the sequenced laboratory strain. By using an exploratory
comparative proteomics approach, we hoped to begin to gain an insight into which
factors play an important role in defining wine strain phenotypes. If this approach is
successful, multiple wine strains could be compared and the persistent differences
selected, thereby identifying wine strain-specific proteins. Furthermore, the proteins
expressed in each strain after an ethanol stress were investigated. Ethanol produced
during fermentation does not have the same impact on wine strains in terms of
growth as it does in laboratory strains. It is anticipated that wine strains have
evolved over time to catabolise the high sugar and tolerate the high ethanol
59

encountered during grape juice fermentation. This ability is even more important
now as Australian winemakers are inclined to leave grapes on the vine longer to
produce highly flavoured, ‘fruit-driven’ wines. A consequence of this increased
ripening is grapes with elevated sugar levels, which generally result in higher
ethanol wines after fermentation. Therefore, to focus on ethanol as an environmental
stress encountered in grape juice fermentation, the proteomic response of laboratory
and wine strains exposed to an ethanol stress will be compared.
4.2. RESULTS
4.2.1. Phenotypic differences demonstrate genetic variation in wine strains
4.2.1.1. Plate Assays – tolerance plates
To demonstrate the greater ability of wine strains to cope with certain environmental
stresses compared to laboratory strains, plate-based stress assays were performed.
Important parameters that are synonymous with wine yeast in their particular
environment were chosen, such as temperature extremes, osmotic stress and ethanol
stress.
To investigate growth ability at different temperatures, agar plates with serial
dilutions of each strain were incubated at temperatures between 4ºC and 40ºC. The
results showed no differences in growth between strains (data not shown). To show
the ability of wine strains to withstand a high concentration of glucose, SC medium
plates containing between 100 g/l and 500 g/l glucose were used. Figure 3 shows
that at the highest dilution wine strains are able to grow, whereas the laboratory
60

strain S288C was unable to grow. No strains were able to grow at the highest
glucose concentration (500 g/l). Nevertheless, S288C was able to grow in the
presence of 200 g/l sugar with lower dilutions. This result was surprising as it has
been hypothesized that many laboratory strains cannot undergo grape juice
fermentation due to the high concentration of sugar at the beginning of fermentation
(Fleet and Heard, 1993). However, the strains show clear growth differences when
exposed to ethanol. Upon increasing the ethanol concentration from 2.5% to 12.5%
(v/v) in SC medium agar plates, AWRI 838 and a sake strain, Kyokai 7, used due to
its predicted ability to withstand a high concentration of ethanol in sake mash, were
more tolerant to ethanol than the laboratory strain S288C (Figure 9). Therefore, from
these plate assay results, ethanol was chosen as the environmental stress to study
using a comparative proteomics approach.
4.2.1.2. Metabolic differences exist between laboratory and commercial strains
Wine strains have been used in grape juice fermentation over thousands of years for
their favourable properties, including the production of aroma and flavour
compounds consistent with wine. Other strains have been tested in winemaking,
however they do not derive the same metabolic profile that winemakers and
consumers alike would prefer (Fleet and Heard, 1993). To characterise some of these
metabolic differences between the wine and non-wine strains used in this study, the
supernatant from small-scale fermentations of SC medium (80 g/l glucose) was
analysed with high performance liquid chromatography (HPLC). Each strain was
able to ferment all available glucose (unlike if more wine-like conditions were used
61

(A)
(B)
S288C
Kyokai 7
AWRI 838
10-1 10-2 10-3
S288C
Kyokai 7
10-1 10-2 10-3 10-4
AWRI 838
10-4
Figure 9: Comparison of ethanol tolerance displayed by different strains using SC
medium agar plates containing (A) 2.5% (v/v) ethanol and (B) 12.5% (v/v) ethanol.
Both the 0% (v/v) and 2.5% (v/v) ethanol plates displayed similar growth patterns
for all yeast. Serial dilutions of each culture at mid-exponential phase (1 x 10⁷
cells/ml) were spotted and incubated overnight at 28ºC.
62

as laboratory strains cannot ferment 200 g/l glucose) and produce a range of organic
acids and wine-related compounds (Figure 10).
One of the more noticeable wine-related results is the lower production of acetic
acid by the wine and sake strains. Although there are larger quantitative differences
in other metabolomic compounds, acetic acid is a particularly unfavourable aroma
attribute in wine in high concentrations and has generally accepted maximum limits
in practice of approximately 0.8 g/l and a legal maximum limit of 1.5 g/l (Rankine,
1989). Glycerol is also an important wine component with respect to mouth-feel, and
is present in higher concentrations in the metabolome of both wine and sake strains.
The HPLC profile also showed that the wine and sake strains did not appear to
produce as many organic acids (tartaric acid, lactic acid, malic acid) as the
laboratory strain. It is possible that the organic acids in wine strains are metabolised
further and therefore are not detectable in this study. This is only a preliminary
observation based on the organic acids present at high enough concentrations to be
able to measure. Overall, these results suggest that wine strains have a set of novel
genes or expression patterns that contribute to these differences in metabolic profile.
It will be important to elucidate the genetic basis for these strain-specific differences
in order to understand how the wine strain genotype relates to its phenotype.
63

(A)
Organic acid profile of 80 g/l fermentations using HPLC
0.00
0.10
0.20
0.30
0.40
0.50
0.60
Citric Acid Tartaric Acid Malic Acid Succinic Acid
Con
cent
ratio
n (g
/l)S288CAWRI 838Kyokai 7
(B)
Wine-related compounds in 80 g/l fermentations using HPLC
0.00
2.00
4.00
6.00
8.00
10.00
12.00
Glycerol Acetic Acid Ethanol
Con
cent
ratio
n (g
/l)
S288CAWRI 838Kyokai 7
Figure 10: Metabolomic differences that exist between a laboratory strain (S288C),
a winemaking strain (AWRI 838), and a sake strain (Kyokai 7). The organic acid
profile (A) and other wine-related compounds (B) were analysed by HPLC
performed by the Analytical Service at the AWRI.
64
4.2.2. Proteomic comparison shows protein expression differences between
strains
4.2.2.1. Global proteome differences appear minimal between strains
2D gels provide a useful tool for comparing the expression of many proteins
between strains. They are also serviceable for quantifying the number of proteins
that change expression after an ethanol stress. This technique was applied to uncover
differentially expressed or novel proteins in wine strains that might contribute to the
wine strain phenotype. It is noted however that most hydrophobic proteins are
excluded using 2D gel electrophoresis (Boucherie et al., 1995b; Hoving et al., 2002;
Wildgruber et al., 2002), therefore membrane proteins that could be important for
ethanol stress may not be identified in this study. Initially, total cell protein extracts
taken from AWRI 838 (wine strain) and S288C (laboratory strain) grown in SC
medium to mid-exponential phase were compared. To visualise the highest number
of expressed proteins by these strains, pH 3-10 non-linear focusing strips were used.
These focusing strips are the widest pH range available and can resolve up to 1200
proteins per gel (Boucherie et al., 1995b; Amersham Biosciences). After focusing
the proteins for 33,860 Volthours, the strips were run on 12% non-gradient gels,
developed and scanned. The resultant protein maps of each stain were superimposed
and reproducible expression differences recorded. Despite the gels each having close
to 800 distinct spots, there were minimal reproducible differences seen between
strains (Figure 11). This result indicates that, although phenotypically dissimilar, the
proteome between the strains (at least that of the proteins detectable using this
technique) appears comparable. We sought to isolate, identify and characterise the
65
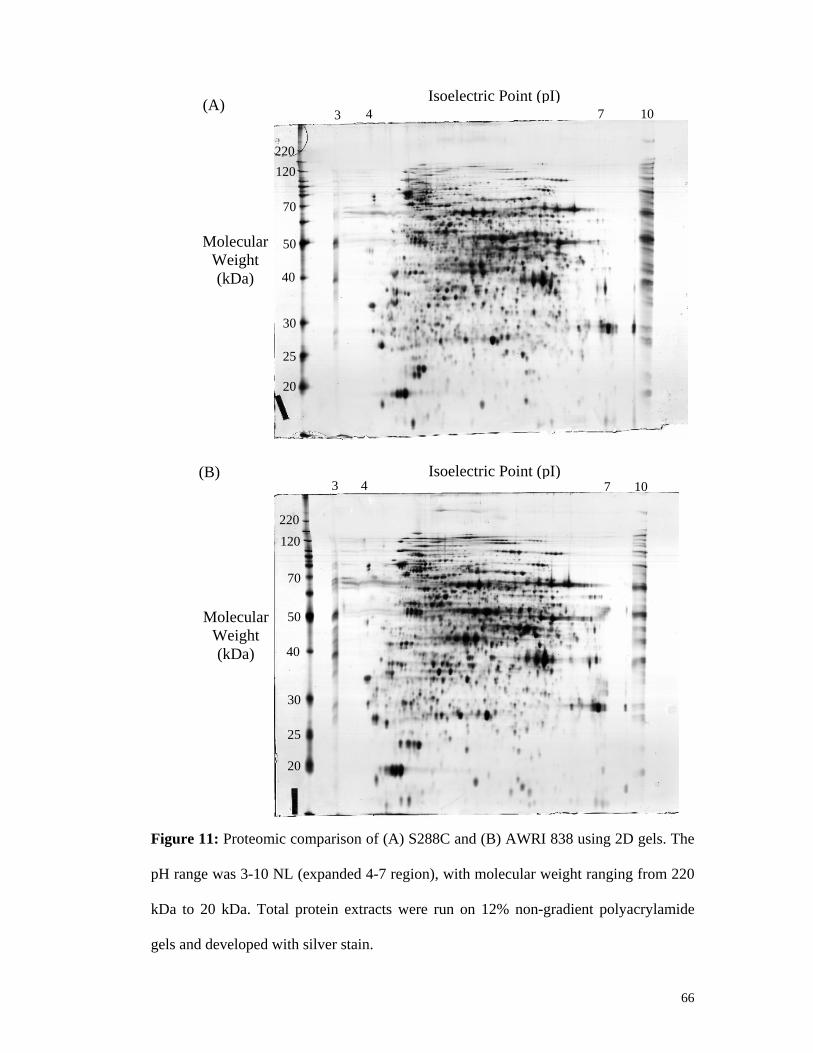
66
Isoelectric Point (pI) (A) 4 7 103
220 120
70
Molecular Weight (kDa)
50 40
30
25 20
Isoelectric Point (pI) (B) 3 4 7 10
220 120
70
Molecular Weight (kDa)
50
40
30
25
20
Figure 11: Proteomic comparison of (A) S288C and (B) AWRI 838 using 2D gels. The
pH range was 3-10 NL (expanded 4-7 region), with molecular weight ranging from 220
kDa to 20 kDa. Total protein extracts were run on 12% non-gradient polyacrylamide
gels and developed with silver stain.

proteins comprising these distinct spots in order to reveal proteins that may provide
the phenotypic diversity between wine and laboratory strains. Several high-intensity
stained proteins common to both wine and laboratory strains were isolated to obtain
“landmark” proteins that could be used to orientate each gel and possible identify
closely-located proteins (Table 2; Boucherie et al., 1995b). It was however noted
that the protein maps resulting from the pH 3-10 non-linear focusing strips were
crowded with protein spots and further resolution was required. Therefore, an
attempt to expand the observed proteome and identify more protein expression
differences was undertaken.
4.2.2.2. Expanding the observed proteome reveals more differences in protein
expression
As there were many expressed proteins revealed by each strain using the pH 3-10
non-linear strips, it was possible that larger protein spots were masking lower
abundant proteins with altered expression. To explore this possibility and to get
better resolution of the proteome, smaller pH ranges were chosen. Initially, pH 3.5-
4.5, 5-6, 4-7, and 6-11 narrow range strips were used and run once again on 12%
non-gradient gels. After close inspection of these gels for protein expression
differences and possible modifications, most protein expression differences between
strains appeared to occur on the pH 6-11 gels (Figure 12). In addition, an ethanol
stress applied to each strain did not show any reproducible significant (greater than
two-fold) expression differences (data not shown). Nevertheless, the differences
67

Table 2: Proteins that were more highly expressed or modified in wine strain AWRI
838 compared to the laboratory strain S288C.
Observed MW (Da)
Observed pI
Protein identified as:
Fold higher in AWRI 838
Method of identification
35,000 6.6 Tdh3p 5301 (46%)2 MALDI 35,000 6.7 Tdh3p not present in S288C3 MALDI 35,000 6.8 Tdh3p 736 (48%) MALDI 34,000 6.8 Tdh3p not present in S288C MALDI 33,000 6.7 Tdh3p not present in S288C MALDI 55,000 7 Shm2p visible, but not
detected in S288C MALDI
55,000 7.2 Shm2p 115 (14%) MALDI 55,000 7.4 Shm2p not present in S288C MALDI 55,000 7.6 Shm2p not present in S288C MALDI 35,000 6.6 Gre3p visible, but not
detected in S288C MALDI
33,000 6.6 Mdh1p mod? possible modification present 736 (48%)
MALDI
27,000 7.7 Por1p not present in S288C MALDI 27,000 7.2 Por1p mod? similar spectra to
POR1, 990 (41%) MALDI
28,000 10.8 Rps4Ap not present in S288C MALDI 15,000 10 Rpl12p not present in S288C MS/MS 14,000 10.5 Rps19p not present in S288C MALDI &
MS/MS 13,000 10.4 Rps31p not present in S288C MS/MS 14,000 10.6 Htb1p not present in S288C MS/MS 40,000 5.6 Fba1p mod? not present in S288C MALDI 40,000 5.4 Fba1p Landmark protein MALDI 47,000 6.2 Eno1p Landmark protein MALDI 60,000 5.8 Pdc1p Landmark protein MALDI 1Indicates the number of pixels present in AWRI 838. 2Indicates the percentage increase in pixel intensity in AWRI 838 compared to S288C. 3not present in S288C, but is present in AWRI 838.
68

69
(A) Isoelectric Point (pI) 6 11
220
Molecular Weight (kDa)
20
40
70 50
30
25
10
(B) Isoelectric point (pI) 6 11
220
70
50
Molecular Weight (kDa)
40
30 25
20
10
Figure 12: Proteomic comparison of (A) S288C and (B) AWRI 838. The pH range was
6-11, with molecular weight ranging from 220 kDa to 20 kDa. Total protein extracts
were run on 12% non-gradient polyacrylamide gels and developed with silver stain.

between strains on the pH 6-11 gels warranted further investigation by isolation and
identification of proteins to elucidate wine strain-specific proteins.
4.2.2.3. Identification of proteins that appear wine strain-specific
It can be difficult to get clear, reproducible 2D gels in the basic protein range
(Hoving et al., 2002; Wildgruber et al., 2002). Therefore, due to the clarity and
number of protein expression differences seen in the basic pH range, an attempt to
isolate and identify proteins of interest from silver-stained gels was undertaken.
Previous research has optimised the procedure for isolation of proteins from silver-
stained gels (Shevchenko et al., 1996b), with subsequent identification by matrix
assisted laser desorption ionisation time-of-flight (MALDI-TOF) mass spectrometry.
The resultant spectrum of a peptide fingerprint produced from the MALDI-TOF can
then be probed against the MassLynx® Yeast database and the protein identified
based on spectrum alignment. To use this technology in Australia, a collaboration
with the School of Botany, University of Melbourne was established. However,
using these procedures, proteins of interest from pH 6-11 silver-stained gels could
not be identified.
To overcome this obstacle, protein extracts were taken to the Australian Proteome
Analysis Facility (APAF) for 2D gel analysis, protein isolation and subsequent
identification. During this visit, total protein extracts from each yeast strain were run
in triplicate on Multiphor 2D gels, repeated on two different days (ie. 6 gels for each
strain). Gels were then digitally montaged using ImageMaster (Amersham
70

Biosciences), creating an averaged gel of each yeast sample. Differentially expressed
proteins and proteins that appeared modified were isolated (Figure 13), tryptic
digested, and analysed by MALDI-TOF. Using the MassLynx software
(Micromass), the peptide spectra were compared to theoretical digests and the
proteins identified (Table 2). Although there is a large standard deviation due to
pixel intensity between gel scans, the computer generated results were confirmed by
eye and any insignificant results were discarded.
Tdh3p (glyceraldehyde 3-phosphate dehydrogenase) and Shm2p (serine
hydroxymethyltransferase) were not detected on S288C gels, yet were present with
five and four isoforms respectively on gels with AWRI 838 proteins. In addition,
Gre3p (aldose reductase) and Rps4Ap (component of small ribosomal subunit) were
not detected on S288C gels, yet in contrast were highly expressed in AWRI 838
(Figure 13).
A number of proteins were unable to be identified using the MALDI-TOF approach.
To overcome this, tandem mass spectrometry (MS/MS) was used, which is a more
powerful protein identification technique compared to MALDI-TOF. This approach
provides sequence information as opposed to peptide fingerprints, and is therefore
more specific for identification of unknown proteins. A further four proteins more
highly expressed in AWRI 838 were identified using MS/MS (Table 2), which
included three components of small ribosomal protein subunits (Rpl12p, Rps19p and
71
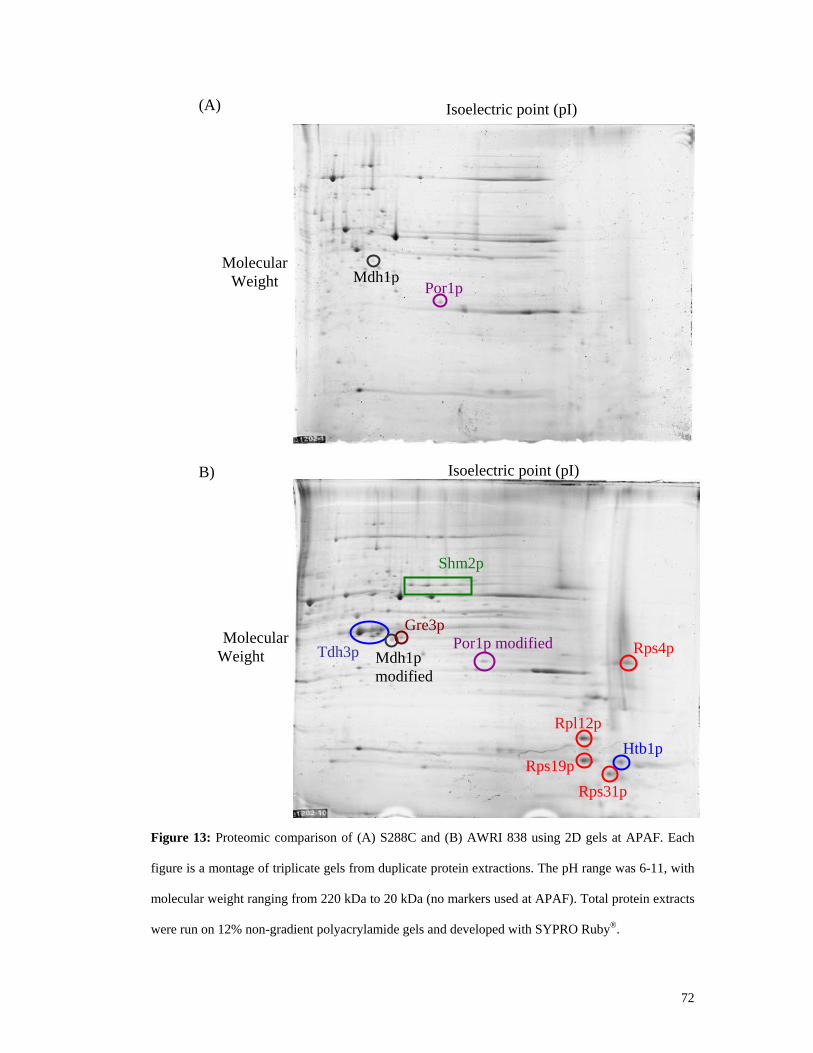
72
(A) Isoelectric point (pI)
Molecular
Weight Mdh1pPor1p
Isoelectric point (pI) B)
Shm2p
Htb1p
Rps31p Rps19p
Rpl12p
Por1p modified Rps4p Gre3p
Mdh1p modified
Tdh3p
Molecular
Weight
Figure 13: Proteomic comparison of (A) S288C and (B) AWRI 838 using 2D gels at APAF. Each
figure is a montage of triplicate gels from duplicate protein extractions. The pH range was 6-11, with
molecular weight ranging from 220 kDa to 20 kDa (no markers used at APAF). Total protein extracts
were run on 12% non-gradient polyacrylamide gels and developed with SYPRO Ruby®.

Rps31p), and a DNA-binding histone protein, Htb1p or Htb2p (nearly identical
sequence).
4.2.2.4. Protein modifications are present in AWRI 838
As mentioned previously, the advantage of proteomics is the possible identification
of protein modifications. Proximal modifications are generally amino acid
substitutions and can be visualised on 2D gels by the subtle alteration of the
isoelectric point and molecular weight, while other modifications such as the
addition or loss of a functional group induce greater distance shifts on a 2D gel.
Confirmation of any modification is then determined by comparing MALDI-TOF
spectra from the corresponding unmodified proteins in each strain with the possibly
modified protein to identify common and novel peptide peaks. This putatively
identifies the protein of interest, and provides an indication of the nature of the
modification. Two possible modifications in AWRI 838 were seen using pH 6-11
gels at APAF based on resultant MALDI-TOF spectra: a modification of Mdh1p
(mitochondrial malate dehydrogenase) with a lower molecular weight but the same
isoelectric point, and Por1p (voltage-dependent ion-selective mitochondrial
membrane porin) with altered isoelectric point and molecular weight. It is
anticipated that this is a true reflection of the protein modifications that occur in
AWRI 838 compared to S288C, and not a result of sample preparation as both yeast
protein preparations were performed simultaneously.
73

74
Isoelectric Point (pI) (A)
5 6 Isoelectric Point (pI)
Molecular Weight (kDa)
10
25
20
15
30
40
220
70
50 Fba1p
Fba1p modified
6 5
Molecular Weight (kDa)
20
40
30
25
50
70
220
Fba1p
15
10
(B)
Figure 14: Proteomic comparison of (A) S288C and (B) AWRI 838 using 2D gels. The
pH range was 5-6, with molecular weight ranging from 220 kDa to 20 kDa. Total
protein extracts were run on 12% non-gradient polyacrylamide gels and developed with
silver stain. The modified Fba1p is highlighted.

Figure 15: MALDI spectra of trypsin digests with Fba1p (top) and modified Fba1p
(bottom). Common peaks are highlighted in red, while peaks unique to each spectra
are highlighted in green. Peptides were searched for matches to proteins using the
Yeast database available from MassLynx.
75

One putative modification present on pH 5-6 gels of AWRI 838 protein preparations
was to the fructose bis-phosphate aldolase protein (Fba1p) (Figure 14). This was
assumed due to its proximal location to Fba1p, which was identified by comparing
the two maps of each strain with the 2D gel map of S. cerevisiae (Boucherie et al.,
1996). The suspected modified Fba1p protein in AWRI 838, as well as the Fba1p
present in both S288C and AWRI 838 strains (matched to 2D gel database), was
isolated and tryptic digested. Half of the sample was run through an HPLC, the other
half was subjected to peptide fingerprinting by MALDI-TOF. Spectra from both
methods returned a similar result, with common peaks between Fba1p in both
strains, as well as peaks unique to each protein (Figure 15). The peak intensity is not
considered significant due to variation in efficiency of tryptic digestion and peptide
extraction. The spectra obtained from MALDI-TOF were analysed for possible
modifications such as phosphorylation, methylation, glycosylation, sulphation,
acetylation and myristylation based on the size to charge ratio differences of the
spectra, with no matches to any known modifications seen. It is possible that the
unique peaks in the modified Fba1p are a combination of the possible modifications
listed above. Alternatively, as the complete genetic sequence of AWRI 838 is
unknown, the modified Fba1p may be produced from a second FBA1 allele with a
different coding sequence obtained through genetic recombination.
4.3. DISCUSSION
With phenotypic variation existing between commercial wine strains and the well-
studied laboratory strain S288C, it was necessary to confirm some of these
76

differences in relation to the fermentation properties of these strains. These
properties include the ability of wine strains to withstand high sugar and ethanol
concentrations at the beginning and end of fermentation respectively, as well as the
production of metabolites consistent with wine. To measure these parameters in the
laboratory, plate assays investigating individual stresses and metabolic
fingerprinting to identify wine strain-specific metabolites were utilised. It was clear
from the plate assays that wine strains do exhibit phenotypes, in particular ethanol
tolerance, that are different to the well-studied laboratory strain, and which are likely
to be of benefit during winemaking. It was anticipated the sake strain (Kyokai 7)
could be used to identify ethanol-related proteins in this study, as it is well
established that sake mashes using this strain can reach alcohol contents higher than
16% (Kodama, 1993). However, the rice wine environment, in the presence of other
organisms such as Aspergillus oryzae, is very different to plate assays, and may
explain why there was not the anticipated increased ethanol tolerance by Kyokai 7.
From AFLP analysis, the genetic variation between AWRI 838 and Kyokai 7 is seen
to be high (de Barros Lopes et al., 2002), so it is likely that such genetic variation
would also lead to phenotypic differences between these strains despite their
common ability to withstand higher ethanol concentrations than S288C.
Although the proteome of a wine strain (a spontaneous yeast isolated from a
fermentation that produces quality wines) has been reported (Trabalzini et al.,
2003a), no proteins specific to wine strains that impart their phenotype were
elucidated. Using 2D gels, there appeared to be protein expression and protein
77

modification differences between the wine and laboratory strains used in this study.
These include higher expression of Tdh3p, Shm2p, Rps4Ap, Rpl12p, Rps19p,
Rps31p, and Htb1/2p in the wine strain, as well as the presence of a putative
modified Fba1p, Mdh1p, and Por1p in the wine strain. Although there is no obvious
metabolic link between these proteins and the wine strain phenotype, each gene
product may have a role in cellular functions such as metabolism or stress response.
In addition, it was valuable to increase the resolution of total protein extracts from
each strain to visualise more proteins per yeast protein extraction. To achieve this
goal, pH 5-6 gels were utilised where a putative modification of Fba1p was seen.
Although the results show many different peptides exist between the two Fba1p
protein samples, there were enough common peptides in each protein to provide a
confident match to Fba1p. This result, combined with the observed differential
expression of glycolytic enzyme Tdh3p, may provide an insight into wine yeast
metabolism, in particular possible variations to the glycolytic pathway in wine
strains.
An interesting observation using 2D gels was the presence of two modified proteins
of a mitochondrial origin, the mitochondrial malate dehydrogenase (Mdh1p) and a
voltage-dependent ion-selective mitochondrial membrane porin protein (Por1p).
These modifications in AWRI 838 might indicate a variance in mitochondrial role
and function that has evolved due to exposure of this wine strain to a grape juice
environment. Grapes used for winemaking typically have 5-8 g/l malic acid
(Rankine, 1989), which creates an acidic environment, one that is generally made
78

less acidic via the malolactic bacterial fermentation (Fleet and Heard, 1993). In
general, metabolism of extracellular malic acid by S. cerevisiae does not occur due
to lack of an efficient uptake system and a converting enzyme such as malic enzyme
or malate dehydrogenase. To counteract this, Volschenk et al., (2001) have
overexpressed in wine yeast two malate permease genes, thereby enabling
degradation of 8 g/l malic acid in synthetic must. It has also been reported that both
expression of the malate dehydrogenase gene, MAE1, and activity of the encoded
enzyme are increased under anaerobic conditions (Boles et al., 1998; ter Linde et al.,
1999), thereby keeping within the physiological conditions encountered by wine
strains during fermentation. It could be postulated that the wine strain AWRI 838 is
able to utilise malic acid more effectively with the modified Mdh1p seen on 2D gels
than the laboratory strain used in these experiments. This is supported by the
metabolic profile of wine strains that had lower concentrations of malic acid present
in the final metabolome after fermentation.
It has been reported in the literature that significant changes in gene expression
occur after exposure of S. cerevisiae strains to an ethanol stress (Alexandre et al.,
2001; Aranda et al., 2002; Betz et al., 2004; Carrasco et al., 2001; Garay-Arroyo et
al., 2004; Palhano et al., 2004; Rossignol et al., 2003). It has also been reported that
there are many changes to the proteome of a wine strain in glucose-depleted
medium, mainly in carbohydrate metabolism, protein folding, and protein synthesis
genes (Trabalzini et al., 2003b). Based on these reports, more differences in protein
expression between strains after an ethanol stress than those actually observed here
79

might have been expected. There may be a number of reasons for the differences
between these studies, including the concentration and time of exposure of cells to
ethanol. We anticipated seeing protein expression changes after an ethanol stress to
the yeast that related to the gene expression studies listed above. However, this was
not forthcoming from the proteomics techniques used in this study. Possible reasons
for this include the protein isolation procedures used, as well as the properties of the
isoelectric focusing gels. Moreover, 2D gels do not display low abundant proteins
effectively, thus it is difficult to visualise and subsequently identify these proteins
(Shevchenko et al., 1996a). It may be that low abundant proteins such as signalling
molecules have markedly changed expression levels between strains and yet are
undetectable by the methods used here. Alternative strategies being implemented by
other research groups include isotope-coded affinity tagged (ICAT)
chromatography, isoelectric fractionation before 2D gel analysis (Corthals et al.,
1997; Pedersen et al., 2003) and the changing of 'standard' protein solubilisation
buffers to allow more proteins to be resolved (Rabilloud et al., 1997) and to increase
their abundance for subsequent isolation and identification. If this could have been
done in this study, a more accurate picture of protein expression differences between
S. cerevisiae strains could have been achieved.
From the literature cited above, it was also expected that ribosomal proteins would
be expressed less during an ethanol stress. However, in this study, there appeared to
be no alteration in protein expression in either strain after an ethanol stress to the
cells. It has been shown that an environmental stress has a larger impact on
80

ribosomal protein transcription than on rRNA transcription, which is predominantly
due to transcriptional silencing of ribosomal protein genes and rapid turnover of
their transcripts after stress (Li et al., 1999). It could be suggested that wine strains
do not perceive the ethanol stress in the same manner as laboratory strains and
therefore do not undergo transcriptional silencing to the same extent as laboratory
strains. In addition, the wine strain may be preparing for an environmental stress
such as an ethanol stress encountered during fermentation by producing ribosomal
proteins before entering stationary phase, thereby providing an advantage to the cell
in terms of stress response or energy preservation.
4.4. CONCLUSION
The aim of this exploratory study was to identify differences in protein expression
between laboratory and wine strains. Ultimately, it was hoped that this would lead to
development of methods for a large-scale comparative analysis and the identification
of genes that are responsible for impacting on wine strain phenotypes, especially
with regard to ethanol tolerance. Chapter 4 has demonstrated that a comparative
proteomic approach has been advantageous for isolating and identifying some of
these proteins differentially expressed between strains. Moreover, the power of
proteomics has been displayed by the discovery of three possible protein
modifications that would not have been seen using methods such as gene expression
microarrays. It would be beneficial to further characterise the role and function of
the differentially expressed proteins in wine strains, and to determine how relevant
81

these proteins are in winemaking conditions. This is investigated further in Chapter
5.
82

CHAPTER 5
Characterising the role and function of proteins that are differentially
expressed in wine strains
5.1. INTRODUCTION
The use of proteomics as a tool for identifying protein modifications and protein
expression differences between S. cerevisiae strains has been established in Chapter
4. An advantage of this approach over transcriptome analysis is that it allows the
identification of proteins that are unique to wine strains and which may therefore
contribute to the favourable properties of these organisms in grape juice
fermentation. It also permits the identification of post-translational modifications
that would be undetected by microarrays. By using this platform, the
characterization of isolated proteins will in turn allow identification of related
structural or regulatory genes, which may contribute to the wine strain phenotype.
Techniques such as quantitative real-time PCR and Northern analysis can be used to
rapidly examine gene expression differences between strains under different
environmental conditions, hence permitting further characterization of known genes
and their possibly altered role in wine strains. Similarily, Western analysis can be
used to observe or confirm protein expression differences that may exist between
strains. If it is assumed that the number of gene transcripts in each strain also
83

correlates to the amount of protein synthesised therein, this will permit the
confirmation of results obtained with proteomics in Chapter 4. Furthermore, it will
allow the screening of many wine strains in various environmental conditions (eg.
high ethanol) in order to determine the relevance of the more highly expressed
proteins in wine strains. However, it has been implicated that the correlation
between mRNA and protein levels using SAGE and 2D gel electrophoresis
techniques respectively is insufficient to predict protein expression from quantitative
mRNA data (Gygi et al., 1999). In contrast, Futcher et al. (1999) determined that the
level of transcripts produced by a yeast cell equate to the number of proteins
synthesised. If the latter were true in this study, the monitoring of other wine strains
for the gene of interest under different environmental conditions could be achieved
using quantitative real-time PCR.
Ultimately, the study of genes with different patterns of expression amongst wine
strains may provide an explanation for the variation in physiological behaviour of
wine yeast and the advantages that wine strains have over other Saccharomyces
strains in highly stressful environments such as high sugar grape juices and high
ethanol wine. Therefore, Western blotting and transcriptional profiling using
quantitative real-time PCR was used in this study to confirm the protein results
achieved using 2D gels. Furthermore, once confirmation of the more highly
expressed proteins of interest in the wine strain had been obtained through
correlation with gene expression data, the genes of interest were investigated further.
Specifically, the degree of similarity in the sequence and pattern of expression of
84

corresponding structural genes was compared across a number of wine strains. In
addition, the method of near infra-red spectroscopy (NIRS) was used to determine
whether a high-throughput strategy could be developed to identify differentially
expressed genes that influence the yeast metabolome, and by doing so, contribute to
wine flavour. In this study, gene deletion mutants were used in order to determine
whether a single gene affects the metabolome after fermentation by S. cerevisae,
thereby elucidating a potential role for the gene in wine flavour. Although the
findings are preliminary, the ability to identify yeast ‘flavour genes’ is of
considerable importance to the wine industry, and the experiments described in this
study for SHM2 could be used in large-scale studies.
5.2. RESULTS
5.2.1. Confirmation of increased Tdh3p expression in AWRI 838 using Western
blot analysis
Before further study of the genes encoding the differentially expressed proteins
described in Chapter 4, it was necessary to confirm the proteomic data upon which
identification was based. A convenient method for comparing protein expression
between two samples, using either total cellular protein extracts or purified protein
fractions, is Western blot analysis (Sambrook and Russell, 2001). To allow the use
of this method to confirm increased glyceraldehyde 3-phosphate dehydrogenase
(Tdh3p) expression in AWRI 838, an antibody to Tdh3p was acquired (kindly
provided by Daniel Gozalbo, University of Valencia; Delgado et al., 2001).
Unfortunately, antibodies to the other differentially expressed proteins still need to
85

be produced. Total cellular protein extracts from cells grown in minimal medium
were prepared using the same procedure as the proteomic study. Each extract was
run on a 4-20% iGel (Gradipore), transferred to a nitrocellulose membrane, and
probed with the Tdh3p antibody. TDH1, TDH2, and TDH3 deletion strains (using
strain BY4742, Euroscarf), in conjunction with a glyceraldehyde 3-phosphate
dehydrogenase enzyme (GAPDH, Sigma), were used as controls. As expected, the
TDH3 deletion strain did not exhibit an intense band in the 35kDa range that
correlates with the GAPDH positive control. Deletions in the two related genes
TDH1 and TDH2 produced a protein of the expected size. By using two different
total protein isolations from two independent yeast cultures, it was shown and
confirmed that Tdh3p was more highly expressed in AWRI 838 compared to S288C
(Figure 16).
5.2.2. Real-time PCR suggests post-transcriptional control may exist in wine
strains
To support the proteomics data obtained in Chapter 4 quantitative real-time PCR
was used. Moreover, this technique provides the ability to screen other wine strains
in various environmental conditions and determine the importance of the gene of
interest amongst wine strains. RNA was extracted from yeast cultures at the same
cell number in SC medium as the protein extracts were taken in Chapter 4 (ie. at
mid-exponential phase). After standardising the amount of total RNA between
samples, cDNA was synthesised and used in real-time PCR reactions.
Reproducibility of each transcript sample was demonstrated by running triplicate
86

AW
RI 8
38
S288
C
AW
RI 8
38
S288
C
BY
4742
∆TD
H2
∆TD
H3
∆TD
H1
GA
PDH
Mar
ker
Figure 16: Western blot analysis of the total protein extracts from TDH deletion
strains (BY4742), S288C and AWRI 838. Protein extracts from cells grown in SC
minimal medium were taken at 1 x 10⁷ cells/ml, run on a 4-20% iGel (Gradipore),
transferred to a nitrocellulose membrane, and probed with a Tdh3p antibody. The
red arrow indicates the band size for Tdh3p and the positive control (GAPDH).
Schiff staining ensured protein loading was the same (data not shown).
87

samples from different RNA preparations isolated from the same strain. Using the
resultant amplification curves and incorporating the standard curves for each primer
set, it was shown that AWRI 838 had five times more copies of TDH3 transcript
than S288C. This correlates to the proteomics data from Chapter 4, which displayed
significantly higher expression of Tdh3p in AWRI 838 compared to S288C.
However, of the genes analysed, TDH3 was the only gene to have a greater than
two-fold transcript number in AWRI 838 than S288C, which does not correlate with
the 2D gel protein expression data. GRE3, SHM2, HTB1 and the ribosomal subunit
protein genes showed no significant difference in gene expression between AWRI
838 and S288C (data not shown).
Previous research has determined the gene expression differences that exist between
a wine strain, T73, and the laboratory strain S288C using microarray analysis
(Hauser et al., 2001). The microarray data showed that expression of SHM2 in T73
was more than 2000-fold higher than seen for S288C. In the proteomics results of
this study (Chapter 4), it was shown that the wine strain AWRI 838 had a higher
protein expression level of Shm2p than that of S288C (some isoforms of Shm2p
were not present in S288C), however the transcript abundance between these strains
using real-time PCR showed no significant differences. Based on these results, the
transcription of the SHM2 gene in T73 was investigated in parallel with AWRI 838
and S288C in this study. The results showed a 16-fold increase in the SHM2
transcript in T73 compared to S288C. It was of interest to see wine strain AWRI 838
88

possess higher levels of the SHM2 protein and yet display no transcriptional
difference relative to S288C, while for wine strain T73 there was an increase in
SHM2 transcript abundance at the same time point of fermentation. In addition, it
was demonstrated that other wine strains also had higher SHM2 transcript abundance
at the same time point of fermentation (see 5.2.4.4). This suggests that SHM2 is
affected post-transcriptionally in AWRI 838, and may have different cis- or trans-
acting elements compared to T73, which was observed to have higher SHM2
expression using real-time PCR. To confirm the original proteomics data had not
provided false leads regarding the higher expression of Shm2p, the 2D gels were
repeated.
5.2.3. Replication of 2D gels confirms Shm2p and Tdh3p are expressed more
highly in wine strain AWRI 838 than S288C
As the gene transcript data did not correlate well with the 2D gel protein data for all
but one of the proteins of interest (Tdh3p), before analyzing the possible role of
these genes during fermentation, the proteomic experiments were repeated. For this
set of 2D gels, protein from biological replicates (three independent cultures) was
extracted to ensure that any differences detected were solely due to the strain. Each
sample was again run in triplicate, montaged, and protein expression differences
recorded. In confirmation of previous data, both Tdh3p and Shm2p had two isoforms
in AWRI 838 that were not present in S288C (data not shown). Also, the Mdh1p that
appeared to be modified in the initial 2D gel experiments was present again in
AWRI 838 gels but not in the S288C gels. Unfortunately, the changes identified in
89
the previous study were not consistently observed. Although the reason for this is
not fully known, it may be that minor changes in growth conditions and phase affect
their expression.
Tdh3p expression was confirmed by Western blot analysis, but attempts to discover
the mechanism of higher Tdh3p expression in AWRI 838 compared to S288C were
not successful. This result was obtained by comparing the promoter sequences of the
sequenced ‘wine TDH3 gene’ to the ‘laboratory TDH3 gene’ sequence in the S288C
database, with no clear evidence in the sequence information for the Tdh3p
expression (data not shown). The sequencing of the SHM2 promoter region in
AWRI 838 was also carried out and compared to the S288C database, with seven
base changes observed (see 5.2.4.3). Therefore, the enzyme Shm2p, which is
involved in conversion of serine to glycine in the folic acid biosynthesis pathway,
was considered worthy of further investigation as enzymes involved in the one-
carbon pool are likely to play a role in central metabolism.
5.2.4. Further examination of SHM2
5.2.4.1. Near infra-red spectroscopy reveals SHM2 impacts on the metabolome
Serine hydroxymethyltransferase (SHM2) is a cytoplasmic enzyme involved in the
conversion of serine to glycine and plays an important role in the one-carbon pool.
To determine if the SHM2 gene is required for growth in minimal medium, a
deletion strain for this gene was compared to a wild-type laboratory strain. The
results showed no discernable differences in growth rate, cell morphology, or final
90

cell number (data not shown), which suggested this gene does not play an essential
role in central metabolism of laboratory strains. As subsequent metabolic pathways
lead to compounds that may contribute to wine sensory properties, and there was no
impact of gene deletion on phenotype detected, the potential for this gene having an
impact on the final metabolome was investigated.
To demonstrate how the metabolic profile of deletion strains can be compared to a
wild-type strain, Allen et al. (2003) have previously used GC-MS to discriminate
deletion strains with various functions that are expected to impact on the
metabolome. The results showed a clear discrimination between each of the 27
deletion strains tested, with genes of similar function grouping more closely than
those with very different functions. To study the possibility of SHM2 influencing the
formation of wine sensory compounds, near infra-red spectroscopy (NIRS) was
chosen. NIRS separates a complex matrix based on the chemical bonds that exist in
the sample media, and is a rapid technique that, in contrast to other techniques such
as GC-MS, requires minimal sample preparation. Briefly, 250 mL fermentations
were undertaken in SC medium with 8% glucose. When all glucose had been
consumed, the yeast was pelleted, and the supernatant analysed by NIRS. Using
principle component analysis (PCA) plots, the results showed the separation of the
shm2∆ strain from the wild-type BY4742 laboratory strain (S288C background),
suggesting that different profiles of metabolites were being released by the two
strains (Figure 17). To support this finding, a deletion strain with a gene of similar
function, MUP3, a methionine permease gene, was also analysed for comparison to
91

Fact
or 3
Factor 2 Factor 1
Figure 17: Principle Component Analysis (PCA) plot showing the separation of the
shm2 strain from S288C using near infra-red spectroscopy (NIRS) to analyse culture
supernatants from each strain. This technique separates different strains based on -
OH, C-H, and N-H vibrational bonds.
92

the wild-type and shown to be more similar to the shm2∆ strain than the wild-type
by NIRS. To illustrate how different the metabolic profile of these two deletion
strains are to the wild-type, similar experiments with the same strains used by Allen
et al. (2003), which used GC-MS to discriminate 27 deletion strains, were carried
out to validate the method and to check for metabolic differences in the
fermentations using NIRS. With the exception of the ure2∆ strain, every strain
trialed was seen to fall between the shm2∆ strain and the wild-type (Figure 17). This
confirmed that deletion of the SHM2 gene resulted in a metabolic profile distinct
from that of the wild-type and other deletion strains. It could then be expected that
yeast strains, including wine yeast strains, with altered gene expression of SHM2
could produce a unique metabolic profile during or after fermentation. The strategy
developed here, although preliminary, will be important for future studies, as it can
be adapted for high-throughput metabolic studies for many genes of interest.
5.2.4.2. Southern analysis shows multiple alleles are not present in the wine strain
genome
The potential effect of changes in gene expression of SHM2 on metabolites and the
apparent differences in regulation of the gene in AWRI 838 and T73 lead to a further
study of the regulation of this gene. For this, the sequence of the SHM2 gene,
especially the possible regulatory sequences, was determined in the laboratory and
wine strains. It was possible sequencing SHM2 in each of S288C, AWRI 838 and
T73 would resolve the mechanics of the higher expression of SHM2 in T73, and
possibly Shm2p synthesis in AWRI 838. Due to the aneuploid nature of wine strains,
93

it was necessary to ensure there was only one allelic copy of SHM2 being
sequenced. To demonstrate this, Southern analysis was implemented. Briefly,
genomic DNA was prepared from each yeast strain, digested with a restriction
enzyme, the resultant fragments run on a gel and transferred to a nylon membrane. A
digoxigenin-labelled probe for the SHM2 gene was prepared, applied to the
membrane, and detected using a chemiluminescent assay. The resultant Southern
blot suggested that it is unlikely that multiple copies of SHM2 were present
throughout the genome of wine strains, since the banding patterns are equivalent to
that of the S288C strain (Figure 18). The largest band present in all strains at
approximately 11,700 bp was SHM1 (calculated by restriction analysis using SGD).
Having confirmed that all strains were likely to only carry one SHM2 allele, the
sequencing of this gene in each strain was undertaken.
5.2.4.3. Sequencing of the SHM2 gene shows seven base substitutions in wine
strains
Sequencing of the SHM2 gene was carried out to help define the mechanism behind
the differences seen between laboratory and wine strains in gene and protein
expression. Primers for sequencing were designed to amplify 370 bp of upstream
sequence from the initial ATG, the SHM2 coding sequence, and 167 bp of
termination sequence following the STOP codon. Each primer was designed to
amplify from within the genes upstream and downstream of SHM2 to encapsulate
any regulatory sequences to SHM2. This approach was performed to ensure a high
likelihood that all promoter and terminator sequences would be incorporated. Strains
94
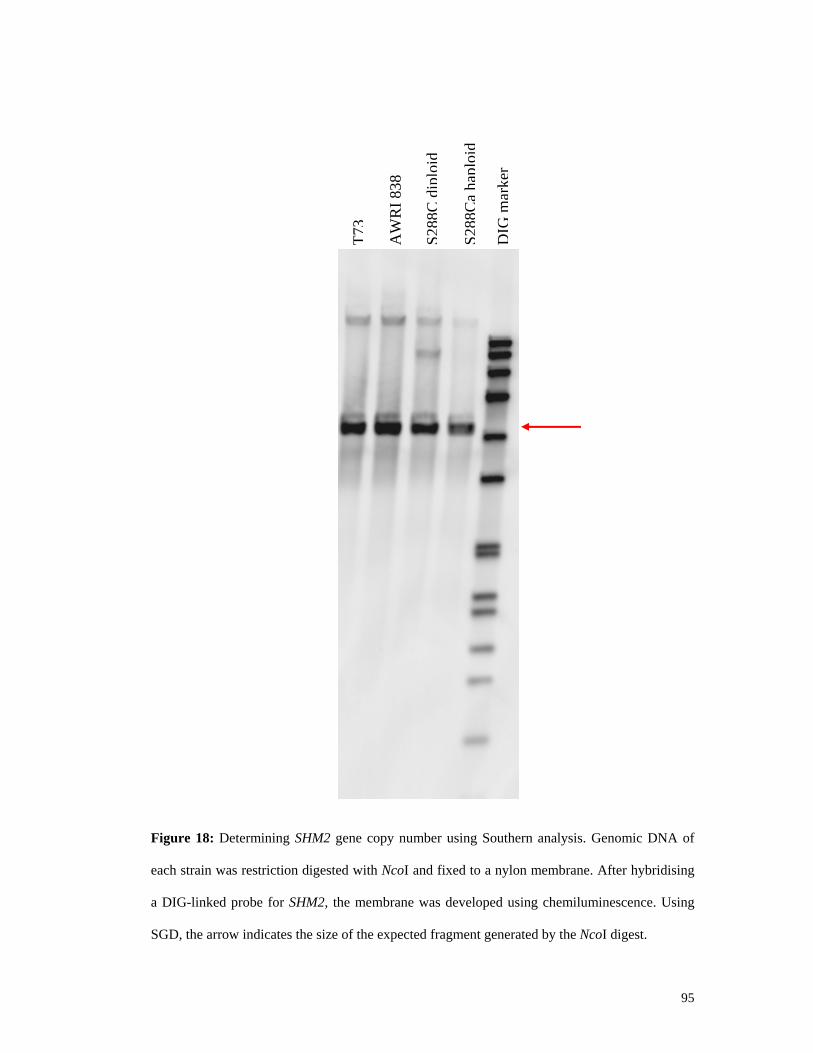
T73
AW
RI 8
38
S288
Cdi
ploi
d
S288
Ca
hapl
oid
DIG
mar
ker
Figure 18: Determining SHM2 gene copy number using Southern analysis. Genomic DNA of
each strain was restriction digested with NcoI and fixed to a nylon membrane. After hybridising
a DIG-linked probe for SHM2, the membrane was developed using chemiluminescence. Using
SGD, the arrow indicates the size of the expected fragment generated by the NcoI digest.
95

S288C, AWRI 838 and T73 were sequenced, revealing the identical sequence in
both AWRI 838 and T73. Seven differences were found upon comparison of the
sequence of the wine strains and the laboratory strain: two in the promoter (C-70A,
T-66G), four within the SHM2 coding sequence, all of which are silent mutations
(C192T, G350A, C473T, C1133T), and one in the terminator (A75G), (although the
silent mutations will not change the translated amino acid coding sequence, it cannot
be ruled out that they do not affect transcript levels). As for the remaining changes,
the substitution in the termination site occurred after the predicted polyA tail and is
therefore unlikely to have an effect on the cessation of SHM2 transcription. The
significance of the base differences in the promoter were examined by interrogation
of the wine yeast sequences using the Saccharomyces cerevisiae Promoter Database
(SCPD). After examination of all base substitution permutations, these searches
revealed the C-70A resulted in the loss of a possible heat shock transcription factor
(HSTF) binding site in the wine strains. This notion requires confirmation through
mutation analysis to see if this base substitution has an effect on SHM2 gene
expression. Given that AWRI 838 and T73 have the identical sequence, it is unlikely
that the differences in SHM2 expression seen between these strains are the result of a
cis-acting element. Therefore, it is likely that the expression differences are the
result of trans factors.
96

5.2.4.4. Wine strains exhibit differential SHM2 gene expression in varying
environmental conditions
To determine the prevalence of SHM2 gene expression in multiple wine strains and
what impact it may have on wine strain phenotype, several wine strains were taken
for analysis. Eight wine strains were grown in two different media, SC medium and
yeast extract-peptone-dextrose medium (YPD). These two media were chosen as the
proteomics study used SC medium for yeast growth, while the Hauser et al. (2001)
research that saw high SHM2 expression with strain T73 used YPD. The strains were
chosen based on different regions from where they were isolated and their genetic
dissimilarity (de Barros Lopes et al., 1999). Total RNA was extracted from cells at 1
x 107 cells/ml. After making cDNA, equivalent amounts were added to quantitative
real-time PCR reactions, and the amplification curves from quantitative real-time
PCR were normalised to actin (ACT1) expression. ACT1 was used as it has been
shown in the literature to not change its expression after the cell encounters a
stressful environment (Gasch et al., 2000; Causton et al., 2001; Chandler et al.,
2004), therefore it can be utilized to equate cDNA concentrations in two different
samples. The results showed no significant gene expression differences between
strains after growth in SC medium. However, when cells were grown in YPD, seven
wine strains showed greater than two-fold expression of SHM2 compared to the
laboratory strain (Table 3). Interestingly, the only wine strain not to have greater
than two-fold expression of SHM2 transcript was AWRI 838, which corresponds
well to the previous quantitative real-time PCR experiments used to support the
proteomics data (5.2.2).
97

Table 3: SHM2 gene expression differences between wine strains and S288C using
real-time PCR. All gene transcripts have been normalised to actin (ACT1) in the
same strain. Yeast were grown in YPD medium and RNA extracted with cells at
mid-exponential phase (1 x 10⁷ cells/ml).
Strain SHM2 expression relative
to S288C (x-fold)
AWRI 729 12.8
AWRI 796 13.8
AWRI 825 3.0
AWRI 838 1.2
AWRI 844 2.8
AWRI 870 5.0
AWRI 1017 2.5
T73 3.7
S288C 1.0
98

5.3. DISCUSSION
The ability of S. cerevisiae wine strains to undergo grape juice fermentation and
produce favourable sensory compounds is well established. However, the genes and
proteins that are responsible for wine strain phenotypes have not been elucidated.
The aim of this chapter is to develop methods to identify ‘wine genes’ and to
characterise genes that are potentially associated with the wine strain phenotype. It
was anticipated that by taking a comparative proteomics approach, it would be
possible to elucidate yeast genes that have an important role in winemaking, in
particular those genes that might play a role in ethanol stress resistance and in the
synthesis of compounds that impact on wine flavour.
In Chapter 4, the use of 2D gels showed a complex matrix of total cellular protein
could be separated to create protein maps for isolation and identification of abundant
proteins. In this chapter, Western analysis and real-time PCR was used to confirm
the proteomics data and to determine the prevalence of highly expressed genes in
other wine strains. Tdh3p expression differences between the wine and laboratory
strain used in this study were confirmed by Western analysis. However, the
differences in Shm2p, Gre3p, Rps4Ap, Rpl12p, Rps19p, Rps31p, and Htb1/2p
expression were not as easily confirmed, with disparity between transcriptional
profiling data and protein expression at the same cellular state during fermentation.
By repeating the 2D gels with duplicate protein samples for each strain, it was
shown that Tdh3p and Shm2p expression were higher in the wine strain AWRI 838.
In addition, the putative Mdh1p modification in AWRI 838 was also reproducible. It
99

remains unclear why other proteins in the initial 2D gel experiments were not
reproducible, and it implies that previously published experiments that did not use
appropriate replication will need to be repeated. It could be hypothesized that the
cell phase and cell number at the time of protein isolation for each strain was not
simultaneous (despite a relatively homogeneous yeast population). Future proteomic
experiments using 2D gels will incorporate triplicate fermentations from three
independent starter cultures to ensure a complete representation of each biological
sample of interest. The proteins that show significant expression differences between
strains can then be investigated further.
In this study, it was shown that wine strain AWRI 838 had both higher protein and
gene expression of the glycolytic gene glyceraldehyde 3-phosphate dehydrogenase
(TDH3) using proteomics and quantitative real-time PCR respectively. There has
been extensive research into glycolytic enzymes, including attempts to increase the
rate of fermentation, as well as the formation of ethanol by increasing glucose flux
through glycolysis with the overexpression of a combination of glycolytic enzymes
(Hauf et al., 2000; Schaaff et al., 1989). These alterations resulted in large increases
in enzyme activity, but only marginal increases in sugar utilisation rate and ethanol
production, suggesting that there were no rate-limiting or ‘bottleneck’ enzymes in
the glycolytic pathway. However, it is noted that this work was carried out in a
laboratory strain.
100

One protein that was confirmed to be more highly expressed in wine strain AWRI
838 in this study by Western analysis, real-time PCR and proteomics was Tdh3p.
McAlister and Holland (1985) implied the yeast cell does not require TDH1 and
TDH2 for cellular growth. Other research that has been carried out on TDH gene
expression has shown they are differentially expressed in cells exposed to an
environmental stress such as glucose starvation or heat-shock. Boucherie et al.
(1995a) showed the presence of a polypeptide synthesised from TDH1 as cells
entered stationary phase and glucose became limited, while TDH2 was repressed by
a mild heat shock. This suggests these polypeptides have different roles in the cell
depending on cellular state. In addition, the study of TDH gene expression has been
expanded to a wine strain during fermentation. It has been shown that the TDH
genes had their maximal expression at mid-exponential phase, with TDH2 and
TDH3 having the highest level of gene transcripts among glycolytic genes during
wine fermentation (Hauser et al., 2001; Puig and Perez-Ortin, 2000). As grape juice
fermentation can be a particularly stressful environment for yeast, the increased
expression of Tdh3p in AWRI 838 in mid-exponential phase in these experiments
may indicate a preparative step for this strain to counteract ensuing stresses. If this
expression was constitutive, it may also provide tolerance to the osmotic stress as a
result of high sugar concentrations at the start of fermentation. Further research on
the protein expression of Tdh3p, as well as the modified Fba1p (4.2.2.4), will be
required to confirm this hypothesis relating to glycolytic pathways in wine strains.
101

The one-carbon pool is pivotal in cellular metabolism, and the supply of one-carbon
units is flexible dependent on which and how many one-carbon units there are in the
cell (Kastanos et al., 1997). It is the metabolic pathways in the one-carbon pool that
initiate the formation and synthesis of important compounds such as formate, which
is a precursor for many other metabolic pathways in the yeast cell. It was observed
in this study that both TDH3 gene transcript and Tdh3p protein expression levels
were higher in wine strain AWRI 838 compared to the laboratory strain S288C. In
contrast, further investigation of the SHM2 gene showed that the Shm2p protein was
more abundant in AWRI 838 compared to S288C, yet at the same time the level of
SHM2 transcript did not alter between strains. Expanding the study of this gene to
include many other wine strains showed that the level of transcript for SHM2
increased in each strain by as much as 15.5-fold. This indicates that the SHM2 gene
could play an important role in wine strains, and as the shm2∆ strain did not affect
growth phenotype, it was hypothesized that SHM2 may be involved in contributing
to wine sensory compounds. The enzyme Shm2p catalyses the conversion of L-
serine and tetrahydrofolate (THF) to produce glycine and 5,10-methylene-THF.
5,10-methylene-THF is a precursor to the one-carbon pool, which is required for a
number of anabolic processes within the cell including the synthesis of purines,
pyrimidines, amino acids and lipids. It is also of relevance with respect to human
disease and disorders, as disruption of the genes in folate-related metabolic pathways
severely affects phenotype (reviewed in Lucock and Daskalakis, 2000). McNeil et
al. (1994) showed that deleting the SHM2 gene had no effect on the growth
requirements of the cell (which we also noted using the SHM2 deletion strain). In
102
addition, Schlupen et al. (2003) have shown the disruption of the SHM2 gene in
Ashbya gossypii results in an accumulation of glycine, which can then be further
utilised for increased riboflavin synthesis.
To elucidate the possible reasons for the higher protein expression of Shm2p in wine
strain AWRI 838 compared to the laboratory strain S288C, as well as the higher
gene expression in wine strain T73 (Hauser et al., 2001), sequencing of the SHM2
gene in each strain was performed. Inspection of the sequences manifests a variation
in the SHM2 DNA sequence between the wine strains AWRI 838 and T73 compared
to S288C (C-70A and T-66G). Evidence exists in the literature that changes to the
DNA sequence of the 5’ non-translated region effect not only the expression of
genes, but also the targeting of gene products to organelles within a cell in yeast
(Chatton et al., 1988; Natsoulis et al., 1986; Wang et al., 2003), Arabidopsis
(Mireau et al., 1996), and humans (Tolkunova et al., 2000). As there is no other
ATG sequence before the starting ATG of SHM2 in either the laboratory or wine
strains, it is anticipated this change will not affect targeting or transcription rate of
any secondary SHM2 transcripts from the SHM2 gene. Overall, this research has
been unable to discover the possible reason for the difference in transcription
between the two wine strains.
An important outcome of this research has been the discovery of two S. cerevisiae
wine strains having different transcription/translation control of the same gene. This
is evidenced by the differences in SHM2 transcript abundance in wine strains AWRI
103

838 and T73, yet the DNA sequence being identical in each strain. It should be noted
that we have only sequenced 370 bp of promoter sequence and 167 bp of termination
sequence, so additional promoter elements may lie upstream (despite designing the
primers well into the genes both upstream and downstream of SHM2). These results
indicate a trans- regulatory factor is different between two strains. Further
characterisation of SHM2 in AWRI 838 and T73 is required to determine the
importance of this control in terms of gene expression in each strain. It may also
reveal how and why SHM2 is expressed differently between strains and if it affects
the wine strain phenotype significantly in terms of the production of wine sensory
compounds as the metabolome studies suggest.
To identify the possible role of differentially expressed genes between strains in
terms of wine flavour, near infra-red spectroscopy (NIRS) was used. This technique
was chosen based on its ability to determine metabolic differences after fermentation
using strains with a single gene deleted (Allen et al., 2001). It was shown that
deletion of the SHM2 gene resulted in significant variation to the metabolome
compared to the wild-type. In addition, when compared to 27 other single gene
deletion samples, the SHM2 gene deletion was the most distant to the wild-type.
Together, these results suggest that SHM2 does have a role in the production of the
final metabolome during yeast fermentation. It will be important to study this gene
further with respect to its role in determining wine flavour. Furthermore, this study
did uncover the use of NIRS for high-throughput chemometric experiments to
determine the role of a single gene during yeast fermentation. By utilising the
104

techniques described in this chapter, it may be possible to screen multiple yeast
strains with single gene deletions to establish a possible role in wine flavour for each
gene during grape juice fermentation.
5.4. CONCLUSION
The research presented in this chapter demonstrates how proteomics can be used to
elucidate differentially expressed proteins between strains for further
characterisation of their role and function in wine strains. Two proteins confirmed to
be more highly expressed in the wine strain AWRI 838 compared to the laboratory
strain S288C were the glycolytic enzyme Tdh3p, and the one-carbon metabolism
enzyme Shm2p. Further characterisation of the TDH3 gene showed that the higher
Tdh3p expression observed in AWRI 838 was due to increased transcription, as
observed by quantitative real-time PCR. This study also revealed that increased
expression of SHM2 in two wine strains might be related to the synthesis of the final
metabolome of wine produced using these strains, which was demonstrated with
increased SHM2 expression with many wine strains and supported by NIRS
metabolic profiling. We have shown that by using a multi-faceted approach with
biochemical, genetics, transcriptomics, proteomics and chemometric methods, it is
possible to expose genes with possible wine-related phenotypes. In addition,
investigation of the proteome with 2D gels in conjunction with transcriptional
profiling with quantitative real-time PCR has revealed differences in
transcriptional/translational control between S. cerevisiae wine strains. By using a
combination of genetic and proteomic resources, as well as more recent
105

methodologies such as near infra-red spectroscopy for metabolic profiling, it was
possible to elucidate important genes that contribute to the wine strain phenotype
and provide wine strains with their unique properties. This study therefore
demonstrated that an exploratory comparative approach can be utilised to determine
genetic differences between strains of the same species. Further characterization of
these genes will need to be carried out in different environmental conditions,
different grape juices and varying fermentation parameters implemented to achieve a
complete overview of the role and function of genes influencing wine strain
phenotype.
106
CHAPTER 6
Acclimatisation of Saccharomyces cerevisiae to ethanol in continuous culture
6.1. INTRODUCTION
Yeast have been exploited by humans for thousands of years in industrial processes
such as bread making, beer brewing, the production of wine from grape juices, and,
more recently, the bioconversion of various sugar sources to fuel ethanol. As ethanol
is accumulated in each of these industrial processes, it may reach levels that are
deleterious to the yeast in terms of growth capabilities and survival. This makes
ethanol and its effect on yeast growth during fermentation a principal focus for many
research groups, as yeast strains used for the above applications are, in general, able
to resist high concentrations of ethanol and continue to utilise sugars for growth and
energy production.
A number of research groups have identified genes that undergo a transcriptional
response following an ethanol stress (Alexandre et al., 2001; Aranda et al., 2002;
Betz et al., 2004; Carrasco et al., 2001; Chandler et al., 2004; Garay-Arroyo et al.,
2004; Palhano et al., 2004; Rossignol et al., 2003). Other groups have isolated
ethanol-tolerant mutants after continued exposure of cells to ethanol and analysed
their gene expression compared to the wild-type (Ogawa et al., 2000; Sharma et al.,
2001; Takahashi et al., 2001). The existing ethanol stress data from the literature
107

cited above shows a large number of stress-induced genes (eg. HSP12, HSP26,
HSP104) containing stress response elements (STRE’s), which are able to bind the
Msn2p/Msn4p transcription factors, as well as other transcription factors such as
Hsf1p and Yap1p. In addition, a number of genes such as ribosomal protein
synthesis genes are generally repressed (Alexandre et al., 2001; Chandler et al.,
2004). The role of the majority of the ethanol-controlled genes has not been
elucidated. Moreover, the proteomics data described in Chapter 4 suggests that
increases in gene expression do not necessarily lead to equivalent increases in the
amount of protein.
While the above-mentioned studies add valuable information for discovering the
genes involved in the ethanol tolerance of yeast, they do not necessarily reflect the
grape juice fermentation environment. During fermentation, grape sugars are
converted to, amongst other metabolites, ethanol, which accumulates in wine over
the course of fermentation. As this accumulation of ethanol is gradual, the yeast are
able to continuously acclimatise to the surrounding change in environment. Thus it
would be judicious to discover the genes that are not only expressed after short-term
ethanol stress, but genes that are continually expressed in the accumulation and
continual presence of ethanol. Ultimately, the transcriptional response by cells
exposed to an ethanol environment will relate more closely to the yeast contending
with the accumulation of ethanol over time in industrial applications compared to the
stress response genes identified to date through short-term ethanol exposure to cells.
Therefore, the aim of this study is to identify key genes that permit the yeast to
108

acclimatise to ethanol using continuous culture, as opposed to short-term ethanol
stress. These experiments are designed to compare results to the existing literature,
and at the same time learn more about gene expression of S. cerevisiae in
fermentation conditions that are encountered in natural environments such as grape
juice fermentation.
6.2. RESULTS
6.2.1. 6% ethanol inhibits growth in batch culture
To identify the genes responsible for ethanol tolerance, a continuous culture
approach was taken. It was hoped this technique would help elucidate the genes
required for continued growth and survival of industrial strains in a high ethanol
environment. For this approach, an ethanol concentration for continuous culture
needed to be chosen that would affect cellular growth. The ethanol concentration
chosen needed to provide reproducible effects between replicates, while not being
toxic and resulting in wash out of cells from the fermenter. To find this ethanol
concentration, triplicate fermentations were carried out with the deletion strain
collection parent BY4742 (S288C background) in SC media (2% glucose)
containing 0, 2, 4, 6, 8 or 10% ethanol and cell growth monitored by optical density
for 174 hours. The strain BY4742 was chosen so that for future experiments with
genes of interest identified in this study, the deletion strain collection could be
utilised in a strain from the same background. It was observed that 6% ethanol
slowed the growth rate significantly, requiring 17 hours for stationary phase to be
reached as opposed to 10 hours for the 0% ethanol control fermentations (Figure 19).
109

Growth of BY4742 exposed to different concentrations of ethanol
0.0
0.1
1.0
10.0
0 5 10 15 20 25 30 35
Time (hours)
Log 1
0 Abs
orba
nce
0% A0% B0% C2% A2% B2% C4% A4% B4% C6% A6% B6% C8% A8% B8% C10% A10% B10% C
Figure 19: Fermentations of the parent strain (BY4742) from the EUROSCARF
deletion collection to select the concentration of ethanol to be used in continuous
culture. Varying concentrations of ethanol were added to each culture at 1 x 10⁷
cells/ml, in triplicate (A, B, C) and optical density measured every hour for 34 hours.
110

The triplicates at 6% ethanol showed better agreement than that seen for the 8%
ethanol treatment, in which growth was variable (not reproducible) between
replicates. Therefore, to ensure consistency between replicates when determining
genes involved in ethanol tolerance, 6% ethanol was chosen for the continuous
culture experiment below.
6.2.2. 6% ethanol effects gene expression in continuous culture conditions
In order to distinguish between genes that are required for long-term exposure in a
high ethanol environment as opposed to short-term stress response genes, a
continuous culture technique was utilised. In this particular experiment, the turbidity
of the culture was kept constant by manipulating the rate at which fresh medium was
fed into the fermenter. When the turbidity within the fermenter was on the increase
(eg. cell numbers are increasing), the feed rate of fresh medium was increased to
dilute the turbidity back to its setpoint. When the turbidity of the culture fell, the
feed rate was lowered so that turbidity was restored to its setpoint. This enabled the
cells to achieve a relatively homogeneous population over time at the same cell
phase and cellular state. Using 1.5 litre Applikon fermenters at the School of
Chemical Engineering, University of Adelaide, the deletion strain parent BY4742
was continuously cultured for 10-14 generations in triplicate fermenters and the cells
harvested. The same batch of cells was then exposed to 6% ethanol for another 10-
14 generations, and cells harvested again. Using microarrays, the profile of gene
expression after ethanol exposure was compared to that of the initial cell population
without ethanol exposure.
111

Microarrays revealed that 34 genes were induced by two-fold or more and three
genes were repressed greater than two-fold after acclimatisation to 6% ethanol
(Table 4 and 5). The most induced gene after acclimatisation was HSP12 (8.34-
fold), with the most repressed gene being YHB1 (2.36-fold). Interestingly, 34
transposon ORFs appeared to be induced (data not shown), although the homology
of these sequences to each other may account for the high number of transposons
identified as induced.
During such long-term fermentations as described above, it is possible that
contamination by other yeasts in the laboratory or bacteria may have occurred.
Secondly (and less likely), the initial yeast inoculated (BY4742, MATα his3∆1
leu2∆0 lys2∆0 ura3∆0) could have mutated or reverted from its original markers. To
ensure the yeast cells at the completion of the experiment were the inoculated
BY4742 strain (and not a contaminant), final samples were plated onto minimal
media plates and checked for retention of the correct markers. The results showed
the correct markers for BY4742, and no contaminants were present (data not
shown).
6.2.3. Promoter analysis
It was important to elucidate transcriptional elements that have a role in controlling
the transcription of genes in stressful environments. Ultimately, by finding these
promoter elements, a better understanding of the transcriptional response and how
the yeast adapts to the extracellular stress can be obtained. To determine if known
112

Table 4: Genes induced after acclimatisation to 6% ethanol using strain BY4742
grown in SC complete medium. * Indicates putative STRE in promoter region, in
both orientations (Marchler et al., 1993).
Open reading frame
Gene Fold Change Function
YFL014W HSP12* 8.34 Heat shock protein YBR072W HSP26* 6.30 Heat shock protein YER150W SPI1* 5.19 Stationary phase induced YJL079C PRY1* 3.62 Unknown, pathogen related in yeast YHR055C CUP1-2 3.30 Metallothionein, binds copper YPR030W CSR2 3.25 Unknown, cell wall organisation YDR380W ARO10 3.16 Phenylpyruvate decarboxylase YPR052C NHP6A 3.15 Non-histone protein, chromatin binding YML123C PHO84* 3.14 Phosphate and manganese transporter YGL062W PYC1* 3.14 Pyruvate decarboxylase YHR053C CUP1-1 2.95 Metallothionein, binds copper YKR093W PTR2 2.81 Small peptide transporter YBR105C VID24 2.80 Vacuolar targeting, import and degradation YBR067C TIP1 2.69 Temperature shock induced protein YMR096W SNZ1 2.57 Protein binding, pyridoxine metabolism YPR180W AOS1 2.48 Activation of Smt3p, protein sumoylation YDR034W-B * 2.46 Unknown YJR148W BAT2 2.41 Branched-chain amino acid transaminase YNL160W YGP1* 2.39 Secreted glycoprotein YHR049W FSH1 2.39 Family of serine hydrolases YBR018C GAL7* 2.39 Galactose-1-phosphate uridyl transferase YAL053W * 2.37 Unknown YNL125C ESBP6 2.35 Monocarboxylate permease (putative) YER062C HOR2 2.35 Glycerol-3-phosphatase YPR194C OPT2 2.31 Oligopeptide transporter YBR054W YRO2 2.26 Homology to Hsp30p
113
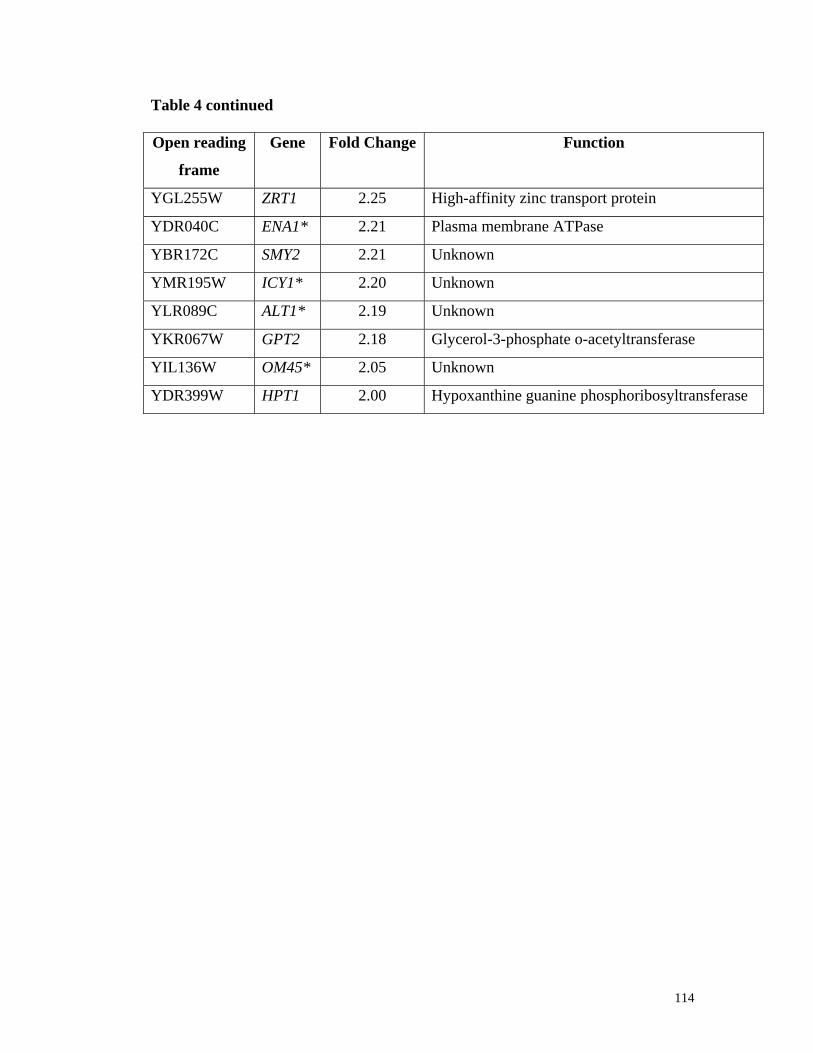
Table 4 continued Open reading
frame
Gene Fold Change Function
YGL255W ZRT1 2.25 High-affinity zinc transport protein
YDR040C ENA1* 2.21 Plasma membrane ATPase
YBR172C SMY2 2.21 Unknown
YMR195W ICY1* 2.20 Unknown
YLR089C ALT1* 2.19 Unknown
YKR067W GPT2 2.18 Glycerol-3-phosphate o-acetyltransferase
YIL136W OM45* 2.05 Unknown
YDR399W HPT1 2.00 Hypoxanthine guanine phosphoribosyltransferase
114

Table 5: Genes repressed after acclimatisation to 6% ethanol using strain BY4742 in
SC complete medium.
Open reading
frame
Gene Fold Change Function
YGR234W YHB1 2.36 Flavohaemoglobin
YOR153W PDR5 2.22 Pleiotropic multidrug resistance transporter
YHR183W GND1 2.06 6-phosphogluconate dehydrogenase
115
transcriptional elements were present amongst induced and repressed genes after
long-term exposure to ethanol, 800 base pairs of upstream sequence from the ATG
of each gene were analysed by the MATCH database at TRANSFAC
(http://www.gene-regulation.com/pub/programs.html#match). The analysis showed
that putative STRE’s, which bind transcription factors such as Msn2p and Msn4p,
had binding sites present in 14 of the 34 induced genes (Table 4). Five of these 14
genes with putative STRE’s in their promoter region, namely HSP12, HSP26, SPI1,
PYC1, and YGP1 have also been shown to be induced after one hour of 5% ethanol
stress (Chandler et al., 2004). There were no other significant numbers of
transcription factor binding sites in the induced genes detected by the computer
program, and likewise for the three repressed genes.
As there was such a low number of genes changing expression under the longer term
ethanol stress in this study compared to the existing short term ethanol shock data, it
was imperative to determine whether these genes had any common novel promoter
elements. This may determine which genes are under the control of stress
responsive-like elements in an ethanol-containing environment, and which genes
have transcriptional elements that are more specifically controlled to counteract the
stressful external environment. For this study, a motif discovery tool called the
Multiple EM for Motif Elicitation (MEME) software program was utilised
(http://meme.sdsc.edu/meme/website/meme.html). This software has been used
successfully to identify novel promoter elements that are essential for gene
expression in stressful environments (Gasch et al., 2000; Chandler et al., 2004). 800
116

base pairs of the promoter region upstream of the ATG of genes that changed
expression more than two-fold were probed against the MEME database. The default
parameters were used, and the statistical significance of each putative promoter
element analysed by MAST (the statistics program for MEME). MAST also
produces a motif diagram and detailed annotations of the motif sequence and
alignment across promoters of multiple genes. The results show that the CUP1-1 and
CUP1-2 promoter sequences contain elements that are common in both genes
(TCCAAAGCAGTAAAAGGATTCACCAGGGTTTGGAATCTGAT, AAACTCC
GACGACAACAATGATGCAGATTATAGTCAGTCGGCCGAGCCCA). This
was not unexpected, as the two genes are identical (100% identity), but did provide
evidence that the MEME program could identify promoter elements. When
investigating other genes for novel promoter elements however, there appeared to be
no common sequences present in the up- or down-regulated genes after a long-term
ethanol stress that would represent a transcriptional element.
6.3. DISCUSSION
In this study, the complete transcript profile of a Saccharomyces cerevisiae strain in
continuous fermentation exposed to 6% ethanol has been investigated. Initially, the
most striking result was the low number of genes that vary by two-fold as opposed
to findings in the existing ethanol stress literature. There were 34 genes induced by
greater than two-fold and only three genes repressed, which is a lower number of
genes compared to previous data (Alexandre et al., 2001; Chandler et al., 2004).
This may suggest that if the yeast has time to acclimatise to an ethanol stress, the
117

number of genes induced or repressed to counteract the stress is lower. It has
previously been shown that a short-term environmental stress to the cell provokes a
large transcriptional response (Alexandre et al., 2001; Causton et al., 2001; Chandler
et al., 2004; Gasch et al., 2000). Interestingly, when S. cerevisiae cells have been
exposed continually to a saline stress, the number of induced genes increases over
time (Yale and Bohnert, 2001). The type of transcripts induced altered over time,
changing from amino acid metabolism and the transport and destination of protein
synthesis genes to detoxification-related responses and fatty acid biosynthesis genes.
In this research however, a time-course approach was not taken, and the
transcriptional response of yeast over time to continuous exposure to an ethanol
stress is unknown. However, it is clear from this study that long-term exposure of S.
cerevisiae to ethanol reduced the number of genes transcribed compared to short-
term exposure of ethanol to cells. Genes with the greatest variation in transcription
levels are discussed further below.
Both Alexandre et al. (2001) and Chandler et al. (2004) have seen significant
repression of protein synthesis-related genes after a short-term ethanol stress.
Furthermore, the latter group has seen nearly 50% of the ribosomal protein genes
that were repressed after 60 minutes continue to be repressed after three hours of
sustained ethanol exposure. A similar reduction in ribosomal protein genes was not
observed in this experiment after 10-14 generations. It could be hypothesized that
protein synthesis is turned off when cells experience a sudden change in their
environment (Herruer et al., 1988; reviewed in Warner, 1989, Warner, 1999), yet
118

once the cell has acclimatised to its surroundings, protein synthesis is able to be
restored. Interestingly, the proteomics data in Chapter 4 revealed a commercial wine
strain, AWRI 838, had higher expression of ribosomal protein genes compared to the
laboratory strain S288C. Although there is no other evidence in the literature, it
could be hypothesized that wine strains are able to tolerate high ethanol
environments by not reducing protein synthesis gene expression, hence permitting
the cell to continue normal metabolic activities.
It should be noted that normalisation at the RNA level for microarray analysis
occurred in these experiments, whereas some of the other ethanol studies in the
literature normalise based on the same cell number. There are limitations however
that arise from the latter approach. By using the same cell number, the investigator
relies on the same cell breakage between samples, and RNA extraction efficiency
during RNA isolation must be the same. It has previously been shown that the effect
of an environmental stress is far greater on ribosomal protein transcription than on
rRNA transcription, and is predominantly due to transcriptional silencing of
ribosomal protein genes and rapid turn over of their transcripts after stress (Li et al.,
1999). It has also been demonstrated that this repression of ribosomal protein genes
is temporary and basal levels are reached after 60 minutes or return to a non-stressful
environment (Eisen et al., 1998), perhaps explaining why it was not noted in this
study.
119

The observation that heat shock protein genes (HSPs) were the two most induced
genes in this study is consistent with previous findings. HSPs have been expressed at
high levels in many ethanol stress experiments and have been seen to be expressed
by strains that encounter a high ethanol environment such as wine (Aranda et al.,
2002; Rossignol et al., 2003) and lager strains (Brosnan et al., 2000). Interestingly,
lager strains exhibit a stress response by inducing HSPs early in industrial ferments,
and this response is repressed as fermentation proceeds (Brosnan et al., 2000). This
may be a reflection of the acclimatisation response seen in the continuous culture
used in this study, compared to the large number and high intensity of HSPs
expression after short-term ethanol stress (7% ethanol for 30 minutes (Alexandre et
al., 2001); 5% ethanol for 180 minutes (Chandler et al., 2004)). In contrast to the
lager strain, Rossignol et al. (2003) showed a wine strain induced HSPs at the end of
the growth phase and remained highly expressed throughout fermentation, with
HSP26 the most highly induced. This suggests that HSPs do play a role in providing
ethanol tolerance to the yeast cell, and their expression is likely to be dependent on
ethanol concentration and accumulation rate during fermentation. It should be noted
that these studies with lager and wine strains to date have been from stationary
cultures, unlike the exponential growth phase cells used in the research presented
here, but highlights the usefulness of the continuous culture experiment results in
this study. Furthermore, there is still a great deal of research that needs to be carried
out to establish the role of HSPs in continual high ethanol environments such as
grape juice fermentation.
120

In this study, SPI1 was induced 5.19-fold in the ethanol exposed cells. SPI1 encodes
a cell wall protein that binds to β-1,6-glucans and β-1,3-glucans, and therefore may
act as some form of protectant to the cell during stress by covering the cell wall.
Alexandre et al. (2001) have examined the transcriptome of a laboratory strain after
a 30 minute 7% ethanol stress, but did not see SPI1 gene expression change after
stress. Further studies using a 5% ethanol stress for double the time of exposure, 60
minutes, have shown SPI1 induced 23.5-fold (Chandler et al., 2004). In addition, an
ethanol tolerant mutant of an industrial sake strain has shown increased expression
of SPI1 compared to the wild-type strain (no quantification details given, Ogawa et
al., 2000). These results, in combination with the data obtained in this chapter,
suggest that SPI1 gene expression is required over longer periods of ethanol
exposure. It could be hypothesized that SPI1 gene expression may be involved in
acquiring the yeast ethanol tolerance by coating the cell wall with additional Spi1p
protein, thereby reducing the loss of viability (Simoes et al., 2003). Further studies
are required to monitor the presence of Spi1p with continued ethanol stress, and
what particular role and function this protein has, if any, on protecting the cell
during an environmental stress.
An interesting addition in the study by Chandler et al. (2004) was to extend the
length of 5% ethanol exposure from 60 minutes to 180 minutes. This may provide
leads as to which genes are required for longer periods of exposure to ethanol stress
compared to short-term exposure. Three genes were seen to be highly induced at the
180 minute time point as well as after 10-14 generations in continuous culture in this
121

study: YRO2 (4.5-fold and 2.26-fold respectively), SNZ1 (3.1-fold and 2.57-fold),
and YLR089C (3.3-fold and 2.19-fold). The gene products of YLR089C and YRO2
have no established function, but YRO2 has homology to HSP30, encoding a heat
shock protein that was induced in both Alexandre et al. (2001) and Chandler et al.
(2004) data. Interestingly, SNZ1, a stationary phase-induced gene that is involved in
the cellular response to nutrient limitation and growth arrest, was actually repressed
in the Chandler et al. (2004) data at 60 minutes by 3.5-fold. Together with YRO2 and
YLR089C, these genes may assist in providing yeast with their ethanol tolerant
properties.
Previous investigations have shown using microarrays that transposons are up-
regulated after a stress (Alexandre et al., 2001; Morillon et al., 2000). In this study,
it was shown that 34 transposon elements were up-regulated by as much as 4.4-fold.
One possible explanation could be that transposons have very similar sequences to
each other, therefore if only one transposon is up-regulated, it will hybridise to other
transposon oligos (25 mer) hybridised on the chip. To counteract this possibility, the
DNA sequence of each of the transposons were aligned and the likelihood of cross
hybridization occurring verified. The results showed that two transposons,
YCL019W and YMR050C, were almost identical (results not shown). However, the
next most similar transposon sequences were only 60% similar. It is possible then
that the results described here are a direct result of many transposons up-regulated
after ethanol acclimatisation. It has been proposed by Morillon et al. (2000) that
122

yeast activate Ty transcription and retrotransposition to undergo adaptive mutations
that may allow the cell to adapt and survive in their stressful environment.
6.4. CONCLUSION
Previous studies have shown that there is a large transcriptional response after short-
term exposure of yeast cells to ethanol. Using cDNA microarrays, it has now been
shown that long-term exposure of S. cerevisiae to ethanol in an otherwise nutrient
rich environment results in a considerable reduction of gene expression. Importantly,
this study has eliminated the possibility of differences in cell state during
fermentation becoming an issue in such studies through use of a turbidostat, which
kept the cells at mid-exponential phase. Several of the induced genes have stress
response elements in their promoters, and are consistent with existing ethanol stress
data. In addition, genes that are not associated with a classical stress response are
likely to be fundamental to the cell for providing continued ethanol tolerance as
opposed to a short-term ethanol shock. The role and function of these genes will
need to be further investigated with deletion and overexpression studies to determine
their role in ethanol tolerance.
123

CHAPTER 7
Overall Conclusions and Future Studies
The phenotypic differences that exist between well-studied laboratory strains and
commercial wine strains of Saccharomyces cerevisiae have been established.
However, what needs to be elucidated is the genetic origins of this variation between
S. cerevisiae strains. This will promote a greater understanding of how wine strains
are able to proliferate and survive during grape juice fermentation which other
strains are unable to accomplish. For biotechnological applications, it may also lead
to the identification of genes responsible for producing metabolic components that
are consistent with good wine quality. The research undertaken demonstrates how
new technologies are invaluable for identifying differences between evolutionary
similar strains. It also provides evidence for the genes involved in long-term ethanol
stress, an environmental condition that is universal for commercial strains of S.
cerevisiae used in winemaking.
Genetic differences exist between laboratory and commercial strains of S.
cerevisiae
The use of AFLP as a tool to identify unique genetic sequences in wine strains was
successful. Due to the relatively large amount of coding sequence in yeast, an
unexpected finding was the number of non-coding sequences isolated from the wine
124

strains. Further research may ascertain the biological importance of these sequences,
however this is not practically possible at this stage. One sequence in particular
became the focus of attention after it was revealed to be of non-S. cerevisiae origin.
The identification of a naturally occurring hybrid winemaking strain between S.
cerevisiae and S. kudriavzevii identified in this study is believed to be the first of its
type. Karyotyping is necessary to confirm the chromosomal complement of these
hybrids. It raises the question as to how many other wine strains, previously
classified as S. cerevisiae, are indeed classified correctly, as new species are
uncovered over time (Naumov et al., 2000). Cross-checking of many genetic
sequences from each Saccharomyces species may help to answer this question.
Proteomics can be used to identify wine-related proteins
From the existing literature, this is the first known report of a proteomic comparison
between two S. cerevisiae strains. The 2D gels supported the genetic study by
showing differences exist between S. cerevisiae strains. By isolating and identifying
these differences, it suggests that a modified glycolytic pathway exists in a
commercial winemaking strain with the presence of a modified Fba1p and the
overexpression of isoforms of Tdh3p. This may explain the ability of wine strains to
utilise glucose more efficiently and ferment high sugar grape juices to dryness unlike
the well-studied laboratory strains. Another observation using 2D gels linked the
higher expression of a one-carbon gene in a wine strain to the strain’s metabolome.
The study of the SHM2 gene and its presence in many wine strains indicated a
correlation exists between its gene product and the metabolic profile after
125

fermentation. To investigate these hypotheses further, experiments that overexpress
the wine strain genes of interest in the laboratory strain will determine if this
provides an advantage, both to the cell in terms of growth and to the resultant
metabolites produced during fermentation. Despite the SHM2 gene having nearly
identical sequences between laboratory and wine strains, it may be the base
substitutions or other secondary factors that affect transcription. This could be tested
by a series of mutations at these sites in the promoter of the SHM2 gene in both
laboratory and wine strains.
Gene expression is reduced by S. cerevisiae after acclimatisation to ethanol
It has been shown that S. cerevisiae respond to short-term environmental stress with
many changes in gene expression (Alexandre et al., 2001; Causton et al., 2001;
Gasch et al., 2000). In this thesis, it has been demonstrated that long-term exposure
of ethanol to an otherwise nutrient-rich environment dramatically reduces the
number of genes expressed. It is anticipated that these are the genes required in wine
strains for tolerance to a high ethanol environment, which would be required by
wine strains through grape juice fermentation. Future research will study the
function of these genes more closely and identify their role in high ethanol
environments. This will be done through deletion and overexpression of the most
induced and repressed genes to determine their importance to the cell in similar
experiments used in this thesis. Finally, although this study provided a valuable link
between stress studies and the winemaking situation, it will be necessary to
determine the transcriptional response of yeast that are exposed to a constant
126

addition and accumulation of ethanol in the surrounding medium to simulate
fermentation more closely. This will ultimately impart new knowledge of the gene
expression a wine strain undertakes during the fermentation process.
Concluding remarks
As the winemaking process becomes more systematic and technical, along with the
adoption of scientific knowledge to the art of winemaking, it will be important to
provide the wine industry with sound biological knowledge of yeast strains used in
the fermentation process. To do this, it is imperative we learn more about the genes
and/or corresponding proteins that gives a wine strain its particular phenotype. In
this thesis, an exploratory comparative approach has elucidated a possible basis for
the wine yeast phenotype, including the identification of a hybrid winemaking strain
and the first known proteomic comparison of S. cerevisiae. In addition, the genes
involved in ethanol tolerance, an important winemaking strain characteristic, have
been further defined. Further research will permit the wine industry to utilise this
new found knowledge for the prediction of wine yeast attributes, it will improve
yeast fermentation properties and performance, and will also permit the tailoring of
wine styles through controlled yeast fermentation.
127
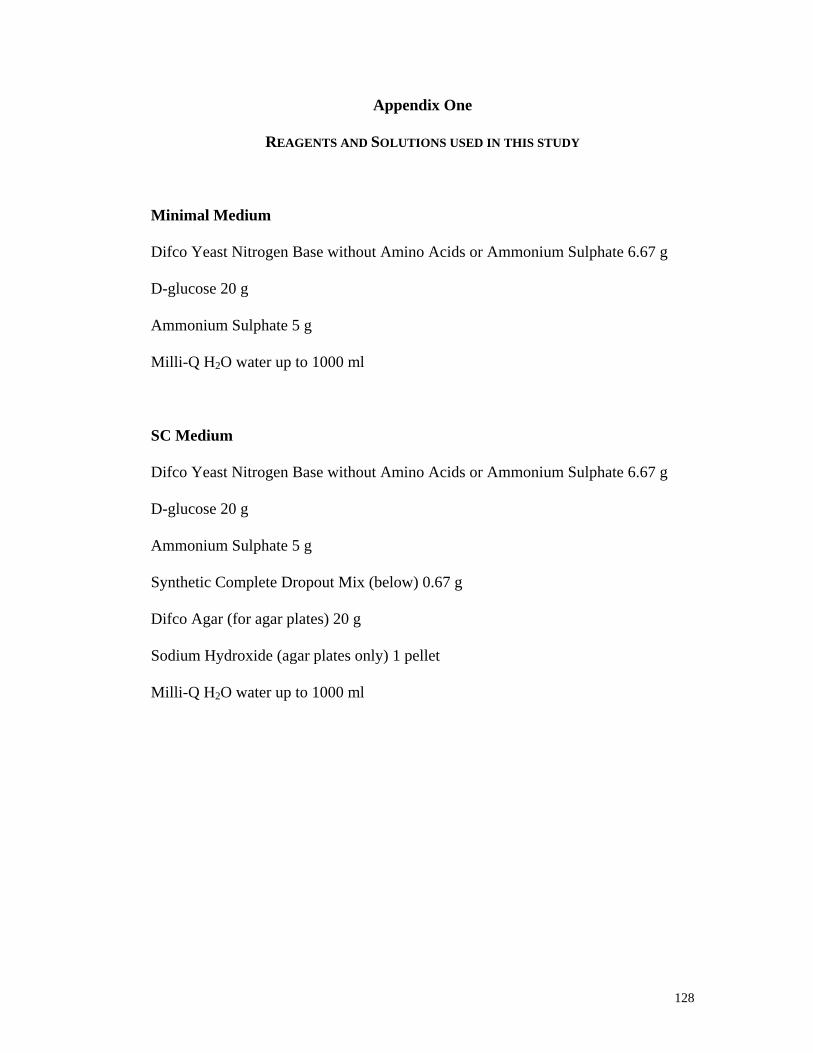
Appendix One
REAGENTS AND SOLUTIONS USED IN THIS STUDY
Minimal Medium
Difco Yeast Nitrogen Base without Amino Acids or Ammonium Sulphate 6.67 g
D-glucose 20 g
Ammonium Sulphate 5 g
Milli-Q H2O water up to 1000 ml
SC Medium
Difco Yeast Nitrogen Base without Amino Acids or Ammonium Sulphate 6.67 g
D-glucose 20 g
Ammonium Sulphate 5 g
Synthetic Complete Dropout Mix (below) 0.67 g
Difco Agar (for agar plates) 20 g
Sodium Hydroxide (agar plates only) 1 pellet
Milli-Q H2O water up to 1000 ml
128
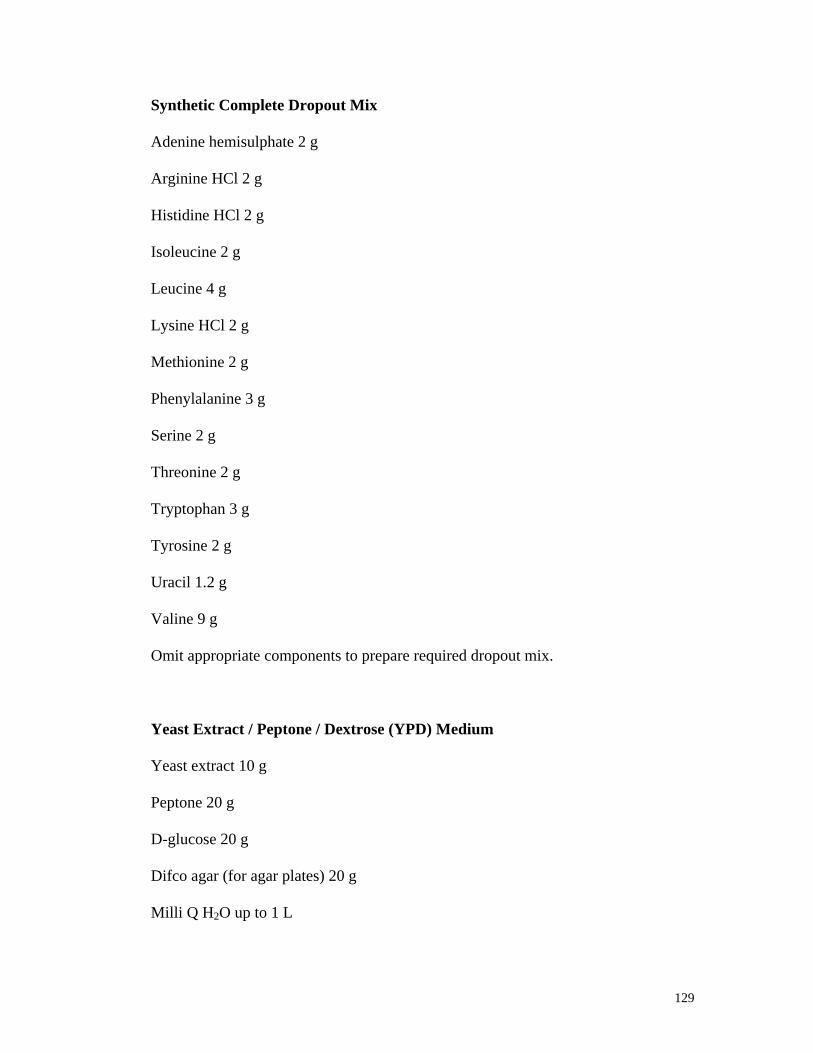
Synthetic Complete Dropout Mix
Adenine hemisulphate 2 g
Arginine HCl 2 g
Histidine HCl 2 g
Isoleucine 2 g
Leucine 4 g
Lysine HCl 2 g
Methionine 2 g
Phenylalanine 3 g
Serine 2 g
Threonine 2 g
Tryptophan 3 g
Tyrosine 2 g
Uracil 1.2 g
Valine 9 g
Omit appropriate components to prepare required dropout mix.
Yeast Extract / Peptone / Dextrose (YPD) Medium
Yeast extract 10 g
Peptone 20 g
D-glucose 20 g
Difco agar (for agar plates) 20 g
Milli Q H2O up to 1 L
129
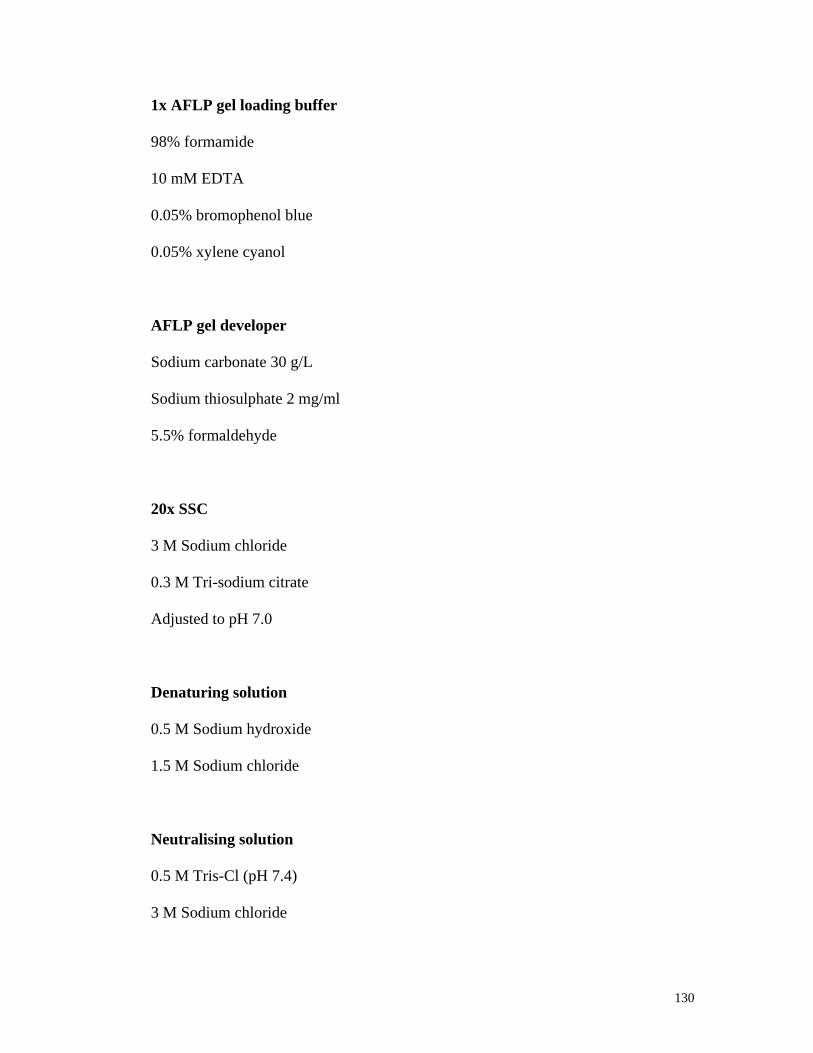
1x AFLP gel loading buffer
98% formamide
10 mM EDTA
0.05% bromophenol blue
0.05% xylene cyanol
AFLP gel developer
Sodium carbonate 30 g/L
Sodium thiosulphate 2 mg/ml
5.5% formaldehyde
20x SSC
3 M Sodium chloride
0.3 M Tri-sodium citrate
Adjusted to pH 7.0
Denaturing solution
0.5 M Sodium hydroxide
1.5 M Sodium chloride
Neutralising solution
0.5 M Tris-Cl (pH 7.4)
3 M Sodium chloride
130

10x Maelic acid solution
0.1 M Maelic acid
0.15 M Sodium chloride
CSPD detection buffer
0.1 M Tris-Cl
0.1 M Sodium chloride
Lysis Buffer
20 mM Tris-Cl (pH 7.6)
10 mM sodium fluoride
10 mM sodium pyrophosphate
0.5 mM EDTA
0.1% deoxycholate
SDS-PAGE sample buffer (5x strength)
500 mM dithiothreitol
10% (w/v) SDS
40% (v/v) glycerol
300 mM Tris-Cl (pH 6.8)
0.025% (w/v) bromophenol blue
131

Colloidal coomassie stain
40% (v/v) ethanol
7% (v/v) acetic acid
0.1% (w/v) Brilliant blue G-250
Fixative Solution
40% ethanol
10% acetic acid
Sensitising solution
0.3% sodium thiosulfate pentahydrate
30% ethanol
6.8% sodium acetate
Silver nitrate solution
0.1% silver nitrate
0.05% formaldehyde
Developer solution
3% sodium carbonate
0.025% formaldehyde
132

Destain solution
20% ethanol
7% acetic acid
Rehydration stock solution (urea)
Urea 4.8 g
CHAPS 0.2 g
DTT 100 mg
IPG Buffer (same pH range as strip) 50 µl
Bromophenol blue a few grains
Milli Q H2O up to 10 ml
Stored in aliquots at –200C
Rehydration stock solution (thiourea)
Thiourea 1.52 g
Urea 4.2 g
CHAPS 400 mg
DTT 100 mg
IPG Buffer (same pH range as strip) 200 µl
Bromophenol blue a few grains
Milli Q H2O up to 10 mls
Stored in aliquots at –200C
133

12% 2D polyacrylamide gels
5x Tris-Cl (pH 8.8) 93.3 ml
40% bis-acrylamide (C 2.6) 140 ml
10% ammonium persulphate 770 µl
TEMED 77 µl
Milli-Q H2O 233.3 ml
Tris-Cl, acrylamide and water were mixed and degassed for 20 minutes, followed by
APS and TEMED addition. Poured with gradient gel pourer.
1.5 M Tris-Cl (pH 8.8)
Tris base 181.5 g
Milli Q H2O 750 ml
HCl adjust to pH 8.8
Milli Q H2O up to 1 l
SDS equilibration buffer
1.5 M Tris-Cl (pH 8.8) 6.7 ml
Urea 72.1g
Glycerol 69 ml
SDS 4 g
Bromophenol blue a few grains
Milli Q H2O up to 200 mls
Stored at –200C
134

SDS-PAGE running buffer
Tris base 60.5 g
Glycine 288 g
SDS 20 g
Milli Q H2O up to 20 L
Agarose sealing solution
SDS-PAGE running buffer 25 ml
Agarose 200 mg
Bromophenol blue a few grains
Gel storage solution
1.5 M Tris-Cl (pH 8.8) 500 ml
10% SDS 20 ml
Milli Q H2O up to 2 L
Western transfer buffer
25 mM Tris base (pH 8.0)
192 mM glycine
20% (v/v) methanol
The pH should be 8.3. Do not add acid or base to adjust the pH.
135

TBS-T (Tris buffered saline with Tween 20)
To prepare 500 ml of 10x stock solution:
137 mM NaCl
2.7 mM KCl
25 mM Tris base (pH 8.0)
Tween 20 5 ml
Adjust the pH to 8.0 with HCl
Milli Q H2O up to 500 ml
Blocking buffer
5% (w/v) dry skim milk powder in 1x TBS-T
Ponceau S solution
0.1% (w/v) Ponceau S
5% (v/v) acetic acid
RNA buffer
0.5 M sodium chloride
0.2 M Tris-Cl (pH 7.5)
10 mM EDTA
136

Alkaline phosphatase buffer
100 mM Tris-HCl (pH 9.0)
150 mM NaCl
1 mM MgCl2
DNase reaction mix
1 M Tris (pH 7.5) 2.5 µl
25 mM MgCl2 (Perkin Elmer) 20 µl
RNase-free DNase (10 U/µl) 2 µl
RNasin (40 U/µl, Promega) 0.5 µl
PCR master mix
10x Buffer 2 µL
MgCl2 1.6 µL
dNTPs 3.2 µL
Forward primer 2 µL
Reverse primer 2 µL
DNA 1 µL
Taq polymerase 0.1 µL
Milli Q H2O 8.1 µL
137

Quantitative real-time PCR master mix
2x SYBR Green Mix (AB Gene) 10 µL
Forward primer 0.6 µL
Reverse primer 0.6 µL
DNA 1 µL
Milli Q H2O 7.8 µL
Restriction digests
Restriction buffer 2 µL
Restriction enzyme 0.2 µL
DNA 5 µL
Milli Q H2O 12.9 µL
138
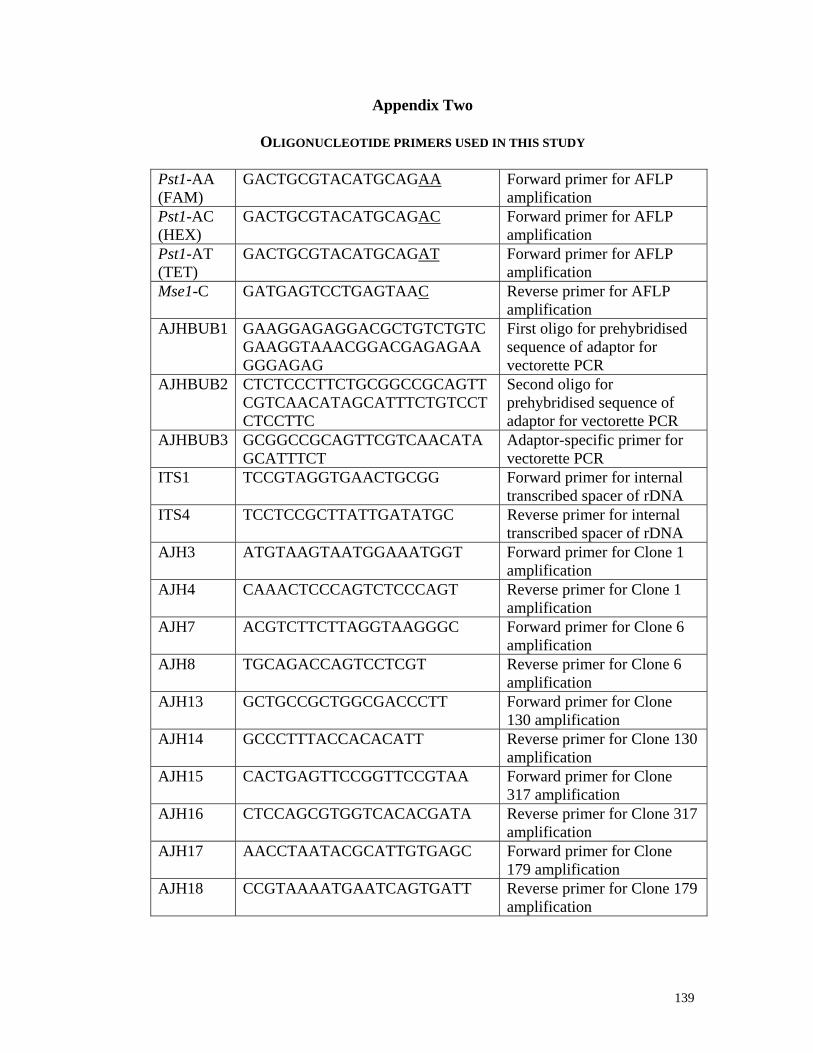
Appendix Two
OLIGONUCLEOTIDE PRIMERS USED IN THIS STUDY
Pst1-AA (FAM)
GACTGCGTACATGCAGAA Forward primer for AFLP amplification
Pst1-AC (HEX)
GACTGCGTACATGCAGAC Forward primer for AFLP amplification
Pst1-AT (TET)
GACTGCGTACATGCAGAT Forward primer for AFLP amplification
Mse1-C GATGAGTCCTGAGTAAC Reverse primer for AFLP amplification
AJHBUB1 GAAGGAGAGGACGCTGTCTGTCGAAGGTAAACGGACGAGAGAAGGGAGAG
First oligo for prehybridised sequence of adaptor for vectorette PCR
AJHBUB2 CTCTCCCTTCTGCGGCCGCAGTTCGTCAACATAGCATTTCTGTCCTCTCCTTC
Second oligo for prehybridised sequence of adaptor for vectorette PCR
AJHBUB3 GCGGCCGCAGTTCGTCAACATAGCATTTCT
Adaptor-specific primer for vectorette PCR
ITS1 TCCGTAGGTGAACTGCGG Forward primer for internal transcribed spacer of rDNA
ITS4 TCCTCCGCTTATTGATATGC Reverse primer for internal transcribed spacer of rDNA
AJH3 ATGTAAGTAATGGAAATGGT Forward primer for Clone 1 amplification
AJH4 CAAACTCCCAGTCTCCCAGT Reverse primer for Clone 1 amplification
AJH7 ACGTCTTCTTAGGTAAGGGC Forward primer for Clone 6 amplification
AJH8 TGCAGACCAGTCCTCGT Reverse primer for Clone 6 amplification
AJH13 GCTGCCGCTGGCGACCCTT Forward primer for Clone 130 amplification
AJH14 GCCCTTTACCACACATT Reverse primer for Clone 130 amplification
AJH15 CACTGAGTTCCGGTTCCGTAA Forward primer for Clone 317 amplification
AJH16 CTCCAGCGTGGTCACACGATA Reverse primer for Clone 317 amplification
AJH17 AACCTAATACGCATTGTGAGC Forward primer for Clone 179 amplification
AJH18 CCGTAAAATGAATCAGTGATT Reverse primer for Clone 179 amplification
139

Appendix Three
STRAINS USED IN THIS STUDY
Strain Strain details Reference/Source S288Ca FY833 MATa his3∆200 ura3-52
leu2∆1 lys2∆202 trp1∆63 Winston et al., 1995
S288C diploid FY2 (MATα ura3-52) x FY67 (MATa trp1∆63)
Winston et al., 1995
AWRI 729 Commercial wine yeast, UC Davis, USA
ATCC / AWRI culture collection
AWRI 796 Commercial wine yeast, identical to R107
AWRI culture collection
AWRI 825 729 yeast, Dept of Agriculture, W.A., Australia
AWRI culture collection
AWRI 838 Commercial wine yeast, isolate of EC1118
Lallemand / AWRI culture collection
AWRI 844 Commercial wine yeast, isolate of L2056
Lallemand / AWRI culture collection
AWRI 870 Winery isolate, N.S.W., Australia
AWRI culture collection
AWRI 939 S. cerevisiae sake yeast de Barros Lopes et al., 1999 / AWRI culture collection
AWRI 1017 Commercial wine yeast, isolate of R2
Petaluma, S.A. / AWRI culture collection
AWRI 1116 729 yeast, Epernay, France de Barros Lopes et al., 1999 / AWRI culture collection
T73 Wine strain isolated from Valencia region, Spain
Lallemand
Kyokai 7 Sake yeast, ATCC 26422 ATCC
UVAFERM CEG Commercial wine strain Lallemand
NCYC 2889 S. kudriavzevii type strain National Collection of Yeast Cultures, UK
CBS 1171 S. cerevisiae neotype strain Centraalbureau voor Schimmelcultures
BY4742 Parent strain of deletion collection, MATα
EUROSCARF
∆TDH1 Deletion strain of TDH1 from parent strain BY4742
EUROSCARF
∆TDH2 Deletion strain of TDH2 from parent strain BY4742
EUROSCARF
∆TDH3 Deletion strain of TDH3 from parent strain BY4742
EUROSCARF
140
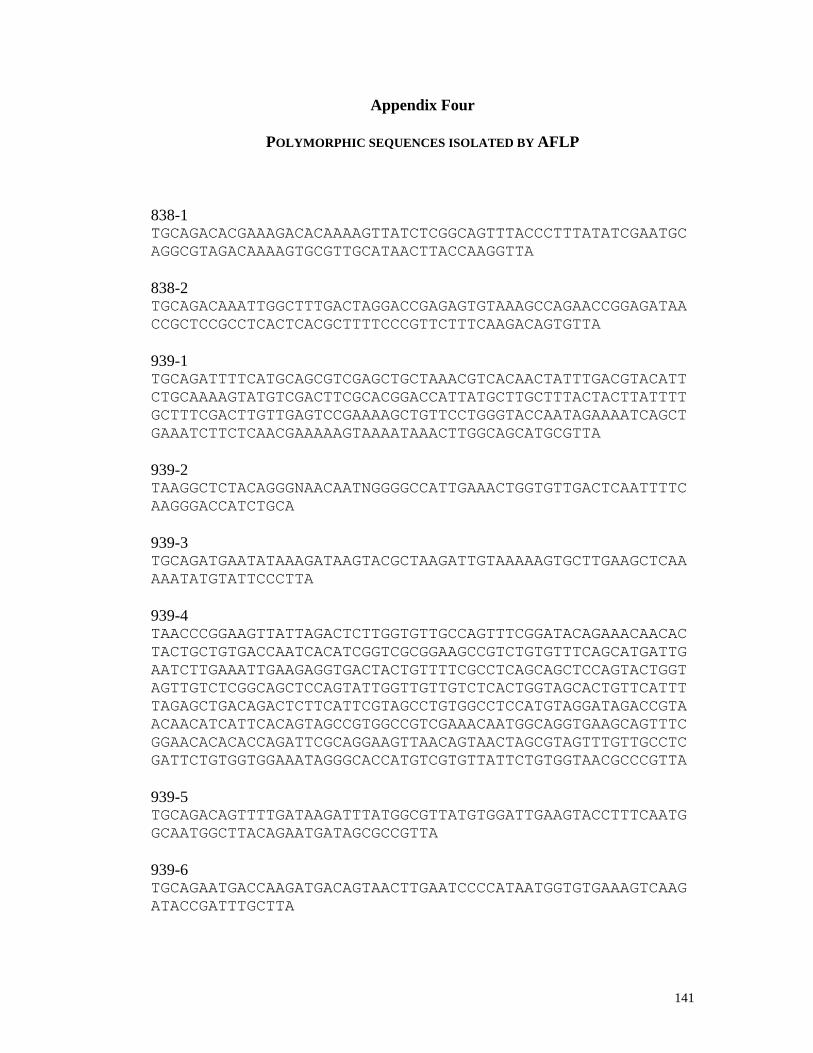
Appendix Four
POLYMORPHIC SEQUENCES ISOLATED BY AFLP
838-1 TGCAGACACGAAAGACACAAAAGTTATCTCGGCAGTTTACCCTTTATATCGAATGCAGGCGTAGACAAAAGTGCGTTGCATAACTTACCAAGGTTA 838-2 TGCAGACAAATTGGCTTTGACTAGGACCGAGAGTGTAAAGCCAGAACCGGAGATAACCGCTCCGCCTCACTCACGCTTTTCCCGTTCTTTCAAGACAGTGTTA 939-1 TGCAGATTTTCATGCAGCGTCGAGCTGCTAAACGTCACAACTATTTGACGTACATTCTGCAAAAGTATGTCGACTTCGCACGGACCATTATGCTTGCTTTACTACTTATTTTGCTTTCGACTTGTTGAGTCCGAAAAGCTGTTCCTGGGTACCAATAGAAAATCAGCTGAAATCTTCTCAACGAAAAAGTAAAATAAACTTGGCAGCATGCGTTA 939-2 TAAGGCTCTACAGGGNAACAATNGGGGCCATTGAAACTGGTGTTGACTCAATTTTCAAGGGACCATCTGCA 939-3 TGCAGATGAATATAAAGATAAGTACGCTAAGATTGTAAAAAGTGCTTGAAGCTCAAAAATATGTATTCCCTTA 939-4 TAACCCGGAAGTTATTAGACTCTTGGTGTTGCCAGTTTCGGATACAGAAACAACACTACTGCTGTGACCAATCACATCGGTCGCGGAAGCCGTCTGTGTTTCAGCATGATTGAATCTTGAAATTGAAGAGGTGACTACTGTTTTCGCCTCAGCAGCTCCAGTACTGGTAGTTGTCTCGGCAGCTCCAGTATTGGTTGTTGTCTCACTGGTAGCACTGTTCATTTTAGAGCTGACAGACTCTTCATTCGTAGCCTGTGGCCTCCATGTAGGATAGACCGTAACAACATCATTCACAGTAGCCGTGGCCGTCGAAACAATGGCAGGTGAAGCAGTTTCGGAACACACACCAGATTCGCAGGAAGTTAACAGTAACTAGCGTAGTTTGTTGCCTCGATTCTGTGGTGGAAATAGGGCACCATGTCGTGTTATTCTGTGGTAACGCCCGTTA 939-5 TGCAGACAGTTTTGATAAGATTTATGGCGTTATGTGGATTGAAGTACCTTTCAATGGCAATGGCTTACAGAATGATAGCGCCGTTA 939-6 TGCAGAATGACCAAGATGACAGTAACTTGAATCCCCATAATGGTGTGAAAGTCAAGATACCGATTTGCTTA
141

1017-1 TGCAGAACTGGTGTGATACCGGAACCACCGGCTACAATGCCTAAGTGCTTGGAGGAGTTTGGTTCGTAGTTCAAAGCACCTATTGGCCCCTTA 1017-2 TAACATCCGAACACCAAATATGCGTGGGCGCCAAACAAAGAGACAATGTAATGAGACAATGTACTGCTTGTAAACTATAACAGTATCAGCTCAATTTCAATGCCATCTACTCCAGATATCGTTGCGATTGTCCCTACAAGCCGCCTACAACGGCGTTATTGTTGTAAGCTGGTAAAATGCAGTGCGTTCCCCCGTTGTGAGTTCGGGCCAAAATTACTTGGCTGGGAGTTCCGTCCGTACAGTTGTGGCTTGCTGCCTAGACTTAGGCGGACGCGGCGGCAATTACCCCTGGGTTCTCTCTAGAGCTGGAGAGACATTCTTGGTAACCGAAGGGAAAACCCGGAAAGAAAATTTGGAATCCCGTTA 1017-3 TGCAGACCGTTTCGGCGACCATAACTTGGGTGATGATGATGATGCTGATTTCGAAAAACGGGTGAATCGTAATGAAATAACCGCTATCGACAACAGTAGTTCTGCCAATAATACAGATGTCACAGGTAGCACGAGTGATAGAACAGAGCTAAGTCACCCCGACGTGACACCGAAAGATTCAAATGGACCTGTTA 1017-4 TAACCCAAACAATGAGATCTTCATTCTTTTTTTTACCTCAGCTATGACTTGCAGTGCTTTGTATCATACCGCTCGTTTGGTCGTGCTATTTGTAACAATGAACCTCGTTACCCCGAACAAAAAAAAATGAGATATTGAACGCCGCAGCTCATCATGGTAGAATGATGTAGCTAATACCAAAATAAGTTATATTTAGAATGTTGGATATATCAGTTGCGTTAGACTAATCGTTCTAGAAGGATACAGAACTTGGAAAGATCTTTGAACGTATCGTGACTGCGTGCTTGCTTTATTTGCCGTTGATTTTTTGCTATGACATGCCTAATTTTATGGTATCTGTGGCTCCATATCAACTCTTCCAGTTA 1017-5 TGCAGACGGTTCAATAAGGGGTTGGGACGCAAACGACTACTCTAGAAAATTTTCCTACCATCATACCAATTTGAGTGCAATTACCACATTTTATGCATCGGATAATATTTTGGTGAGTGGGTCGGAAAATCAGTTCAATATCTATAATCTACGGAGTGGGAAATTGGTCCACGCAAATATTCTAAAAGATGCTGATCAGATTTGGTCGGTTA 1017-6 TGCAGAACCAAAGGCGAAGAGAGCTAAGACGGGCAGTGCATCTACCGTGAAAGGGAGCGTCGACCTAGAAAAATTAGCGTTCGGATTGACTAAACTAAATGAAGATGACCTGGTTGGTGTTGTTCAAATGGTTACCGACAATAAAACACCAGAAATGAACGTGACGAATAATGTTGAAGGGGGTGAATTTATAATTGACCTGTATAGTTTACCTGAGGGATTATTGAAAAGTCTATGGGACTACGTTA
142

1017-7 TAACTAGAGGCGGTTTATTAGGGAATTCTTGAGCAGCTCTTTCGGAATTCTGATAACGGATAGCGACTTCGTCCTCAACGTAAATGATTGGAATAGTATGTCCTCTACTGTCGACGATTTGCTTCTTATGTAGAACTTCTTGTAATCTTTTGTAAAATTTTTGAGTCTTTGGGTTAGGGCCATTGATTCCGATGGCATTCGGTTGACAGCTTTGAATGATATTATCCAAGGTGTCTTCAAATTTTTCAGGATTCGTCTTATCAAATGGATTGTCGACAATCTTGTAATCTCTTATAAAATCACCCTTTCTGTTGACGTTAGACAACAATTATAGCGTCGGCTCCGAATCTACCCTGTCCACANGTTA 1017-8 TACAGACTTATGAACAAGATAAGTTCAAAGAAATGACAGACGATGTGAAGAAAGCGGGCGCAGATGTTGTTATATGCCAATGGGGGTTTGACGATGAGGCCAATCATCTACTTCTACAGAATGATTTACCTGCCGTAAGATGGGTAGGTGGCCAAGAACTAGAACACATTGCCATTTCCACAAACGGTCGCATTGTTCCAAGATTTCAAGACTTGTCTAAGGATAAATTAGGTACATGTTCCACAATTTACGAGCAGGAGTTTGGTACTACTAAGGATCGTATGCTGATTATCGAGCAAAGTTA 1017-9 TAACGACAGGTCCGATGTTCCAGAACTGTTGAATTTTGAATGCGGTGCGGATTATGTGAAGACTAACCAGAGATTACCCAAGGGTCTTTCTCCATCCTCGTTTGATTCGCTATATTGCTCCTTTGATGGTGACGCAGACAGGGTTGTGTTCTACTATGTCGACTCAGGATCAAAATTTCATTTGTTGGATGGTGACAAAATTTCCACTTTGTTTGCAAAGTTCTTGTCTAAACAACTAGAATTGGCACACCTAGAACATTCTTTGAAGATTGGTGTTGTGCAAACCGCCTATGCAAACGGCAGTTCCACCGCTTACATAAAAAATACGTTGCACTGTCCCCGTGTCTTGCACTAAGACAGGTTGTTA 1017-10 TAAGCAAAGAAAAGAATAAGAAAAAGAAAAAGTATGTGAAGGGTATAGACGAACAAAAAGGAAATCATTGAATTTATGGCATTTGATTGACGTTCCTGTTTGGTTCTGCA 1116-1 TGCAGACATCAAATATGTAAGTAATGGAAATGGTCACCAGGCGCAACAAAAAGAGAGACAACCAGAATCTGAAAATCCGCCTAGAGAGAATGCACAGAAGTCGAATACGTCCAGCCAGGGTCGAGCTCCCTCTTCTCAGGGCATGCCTAAACAGTTCCATAGAAAATCACTGGGAGACTGGGAGTTTGTTGAAACGGTGGGCGCAGGTTCTATGGGAAAGGTTA 1116-2 TGCAGACAACCTAATACGCATTGTGAGCGCTGTTTTCCTCATCATATCGATAGGCCTAATCGGCGGCTTGATGGACACACAAACAAACGGTAGTTCCCGAGTGAACTTTTGTATGTTTGCCGCGGCTTACGGTCTAATCACTGATTCATTTTACGGGTTTTTGGCAAATTTTTGGTCATCGTTA 1116-3 TGCAGAATGGTACTGCTGTCCCCGTTTCTGTCTATGCGCCCTGGGATATCACTAACGCAGCATTCACCTTAGACACAATCCAGAAATATCTACCTCTTTTGGAGTCTTATTTCAAGTGTTCGTATCCTCTGCCCAAGTTGGATTTCGTTCTACTGCCATACTTA
143

1116-4 TGCAGACCAGTCCTCGTCTTCAATGCTCCAAGCTTTGCAAATTACCAGTAACAACGACGTTTTCTAATATGGAACCGTTTGGAATATCTATTTTGTGACCGTCTGAGCAAACAATAATGACAGTGCCCCTCAAGGTGACGCCCTTACCTAAGAAGACGTTACCGGTAATGGTCAAGTGGTCTAGTTCAACAATCTTCGGGATGTGAGGGATTCTTGCGTTA 1116-5 TGCAGAATCAGTTGGTGCCGATAAACGCAAGAGTCACGATCGACACAATAACAAGAAAAATCGTACCCCCTCAGGAGGCCTACGGTGATTTTATAGGATTGGACTCGCACTATGGATACCACACTCGTATAGCGTCATCATTCACAGACTTGTTCATGAAGGGCCCCTTA 1116-6 TGCAGATGGCTAGAAGACTTCTGCAACTGTATGTCCATCTTCATTCGTGGGAACTCCAAGCGCGAACAATCTGTATGCTGTTTCGGGCTACTTATTGCTCCATACGGTTTGTAATGGACACGGACTCTTGCATTTGCTATATATATGCCTTA 1116-7 TGCAGAAACTGATCCTGGTGTTCTTTCTGTCAAGAAGATATACACCTACTATAAGAAGCACGGCTATGCTACTGAGGTGATGGCGGCTTCCTTTAGAAATCTAGGCGAGTTGAAGGCCTTAGCGGGGATCGATGACATGACTCTACCTCTGAACATTTTGGAACAGTTATATGAGTCCACAGACCCTATTGAAAATATCTTGAACACTGAAACTGCTAAGCAGGAAGGTGTTGAGAAAGTCACTTTCATTAGCGACGAACCCCACTTTAGATATGTCCTAAATGAAGATCAAATGGCTACAGAAAAACTATCTGATGGCATCAGAAAATTCTCTGAAGACATTGAAGCGCTATATAAGCTGGTTA 1116-8 TGCAGAACGTGGTTGTGGCCAGCAGATGCCAGGGCTGATAAATAATGCCAAGCACAAAGGTCCAGGCGAACCCAATGAAATCATAAATCCCAATTACATGGGGGAATGGCATCCACCGGAAATTGAAAACCCGCTATACTACGAAGAGCAGCACCCATTGCGCATCGAAAACGTTATCAGTGGTGTGATCCTCGAATTTTGGAGTGGATCTCCAAACATGTTGATAACCAACATTTATGTTGGTAAAAATGTAACAGAG 1116-9 TAAGGTCGTAAACGACTGCTTACTCAGGGNAGATCTCCGAAAACGGCAATTGCTGTGCA
144

Appendix Five
ISOELECTRIC FOCUSING PROGRAMS FOR DIFFERENT PH STRIPS
pH of IEF strip Program used for IEF 3.5-4.5 30V x 12 h (active rehydration); 500V x 1 h; 1000V x 1
h; 8000V x 7.5 h. Total: 61,860Vhrs 5-6 30V x 12 h (active rehydration); 500V x 1 h; 1000V x 1
h; 8000V x 7.5 h. Total: 61,860Vhrs 4-7 30V x 12 h (active rehydration); 500V x 1 h; 1000V x 1
h; 8000V x 7.5 h. Total: 61,860Vhrs 6-11 Waite Campus: 30V x 12 h (active rehydration); 500V
x 1 h; 1000V x 1 h; 8000V for 32,000Vhrs. Total: 33,860Vhrs APAF: 100V x 3h; 300V x 3h; 600V x 2h; 1000V x 2h; 2500V x 1 h; 5000V x 5h. Total: 31,900Vhrs
3-10 NL 30V x 12 h (active rehydration); 500V x 1 h; 1000V x 1 h; 8000V for 32,000Vhrs. Total: 33,860Vhrs
145

Appendix Six
pGEM-T vector used for cloning of AFLP polymorphic fragments.
As Taq polymerase was used in PCR reactions, T-A cloning was possible at the
linearisation site in the multiple cloning site of pGEM-T.
146

Bibliography
Aarts, H.J., van Lith, L.A. and Keijer, J. (1998). High-resolution genotyping of
Salmonella strains by AFLP-fingerprinting. Lett Appl Microbiol. 26: 131-5.
Akhtar, N., Blomberg, A. and Adler, L. (1997). Osmoregulation and protein
expression in a pbs2∆ mutant of Saccharomyces cerevisiae during adaptation to
hypersaline stress. FEBS Lett. 403: 173-80.
Alexandre, H., Rousseaux, I. and Charpentier, C. (1994). Relationship between
ethanol tolerance, lipid composition and plasma membrane fluidity in
Saccharomyces cerevisiae and Kloeckera apiculata. FEMS Microbiol Lett. 124: 17-
22.
Alexandre, H., Ansanay-Galeote, V., Dequin, S. and Blondin, B. (2001). Global
gene expression during short-term ethanol stress in Saccharomyces cerevisiae. FEBS
Lett. 498: 98-103.
Allen, J., Davey, H.M., Broadhurst, D., Heald, J.K., Rowland, J.J., Oliver, S.G. and
Kell, D.B. (2003). High-throughput classification of yeast mutants for functional
genomics using metabolic footprinting. Nat Biotechnol. 21: 692-6.
147

Andre, L., Hemming, A. and Adler, L. (1991). Osmoregulation in Saccharomyces
cerevisiae. Studies on the osmotic induction of glycerol production and glycerol-3-
phosphate dehydrogenase (NAD+). FEBS Lett. 286: 13-17.
Ansell, R., Granath, K., Hohmann, S., Thevelein, J.M. and Adler, L. (1997). The two
isoenzymes for yeast NAD+-dependent glycerol 3-phosphate dehydrogenase
encoded by GPD1 and GPD2 have distinct roles in osmoadaptation and redox
regulation. EMBO J. 16: 2179-87.
Aranda, A., Querol, A. and del Olmo, M. (2002). Correlation between acetaldehyde
and ethanol resistance and expression of HSP genes in yeast strains isolated during
the biological aging of sherry wines. Arch Microbiol. 177: 304-12.
Arnold, C., Metherell, L., Clewley, J.P. and Stanley, J. (1999). Predictive modelling
of fluorescent AFLP: a new approach to the molecular epidemiology of E. coli. Res
Microbiol. 150: 33-44.
Attfield, P.V. (1997). Stress tolerance: the key to effective strains of industrial
baker's yeast. Nat Biotechnol. 15: 1351-7.
Ausubel, F.M., Brent, R., Kingston, R.E., Moore, D.D., Seidman, J.G., Smith, J.A.,
and Struhl, K. (1994). Current Protocols in Molecular Biology, John Wiley & Sons
Inc., New York.
148

Azumi, M. and Goto-Yamamoto, N. (2001). AFLP analysis of type strains and
laboratory and industrial strains of Saccharomyces sensu stricto and its application
to phenetic clustering. Yeast. 18: 1145-54.
Bell, P.J., Higgins, V.J. and Attfield, P.V. (2001). Comparison of fermentative
capacities of industrial baking and wild-type yeasts of the species Saccharomyces
cerevisiae in different sugar media. Lett Appl Microbiol. 32: 224-9.
Betz, C., Schlenstedt, G. and Bailer, S.M. (2004). Asr1p, a novel yeast ring/PHD
finger protein, signals alcohol stress to the nucleus. J Biol Chem. 279(27): 28174-81.
Bidenne, C., Blondin, B., Dequin, S. and Vezinhet, F. (1992). Analysis of the
chromosomal DNA polymorphism of wine strains of Saccharomyces cerevisiae.
Curr Genet. 22: 1-7.
Blomberg, A. and Adler, L. (1989). Roles of glycerol and glycerol-3-phosphate
dehydrogenase (NAD+) in acquired osmotolerance of Saccharomyces cerevisiae. J
Bacteriol. 171: 1087-92.
Blomberg, A. (1995). Global changes in protein synthesis during adaptation of the
yeast Saccharomyces cerevisiae to 0.7 M NaCl. J Bacteriol. 177: 3563-72.
149

Boles, E., de Jong-Gubbels, P. and Pronk, J.T. (1998). Identification and
characterization of MAE1, the Saccharomyces cerevisiae structural gene encoding
mitochondrial malic enzyme. J Bacteriol. 180: 2875-82.
Boucherie, H., Bataille, N., Fitch, I.T., Perrot, M. and Tuite, M.F. (1995a).
Differential synthesis of glyceraldehyde-3-phosphate dehydrogenase polypeptides in
stressed yeast cells. FEMS Microbiol Lett. 125: 127-33.
Boucherie, H., Dujardin, G., Kermorgant, M., Monribot, C., Slonimski, P. and
Perrot, M. (1995b). Two-dimensional protein map of Saccharomyces cerevisiae:
construction of a gene-protein index. Yeast. 11: 601-13.
Boucherie, H., Sagliocco, F., Joubert, R., Maillet, I., Labarre, J. and Perrot, M.
(1996). Two-dimensional gel protein database of Saccharomyces cerevisiae.
Electrophoresis. 17: 1683-99.
Brewster, J.L., de Valoir, T., Dwyer, N.D., Winter, E. and Gustin, M.C. (1993). An
osmosensing signal transduction pathway in yeast. Science. 259: 1760-3.
Brosnan, M.P., Donnelly, D., James, T.C. and Bond, U. (2000). The stress response
is repressed during fermentation in brewery strains of yeast. J Appl Microbiol. 88:
746-55.
150

Carlson, M., Osmond, B.C. and Botstein, D. (1981). Mutants of yeast defective in
sucrose utilization. Genetics. 98: 25-40.
Carlson, M. and Botstein, D. (1983). Organization of the SUC gene family in
Saccharomyces. Mol Cell Biol. 3: 351-9.
Carrasco, P., Querol, A. and del Olmo, M. (2001). Analysis of the stress resistance
of commercial wine yeast strains. Arch Microbiol. 175: 450-7.
Casaregola, S., Nguyen, H.V., Lapathitis, G., Kotyk, A. and Gaillardin, C. (2001).
Analysis of the constitution of the beer yeast genome by PCR, sequencing and
subtelomeric sequence hybridization. Int J Syst Evol Microbiol. 51: 1607-18.
Casey, G.P. and Ingledew, W.M. (1986). Ethanol tolerance in yeasts. Crit Rev
Microbiol. 13: 219-80.
Causton, H.C., Ren, B., Koh, S.S., Harbison, C.T., Kanin, E., Jennings, E.G., Lee,
T.I., True, H.L., Lander, E.S. and Young, R.A. (2001). Remodeling of yeast genome
expression in response to environmental changes. Mol Biol Cell. 12: 323-37.
Cavalieri, D., Townsend, J.P. and Hartl, D.L. (2000). Manifold anomalies in gene
expression in a vineyard isolate of Saccharomyces cerevisiae revealed by DNA
microarray analysis. Proc Natl Acad Sci USA. 97: 12369-74.
151

Chandler, M., Stanley, G.A., Rogers, P. and Chambers, P. (2004). A genomic
approach to defining the ethanol stress response in the yeast Saccharomyces
cerevisiae. Annals of Microbiology. 54(4): 75-102.
Chatton, B., Walter, P., Ebel, J.P., Lacroute, F. and Fasiolo, F. (1988). The yeast
VAS1 gene encodes both mitochondrial and cytoplasmic valyl-tRNA synthetases. J
Biol Chem. 263: 52-7.
Cherry, J.M., Ball, C., Weng, S., Juvik, G., Schmidt, R., Adler, C., Dunn, B.,
Dwight, S., Riles, L., Mortimer, R.K. and Botstein, D. (1997). Genetic and physical
maps of Saccharomyces cerevisiae. Nature. 387: 67-73.
Chi, Z. and Arneborg, N. (1999). Relationship between lipid composition, frequency
of ethanol-induced respiratory deficient mutants, and ethanol tolerance in
Saccharomyces cerevisiae. J Appl Microbiol. 86: 1047-52.
Cliften, P., Sudarsanam, P., Desikan, A., Fulton, L., Fulton, B., Majors, J.,
Waterston, R., Cohen, B.A., and Johnston, M. (2001). Surveying Saccharomyces
genomes to identify functional elements by comparative DNA sequence analysis.
Genome Res. 11(7): 1175-86.
152

Coote, P.J., Jones, M.V., Seymour, I.J., Rowe, D.L., Ferdinando, D.P., McArthur,
A.J. and Cole, M.B. (1994). Activity of the plasma membrane H(+)-ATPase is a key
physiological determinant of thermotolerance in Saccharomyces cerevisiae.
Microbiology. 140: 1881-90.
Corthals, G.L., Molloy, M.P., Herbert, B.R., Williams, K.L. and Gooley, A.A.
(1997). Prefractionation of protein samples prior to two-dimensional electrophoresis.
Electrophoresis. 18: 317-23.
de Barros Lopes, M., Rainieri, S., Henschke, P.A. and Langridge, P. (1999). AFLP
fingerprinting for analysis of yeast genetic variation. Int J Syst Bacteriol. 49: 915-
24.
de Barros Lopes, M., Bellon, J.R., Shirley, N.J. and Ganter, P.F. (2002). Evidence
for multiple interspecific hybridization in Saccharomyces sensu stricto species.
FEMS Yeast Res. 1: 323-31.
Delgado, M.L., O'Connor, J.E., Azorin, I., Renau-Piqueras, J., Gil, M.L. and
Gozalbo, D. (2001). The glyceraldehyde-3-phosphate dehydrogenase polypeptides
encoded by the Saccharomyces cerevisiae TDH1, TDH2 and TDH3 genes are also
cell wall proteins. Microbiology. 147: 411-7.
153

Delneri, D., Colson, I., Grammenoudi, S., Roberts, I.N., Louis, E.J. and Oliver, S.G.
(2003). Engineering evolution to study speciation in yeasts. Nature. 422: 68-72.
Dohlman, H.G. and Thorner, J.W. (2001). Regulation of G protein-initiated signal
transduction in yeast: Paradigms and Principles. Annu Rev Biochem. 70: 703-754.
Duggan, D.J., Bittner, M., Chen, Y., Meltzer, P. and Trent, J.M. (1999). Expression
profiling using cDNA microarrays. Nat Genet. 21: 10-4.
Eisen, M.B., Spellman, P.T., Brown, P.O. and Botstein, D. (1998). Cluster analysis
and display of genome-wide expression patterns. Proc Natl Acad Sci USA. 95:
14863-8.
Esteve-Zarzoso, B., Belloch, C., Uruburu, F. and Querol, A. (1999). Identification of
yeasts by RFLP analysis of the 5.8S rRNA gene and the two ribosomal internal
transcribed spacers. Int J Syst Bacteriol. 49: 329-37.
Fleet, G.H. and Heard, G.M. (1993). Yeasts: growth during fermentation. In: Fleet,
G.H. (ed). Wine microbiology and biotechnology. Harwood Academic Publishers,
Chur, Switzerland.
Futcher, B., Latter, G.I., Monardo, P., McLaughlin, C.S. and Garrels, J.I. (1999). A
sampling of the yeast proteome. Mol Cell Biol. 19: 7357-68.
154

Ganter, P.F. and de Barros Lopes, M. (2000). The use of anonymous DNA markers
in assessing worldwide relatedness in the yeast species Pichia kluyveri Bedford and
Kudrjavzev. Can J Microbiol. 46: 967-80.
Garay-Arroyo, A., Covarrubias, A.A., Clark, I., Nino, I., Gosset, G. and Martinez,
A. (2004). Response to different environmental stress conditions of industrial and
laboratory Saccharomyces cerevisiae strains. Appl Microbiol Biotechnol. 63: 734-
41.
Garrels, J.I., Futcher, B., Kobayashi, R., Latter, G.I., Schwender, B., Volpe, T.,
Warner, J.R. and McLaughlin, C.S. (1994). Protein identifications for a
Saccharomyces cerevisiae protein database. Electrophoresis. 15: 1466-86.
Gasch, A.P., Spellman, P.T., Kao, C.M., Carmel-Harel, O., Eisen, M.B., Storz, G.,
Botstein, D. and Brown, P.O. (2000). Genomic expression programs in the response
of yeast cells to environmental changes. Mol Biol Cell. 11: 4241-57.
Gecz, J., Bielby, S., Sutherland, G.R. and Mulley, J.C. (1997). Gene structure and
subcellular localization of FMR2, a member of a new family of putative
transcription activators. Genomics. 44: 201-13.
Groth, C., Hansen, J. and Piskur, J. (1999). A natural chimeric yeast containing
genetic material from three species. Int J Syst Bacteriol. 49: 1933-8.
155

Guerzoni, M.E., Ferruzzi, M., Gardini, F. and Lanciotti, R. (1999). Combined effects
of ethanol, high homogenization pressure, and temperature on cell fatty acid
composition in Saccharomyces cerevisiae. Can J Microbiol. 45: 805-10.
Gygi, S.P., Rochon, Y., Franza, B.R. and Aebersold, R. (1999). Correlation between
protein and mRNA abundance in yeast. Mol Cell Biol. 19: 1720-30.
Hauf, J., Zimmermann, F.K. and Muller, S. (2000). Simultaneous genomic
overexpression of seven glycolytic enzymes in the yeast Saccharomyces cerevisiae.
Enzyme Microb Technol. 26: 688-698.
Hauser, N.C., Felleberg, K., Gil, R., Bastuck, S., Hoheisel, J.D. and Perez-Ortin, J.E.
(2001). Whole genome analysis of a wine yeast strain. Comparative and Functional
Genomics. 2: 69-79.
Heinrich, A.J., Bellon, J.R., Kuchel, B., Jiranek, V., Ganter, P.F. and de Barros
Lopes, M. (2005). Comparative genome analysis of Saccharomyces cerevisiae
S288C with laboratory and commercial strains. Manuscript in preparation.
Heipieper, H.J., Isken, S. and Saliola, M. (2000). Ethanol tolerance and membrane
fatty acid adaptation in adh multiple and null mutants of Kluyveromyces lactis. Res
Microbiol. 151: 777-84.
156

Herruer, M.H., Mager, W.H., Raue, H.A., Vreken, P., Wilms, E. and Planta, R.J.
(1988). Mild temperature shock affects transcription of yeast ribosomal protein
genes as well as the stability of their mRNAs. Nucleic Acids Res. 16: 7917-29.
Heukeshoven, J. and Dernick, R. (1988). Improved silver staining procedure for fast
staining in PhastSystem Development Unit. I. Staining of sodium dodecyl sulfate
gels. Electrophoresis. 9: 28-32.
Hoving, S., Gerrits, B., Voshol, H., Muller, D., Roberts, R.C. and van Oostrum, J.
(2002). Preparative two-dimensional gel electrophoresis at alkaline pH using narrow
range immobilized pH gradients. Proteomics. 2: 127-34.
Hu, Y., Wang, G., Chen, G.Y., Fu, X. and Yao, S.Q. (2003). Proteome analysis of
Saccharomyces cerevisiae under metal stress by two-dimensional differential gel
electrophoresis. Electrophoresis. 24: 1458-70.
Janssen, P., Maquelin, K., Coopman, R., Tjernberg, I., Bouvet, P., Kersters, K. and
Dijkshoorn, L. (1997). Discrimination of Acinetobacter genomic species by AFLP
fingerprinting. Int J Syst Bacteriol. 47: 1179-87.
157

Jiang, S.C., Matte, M., Matte, G., Huq, A. and Colwell, R.R. (2000). Genetic
diversity of clinical and environmental isolates of Vibrio cholerae determined by
amplified fragment length polymorphism fingerprinting. Appl Environ Microbiol.
66: 148-53.
Joubert, R., Brignon, P., Lehmann, C., Monribot, C., Gendre, F. and Boucherie, H.
(2000). Two-dimensional gel analysis of the proteome of lager brewing yeasts.
Yeast. 16: 511-22.
Joubert, R., Strub, J.M., Zugmeyer, S., Kobi, D., Carte, N., Van Dorsselaer, A.,
Boucherie, H. and Jaquet-Guffreund, L. (2001). Identification by mass spectrometry
of two-dimensional gel electrophoresis-separated proteins extracted from lager
brewing yeast. Electrophoresis. 22: 2969-82.
Kastanos, E.K., Woldman, Y.Y. and Appling, D.R. (1997). Role of mitochondrial
and cytoplasmic serine hydroxymethyltransferase isozymes in de Novo purine
synthesis in Saccharomyces cerevisiae. Biochemistry. 36: 14956-64.
Kodama, K. (1993) In The Yeasts, Vol. 3 (Ed: Harrison, A.H.R.a.J.S.) Academic
Press, London, United Kingdom, pp. 129-168.
158

Lamb, A., Tibbetts, M. and Hammond, C.I. (1991). The product of the KIN1 locus in
Saccharomyces cerevisiae is a serine/threonine-specific protein kinase. Yeast. 7:
219-28.
Lee, B.N. and Elion, E.A. (1999). The MAPKKK Ste11 regulates vegetative growth
through a kinase cascade of shared signaling components. Proc Natl Acad Sci USA.
96: 12679-84.
Li, B., Nierras, C.R. and Warner, J.R. (1999). Transcriptional elements involved in
the repression of ribosomal protein synthesis. Mol Cell Biol. 19: 5393-404.
Lindquist, S. and Kim, G. (1996). Heat-shock protein 104 expression is sufficient for
thermotolerance in yeast. Proc Natl Acad Sci USA. 93: 5301-6.
Lucero, P., Penalver, E., Moreno, E. and Lagunas, R. (2000). Internal trehalose
protects endocytosis from inhibition by ethanol in Saccharomyces cerevisiae. Appl
Environ Microbiol. 66: 4456-61.
Lucock, M. and Daskalakis, I. (2000). New perspectives on folate status: a
differential role for the vitamin in cardiovascular disease, birth defects and other
conditions. Br J Biomed Sci. 57: 254-60.
159

Maeda, T., Takekawa, M. and Saito, H. (1995). Activation of yeast PBS2 MAPKK
by MAPKKKs or by binding of an SH3-containing osmosensor. Science. 269: 554-
8.
Mansure, J.J., Panek, A.D., Crowe, L.M. and Crowe, J.H. (1994). Trehalose inhibits
ethanol effects on intact yeast cells and liposomes. Biochim Biophys Acta. 1191:
309-16.
Martinez-Pastor, M.T., Marchler, G., Schuller, C., Marchler-Bauer, A., Ruis, H. and
Estruch, F. (1996). The Saccharomyces cerevisiae zinc finger proteins Msn2p and
Msn4p are required for transcriptional induction through the stress response element
(STRE). EMBO J. 15: 2227-35.
Masneuf, I., Hansen, J., Groth, C., Piskur, J. and Dubourdieu, D. (1998). New
hybrids between Saccharomyces sensu stricto yeast species found among wine and
cider production strains. Appl Environ Microbiol. 64: 3887-92.
Matzke, M.A., Scheid, O.M. and Matzke, A.J. (1999). Rapid structural and
epigenetic changes in polyploid and aneuploid genomes. Bioessays. 21: 761-7.
McAlister, L. and Holland, M.J. (1985). Differential expression of the three yeast
glyceraldehyde-3-phosphate dehydrogenase genes. J. Biol. Chem. 260: 15019-27.
160

McNeil, J.B., McIntosh, E.M., Taylor, B.V., Zhang, F.R., Tang, S. and Bognar, A.L.
(1994). Cloning and molecular characterization of three genes, including two genes
encoding serine hydroxymethyltransferases, whose inactivation is required to render
yeast auxotrophic for glycine. J Biol Chem. 269: 9155-65.
Meiron, H., Nahon, E. and Raveh, D. (1995). Identification of the heterothallic
mutation in HO-endonuclease of S. cerevisiae using HO/ho chimeric genes. Curr
Genet. 28: 367-73.
Michels, C.A., Read, E., Nat, K. and Charron, M.J. (1992). The telomere-associated
MAL3 locus of Saccharomyces is a tandem array of repeated genes. Yeast. 8: 655-
65.
Mireau, H., Lancelin, D. and Small, I.D. (1996). The same Arabidopsis gene
encodes both cytosolic and mitochondrial alanyl-tRNA synthetases. Plant Cell. 8:
1027-39.
Morillon, A., Springer, M. and Lesage, P. (2000). Activation of the Kss1 invasive-
filamentous growth pathway induces Ty1 transcription and retrotransposition in
Saccharomyces cerevisiae. Mol Cell Biol. 20: 5766-76.
161

Munroe, D.J., Haas, M., Bric, E., Whitton, T., Aburatani, H., Hunter, K., Ward, D.
and Housman, D.E. (1994). IRE-bubble PCR: a rapid method for efficient and
representative amplification of human genomic DNA sequences from complex
sources. Genomics. 19: 506-14.
Natsoulis, G., Hilger, F. and Fink, G.R. (1986). The HTS1 gene encodes both the
cytoplasmic and mitochondrial histidine tRNA synthetases of S. cerevisiae. Cell. 46:
235-43.
Naumov, G.I., James, S.A., Naumova, E.S., Louis, E.J. and Roberts, I.N. (2000).
Three new species in the Saccharomyces sensu stricto complex: Saccharomyces
cariocanus, Saccharomyces kudriavzevii and Saccharomyces mikatae. Int J Syst
Evol Microbiol. 50: 1931-42.
Ness, F. and Aigle, M. (1995). RTM1: a member of a new family of telomeric
repeated genes in yeast. Genetics. 140: 945-56.
Neuhoff, V., Arold, N., Taube, D., Ehrhardt, W. (1988). Improved staining of
proteins in polyacrylamide gels including isoelectric focusing gels with clear
background at nanogram sensitivity using Coomassie Brilliant Blue G-250 and R-
250. Electrophoresis. 9(6): 255-62.
162
Nguyen, H.V., Lepingle, A. and Gaillardin, C.A. (2000). Molecular typing
demonstrates homogeneity of Saccharomyces uvarum strains and reveals the
existence of hybrids between S. uvarum and S. cerevisiae, including the S. bayanus
type strain CBS 380. Syst Appl Microbiol. 23: 71-85.
Norbeck, J. and Blomberg, A. (1996). Protein expression during exponential growth
in 0.7 M NaCl medium of Saccharomyces cerevisiae. FEMS Microbiol Lett. 137: 1-
8.
Norbeck, J. and Blomberg, A. (2000). The level of cAMP-dependent protein kinase
A activity strongly affects osmotolerance and osmo-instigated gene expression
changes in Saccharomyces cerevisiae. Yeast. 16: 121-37.
Ogawa, Y., Nitta, A., Uchiyama, H., Imamura, T., Shimoi, H. and Ito, K. (2000).
Tolerance mechanism of the ethanol-tolerant mutant of sake yeast. Journal of
Bioscience & Bioengineering. 90: 313-320.
Ohno, S. (1970) Evolution by gene duplication, Springer-Verlag, Berlin.
O'Rourke, S.M. and Herskowitz, I. (1998). The Hog1 MAPK prevents cross talk
between the HOG and pheromone response MAPK pathways in Saccharomyces
cerevisiae. Genes Dev. 12: 2874-86.
163

Palhano, F.L., Orlando, M.T. and Fernandes, P.M. (2004). Induction of
baroresistance by hydrogen peroxide, ethanol and cold-shock in Saccharomyces
cerevisiae. FEMS Microbiol Lett. 233: 139-45.
Parsell, D.A. and Lindquist, S. (1993). The function of heat-shock proteins in stress
tolerance: degradation and reactivation of damaged proteins. Annu Rev Genet. 27:
437-96.
Pedersen, S.K., Harry, J.L., Sebastian, L., Baker, J., Traini, M.D., McCarthy, J.T.,
Manoharan, A., Wilkins, M.R., Gooley, A.A., Righetti, P.G., Packer, N.H.,
Williams, K.L. and Herbert, B.R. (2003). Unseen proteome: mining below the tip of
the iceberg to find low abundance and membrane proteins. J Proteome Res. 2: 303-
11.
Perez-Ortin, J.E., Querol, A., Puig, S. and Barrio, E. (2002). Molecular
characterization of a chromosomal rearrangement involved in the adaptive evolution
of yeast strains. Genome Res. 12: 1533-9.
Piper, P.W., Talreja, K., Panaretou, B., Moradas-Ferreira, P., Byrne, K., Praekelt,
U.M., Meacock, P., Recnacq, M. and Boucherie, H. (1994). Induction of major heat-
shock proteins of Saccharomyces cerevisiae, including plasma membrane Hsp30, by
ethanol levels above a critical threshold. Microbiology. 140: 3031-8.
164

Pretorius, I.S., Chow, T. and Marmur, J. (1986). Identification and physical
characterization of yeast glucoamylase structural genes. Mol Gen Genet. 203: 36-41.
Puig, S. and Perez-Ortin, J.E. (2000). Expression levels and patterns of glycolytic
yeast genes during wine fermentation. Syst Appl Microbiol. 23: 300-3.
Rabilloud, T., Adessi, C., Giraudel, A. and Lunardi, J. (1997). Improvement of the
solubilization of proteins in two-dimensional electrophoresis with immobilized pH
gradients. Electrophoresis. 18: 307-16.
Rankine, B.C. (1989) Making good wine: A manual of winemaking practice for
Australia and New Zealand, Macmillan, Sydney.
Rep, M., Reiser, V., Gartner, U., Thevelein, J.M., Hohmann, S., Ammerer, G. and
Ruis, H. (1999). Osmotic stress-induced gene expression in Saccharomyces
cerevisiae requires Msn1p and the novel nuclear factor Hot1p. Mol Cell Biol. 19:
5474-85.
Rossignol, T., Dulau, L., Julien, A. and Blondin, B. (2003). Genome-wide
monitoring of wine yeast gene expression during alcoholic fermentation. Yeast. 20:
1369-85.
165

Sambrook, J. and Russell, D.W. (2001) Molecular Cloning: A Laboratory Manual,
Cold Spring Harbor Laboratory Press, New York.
Sanchez, Y. and Lindquist, S.L. (1990). HSP104 required for induced
thermotolerance. Science. 248: 1112-5.
Sanchez, Y., Taulien, J., Borkovich, K.A. and Lindquist, S. (1992). Hsp104 is
required for tolerance to many forms of stress. EMBO J. 11: 2357-64.
Schaaff, I., Heinisch, J. and Zimmermann, F.K. (1989). Overproduction of
glycolytic enzymes in yeast. Yeast. 5: 285-90.
Schlupen, C., Santos, M.A., Weber, U., de Graaf, A., Revuelta, J.L. and Stahmann,
K.P. (2003). Disruption of the SHM2 gene, encoding one of two serine
hydroxymethyltransferase isoenzymes, reduces the flux from glycine to serine in
Ashbya gossypii. Biochem J. 369: 263-73.
Sharma, V.M., Chopra, R., Ghosh, I. and Ganesan, K. (2001). Quantitative target
display: a method to screen yeast mutants conferring quantitative phenotypes by
'mutant DNA fingerprints'. Nucleic Acids Res. 29: E86-6.
166

Shevchenko, A., Jensen, O.N., Podtelejnikov, A.V., Sagliocco, F., Wilm, M., Vorm,
O., Mortensen, P., Boucherie, H. and Mann, M. (1996a). Linking genome and
proteome by mass spectrometry: large-scale identification of yeast proteins from two
dimensional gels. Proc Natl Acad Sci U S A. 93: 14440-5.
Shevchenko, A., Wilm, M., Vorm, O. and Mann, M. (1996b). Mass spectrometric
sequencing of proteins silver-stained polyacrylamide gels. Anal Chem. 68: 850-8.
Shin, C.S., Song, J.Y., Ryu, O.H. and Wang, S.S. (1995). Enhancing effect of
albumin hydrolysate on ethanol production employing Saccharomyces sake.
Biotechnol Bioeng. 45: 450-3.
Simoes, T., Teixeira, M.C., Fernandes, A.R., and Sa-Correia, I. (2003). Adaptation
of Saccharomyces cerevisiae to the herbicide 2,4-dichlorophenoxyacetic acid,
mediated by Msn2p- and Msn4p-regulated genes: important role of SPI1. Appl
Environ Microbiol. 69(7): 4019-28.
Swan, T.M. and Watson, K. (1999). Stress tolerance in a yeast lipid mutant:
membrane lipids influence tolerance to heat and ethanol independently of heat shock
proteins and trehalose. Can J Microbiol. 45: 472-9.
167
Takahashi, T., Shimoi, H. and Ito, K. (2001). Identification of genes required for
growth under ethanol stress using transposon mutagenesis in Saccharomyces
cerevisiae. Mol Genet Genomics. 265: 1112-9.
ter Linde, J.J., Liang, H., Davis, R.W., Steensma, H.Y., van Dijken, J.P. and Pronk,
J.T. (1999). Genome-wide transcriptional analysis of aerobic and anaerobic
chemostat cultures of Saccharomyces cerevisiae. J Bacteriol. 181: 7409-13.
Trabalzini, L., Paffetti, A., Ferro, E., Scaloni, A., Talamo, F., Millucci, L., Martelli,
P. and Santucci, A. (2003a). Proteomic characterization of a wild-type wine strain of
Saccharomyces cerevisiae. Ital J Biochem. 52(4): 145-53.
Trabalzini, L., Paffetti, A., Scaloni, A., Talamo, F., Ferro, E., Coratza, G., Bovalini,
L., Lusini, P., Martelli, P. and Santucci, A. (2003b). Proteomic response to
physiological fermentation stresses in a wild-type wine strain of Saccharomyces
cerevisiae. Biochem J. 370: 35-46.
Tolkunova, E., Park, H., Xia, J., King, M.P. and Davidson, E. (2000). The human
lysyl-tRNA synthetase gene encodes both the cytoplasmic and mitochondrial
enzymes by means of an unusual alternative splicing of the primary transcript. J Biol
Chem. 275: 35063-9.
168

Volschenk, H., Viljoen-Bloom, M., Subden, R.E. and van Vuuren, H.J. (2001).
Malo-ethanolic fermentation in grape must by recombinant strains of
Saccharomyces cerevisiae. Yeast. 18: 963-70.
Vos, P., Hogers, R., Bleeker, M., Reijans, M., van de Lee, T., Hornes, M., Frijters,
A., Pot, J., Peleman, J., Kuiper, M. and et al. (1995). AFLP: a new technique for
DNA fingerprinting. Nucleic Acids Res. 23: 4407-14.
Wang, C.C., Chang, K.J., Tang, H.L., Hsieh, C.J. and Schimmel, P. (2003).
Mitochondrial form of a tRNA synthetase can be made bifunctional by manipulating
its leader peptide. Biochemistry. 42: 1646-51.
Warner, J.R. (1989). Synthesis of ribosomes in Saccharomyces cerevisiae. Microbiol
Rev. 53: 256-71.
Warner, J.R. (1999). The economics of ribosome biosynthesis in yeast. Trends
Biochem Sci. 24: 437-40.
Werner-Washburne, M., Braun, E.L., Crawford, M.E. and Peck, V.M. (1996).
Stationary phase in Saccharomyces cerevisiae. Mol Microbiol. 19: 1159-66.
169

Wildgruber, R., Harder, A., Obermaier, C., Boguth, G., Weiss, W., Fey, S.J., Larsen,
P.M. and Gorg, A. (2000). Towards higher resolution: two-dimensional
electrophoresis of Saccharomyces cerevisiae proteins using overlapping narrow
immobilized pH gradients. Electrophoresis. 21: 2610-6.
Wildgruber, R., Reil, G., Drews, O., Parlar, H. and Gorg, A. (2002). Web-based
two-dimensional database of Saccharomyces cerevisiae proteins using immobilized
pH gradients from pH 6 to pH 12 and matrix-assisted laser desorption/ionization-
time of flight mass spectrometry. Proteomics. 2: 727-32.
Winderickx, J., de Winde, J.H., Crauwels, M., Hino, A., Hohmann, S., Van Dijck, P.
and Thevelein, J.M. (1996). Regulation of genes encoding subunits of the trehalose
synthase complex in Saccharomyces cerevisiae: novel variations of STRE-mediated
transcription control? Mol Gen Genet. 252: 470-82.
Winston, F., Dollard, C. and Ricupero-Hovasse, S.L. (1995). Construction of a set of
convenient Saccharomyces cerevisiae strains that are isogenic to S288C. Yeast. 11:
53-5.
Winzeler, E.A., Richards, D.R., Conway, A.R., Goldstein, A.L., Kalman, S.,
McCullough, M.J., McCusker, J.H., Stevens, D.A., Wodicka, L., Lockhart, D.J. and
Davis, R.W. (1998). Direct allelic variation scanning of the yeast genome. Science.
281: 1194-7.
170

Winzeler, E.A., Shoemaker, D.D., Astromoff, A., Liang, H., Anderson, K., Andre,
B., Bangham, R., Benito, R., Boeke, J.D., Bussey, H., Chu, A.M., Connelly, C.,
Davis, K., Dietrich, F., Dow, S.W., El Bakkoury, M., Foury, F., Friend, S.H.,
Gentalen, E., Giaever, G., Hegemann, J.H., Jones, T., Laub, M., Liao, H., Davis,
R.W. and et al. (1999). Functional characterization of the S. cerevisiae genome by
gene deletion and parallel analysis. Science. 285: 901-6.
Wolfe, K.H. and Shields, D.C. (1997). Molecular evidence for an ancient duplication
of the entire yeast genome. Nature. 387: 708-13.
Yale, J. and Bohnert, H.J. (2001). Transcript expression in Saccharomyces
cerevisiae at high salinity. J Biol Chem. 276: 15996-6007. Epub 2001 Feb 14.
Zhu, H., Klemic, J.F., Chang, S., Bertone, P., Casamayor, A., Klemic, K.G., Smith,
D., Gerstein, M., Reed, M.A. and Snyder, M. (2000). Analysis of yeast protein
kinases using protein chips. Nat Genet. 26: 283-9.
171