identification of liver metastases with probe-based ...€¦ · lasers in surgery and medicine...
TRANSCRIPT
Lasers in Surgery and Medicine
Identification of Liver Metastases With Probe-BasedConfocal Laser Endomicroscopy at Two ExcitationWavelengths
Crispin Schneider,1� Sean P. Johnson,2 Kurinchi Gurusamy,1 Richard J. Cook,3 Adrien E. Desjardins,4
David J. Hawkes,5 Brian R. Davidson,1 and Simon Walker-Samuel21Division of Surgery & Interventional Science, University College London, Floor 9, Royal Free Hospital, London NW32QG, UK2UCLCentre for AdvancedBiomedical Imaging, PaulO’GormanBuilding, University College London, 72Huntley Street,London WC1E 6DD, UK3Department of Tissue Engineering and Biophotonics, King’s College London, Dental Institute—Central Office, Floor 18,Guy’s Tower, Guy’s Hospital, London SE1 9RT, UK4Department of Medical Physics and Biomedical Engineering, University College London, Malet Place EngineeringBuilding, Gower Street, London WC1E 6BT, UK5Centre forMedical Image Computing, University College London, The Front Engineering Building, Floor 3,Malet Place,London WC1E 7JE, UK
Background:Metastasis of colorectal cancer to the liver isthe most common indication for hepatic resection in awestern population. Incomplete excision of malignancydue to residual microscopic disease normally results inworse patient outcome. Therefore, a method aiding in thereal time discrimination of normal andmalignant tissue ona microscopic level would be of benefit.Material and Methods: The ability of fluorescent probe-based confocal laser endomicroscopy (pCLE) to identifynormal and malignant liver tissue was evaluated in anorthotopic murine model of colorectal cancer liver metas-tasis (CRLM). To maximise information yield, two clinicalfluorophores, fluorescein and indocyanine green (ICG)were injected and imaged in a dual wavelength approach(488 and 660nm, respectively). Visual tissue character-istics on pCLE examination were compared with histologi-cal features. Fluorescence intensity in both tissues wasstatistically analysed to elucidate if this can be used todifferentiate between normal and malignant tissue.Results: Fluorescein (488nm) enabled good visualisation ofnormal and CRLM tissue, whereas ICG (660nm) visualisa-tion was limited to normal liver tissue only. Fluorescenceintensity in areas of CRLM was typically 53–100% lowerthan normal hepatic parenchyma. Using general linearmixed modelling and receiver operating characteristicanalysis, high fluorescence intensity was found to bestatistically more likely in normal hepatic tissue.Conclusion: Real time discrimination between normalliver parenchyma and metastatic tissue with pCLEexamination of fluorescein and ICG is feasible. Employ-ing two (rather than a single) fluorophores allows acombination of qualitative and quantitative character-istics to be used to distinguish between hepatic paren-chyma and CRLM. Lasers Surg. Med.� 2016 Wiley Periodicals, Inc.
Key words: liver metastases; confocal laser endomicro-scopy; virtual histology; fluorescence microscopy; indo-cyanine green; fluorescein
INTRODUCTION
Colorectal cancer is one of the most common cancersglobally, being the third most commonly diagnosed cancerinmen and secondmost common inwomen [1]. Up to a 50%of patients develop liver metastases at some stage [2], acondition which contributes to cancer related mortality inabout half of the affected patients [3]. Therapies directed at
Abbreviations: CI, confidence interval; CLE, confocal laserendomicroscopy; ICG, indocyanine green; pCLE, probe-basedconfocal laser endomicroscopy; CRLM, colorectal cancer livermetastasis; ROC, receiver operating characteristics; RFU, rela-tive fluorescence unit; GLIMMIX, generalised linear mixedmodel analysis by SASTM; SE, standard error
Conflict of Interest Disclosures: All authors have completedand submitted the ICMJE Form for Disclosure of PotentialConflicts of Interest and have disclosed the following: Drs.Schneider, Johnson, Walker-Samuel, Gurusamy, Cook, Desjar-dins and Prof. Davidson have no conflicts of interest or financialties to disclose. Prof. Hawkes is a co-founder of IXICO Ltd.
Crispin Schneider and Sean P. Johnson contributed equally tothis work (shared first authorship).
Contract grant sponsor: Health Innovation Challenge Fund,Department of Health and the Wellcome Trust (jointly funded bythe Department of Health and the Wellcome Trust); Contractgrant numbers: HICF-T4-317, WT100247MA.
�Correspondence to: Crispin Schneider, MD, 9th floor, RoyalFree Campus, Division of Surgery & Interventional Science,University College London, Pond Street, London NW3 2QG, UK.E-mail: [email protected]
Accepted 20 November 2016Published online in Wiley Online Library(wileyonlinelibrary.com).DOI 10.1002/lsm.22617
� 2016 Wiley Periodicals, Inc.
liver metastases have, therefore, been subject of extensiveresearch interest [4].
Surgical resection of solid tumour metastases is thepreferred treatment for curative intent [5,6], resulting in5-year survival rates approaching 60% [4]. Incompletetumour resection occur in up to 17% of cases anddetrimentally affect patient survival [7,8]. Macroscop-ically, colorectal cancer liver metastases (CRLM) usuallyexhibit a white appearance thatmakes larger nodules easyto distinguish from normal liver tissue, which appearsbrown.
Unfortunately, visual assessment is insufficient toconfirm complete tumour excision. Although intra-operative ultrasonography (IOUS) and bi-manual palpa-tion are frequently used to determine tumour locationwithin the liver, this approach is not suitable to identifyresidual cancer following resection because it is mainly of amicroscopic nature [9,10]. Identification of residual diseaseusing histopathology is not feasible during liver resection.An imaging modality that can confirm or refute thepresence of malignancy within liver tissue at amicroscopiclevel would, therefore, be helpful in ensuring completeresection, reducing the amount of liver tissue resected, orto avoid an unnecessary excision if cancer can beexcluded [11].
Other imaging modalities such as cone beam CT,magnetic resonance imaging and near infrared fluoroscopymay be able to enhance imaging during liver surgery, butnone of these modalities provides an image resolution thatwould enable identification of residual disease at amicroscopic level [12–14].
Optical imagingmodalities offermicrometer scale imageresolution but at this stage only optical coherencetomography (OCT) and confocal laser endomicroscopy(CLE) are available in compact designs that make anintraoperative application feasible. Either imaging modal-ity can visualise liver tissue ex vivo, but only CLE has beenextensively studied in an in vivo setting [15–18]. Whenemployed in a compact design, CLE has a better lateralresolution than OCT at 1.4 versus 7mm [19,20]. This is animportant advantage of CLE which may allow imaging atsubcellular level in greater detail. CLE can be performedwith a bulkier rigid endomicroscope which contains therequired optics in its tip [21] or with a thin, flexible fibre-based endomicroscope that conducts the excitation laserand transmits signals to an external laser scanningunit [17,22]. For the latter, a commercially availablesolution is theCellvizioTM system (MaunaKeaTechnology,Paris) which can be used in conjunction with fibre-opticprobes ranging from 0.3–4.5mm diameter.
Studies comparing confocal laser endomicroscopy(CLE) with standard histology in animal models, haveproven its ability to visualise the cellular architecture oftissues, thereby, providing a method of obtaining virtual,in vivo histology in real-time [16,23]. In clinical practice,probe-based confocal laser endomicroscopy (pCLE) islicensed for the endoscopic diagnosis of gastrointestinal,bronchial and urinary malignancy and dysplasia. De-pending on the tissue type, diagnostic accuracy is in the
range of 86–91% [24–27]. Recent reports suggest thatpCLE may also be a useful tool for the detection of breastand head and neck cancers [28,29].To the best of our knowledge, the detection of liver
metastasis using pCLE has not been investigated previ-ously. Therefore, this study was conducted to assess towhat extent dual wavelength pCLE imaging character-istics and quantitative fluorescence properties coulddiscriminate between metastatic and normal liver tissuein an orthotopic nude mouse model of colorectal cancerliver metastases. Dual wavelength CLE imaging wasachieved by recording measurements with the CellvizioTM
488 and 660nm system employing either fluorescein orindocyanine green as fluorophores, respectively. Bothfluorophores are clinically licensed which enables findingsto be translated into a clinical context without safetyconcerns.
METHODS
Animal Model
All animal studies were approved by the UniversityCollege London Biological Services Ethical Review Com-mittee and licensed under the UKHomeOffice regulationsand the Guidance for the Operation of Animals (ScientificProcedures) Act 1986 (Home Office, London, UnitedKingdom) and United Kingdom Co-ordinating Committeeon Cancer Research Guidelines for the Welfare and Use ofAnimals in Cancer Research [30]. The human colorectalcarcinoma cell line SW1222 was cultured under aseptictechnique in Dulbecco’s Modified Eagles Medium contain-ing 5mM L-glutamine and 10% v/v foetal bovine serum. Allanimal studies were conducted in accordance with UKhome office regulations and the guidelines for the welfareand use of animals in cancer research. The livermetastasismodel used has been previously described [31]. Briefly,eight (n¼8) MF1 nu/nu mice (female, 6–8 weeks old,25–30g) underwent a laparotomy in order to directly inject1� 106 cells into the spleen. Splenectomy was performedafter 5 minutes to stop formation of a primary tumour atthe site of injection, with cells that had been carried by theblood flow through to the liver forming the solid tumours ofthe metastatic model. At conclusion of the procedure, thelaparotomy incision was closed and animals were recov-ered. In the described animal model, female mice areexclusively used due to their better compliance.Liver tumour maturation took between 5 and 6 weeks.
The progression of metastatic disease was monitored onceper week with non-invasive magnetic resonance imagingunder general anaesthesia. The evolving disease patternshowed a heterogeneous distribution of distinct solidtumour nodules throughout the lobes of the liver, typicallycomprising 10–20 tumour nodules that could be visualisedon magnetic resonance imaging.
CLE Image Acquisition
A transverse laparotomy was carried out under generalanaesthesia to allow unrestricted access to the liver. CLEimaging at 488 and 660nm was performed with two
2 SCHNEIDER ET AL.
different CLE imaging stackswith separate laser scanningunits, probes and image processing computers. Bothsystems were initialised and calibrated at the start ofeach experiment. Switching between wavelengths simplyrequired imaging probes to be swapped over. Due to theinability of pCLE to visualise tissues beyond 100mmdepth,images were exclusively acquired from superficial tissue,while the probes were manually maintained in contactwith the liver surface. Motion artefact was reduced bygently applying the pCLE probes onto the liver surface, sothat they moved in parallel with liver motion secondary torespiration.Images were acquired with the Z-probe at 488nm and
the mini-Z probe at 660nm wavelength. Probe character-istics were the following: probe diameter 1.8 or 0.94mm;lateral resolution 3.9mm, axial resolution 44 or 13mm,working distance 80 or 65mm, maximal field of view426� 302 or 323�323mm for the Z-probe or mini-Z probe,respectively.The liver was macroscopically categorised into normal
and cancerous tissue areas based on its respective brown orwhite appearance. This approachwasmade possible by theradically different appearance of normal liver versusCRLM. Image sequences that were disturbed by excessivemotion artefact were not used, especially since they wouldfrequently included images from normal and canceroustissues at the same time. No attempt was made to identifymicroscopic disease because the aim was to establishreproducible CLE criteria of CRLM which could then betranslated to the detection of microscopic disease in futurestudies. Baseline CLE images were recorded over arepresentative area prior to fluorophore administration.To provide exogenous fluorescence for CLE imaging at 488and 660nm excitation, fluorescein sodium (molecularweight 376.27 g/mol—henceforth called “fluorescein”) andICG (molecularweight 774.96 g/mol) weremixedwith 0.9%sodium chloride or 5% dextrose, respectively. Subse-quently, fluorescein (4–7mg/kg) and indocyanine green(0.3–0.5mg/kg)were sequentially injected into the tail veinwith a delay of 20–40 minutes between injections to allowadequate time for imaging. In preliminary experiments, itwas confirmed that neither fluorescein nor ICG elicitedunintentional “cross”-fluorescence signals.An initial image sequence of 1–3minuteswas recorded to
monitor and confirm distribution of the fluorophores in theliver. Several short sequences ranging from 10–20s weretaken from normal and malignant tissue in differentlocations. The aim was to acquire images from as manytumour nodules, and an equivalent number of normal livertissue areas, as possible. It was not feasible to co-registertissue areas between 488 and 660nm pCLE imaging. Butdue to the relatively small size of mouse livers, it washypothesised that approximately, the same areas of viewwere imaged at both wavelengths. For statistical analysiswhich is described below, all values for individual animalswere pooled into one group and hence co-registration is lessrelevant than for the visual comparison of image features.Pooling of data was also intended to decrease the impactof heterogeneous fluorophore accumulation and tissue
scattering properties within the same animal. The meanfluorescence values for each image frame from thesesequences were subsequently analysed.
Preparation and Examination of Tissue Samples
Following termination of the animals, the livers wereresected, fixed in 10% formalin and embedded in paraffinblocks. Tissue sampleswere sliced at 4mmthicknesswith amicrotome and sections mounted on glass slides. Thepresence of colorectal cancer metastases was confirmed byusing a standard structuralHaematoxylin andEosin stain.Because areas of normal liver and CRLM in this diseasemodel looked radically different, histological examinationenabled us to confirm infiltration of adenocarcinoma cellsin representative liver areas which previously underwentCLE in vivo examination.
Statistical Analysis
CellvizioTM is packaged with image analysis software(ImagecellTM) that records and displays basic valuestermed relative fluorescence units (RFU), from which themaximum, minimum, median and mean were calculatedand exported for each image frame. Relative fluorescenceunits are based on a reconstruction of single fibrefluorescence intensity at a given point in time. A numberof factors such as fibre injection rate, fibre collection rate,fibre auto-fluorescence, biological sample fluorescence andlaser source intensity influence fluorescence intensity.These variables are factors in an equation that allows thereal time reconstruction of fluorescence intensity inindividual fibres each of which corresponds to an imagepixel of the CLE image. A detailed description of theequation and other relevant methodology has beenpreviously published [32]. At the start of each imagingsession, a calibration is carried out using solution thatprovides a uniform value of background fluorescence. Thecalibration procedure results in homogenisation of theindividual probe fibres to give them uniform detectionsensitivity (which corresponds to a measured lightintensity) [33]. This process enables comparison offluorescence values between individual fibres (i.e. pixels)of the probe, for a given calibration. However, whilst theabsolute background fluorescence value in the calibrationsolution is uniform it may change between repeatedcalibrations and different solution containers, meaningthat fluorescence units have to be regarded as relative, asopposed to absolute values. Thus, imaging data were onlycompared within the same animal.
NegativeRFUvalues either correspond to image noise orcan be caused by a reduction in fibre autofluorescence dueto prolonged illumination. To avoid misinterpretation,negative RFU values were thresholded at zero. All RFUvalues underwent a square root transformation to reducedata skew and kurtosis as previously reported [20].
Routine statistical comparison, e.g. by paired Wilcoxonrank sum test (individual animal pairedwithRFU)wasnotpossible due to specific constraints of the acquired datawhichwere: (1) unequal number of frame counts for normal
LAPAROSCOPIC EVALUATION OF LIVER ABLATION 3
and CRLM tissue and (2) potential introduction of a repeatsampling error. These circumstances lead us to choose ageneralised linear mixed model (GLIMMIX) analysiswhich can accommodate for the described data constraintsby estimating the interaction of fixed and random effects.The GLIMMIX analysis enabled modelling of the proba-bility of the acquired images corresponding to normal liverparenchyma. The measured RFU value and animal IDwere set up as fixed effect and random effect for thismodel,respectively. A similar approach has previously been usedby our group for CLE evaluation of ablated liver tissue in aporcine model [20].
Different estimation methods such as Pseudo Likeli-hood, Laplace and Gauss-Hermite quadrature can be usedfor GLIMMIX analysis. For the purpose of this study, theLaplace method was chosen because it exhibited satisfac-tory convergence and the best fit characteristics asassessed by Akaike information criterion (AIC). GLIMMIXanalysis results are given as the change in odds ratio for anincrease in RFU at a standardised value. For example, anodds ratio of 2 at a standardised RFU increase of 100–101means that the odds ratio of liver parenchyma beingnormal increases by 2 if the RFU value increased by onefrom 100 to 101.
To test the validity of the GLIMMIX model resultingfrom the study data, a ROC analysis was performed.The covariates and intercepts provided by the GLIM-MIX analysis were used to calculate the log odds, oddsand finally, the probability of identifying normal livertissue. Each single probability value corresponded to asingle observation (mean RFU per frame), a specificanimal ID and a tissue type which enabled us toperform a ROC analysis based on this data. Becauseanimal ID was a random effect due to the difference inprobe calibrations between experiments, the same RFUvalue would result in different probability values forindividual animals.
To determine if a probability based threshold value couldbe used to distinguish between normal and malignanttissue random sample cross validation was carried out. Tothis end, all observations were randomised into a trainingand a validation dataset. The training setwas used to builda GLIMMIX prediction model whose output subsequentlyunderwent ROC analysis. A threshold value with anoptimal sensitivity and specificity for identifying normalliver tissue was then chosen from the ROC curvecoordinates. This threshold probability value was subse-quently applied to the validation set, to evaluate itsperformance in distinguishing between normal and malig-nant liver tissue and calculate the resulting sensitivity,specificity and accuracy for this test.
An estimation of erythrocyte flow velocity calculatedfrom the available image data was also carried out. Tocalculate flow velocity (in mm/s), the distance travelled bya single erythrocytes in the time period between two imageframes (¼41.7ms at 24 frames per second) was measured.Depending on the amount of available data, 5–10individual erythrocytes were assessed per tissue typeand animal ID.
Statistically significant differences were assumed ifP< 0.05. Statistical analysis was performed using SPSSTM
Version 21 (IBM, Armonk, NY) with exception of theGLIMMIX analysis which was carried out with SASTM
Version 9.4 (SAS Institute, Cary, NC). Quantitative data(RFU and erythrocyte flow velocity) is given asmedian andinterquartile range. Odds ratios are stated together withtheir 95% confidence intervals (CI).
RESULTS
Test Sample Size
The orthotopic CRLM model was established in eightmice. One animal died before any CLE measurementscould be carried out. The remaining sevenmice underwentCLE examination. In two animals, the tumour burdenrelative to normal liver was too great to allow meaningfulstatistical comparison. Two animals died during imageacquisition; one (ID6) before sufficient data at eitherwavelength could be collected and a further animalfollowing completion of CLE imaging with fluorescein at488nm (ID7). In summary, six animals underwentconsequential CLE imaging and of these, four (fluores-cein/488nm) and three (ICG/660nm) experiments pro-vided sufficient data for statistical analysis.
Evaluating Normal Liver at 488nm WavelengthWith Fluorescein
Examples of CLE images and H&E histology for normaland CRLM tissue are shown below. Each example is fromthe same animal but due to the frequently small size oflesions, no attempt was made to spatially correlate CLEimageswith histological slides.Macroscopic lesion sizewaslarger than the pCLE field of view but otherwise variablebetween animals. The smallest lesions were 1–2mmwhereas in some animals, the majority of the liver surfacewas covered by metastatic deposits.Prior to administration of fluorescein, no endogenous
fluorescence was observed in normal or metastatic tissue.The initial period following fluorescein injection wastermed the inflowphase. During this phase, the fluoresceinstrongly accumulated within the vascular compartmentand could be observed in hepatic sinusoids and interlobularvessels (Fig. 1a). Occasionally, individual erythrocytescould be visualised moving through blood vessels orsinusoids. Because erythrocytes did not take up fluores-cein, they could be seen as small, dark, round or discoidshapes outlined against the bright contrast signal of theintravascular fluorophore (Fig. 1b). Generally, inflowphase images were dominated by a meshwork pattern ofbright interlobular vessels criss-crossing dark areas whichrepresented the parenchyma of liver lobules (Fig. 1c).Inflow phase duration varied between animals but was
approximately 7–11 minutes. At the end of the inflowphase, the fluorophore shifted from the intravascularcompartment to the liver parenchyma and connectivetissue, which resulted in high signal intensity within liverlobules. This stage of the CLE examination, lastingthroughout the remainder of observations, was termed
4 SCHNEIDER ET AL.
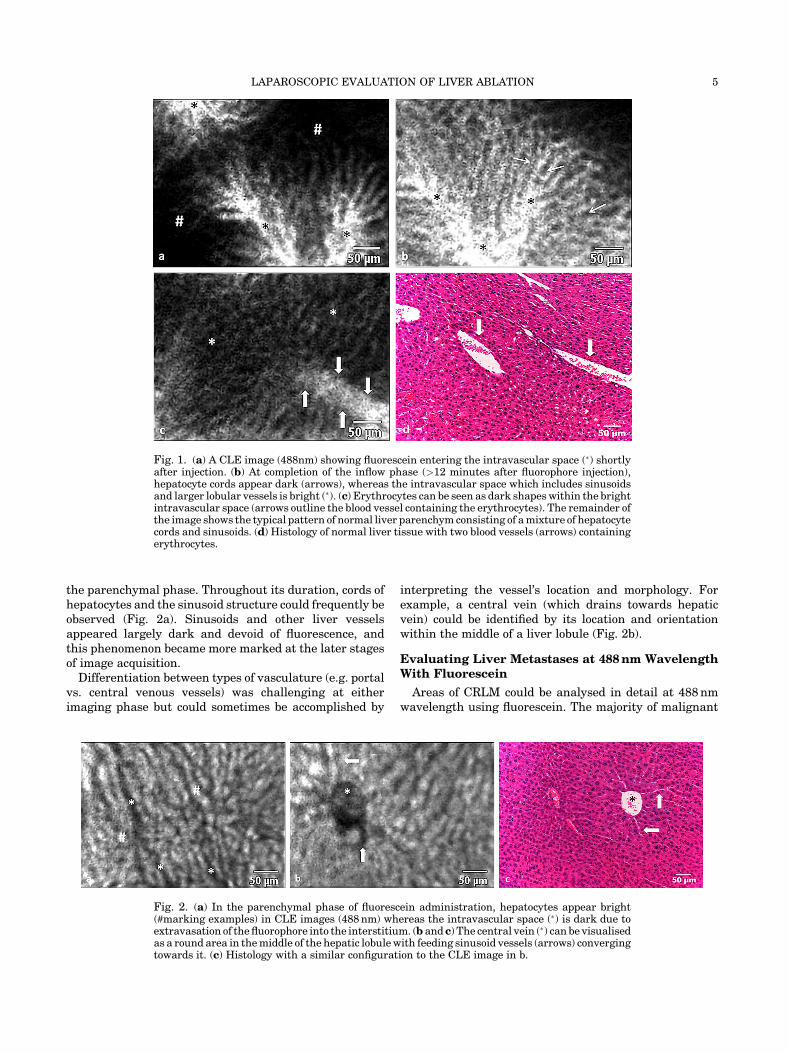
the parenchymal phase. Throughout its duration, cords ofhepatocytes and the sinusoid structure could frequently beobserved (Fig. 2a). Sinusoids and other liver vesselsappeared largely dark and devoid of fluorescence, andthis phenomenon became more marked at the later stagesof image acquisition.Differentiation between types of vasculature (e.g. portal
vs. central venous vessels) was challenging at eitherimaging phase but could sometimes be accomplished by
interpreting the vessel’s location and morphology. Forexample, a central vein (which drains towards hepaticvein) could be identified by its location and orientationwithin the middle of a liver lobule (Fig. 2b).
Evaluating Liver Metastases at 488nm WavelengthWith Fluorescein
Areas of CRLM could be analysed in detail at 488nmwavelength using fluorescein. The majority of malignant
Fig. 1. (a) A CLE image (488nm) showing fluorescein entering the intravascular space (�) shortlyafter injection. (b) At completion of the inflow phase (>12 minutes after fluorophore injection),hepatocyte cords appear dark (arrows), whereas the intravascular space which includes sinusoidsand larger lobular vessels is bright (�). (c) Erythrocytes can be seen as dark shapeswithin the brightintravascular space (arrows outline the blood vessel containing the erythrocytes). The remainder ofthe image shows the typical pattern of normal liver parenchym consisting of amixture of hepatocytecords and sinusoids. (d) Histology of normal liver tissue with two blood vessels (arrows) containingerythrocytes.
Fig. 2. (a) In the parenchymal phase of fluorescein administration, hepatocytes appear bright(#marking examples) in CLE images (488nm) whereas the intravascular space (�) is dark due toextravasation of the fluorophore into the interstitium. (b and c) The central vein (�) can be visualisedas a round area in themiddle of the hepatic lobulewith feeding sinusoid vessels (arrows) convergingtowards it. (c) Histology with a similar configuration to the CLE image in b.
LAPAROSCOPIC EVALUATION OF LIVER ABLATION 5
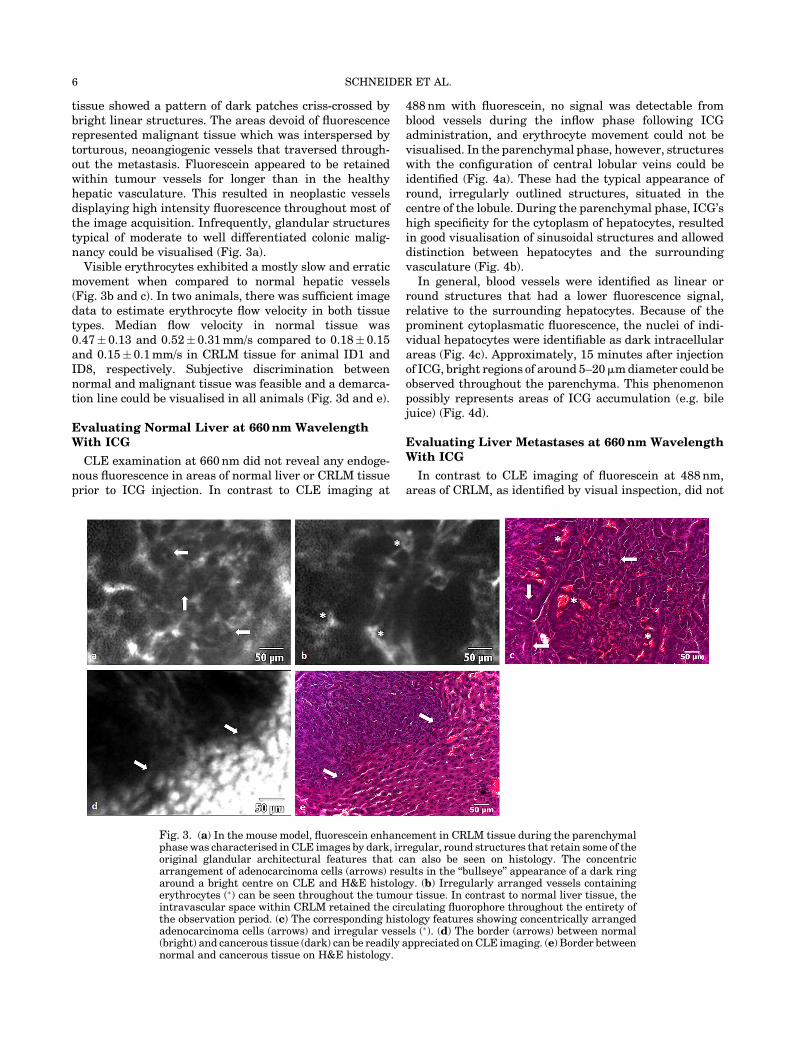
tissue showed a pattern of dark patches criss-crossed bybright linear structures. The areas devoid of fluorescencerepresented malignant tissue which was interspersed bytorturous, neoangiogenic vessels that traversed through-out the metastasis. Fluorescein appeared to be retainedwithin tumour vessels for longer than in the healthyhepatic vasculature. This resulted in neoplastic vesselsdisplaying high intensity fluorescence throughout most ofthe image acquisition. Infrequently, glandular structurestypical of moderate to well differentiated colonic malig-nancy could be visualised (Fig. 3a).
Visible erythrocytes exhibited a mostly slow and erraticmovement when compared to normal hepatic vessels(Fig. 3b and c). In two animals, there was sufficient imagedata to estimate erythrocyte flow velocity in both tissuetypes. Median flow velocity in normal tissue was0.47� 0.13 and 0.52�0.31mm/s compared to 0.18� 0.15and 0.15�0.1mm/s in CRLM tissue for animal ID1 andID8, respectively. Subjective discrimination betweennormal and malignant tissue was feasible and a demarca-tion line could be visualised in all animals (Fig. 3d and e).
Evaluating Normal Liver at 660nm WavelengthWith ICG
CLE examination at 660nm did not reveal any endoge-nous fluorescence in areas of normal liver or CRLM tissueprior to ICG injection. In contrast to CLE imaging at
488nm with fluorescein, no signal was detectable fromblood vessels during the inflow phase following ICGadministration, and erythrocyte movement could not bevisualised. In the parenchymal phase, however, structureswith the configuration of central lobular veins could beidentified (Fig. 4a). These had the typical appearance ofround, irregularly outlined structures, situated in thecentre of the lobule. During the parenchymal phase, ICG’shigh specificity for the cytoplasm of hepatocytes, resultedin good visualisation of sinusoidal structures and alloweddistinction between hepatocytes and the surroundingvasculature (Fig. 4b).In general, blood vessels were identified as linear or
round structures that had a lower fluorescence signal,relative to the surrounding hepatocytes. Because of theprominent cytoplasmatic fluorescence, the nuclei of indi-vidual hepatocytes were identifiable as dark intracellularareas (Fig. 4c). Approximately, 15 minutes after injectionof ICG, bright regions of around 5–20mmdiameter could beobserved throughout the parenchyma. This phenomenonpossibly represents areas of ICG accumulation (e.g. bilejuice) (Fig. 4d).
Evaluating Liver Metastases at 660nm WavelengthWith ICG
In contrast to CLE imaging of fluorescein at 488nm,areas of CRLM, as identified by visual inspection, did not
Fig. 3. (a) In the mouse model, fluorescein enhancement in CRLM tissue during the parenchymalphase was characterised in CLE images by dark, irregular, round structures that retain some of theoriginal glandular architectural features that can also be seen on histology. The concentricarrangement of adenocarcinoma cells (arrows) results in the “bullseye” appearance of a dark ringaround a bright centre on CLE and H&E histology. (b) Irregularly arranged vessels containingerythrocytes (�) can be seen throughout the tumour tissue. In contrast to normal liver tissue, theintravascular space within CRLM retained the circulating fluorophore throughout the entirety ofthe observation period. (c) The corresponding histology features showing concentrically arrangedadenocarcinoma cells (arrows) and irregular vessels (�). (d) The border (arrows) between normal(bright) and cancerous tissue (dark) can be readily appreciated onCLE imaging. (e) Border betweennormal and cancerous tissue on H&E histology.
6 SCHNEIDER ET AL.

emit any measurable fluorescence and, therefore, ap-peared as dark areas covering several fields of view(Fig. 5a). Although no specific tumour characteristicscould be appreciated, it was possible to visualise thedelineation between CRLM and normal hepatic tissue byobserving a demarcation between high and low intensityfluorescence areas (Fig. 5b).
Statistical Analysis of Fluorescence Values
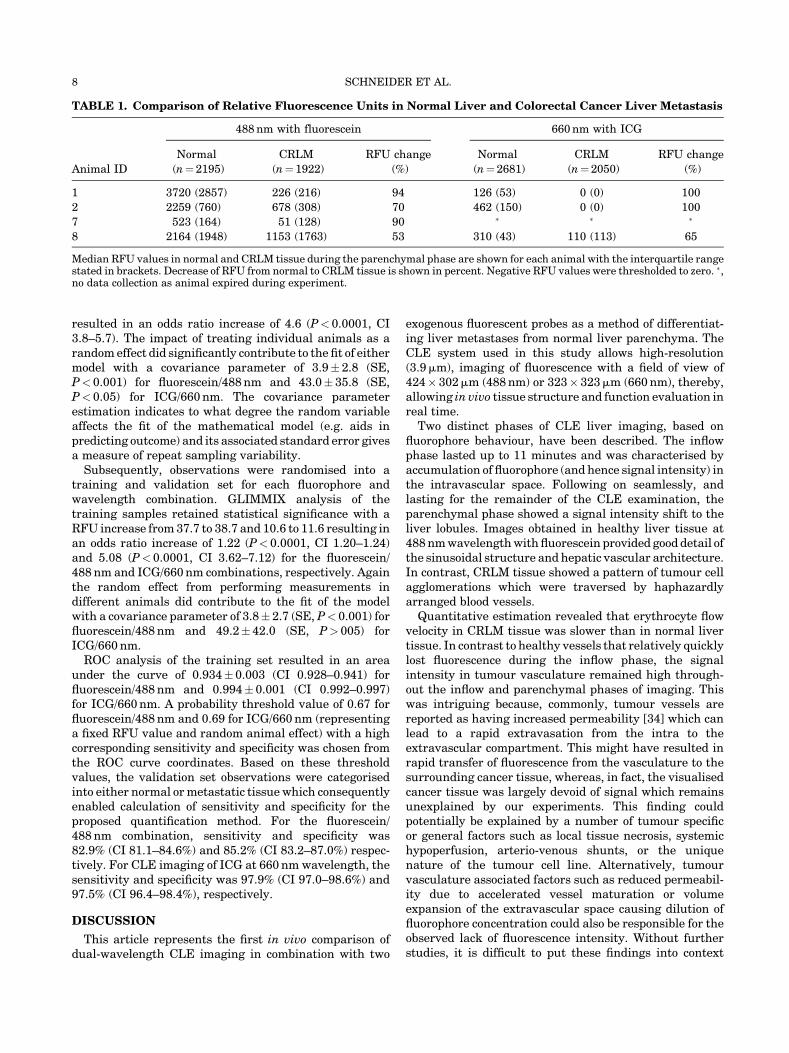
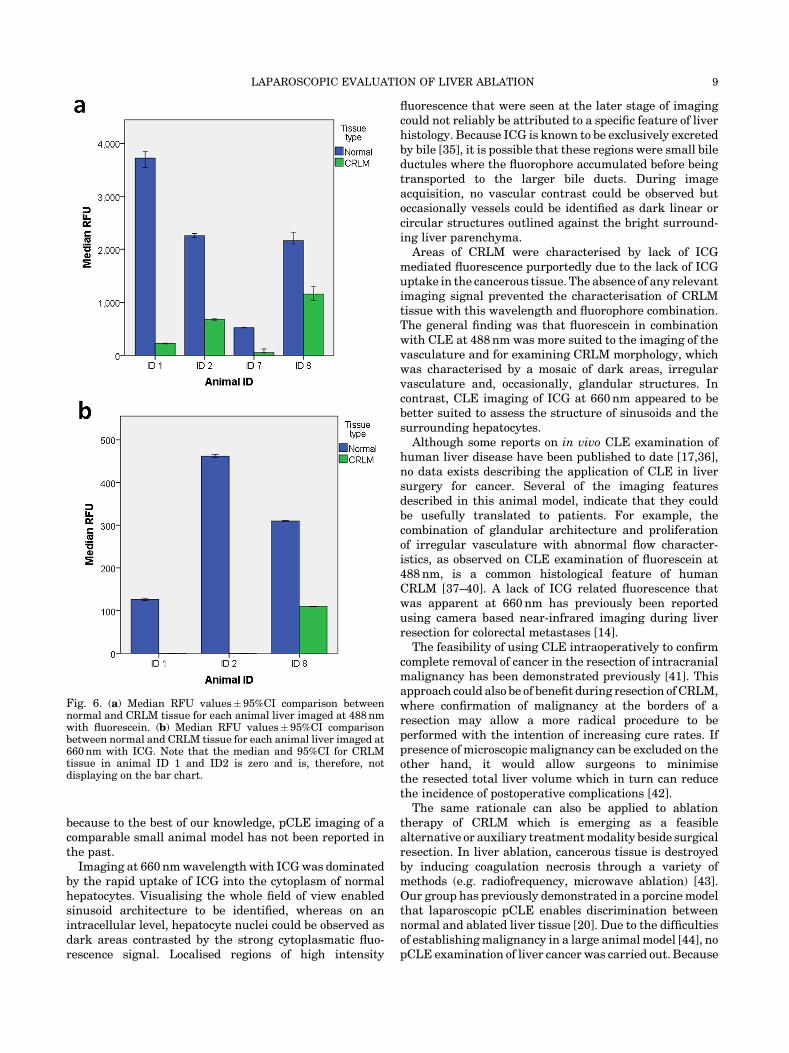
RFU values measured during the parenchymal phase inmetastatic tissue were 53–94% lower for fluorescein/
488nm and 65–100% lower for ICG/660nm when com-pared to normal liver tissue (Table 1, Fig. 6). GLIMMIXanalysis showed that higher RFU values measured duringthe parenchymal phase were statistically significantpredictors for the presence of normal liver tissue at eitherfluorophore and wavelength combination.
For the fluorescein/488nm combination, a RFU valuechange from 37.8 to 38.8 increased the odds ratio of livertissue being normal (e.g. nonmetastatic) by 1.2 (P< 0.0001,CI 1.21–1.24). This was also true for the ICG/660nmcombination where a RFU value change from 10.5 to 11.5
Fig. 4. (a) A central vein (�), acquired in vivo with CLE (660nm), surrounded by normalparenchyma, acquired following ICG administration, which can also be seen in a correspondingH&E image. (b) The distribution pattern of ICG mediated fluorescence enables discriminationbetween sinusoids (thin arrows), larger blood vessels (wide arrow), and the hepatocytes, the latter ofwhich make up most of the image. Vessels and their bifurcations are represented by dark linearstructures (arrows). (c) Hepatocyte nuclei can be seen as small contrast sparing areas (thin arrows),surrounded by bright cytoplasm. (d) At the end of the parenchymal phase, hepatocytes have lostmost of their fluorescence. Bright regions (arrows) spaced throughout the normal tissue likelypresents areas where bile juice is concentrated (e.g. bile ducts). (e) Section of normal liver histologydepicting a central vein (�), nuclei (thin arrows), and larger interlobular vessels (wide arrows).
Fig. 5. (a) A CLE image of a region of CRLM, which is devoid of any fluorescence following ICGadministration. (b) An irregular transition (arrows) from low to high fluorescence represents thedemarcation line between CRLM and normal tissue in a CLE image acquired at 660nm. (c) Theborder between metastasis and normal liver tissue viewed on H&E histology.
LAPAROSCOPIC EVALUATION OF LIVER ABLATION 7
resulted in an odds ratio increase of 4.6 (P< 0.0001, CI3.8–5.7). The impact of treating individual animals as arandom effect did significantly contribute to the fit of eithermodel with a covariance parameter of 3.9� 2.8 (SE,P<0.001) for fluorescein/488nm and 43.0� 35.8 (SE,P<0.05) for ICG/660nm. The covariance parameterestimation indicates to what degree the random variableaffects the fit of the mathematical model (e.g. aids inpredicting outcome) and its associated standard error givesa measure of repeat sampling variability.
Subsequently, observations were randomised into atraining and validation set for each fluorophore andwavelength combination. GLIMMIX analysis of thetraining samples retained statistical significance with aRFU increase from 37.7 to 38.7 and 10.6 to 11.6 resulting inan odds ratio increase of 1.22 (P<0.0001, CI 1.20–1.24)and 5.08 (P<0.0001, CI 3.62–7.12) for the fluorescein/488nm and ICG/660nm combinations, respectively. Againthe random effect from performing measurements indifferent animals did contribute to the fit of the modelwith a covariance parameter of 3.8� 2.7 (SE, P< 0.001) forfluorescein/488nm and 49.2�42.0 (SE, P> 005) forICG/660nm.
ROC analysis of the training set resulted in an areaunder the curve of 0.934�0.003 (CI 0.928–0.941) forfluorescein/488nm and 0.994�0.001 (CI 0.992–0.997)for ICG/660nm. A probability threshold value of 0.67 forfluorescein/488nm and 0.69 for ICG/660nm (representinga fixed RFU value and random animal effect) with a highcorresponding sensitivity and specificity was chosen fromthe ROC curve coordinates. Based on these thresholdvalues, the validation set observations were categorisedinto either normal ormetastatic tissue which consequentlyenabled calculation of sensitivity and specificity for theproposed quantification method. For the fluorescein/488nm combination, sensitivity and specificity was82.9% (CI 81.1–84.6%) and 85.2% (CI 83.2–87.0%) respec-tively. For CLE imaging of ICG at 660nm wavelength, thesensitivity and specificity was 97.9% (CI 97.0–98.6%) and97.5% (CI 96.4–98.4%), respectively.
DISCUSSION
This article represents the first in vivo comparison ofdual-wavelength CLE imaging in combination with two
exogenous fluorescent probes as a method of differentiat-ing liver metastases from normal liver parenchyma. TheCLE system used in this study allows high-resolution(3.9mm), imaging of fluorescence with a field of view of424� 302mm (488nm) or 323� 323mm (660nm), thereby,allowing in vivo tissue structure and function evaluation inreal time.Two distinct phases of CLE liver imaging, based on
fluorophore behaviour, have been described. The inflowphase lasted up to 11 minutes and was characterised byaccumulation of fluorophore (and hence signal intensity) inthe intravascular space. Following on seamlessly, andlasting for the remainder of the CLE examination, theparenchymal phase showed a signal intensity shift to theliver lobules. Images obtained in healthy liver tissue at488nmwavelengthwithfluorescein provided good detail ofthe sinusoidal structure and hepatic vascular architecture.In contrast, CRLM tissue showed a pattern of tumour cellagglomerations which were traversed by haphazardlyarranged blood vessels.Quantitative estimation revealed that erythrocyte flow
velocity in CRLM tissue was slower than in normal livertissue. In contrast to healthy vessels that relatively quicklylost fluorescence during the inflow phase, the signalintensity in tumour vasculature remained high through-out the inflow and parenchymal phases of imaging. Thiswas intriguing because, commonly, tumour vessels arereported as having increased permeability [34] which canlead to a rapid extravasation from the intra to theextravascular compartment. This might have resulted inrapid transfer of fluorescence from the vasculature to thesurrounding cancer tissue, whereas, in fact, the visualisedcancer tissue was largely devoid of signal which remainsunexplained by our experiments. This finding couldpotentially be explained by a number of tumour specificor general factors such as local tissue necrosis, systemichypoperfusion, arterio-venous shunts, or the uniquenature of the tumour cell line. Alternatively, tumourvasculature associated factors such as reduced permeabil-ity due to accelerated vessel maturation or volumeexpansion of the extravascular space causing dilution offluorophore concentration could also be responsible for theobserved lack of fluorescence intensity. Without furtherstudies, it is difficult to put these findings into context
TABLE 1. Comparison of Relative Fluorescence Units in Normal Liver and Colorectal Cancer Liver Metastasis
488nm with fluorescein 660nm with ICG
Animal ID
Normal
(n¼2195)
CRLM
(n¼ 1922)
RFU change
(%)
Normal
(n¼2681)
CRLM
(n¼2050)
RFU change
(%)
1 3720 (2857) 226 (216) 94 126 (53) 0 (0) 100
2 2259 (760) 678 (308) 70 462 (150) 0 (0) 100
7 523 (164) 51 (128) 90 � � �
8 2164 (1948) 1153 (1763) 53 310 (43) 110 (113) 65
Median RFU values in normal and CRLM tissue during the parenchymal phase are shown for each animal with the interquartile rangestated in brackets. Decrease of RFU from normal to CRLM tissue is shown in percent. Negative RFU values were thresholded to zero. �,no data collection as animal expired during experiment.
8 SCHNEIDER ET AL.
because to the best of our knowledge, pCLE imaging of acomparable small animal model has not been reported inthe past.Imaging at 660nmwavelength with ICGwas dominated
by the rapid uptake of ICG into the cytoplasm of normalhepatocytes. Visualising the whole field of view enabledsinusoid architecture to be identified, whereas on anintracellular level, hepatocyte nuclei could be observed asdark areas contrasted by the strong cytoplasmatic fluo-rescence signal. Localised regions of high intensity
fluorescence that were seen at the later stage of imagingcould not reliably be attributed to a specific feature of liverhistology. Because ICG is known to be exclusively excretedby bile [35], it is possible that these regions were small bileductules where the fluorophore accumulated before beingtransported to the larger bile ducts. During imageacquisition, no vascular contrast could be observed butoccasionally vessels could be identified as dark linear orcircular structures outlined against the bright surround-ing liver parenchyma.
Areas of CRLM were characterised by lack of ICGmediated fluorescence purportedly due to the lack of ICGuptake in the cancerous tissue. The absence of any relevantimaging signal prevented the characterisation of CRLMtissue with this wavelength and fluorophore combination.The general finding was that fluorescein in combinationwith CLE at 488nm was more suited to the imaging of thevasculature and for examining CRLM morphology, whichwas characterised by a mosaic of dark areas, irregularvasculature and, occasionally, glandular structures. Incontrast, CLE imaging of ICG at 660nm appeared to bebetter suited to assess the structure of sinusoids and thesurrounding hepatocytes.
Although some reports on in vivo CLE examination ofhuman liver disease have been published to date [17,36],no data exists describing the application of CLE in liversurgery for cancer. Several of the imaging featuresdescribed in this animal model, indicate that they couldbe usefully translated to patients. For example, thecombination of glandular architecture and proliferationof irregular vasculature with abnormal flow character-istics, as observed on CLE examination of fluorescein at488nm, is a common histological feature of humanCRLM [37–40]. A lack of ICG related fluorescence thatwas apparent at 660nm has previously been reportedusing camera based near-infrared imaging during liverresection for colorectal metastases [14].
The feasibility of using CLE intraoperatively to confirmcomplete removal of cancer in the resection of intracranialmalignancy has been demonstrated previously [41]. Thisapproach could also be of benefit during resection ofCRLM,where confirmation of malignancy at the borders of aresection may allow a more radical procedure to beperformed with the intention of increasing cure rates. Ifpresence of microscopic malignancy can be excluded on theother hand, it would allow surgeons to minimisethe resected total liver volume which in turn can reducethe incidence of postoperative complications [42].
The same rationale can also be applied to ablationtherapy of CRLM which is emerging as a feasiblealternative or auxiliary treatmentmodality beside surgicalresection. In liver ablation, cancerous tissue is destroyedby inducing coagulation necrosis through a variety ofmethods (e.g. radiofrequency, microwave ablation) [43].Our group has previously demonstrated in a porcinemodelthat laparoscopic pCLE enables discrimination betweennormal and ablated liver tissue [20]. Due to the difficultiesof establishingmalignancy in a large animalmodel [44], nopCLE examination of liver cancer was carried out. Because
Fig. 6. (a) Median RFU values�95%CI comparison betweennormal and CRLM tissue for each animal liver imaged at 488nmwith fluorescein. (b) Median RFU values�95%CI comparisonbetween normal and CRLM tissue for each animal liver imaged at660nm with ICG. Note that the median and 95%CI for CRLMtissue in animal ID 1 and ID2 is zero and is, therefore, notdisplaying on the bar chart.
LAPAROSCOPIC EVALUATION OF LIVER ABLATION 9
CellvizioTM and other non-commercial pCLE systems arenot yet licensed for clinical use during surgery, it wascrucial to investigate its potential benefit in an animalmodel before considering its clinical evaluation.
In the current study, itwas demonstrated that utilising adual wavelength approach may be more advantageousthan using single wavelength CLE [17,36], because twofluorophores and their respective imaging properties intissue can be evaluated in short succession. Fluoresceinand ICG CLE visualisation in hepatic tissue differsbecause the former has properties suited to the visualisa-tion of vasculature [36] whereas the latter is exclusivelycleared by the liver and, therefore, has a stronger affinity tohepatocytes and bile ducts [35].
Other groups have explored the potential of CLEimaging for identifying cancers and evaluated these inanimal models [16,45,46]. These, however, have beenbased on nonclinically approved CLE systemswhichwouldneed further development before they can be used in aclinical context [23,45]. The experiments outlined herewere all performedwith aCEmarkeddevice that has foundwidespread interest for the clinical diagnosis of malig-nancy [26,47–49] and it is hoped that the relativelywidespread dissemination of this CLE imaging platformcan help in facilitating the further clinical evaluation of thefindings presented here.
Previous articles on CLE imaging of malignancy havebeen based on subjective, observer dependent imageinterpretation but have not identified quantifiable andreproducible parameters of malignancy [23,50]. Toestablish such a quantifiable parameter that would allowdiscrimination between normal and malignant liver, atissue evaluation centred on numerical fluorescencevalues was proposed. A GLIMMIX analysis revealedthat normal liver tissue was more likely if high RFUvalues were recorded with either wavelength andfluorophore combination. Based on a random set ofobservations, a threshold probability value for distin-guishing normal liver from CRLM tissue has beenestablished for the measured CLE data. Subsequentvalidation on the remaining observations revealed a verygood and excellent diagnostic accuracy of 83.9 and 97.8%for the fluorescein/488 nm and ICG/660 nm, combination,respectively. Based on the diagnostic results in thevalidation datasets, CLE imaging of ICG at 660 nm maybe better suited for the use of fluorescence intensity todiscriminate between normal and CRLM tissue. Thesuperior performance when using CLE imaging of ICG at660nm for this purpose probably reflects the morehomogenous nature of CRLM tissue visualised withthis CLE setting. As described above, an abundance ofhigh intensity vascular structures seen with CLEimaging of fluorescein at 488 nm causes a heterogeneousimaging pattern in areas of CRLM. Whether a combina-tion of both fluorophore and wavelength combinationscan enhance diagnostic accuracy, could not be shown inthis study due to the inability of applying simultaneousdual waveband CLE imaging to exactly the same fieldof view. A new version of CellvizioTM capable of
simultaneous dual waveband imaging is now availablebut we did not have access to this system for applicationin this study.Because probability values used for ROC analysis are
based on a combination of a fixed (RFU) and a randomeffect (animal ID), it cannot be extrapolated into a specificRFU value for future studies. Before this can be consid-ered, it is crucial to standardise RFU value calibrationwhich could potentially result in reproducible and absolutefluorescence units that could be globally applied acrossdifferent research groups.Further limitations that have to be taken into account
regarding the presented findings pertain to the animalmodel and the technical characteristics of confocal lasermicroscopy. The animal model of CRLM that was studieduses a human cancer cell line and a portal venous route ofestablishing liver metastasis which is the most commonroute of GI malignancy disseminating to the liver inhumans [51]. Despite these similarities, research onmurine models of malignancy have well-described limi-tations when it comes to applying results to a clinicalsetting [52]. A further issue is that experiments havefocused on a single cell line of colorectal neoplasia. This cellline was chosen specifically because it exhibits a moderateto well differentiated tumour histology that can displaycolonic glandular architecture [53] and, therefore, was feltto bemore visually distinct on CLE imaging. It is, however,only representing a small spectrum of the histologicalcharacteristics that CRLM may exhibit on virtual histol-ogy and, therefore, further validation on different colorec-tal cancer cell lines may be necessary. No formal liverresection was carried out and, therefore, it is difficult topredict if cutting into CRLM tissuewould lead to alterationof its fluorescence properties.A clear trend for lower fluorescence intensity in CRLM
compared to healthy liver tissue was especially prominenton CLE imaging of ICG fluorescence, probably, because ithas a strong affinity for hepatic tissue. Colorectal cancerliver metastasis is a common indication for surgicalresection of liver malignancy in the western hemisphereand is generally regarded as the only curative treatmentoption for this disease [54,55]. Some of our results maybecome relevant for this patient population in the future,but it is unlikely that these findings can be directlytransferred to primary liver malignancy (e.g. hepatocellu-lar carcinoma), because fluorophore behaviour probablydepends on the organ of origin of the cancer. For example,groups examining patients undergoing liver resection foreither CRLM or hepatocellular carcinoma, found de-creased or increased ICG related fluorescence withincancerous tissue, respectively [14,56].Further restrictions that have to be accounted for are
related to the technology behind pCLE imaging. Opticalimaging modalities including CLE can visualise detailsdown to a sub-cellular level but at the cost of a limitedimaging depth. The maximal imaging depth of theCellvizioTM probes used by our group was 0–70mmdepending on probe type, which means that only livercell architecture that is either superficial or adjacent to the
10 SCHNEIDER ET AL.
resectionmargin could be assessed. It has been shown thatremoval of tumour within an area of <1mm conveys apatient survival benefit in the resection of CRLM [57].Therefore, a potential use ofCLEwould be to confirm that aresection margin is clear of cancer by probing the cutsurface. Because of CLE’s limited depth penetration, itshould not be considered as a potential substitute forintraoperative ultrasound imaging but more as a comple-mentary modality that expands the borders of intra-operative imaging into the microscopic domain. TheCellvizioTM probes used in this study had a maximal fieldof view of 600mm2 which may limit its applicability in theclinical examination of liver resection margins which areusually in the cm2-range. It has previously been shown,however, that clinically relevant pCLE imagingwith afieldof view of approximately 2mm2 [17] is possible. Roboticcontrol of pCLE during laparoscopic liver surgery has beenutilised to create even larger fields of view [58]. If clinicaltranslation for intraoperative use of pCLE is considered, itwould be crucial to encourage the development of probesthat offer a field of view of � 1mm2, because this wouldgreatly improve the integration of pCLE imaging into thesurgical workflow.Currently, CellvizioTM probes are only marketed for
endoscopic applications and are not certified for intra-operative use. Some of the probes, however, can be fullysterilised and may potentially be used for imaging duringlaparoscopic liver resection. If a clinical benefit for theintraoperative usage of this system can be defined, sterilityissues and clinical re-certification should not present amajor obstacle.In conclusion, a clinically licensed pCLE system was
used to provide a detailed description of discriminatorytissue characteristics in an orthotopic murine model ofCRLM. A dual wavelength approach in conjunction withtwo fluorophores was found to be of benefit because CLEimaging of fluorescein at 488nm enabled better visuali-sation of metastatic tissue whereas quantification of ICGmediated fluorescence intensity demonstrated a betterpotential to objectively discriminate between normalliver and CRLM tissue at a cellular level. Evaluation ofsimultaneous (i.e. nonsequential) dual waveband imag-ing and standardisation of fluorescence values is thenext crucial step to advance pCLE imaging of livermalignancy.
ACKNOWLEDGMENTS
This publication presents independent research commis-sioned by the Health Innovation Challenge Fund (HICF-T4-317), a parallel funding partnership between theWellcome Trust and the Department of Health. The viewsexpressed in this publication are those of the author(s) andnot necessarily those of the Wellcome Trust or theDepartment of Health. SWS is supported by the WellcomeTrust (WT100247MA).
REFERENCES
1. Ferlay J, Soerjomataram I, Dikshit R, Eser S, Mathers C,Rebelo M, Parkin DM, Forman D, Bray F. Cancer incidence
and mortality worldwide: Sources, methods and majorpatterns in GLOBOCAN 2012. Int J Cancer 2015;136(5):E359–E386.
2. Van Cutsem E, Nordlinger B, Cervantes A. Advancedcolorectal cancer: ESMO Clinical Practice Guidelines fortreatment. Ann Oncol 2010;21(Suppl 5):v93–v97.
3. Helling TS, Martin M. Cause of death from liver metasta-ses in colorectal cancer. Ann Surg Oncol 2014;21(2):501–506.
4. Page AJ, Cosgrove DC, Herman JM, Pawlik TM. Advances inunderstanding of colorectal liver metastasis and implicationsfor the clinic. Expert Rev Gastroenterol Hepatol 2015;9(2):245–259.
5. Pawlik TM, Schulick RD, Choti MA. Expanding criteria forresectability of colorectal liver metastases. Oncologist2008;13(1):51–64.
6. Antoniou A, Lovegrove RE, Tilney HS, Heriot AG, John TG,Rees M, Tekkis PP, Welsh FK. Meta-analysis of clinicaloutcome after first and second liver resection for colorectalmetastases. Surgery 2007;141(1):9–18.
7. de Jong MC, Pulitano C, Ribero D, Strub J, Mentha G,Schulick RD, Choti MA, Aldrighetti L, Capussotti L, PawlikTM. Rates and patterns of recurrence following curativeintent surgery for colorectal liver metastasis: An interna-tional multi-institutional analysis of 1669 patients. Ann Surg2009;250(3):440–448.
8. Welsh FK, Tekkis PP, O’Rourke T, John TG, Rees M.Quantification of risk of a positive (R1) resection marginfollowing hepatic resection for metastatic colorectal cancer:An aid to clinical decision-making. Surg Oncol 2008;17(1):3–13.
9. Torzilli G, Del FabbroD, PalmisanoA, DonadonM, Bianchi P,Roncalli M, Balzarini L, Montorsi M. Contrast-enhancedintraoperative ultrasonography during hepatectomies forcolorectal cancer liver metastases. J Gastrointest Surg2005;9(8):1148–1153; discussion 1153-4.
10. Conlon R, Jacobs M, Dasgupta D, Lodge JPA. The value ofintraoperative ultrasound during hepatic resection comparedwith improved preoperative magnetic resonance imaging.Eur J Ultrasound. 2003;16(3):211–216.
11. Kishi Y, Abdalla EK, Chun YS, Zorzi D, Madoff DC, WallaceMJ, Curley SA, Vauthey JN. Three hundred and oneconsecutive extended right hepatectomies: Evaluation ofoutcome based on systematic liver volumetry. Ann Surg2009;250(4):540–548.
12. Kenngott HG, Wagner M, Gondan M, Nickel F, Nolden M,Fetzer A, Weitz J, Fischer L, Speidel S, Meinzer H-P, B€ocklerD, B€uchler MW, M€uller-Stich BP. Real-time image guidancein laparoscopic liver surgery: First clinical experience with aguidance system based on intraoperative CT imaging. SurgEndosc 2014;28(3):933–940.
13. Chopra SS, Schmidt SC, Eisele R, Teichgr€aber U, Van DerVoort I, Seebauer C, Streitparth F, Schumacher G. Initialresults of MR-guided liver resection in a high-field open MRI.Surg Endosc Other Interv Tech 2010;24(10):2506–2512.
14. Peloso A, Franchi E, Canepa MC, Barbieri L, Briani L,Ferrario J, Bianco C, Quaretti P, Brugnatelli S, Dionigi P,Maestri M. Combined use of intraoperative ultrasound andindocyanine green fluorescence imaging to detect livermetastases from colorectal cancer. HPB 2013;15(12):928–934.
15. Zhu Y, Gao W, Zhou Y, Guo Y, Guo F, He Y. Rapid and high-resolution imaging of human liver specimens by full-fieldoptical coherence tomography. J Biomed Opt 2015;20(11):116010.
16. Goetz M, Fottner C, Schirrmacher E, Delaney P, Gregor S,Schneider C, Strand D, Kanzler S, Memadathil B, Weyand E,HoltmannM, Schirrmacher R,WeberMM, AnlaufM, Kl€oppelG, Vieth M, Galle PR, Bartenstein P, Neurath MF, KiesslichR, Kloppel G. In-vivo confocal real-time mini-microscopy inanimal models of human inflammatory and neoplasticdiseases. Endoscopy 2007;39(4):350–356.
17. Goetz M, Deris I, Vieth M, Murr E, Hoffman A, Delaney P,Galle PR, Neurath MF, Kiesslich R. Near-infrared confocalimaging during mini-laparoscopy: A novel rigid endomicro-scope with increased imaging plane depth. J Hepatol2010;53(1):84–90.
LAPAROSCOPIC EVALUATION OF LIVER ABLATION 11
18. Goetz M, Ansems JV, Galle PR, Schuchmann M, Kiesslich R.In vivo real-time imaging of the liver with confocal endomi-croscopy permits visualization of the temporospatial patternsof hepatocyte apoptosis. Am J Physiol Gastrointest LiverPhysiol 2011;301(5):G764–G772.
19. Leggett CL, Gorospe EC, Chan DK, Muppa P, Owens V,Smyrk TC, Anderson M, Lutzke LS, Tearney G, Wang KK.Comparative diagnostic performance of volumetric laserendomicroscopy and confocal laser endomicroscopy in thedetection of dysplasia associated with Barrett’s esophagus.Gastrointest Endosc 2016;83(5):880–888.e2.
20. Schneider C, Johnson SP, Walker-Samuel S, Gurusamy K,Clarkson MJ, Thompson S, Song Y, Totz J, Cook RJ,Desjardins AE, Hawkes DJ, Davidson BR. Utilizing confocallaser endomicroscopy for evaluating the adequacy of laparo-scopic liver ablation. Lasers Surg Med 2016;48(3):299–310.
21. Goetz M, Kiesslich R. Advances of endomicroscopy forgastrointestinal physiology and diseases. Am J PhysiolGastrointest Liver Physiol 2010;298(6):G797–G806.
22. vonDelius S, FeussnerH,WilhelmD, Karagianni A,Henke J,Schmid RM, Meining A. Transgastric in vivo histology in theperitoneal cavity usingminiprobe-based confocal fluorescencemicroscopy in an acute porcine model. Endoscopy2007;39(5):407–411.
23. GoetzM,HoetkerMS, DikenM, Galle PR, Kiesslich R. In vivomolecular imaging with cetuximab, an anti-EGFR antibody,for prediction of response in xenograft models of humancolorectal cancer. Endoscopy 2013;45(6):469–477.
24. Bok GH, Jeon SR, Cho JY, Cho JH, Lee WC, Jin SY, Choi IH,Kim HG, Lee TH, Park EJ. The accuracy of probe-basedconfocal endomicroscopy versus conventional endoscopicbiopsies for the diagnosis of superficial gastric neoplasia(with videos). Gastrointest Endosc 2013;77(6):899–908.
25. Chang TC, Liu JJ, Liao JC. Probe-based confocal laserendomicroscopy of the urinary tract: The technique. J Vis Exp2013;71:e4409.
26. Fuchs FS, Zirlik S, Hildner K, Schubert J, Vieth M, NeurathMF. Confocal laser endomicroscopy for diagnosing lungcancer in vivo. Eur Respir J 2013;41(6):1401–1408.
27. Giovannini M, Bories E, Monges G, Pesenti C, Caillol F,Delpero JR. Results of a phase I-II study on intraductalconfocal microscopy (IDCM) in patients with commonbile duct (CBD) stenosis. Surg Endosc 2011;25(7):2247–2253.
28. De Palma GD, Esposito D, Luglio G, Limite G, Accurso A,Sollazzo V, Maione F, Cassese G, Siciliano S, Gennarelli N,Ilardi G, Paternoster M, Giglio MC, Forestieri P. Confocallaser endomicroscopy in breast surgery: A pilot study. BMCCancer 2015;15:252.
29. Nathan C-AO, Kaskas NM, Ma X, Chaudhery S, Lian T,Moore-Medlin T, Shi R, Mehta V. Confocal laser endomicro-scopy in the detection of head and neck precancerous lesions.Otolaryngol Head Neck Surg 2014;151(1):73–80.
30. Workman P, Aboagye EO, Balkwill F, Balmain A, Bruder G,Chaplin DJ, Double JA, Everitt J, FarninghamDAH, GlennieMJ, Kelland LR, Robinson V, Stratford IJ, Tozer GM,WatsonS, Wedge SR, Eccles SA. Guidelines for the welfare and use ofanimals in cancer research. Br J Cancer 2010;102(11):1555–1577.
31. Rajkumar V, Goh V, Siddique M, Robson M, Boxer G, PedleyRB, Cook GJR. Texture analysis of (125)I-A5B7 anti-CEAantibody SPECT differentiates metastatic colorectal cancermodel phenotypes and anti-vascular therapy response. Br JCancer 2015;112(12):1882–1887.
32. Le Goualher G, Perchant A, Genet M, Cave C, Viellerobe B,Berier R, Abrat B, AyacheN. Towards optical biopsieswith anintegrated fibered confocal fluorescence microscope. Lect-Notes-Comput-Sci 2004;3217:761–768.
33. Lewandowski D, Barroca V, Ducong�e F, Bayer J, Van NhieuJT, Pestourie C, Fouchet P, Tavitian B, Rom�eo P-H. In vivocellular imaging pinpoints the role of reactive oxygen speciesin the early steps of adult hematopoietic reconstitution. BloodAm Soc Hematol 2010;115(3):443–452.
34. Jain RK. Normalization of tumor vasculature: An emergingconcept in antiangiogenic therapy. Science 2005;307(5706):58–62.
35. Alander JT, Kaartinen I, Laakso A, P€atil€a T, Spillmann T,Tuchin VV, Venermo M, V€alisuo P. A review of indocyaninegreen fluorescent imaging in surgery. Int J Biomed Imaging2012;2012:940585.
36. Goetz M, Kiesslich R, Dienes H-PP, Drebber U, Murr E,Hoffman A, Kanzler S, Galle PR, Delaney P, Neurath MF. Invivo confocal laser endomicroscopy of the human liver: A novelmethod for assessing liver microarchitecture in real time.Endoscopy 2008;40(7):554–562.
37. Rubbia-Brandt L, Giostra E, Brezault C, Roth AD, Andres A,Audard V, Sartoretti P, Dousset B, Majno PE, Soubrane O,Chaussade S, Mentha G, Terris B. Importance of histologicaltumor response assessment in predicting the outcome inpatients with colorectal liver metastases treated with neo-adjuvant chemotherapy followed by liver surgery. Ann Oncol2007;18(2):299–304.
38. Vermeulen PB, Colpaert C, Salgado R, Royers R, HellemansH, Van Den Heuvel E, Goovaerts G, Dirix LY, Van Marck E.Liver metastases from colorectal adenocarcinomas grow inthree patterns with different angiogenesis and desmoplasia.J Pathol 2001;195(3):336–342.
39. Fukumura D, Jain RK. Tumor microvasculature and micro-environment: Targets for anti-angiogenesis and normaliza-tion. Microvasc Res 2007;74(2–3):72–84.
40. Stoeltzing O, Liu W, Reinmuth N, Parikh A, Ahmad SA,Jung YD, Fan F, Ellis LM. Angiogenesis and antiangiogenictherapy of colon cancer liver metastasis. Ann Surg Oncol2003;10(7):722–733.
41. Martirosyan NL, Cavalcanti DD, Eschbacher JM, DelaneyPM, Scheck AC, Abdelwahab MG, Nakaji P, Spetzler RF,Preul MC. Use of in vivo near-infrared laser confocalendomicroscopy with indocyanine green to detect the bound-ary of infiltrative tumor. JNeurosurg 2011;115(6):1131–1138.
42. SchindlMJ, RedheadDN, FearonKCH,GardenOJ,WigmoreSJ. The value of residual liver volume as a predictor of hepaticdysfunction and infection after major liver resection. Gut2005;54(2):289–296.
43. Kulaylat MN, Gibbs JF. Thermoablation of colorectal livermetastasis. J Surg Oncol 2010;101(8):699–705.
44. Li X, Zhou X, Guan Y, Wang Y-XJ, Scutt D, Gong Q-Y.N-nitrosodiethylamine-induced pig liver hepatocellular car-cinoma model: Radiological and histopathological studies.Cardiovasc Intervent Radiol 2006;29(3):420–428.
45. Schulz P, Dierkes C, Wiedenmann B, Gr€otzinger C. Near-infrared confocal laser endomicroscopy detects colorectalcancer via an integrin avb3 optical probe. Mol Imaging Biol2015;17(4):450–460.
46. Eser S, Messer M, Eser P, von Werder A, Seidler B,Bajbouj M, Vogelmann R, Meining A, von Burstin J, Alg€ulH, Pagel P, Schnieke AE, Esposito I, Schmid RM,Schneider G, Saur D. In vivo diagnosis of murinepancreatic intraepithelial neoplasia and early-stage pan-creatic cancer by molecular imaging. Proc Natl Acad SciUSA 2011;108(24):9945–9950.
47. Meining A, Frimberger E, Becker V, Von Delius S, VonWeyhern CH, Schmid RM, Prinz C. Detection of cholangio-carcinoma in vivo using miniprobe-based confocal fluores-cence microscopy. Clin Gastroenterol Hepatol 2008;6(9):1057–1060.
48. LiuH,Li Y-Q,YuT, ZhaoY-A, Zhang J-P, Zhang J-N,GuoY-T,Xie X-J, Zhang T-G, Desmond PV. Confocal endomicroscopyfor in vivo detection of microvascular architecture in normaland malignant lesions of upper gastrointestinal tract.J Gastroenterol Hepatol 2008;23(1):56–61.
49. Hurlstone DP, Baraza W, Brown S, Thomson M, Tiffin N,Cross SS. In vivo real-time confocal laser scanningendomicroscopic colonoscopy for the detection and charac-terization of colorectal neoplasia. Br J Surg 2008;95(5):636–645.
50. Goetz M, Fottner C, Schirrmacher E, Delaney P, Gregor S,Schneider C, Strand D, Kanzler S, Memadathil B, Weyand E,HoltmannM, Schirrmacher R,WeberMM, AnlaufM, KloppelG, Vieth M, Galle PR, Bartenstein P, Neurath MF, KiesslichR. In-vivo confocal real-time mini-microscopy in animalmodels of human inflammatory and neoplastic diseases.Endoscopy 2007;39(4):350–356.
12 SCHNEIDER ET AL.
51. Chambers AF, Groom AC, MacDonald IC. Dissemination andgrowth of cancer cells in metastatic sites. Nat Rev Cancer2002;2(8):563–572.
52. Frese KK, Tuveson DA. Maximizing mouse cancer models.Nat Rev Cancer 2007;7(9):645–658.
53. Johnson SP, Ogunlade O, Zhang E, Laufer J, Rajkumar V,Pedley RB, Beard P. Photoacoustic tomography of vasculartherapy in a preclinical mouse model of colorectal carci-noma. In: Oraevsky AA, Wang LV, editors. SPIE BiOS.Bellingham WA: International Society for Optics andPhotonics; 2014. pp 89431R.
54. Rees M, Tekkis PP, Welsh FK, O’Rourke T, John TG.Evaluation of long-term survival after hepatic resection formetastatic colorectal cancer: A multifactorial model of 929patients. Ann Surg 2008;247(1):125–135.
55. Mbah NA, Scoggins C, McMasters K, Martin R. Impact ofhepatectomy margin on survival following resection of
colorectal metastasis: The role of adjuvant therapy and itseffects. Eur J Surg Oncol 2013;39(12):1394–1399.
56. Abo T, Nanashima A, Tobinaga S, Hidaka S, Taura N, TakagiK, Arai J, Miyaaki H, Shibata H, Nagayasu T. Usefulness ofintraoperative diagnosis of hepatic tumors located at the liversurface and hepatic segmental visualization using indocya-nine green-photodynamic eye imaging. Eur J Surg Oncol2015;41(2):257–264.
57. Allen PJ, Ronald P, Kingham TP, Kemeny N, Blumgart LH,Jarnagin WR, Angelica MID. Resection margin and survivalin 2368 patients undergoing hepatic resection for metastaticcolorectal cancer. Ann Surg 2015;262(3):476–485.
58. Gayet B, Validire P, Pierangelo A, Benali A, Fuks D,Takahashi H, Moslim MA, Presser N, Chalikonda S, WalshRM. Technical feasibility of confocal laser endomicroscopy inlaparoscopic surgery: The persee project. Gastroenterol2015;148(4):S-1160.
LAPAROSCOPIC EVALUATION OF LIVER ABLATION 13