identification of novel stat3 target genes associated with oncogenesis
TRANSCRIPT
University of South FloridaScholar Commons
Graduate Theses and Dissertations Graduate School
January 2011
Identification of Novel STAT3 Target GenesAssociated with OncogenesisRachel HavilandUniversity of South Florida, [email protected]
Follow this and additional works at: http://scholarcommons.usf.edu/etd
Part of the American Studies Commons, Cell Biology Commons, and the Molecular BiologyCommons
This Dissertation is brought to you for free and open access by the Graduate School at Scholar Commons. It has been accepted for inclusion inGraduate Theses and Dissertations by an authorized administrator of Scholar Commons. For more information, please [email protected].
Scholar Commons CitationHaviland, Rachel, "Identification of Novel STAT3 Target Genes Associated with Oncogenesis" (2011). Graduate Theses andDissertations.http://scholarcommons.usf.edu/etd/3729
Identification of Novel STAT3 Target Genes Associated with Oncogenesis
by
Rachel Haviland
A dissertation submitted in partial fulfillment of the requirements for the degree of
Doctor of Philosophy Department of Cancer Biology
College of Arts & Sciences University of South Florida
Co-Major Professor: Richard Jove, Ph.D. Co-Major Professor: W. Douglas Cress, Ph.D.
Kenneth L. Wright, Ph.D. Sheng Wei, M.D.
Date of Approval: November 4, 2011
Keywords: Signal Transducer and Activator of Transcription, Cancer, Transcription, Necdin, Microarray
Copyright © 2011, Rachel Haviland

DEDICATION
This dissertation is dedicated to my husband, Peter Haviland. Thank you for
making me promise you that I would never give up!
I would also like to give special thanks and appreciation to Dr. Richard Jove for
being a never ending source of encouragement and support despite all the odds. You
are a true gift to the scientific community and a graduate student is blessed to have you
as their mentor.
Thanks also go to my parents, Keith and Lyn Radbourne, for their unceasing
support and faith in me throughout my whole life.
ACKNOWLEDGEMENTS
Receiving a Ph.D. is a team effort and I am honored to have been surrounded by
a fantastic group of professionals. I would like to thank my advisor and mentor Richard
Jove, Ph.D. for the years of guidance, assistance, and training that he contributed to and
invested in me. I would also like to thank my Ph.D. committee members W. Douglas
Cress, Ph.D., Kenneth L. Wright, Ph.D. and Sheng Wei, M.D. for their support, guidance
and direction throughout my doctoral training. Special appreciation goes to Dr. W.
Douglas Cress for graciously welcoming me into his lab. Thanks also goes to James
Turkson, Ph.D. for being so kind as to serve as my outside chair, and the core facilities
of the H. Lee Moffitt Cancer Center and Research Institute for their respective
contributions to this project, and finally the Cancer Biology Ph.D. Program, the University
of South Florida, and the H. Lee Moffitt Cancer Center and Research Center for
providing me with the opportunity to accomplish this goal. This work was supported in
part by the Angela Musette Russo Foundation (http://www.russofoundation.com/), H.
Lee Moffitt Cancer Center and Research Institute (http://www.moffitt.org) and NCI Grant
R01-CA115674 (http://www.cancer.gov/)
NOTE TO READER
The original of this document contains color that is necessary for understanding
the data. The original dissertation is on file with the USF library in Tampa, Florida.
i
TABLE OF CONTENTS LIST OF TABLES............................................................................................................. iv LIST OF FIGURES............................................................................................................ v LIST OF ABBREVIATIONS..............................................................................................vii ABSTRACT .................................................................................................................. ix CHAPTER 1: INTRODUCTION ........................................................................................ 1 Signal Transduction and Oncogenes .................................................................... 1 Signal Transducers and Activators of Transcription .............................................. 3 Activation of STATs in Normal Signal Transduction.............................................. 7 Serine phosphorylation of STATs........................................................................ 10 Nuclear Import and Export of STAT Proteins ...................................................... 11 Negative Regulation of STAT Signal Transduction ............................................. 12 Biological Functions of STAT Proteins ................................................................ 16 Activation of STATs in Oncogenesis ................................................................... 17 Interaction of STATs with other proteins ............................................................. 19 The Role of STAT3 in Cancer ............................................................................. 21 STAT3-regulated genes ...................................................................................... 22
STAT3 Regulation of Cell Growth and Proliferation ................................ 22 STAT3 Regulation of Cell Survival and Apoptosis................................... 23 STAT3 Regulation of Angiogenesis and Metastasis................................ 23 STAT3 in Inflammation and Immune Evasion ......................................... 25
Identifying Novel STAT3 Target Genes............................................................... 25 Experimental Activation of STAT3....................................................................... 27
Activation of STAT3 by IL-6 ..................................................................... 27 Activation of STAT3 by v-Src................................................................... 29 Activation of STAT3 by expression of STAT3-C...................................... 29
Identifying Changes in Gene Expression ............................................................ 30 Pathway Analysis of Genes................................................................................. 31 Functional Analysis of Genes.............................................................................. 31 Necdin – A Negative Growth Regulator............................................................... 32 Necdin Protein family............................................................................... 33 Necdin Protein structure .......................................................................... 33 NDN Gene Structure and Regulation of Expression................................ 34 Necdin Localization.................................................................................. 35 Biological Functions, Mechanisms, and Regulation ................................ 36 Necdin Protein-Protein Interactions ......................................................... 38 Role of Necdin in Disease ....................................................................... 41 Summary and Rationale.................................................................................................. 43
ii
CHAPTER 2: MATERIALS AND METHODS .................................................................. 45
Cell Culture and Reagents ................................................................................ 45
Expression Vectors ............................................................................................. 46
siRNA Transfections............................................................................................ 46
Isolation of RNA .................................................................................................. 46
Quantitative Real-time PCR ............................................................................... 46
Preparation of labeled RNA for hybridization ...................................................... 47
Array Hybridization and Scanning ....................................................................... 48
Normalization of Microarray Data ........................................................................ 49
Significance Analysis of Microarrays ................................................................... 50
Overlap of the Two Microarray Data Sets ........................................................... 51
Computational Analysis of Microarray Data ........................................................ 52
Nuclear Extract Preparation and EMSA .............................................................. 52
Western Blot Analysis ......................................................................................... 53
Chromatin Immunoprecipitation .......................................................................... 53
CHAPTER 3: RESULTS ................................................................................................. 55
PART I: Induction of STAT3 Activity in Mouse Fibroblasts.................................. 55
IL-6 Induces STAT3 DNA Binding in Mouse Fibroblasts ......................... 55
Kinetics of IL-6 Response in Mouse Fibroblasts...................................... 58
STAT3 Activation in the absence of de novo protein synthesis............... 61
v-Src Transformation Induces Constitutive STAT3 Activation in
Mouse Fibroblasts ............................................................................. 62
Activation of STAT3 Signaling by STAT3-C ............................................ 63
Summary ................................................................................................. 64
PART II: Analysis of STAT3-Regulated Gene Expression ................................. 66
Identification of Potential STAT3 Target Genes Expressed
Upon IL-6 Stimulation ........................................................................ 66
Identification of Genes Induced by IL-6 Activation of STAT3 .................. 70
Summary ................................................................................................. 71
Identification of STAT3 Target Genes in Cells Expressing
v-Src and STAT3-C ........................................................................... 74
Overlap of the Two Microarray Data Sets................................................ 74
Pathway Analysis Reveals Known and Novel Functions of STAT3......... 78
iii
Functions of Induced Genes.................................................................... 81
PART III: Necdin is a Novel STAT3 Target Gene............................................... 84
Constitutively Activated STAT3 Blocks Necdin mRNA Expression ......... 84
Repression of Necdin mRNA Expression is STAT3 Dependent.............. 87
Activated STAT3 binds to the NDN promoter in vitro .............................. 88
Binding of STAT3 to the NDN Promoter in vivo....................................... 91
Necdin Expression Is Repressed in Human Melanoma Cells ................. 93
IL-6 Represses Necdin Expression in Prostate Cancer Cells.................. 96
Necdin Expression Correlates with STAT3 Activity in Human
Breast Cancer Cells........................................................................... 97
Summary ................................................................................................. 99
CHAPTER 4: DISCUSSION......................................................................................... 100
CHAPTER 5: CLINICAL SIGNIFICANCE ..................................................................... 107
REFERENCES.............................................................................................................. 109
APPENDIX ............................................................................................................... 123
ABOUT THE AUTHOR ....................................................................................... End Page
iv
LIST OF TABLES
Table 1 Activation of STATs in Human Cancers .................................................. 19 Table 2 Average fold-change of the most significant genes upregulated by IL-6...................................................................................................... 71 Table 3 Most significant genes overexpressed in common to STAT3-C and v-Src ................................................................................................. 76 Table 4 Most significant genes underexpressed in common to STAT3-C and v-Src ................................................................................................. 77 Table 5 Enriched pathways in genes differentially expressed by STAT3-C and v-Src ................................................................................................. 80 Table 6 Functional enrichment (based on GO Biological Process) in genes
differentially expressed in common by STAT3-C and v-Src using DAVID ............................................................................................ 82 Table A-1 Most Significant Probesets Over-Expressed Common to
STAT3-C and v-Src..................................................................... 123 Table A-2 Most Significant Probesets Under-Expressed Common to STAT3-C and v-Src ............................................................................... 126
v
LIST OF FIGURES Figure 1. General structure of the STAT protein family ............................................ 6 Figure 2. Normal and oncogenic STAT signaling pathways .................................... 9 Figure 3. IL-6 Induces STAT3 DNA Binding in Balb/c-3T3 cells............................. 56 Figure 4. IL-6 Induces STAT3 DNA Binding in NIH3T3 cells.................................. 57 Figure 5. IL-6 induces STAT3 DNA binding in NIH3T3 cells in a ........................... 57 dose-responsive manner Figure 6. IL-6 induces STAT3 phosphorylation in Balb/c-3T3 cells in a time-
dependent manner .................................................................................. 58 Figure 7. Single dose IL-6 treatment induces STAT3 phosphorylation in Balb/c-3T3 cells at multiple time points ................................................... 59 Figure 8. IL-6 induces STAT3 phosphorylation in NIH3T3 cells in a time- dependent manner. ................................................................................. 60 Figure 9. Single dose IL-6 treatment induces STAT3 phosphorylation in
Balb/c-3T3 cells at multiple time points ................................................... 60 Figure 10. IL-6 stimulates STAT3 activation in the absence of de novo protein
synthesis.................................................................................................. 61 Figure 11. v-Src transformation induces constitutive STAT3 activity in mouse
fibroblasts ................................................................................................ 62 Figure 12. Mouse fibroblasts stably expressing v-Src or STAT3-C show constitutive STAT3 activity....................................................................... 63 Figure 13. Volcano plot of genes induced by IL-6 at 1 h in mouse fibroblasts.......... 67 Figure 14. Volcano plot of genes induced in mouse fibroblasts by IL-6 at 1 h in the presence of cycloheximide............................................................. 69 Figure 15. Most significant genes induced by IL-6 compared to control................... 70 Figure 16. Most significant genes induced by IL-6 in the presence of CHX compared to CHX control ........................................................................ 72
vi
Figure 17. Biological processes regulated by STAT3-C ........................................... 83 Figure 18. Necdin expression in cells with activated STAT3 .................................... 85 Figure 19. Analysis of Necdin expression in cell lines stably expressing v-Src
or STAT3-C ............................................................................................ 86 Figure 20. Inhibition of STAT3 activity correlates with Necdin expression ............... 87 Figure 21. STAT3 binds directly to the NDN promoter ............................................. 88 Figure 22. Competition EMSA confirms STAT3 binding to the NDN promoter......... 90 Figure 23. Chromatin immunoprecipitation assay (ChIP) confirms STAT3
binds the NDN promoter in vivo............................................................... 92 Figure 24. STAT3 downregulates Necdin expression in A375 human
melanoma cells........................................................................................ 94 Figure 25. Inhibition of STAT3 activity in A375 human melanoma cells
restores Necdin expression ..................................................................... 95 Figure 26. Necdin expression correlates with STAT3 activity in prostate
cancer cell lines ..................................................................................... 96 Figure 27. Expression of Necdin mRNA in breast tumors and normal
adjacent breast tissue.............................................................................. 97 Figure 28. STAT3 activity down-regulates Necdin expression in human
breast cancer cell lines ............................................................................ 98 Figure 29. Inhibition of STAT3 restores Necdin expression in MCF7 breast
cancer cells.............................................................................................. 98
vii
LIST OF ABBREVIATIONS
APP acute phase protein
Bcl-2 B-cell lymphoma/leukemia-2
bp base pairs
Cdk Cyclin-dependent kinase
cDNA complimentary deoxyribonucleic acid
ChIP Chromatin immunoprecipitation
CHX Cyclohexamide
DNA deoxyribonucleic acid
E2F Early 2 factor
EMSA Electrophoretic mobility shift assay
ERK extracellular signal-regulated kinase
FBS Fetal bovine serum
GFP Green fluorescent protein
GPCR G-protein coupled receptor
IL-6 interleukin-6
IRF IFN regulatory factor
JAB Jak-binding proteins
kDa kilodalton
Mcl-1 Myeloid cell leukemia-1
NES Nuclear export/exclusion sequence
NLS Nuclear localization sequence
viii
PBS phosphate buffered saline
PCR Polymerase chain reaction
PIAS protein inhibitor of activated STATs
PKC Protein kinase C
P/S Penicillin/streptomycin
Rb Retinblastoma
RT room temperature
SIE Serum-inducible element
siRNA Small inhibitory RNA
SOCS suppressor of cytokine signaling
SSI STAT-induced STAT inhibitor
STAT signal transducer and activator of transcription
StIP1 STAT3-interacting protein
ul micro liter
ix
ABSTRACT
Cytokine and growth factor signaling pathways involving STAT3 are frequently
constitutively activated in many human primary tumors, and are known for the
transcriptional role they play in controlling cell growth and cell cycle progression.
However, the extent of STAT3's reach on transcriptional control of the genome as a
whole remains an important question. We predicted that this persistent STAT3 signaling
affects a wide variety of cellular functions, many of which still remain to be characterized.
We took a broad approach to identify novel STAT3 regulated genes by
examining changes in the genome-wide gene expression profile by microarray, using
cells expressing constitutively-activated STAT3. Using computational analysis, we were
able to define the gene expression profiles of cells containing activated STAT3 and
identify candidate target genes with a wide range of biological functions. Among these
genes we identified Necdin, a negative growth regulator, as a novel STAT3 target gene,
whose expression is down-regulated at the mRNA and protein levels when STAT3 is
constitutively active. This repression is STAT3 dependent, since inhibition of STAT3
using siRNA restores Necdin expression. A STAT3 DNA-binding site was identified in
the Necdin promoter and both EMSA and chromatin immunoprecipitation confirm binding
of STAT3 to this region. Necdin expression has previously been shown to be down-
regulated in a melanoma and a drug-resistant ovarian cancer cell line. Further analysis
of Necdin expression demonstrated repression in a STAT3-dependent manner in human
melanoma, prostate and breast cancer cell lines.
x
These results suggest that STAT3 coordinates expression of genes involved in
multiple metabolic and biosynthetic pathways, integrating signals that lead to global
transcriptional changes and oncogenesis. STAT3 may exert its oncogenic effect by up-
regulating transcription of genes involved in promoting growth and proliferation, but also
by down-regulating expression of negative regulators of the same cellular processes,
such as Necdin.
1
CHAPTER 1: INTRODUCTION
Signal Transduction and Oncogenesis
Normal cells have a network of molecular controls that tightly regulate growth
and proliferation, preventing cell division in the absence of key environmental stimuli,
such as mitogenic growth factors and signals from the extracellular matrix (ECM).
Cancer cells have typically lost some of the molecular controls that regulate normal cell
division, allowing them to divide in an unregulated manner even in the absence of
extracellular cues (Hanahan and Weinberg, 2000).
Oncogenesis, or carcinogenesis, is the process by which normal cells are
transformed into cancer cells. The initiation and promotion of cancer is a complex, multi-
step process characterized by progressive cellular and genetic changes that reprogram
a cell and lead to uncontrolled cell division and the formation of a malignant mass
(Weinstein, 1987). Despite the fact that neoplastic development is a highly complex
process, cancer cells do exhibit certain hallmarks or biological capabilities which are
acquired during oncogenesis. These hallmarks include: sustaining a proliferative signal;
evading growth suppressors; resisting cell death; enabling replicative immortality;
inducing angiogenesis and activating invasion and metastasis (Hanahan and Weinberg,
2000), as well as the contribution of the tumor microenvironment (Hanahan and
Weinberg).
The underlying trait of oncogenesis is genomic instability, which usually begins
with changes in the expression of particular genes (proto-oncogenes and tumor
suppressor genes), caused by mutations in DNA. This destabilization of the genome
2
during carcinogenesis results in changes in gene activity and stability (Vogelstein et al.,
2000) and affect many genes involved in cell cycle control, DNA damage responses and
checkpoints, as well as DNA repair. The expression and activity of growth factors and
their receptors and signaling molecules are often affected, thus disrupting the tightly
controlled and orderly signal transduction processes that regulate cell growth and
division.
Oncogenes are mutated versions of normal cellular genes (proto-oncogenes),
which are capable of transforming a cell. They may contribute to the growth of a tumor
by causing a cell to divide in an unregulated manner, particularly in the absence of
normal growth signals. In contrast, tumor suppressor genes (TSGs) act as protective
genes that usually limit or block one step in the development of tumors. A mutation in a
TSG, or deletion of the gene, can predispose an individual to cancer by causing the loss
of function of the tumor suppressor protein encoded by the gene (Knudson, 2002).
Oncogenic mutations are usually ‘dominant’, requiring a mutation in only one
allele in order for the cellular phenotype to be affected. Unlike oncogenes, changes in
tumor suppressor genes are usually recessive. Tumor suppressor genes follow a ‘two-
hit hypothesis’ (Knudson, 1971), whereby both of the alleles that code for a particular
gene just be affected before the biological function is sufficiently affected and the
phenotype of the cell is altered.
Signal transduction pathways are the processes whereby the cell mediates the
sensing and processing of stimuli and are essential for development, cell differentiation
and homeostasis (Hanahan and Weinberg, 2000). These cascades act as molecular
circuits capable of detecting, amplifying and integrating a diverse array of extracellular
signals to generate appropriate intracellular responses. For example, an extracellular
signaling molecule activates a receptor in the cell membrane, initiating a cascade of
signaling events within the cell in response. In a two-step process, the extracellular
3
signaling molecule binds to a specific receptor on the cell membrane followed by the
stimulation of a second messenger within the cell which propagates the signal into the
cell to elicit a full physiological response (Taga and Kishimoto, 1997).
Multiple signal transduction pathways exist within a normal cell and their
dysregulation is frequently associated with the malignant phenotype. The JAK (Janus
tyrosine kinase)-STAT (Signal Transducer and Activator of Transcription) pathway is a
classic example of an evolutionarily conserved signaling cascade that becomes
disrupted in oncogenic cells (Darnell et al., 1994). The JAK family tyrosine kinases and
latent cytoplasmic transcription factor STATs coordinate to transform a wide array of
intracellular and environmental stimuli into targeted gene expression, resulting in distinct
phenotypic alterations (Darnell, 1996).
Signal Transducers and Activators of Transcription
Signal transducers and activators of transcription (STATs) are a family of latent
transcription factors that normally become activated in response to various extracellular
polypeptide ligands, including many cytokines and growth factors, through cytokine
receptors, receptor tyrosine kinases, as well as various non-receptor tyrosine kinases,
such as c-Src. STATs were originally identified as signal transduction molecules
activated during the study of interferon signaling (Shuai et al., 1993). STAT3 was
originally discovered as being activated during signaling by IL-6 (Zhong et al., 1994).
Since then IL-6 signaling through the JAK-STAT pathway has been well characterized
(Aaronson and Horvath, 2002).
Seven mammalian STAT family members have now been identified and
characterized, STAT1, 2, 3, 4, 5a, 5b and 6 (Ihle, 1996). They share similar structural
features and mechanisms of activation. Localized in three chromosomal clusters, the
family of transcription factors may have evolved by gene duplication (Copeland et al.,
4
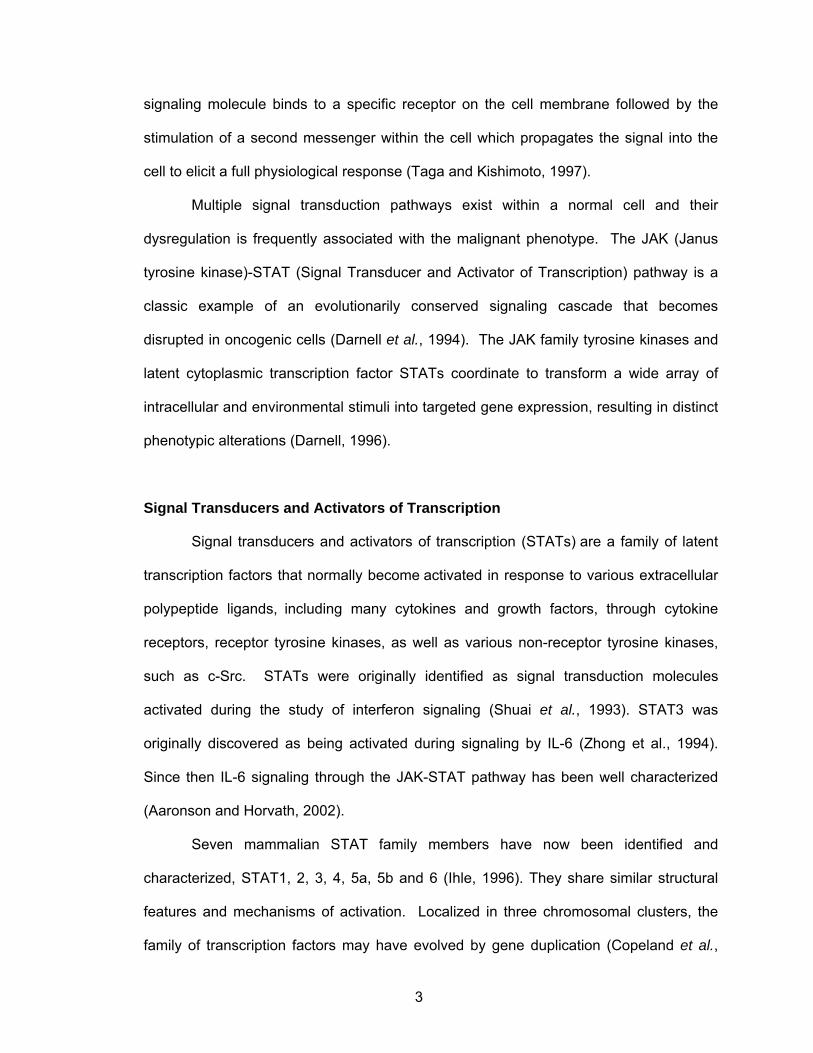
1995). The STAT proteins consist of 750-850 amino acids and have several conserved
domains that are required for STAT function (Figure 1):
The N-terminal 130 amino acid region of STAT proteins is necessary for the
formation of tetramers via STAT dimer-dimer interaction, thus stabilizing DNA-binding at
weak promoter-binding sites. This may occur in promoters with closely spaced tandem
STAT binding sites. There is evidence that STAT1, STAT4, and STAT5 form higher
order complexes (dimer:dimer or higher) on promoters where there are two or more
neighboring STAT binding sites (John et al., 1999; Vinkemeier et al., 1996; Xu et al.,
1996). Cooperation between the dimers exists to allow the interaction, and is lost if the
N-terminal domain of the STATs is deleted (Vinkemeier et al., 1996; Xu et al., 1996;
Zhang et al., 1999b).
The adjacent coiled-coil domain, between the N-terminal and DNA-binding
domains, contains four long helices and allows interaction with other transcription factors
and regulatory proteins, such as the interaction between STAT1 N-terminal and the
histone acetyltransferase CBP/P300 (Zhang et al., 1996). STAT3-mediated gene
transcription is also enhanced by the binding of the transcription factor c-Jun to the
coiled-coil region of STAT3. This region may also be involved in STAT3 recruitment to
the receptor leading to tyrosine phosphorylation and downstream signaling, since
mutation of Asp170 or, to a lesser extent, Lys177 in the alpha-helix 1 results in
diminished binding of STAT3 to the receptor and also reduced STAT3 tyrosine
phosphorylation (Zhang et al., 2000a).
The DNA-binding domain is in the center of the STAT molecules and determines
the specificity of binding of the different family members. All STATs bind to similar DNA
sequences (TTN5AA), most likely due to the highly conserved amino acid sequences of
the DNA binding domains. Analysis of STAT binding to synthetic oligonucleotides
revealed differences in the binding affinity between STAT proteins (Horvath et al., 1995),
5
demonstrating that the space between the palindromic TT-AA core affects the selective
binding of the STATs to their respective DNA elements. For example, a 4 bp core
separating TT-AA results in selective binding of STAT3 dimers, whereas a 6 bp core
leads to preferential binding of STAT6. Those sequences with a 5 bp core can bind
several STAT members, although may demonstrate a preference towards one particular
STAT protein. In addition, the specificity of DNA binding may also be affected by the
composition of the STAT dimers, for examples STAT1-STAT3 heterodimers can bind
different DNA elements to STAT 1 or STAT3 homodimers, leading to a further level of
control and complexity (Horvath et al., 1995).
The Src-Homology 2 (SH2) domain in the C-terminus functions to recruit STATs
to tyrosine phosphorylated receptors and is also required for homo- and hetero-
dimerization. Upon ligand stimulation, JAK-mediated phosphorylation of receptor
tyrosine docking sites enables recruitment of STATs to the receptor and resultant STAT
phosphorylation. This critical phosphotyrosine residue is located around amino acid 700
(Tyr 701 for STAT1 and Tyr705 for STAT3) adjacent to the SH2 domain and is required
for STAT activation via reciprocal SH2-phosphotyrosine interactions between STAT
monomers. The negatively charged phosphate of the tyrosine residue at the C-terminal
end of the SH2 domain is stabilized by the positively charged arginine residue at the N-
terminal of the partner STAT SH2 domain. These residues are critical for dimer
formation, since mutation of either the tyrosine or arginine residues abolishes STAT
dimerization (Yuan et al., 2005).
At the C-terminus of the molecule is the transcriptional activation domain (TAD),
required for transcriptional activation of target genes. STAT1, STAT3 and STAT4 share
a conserved amino acid sequence in the C-terminus (LPMSP), in which the leucine and
serine residues are required to achieve maximum transcriptional activity (Kovarik et al.,
2001; Sun et al., 2006). Following cytokine or growth factor stimulation, the serine
6
residue becomes phosphorylated, which is a critical event for high levels of transcription
(Zhang et al., 1995). Interestingly, STAT1β and STAT3β, which both lack C-terminal
regions, demonstrate reduced transcriptional activity (Dewilde et al., 2008). Interaction
of CBP/P300 with both STAT1 and STAT3 C-terminal regions has previously been
described (Zhang et al., 1996).
The linker region, between the DNA-binding and SH2 domains may be important
for regulating transcriptional activity, since mutations in the linker region of STAT1 form a
protein which can be tyrosine phosphorylated, dimerize, translocate to the nucleus and
bind to DNA but fails to completely activate gene transcription (Yang et al., 2002).
Figure 1. General structure of the STAT protein family. The STAT proteins contain functional
protein domains.
Alternatively spliced isoforms have been described, apart from STAT2. STATs
1,3, (Darnell, 1997; Ihle and Kerr, 1995; Maritano et al., 2004), 4 (Hoey et al., 2003) and
5 (Wang et al., 1996) are expressed as two isoforms, designated as α and β, which have
different transcriptional activities.
Two forms of STAT3 exist: full length, wild-type STAT3 alpha (p92) and a
truncated version STAT3 beta (p83) (de Koning et al., 2000), both derived from the
same gene by alternative mRNA splicing. Sequences in the 3’ untranslated region of the
STAT3 gene were previously identified as important modulators of RNA splicing and
determine the balance between α and β isoforms. STAT3β lacks the 55 residue C-
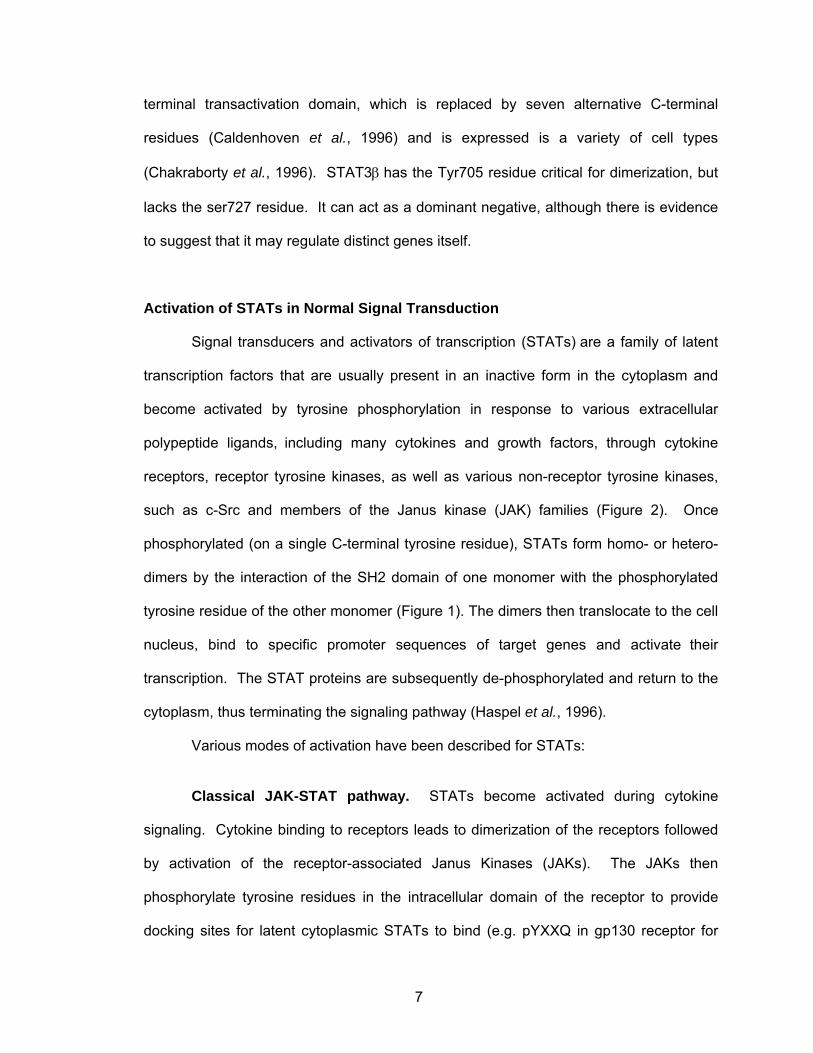
7
terminal transactivation domain, which is replaced by seven alternative C-terminal
residues (Caldenhoven et al., 1996) and is expressed is a variety of cell types
(Chakraborty et al., 1996). STAT3β has the Tyr705 residue critical for dimerization, but
lacks the ser727 residue. It can act as a dominant negative, although there is evidence
to suggest that it may regulate distinct genes itself.
Activation of STATs in Normal Signal Transduction
Signal transducers and activators of transcription (STATs) are a family of latent
transcription factors that are usually present in an inactive form in the cytoplasm and
become activated by tyrosine phosphorylation in response to various extracellular
polypeptide ligands, including many cytokines and growth factors, through cytokine
receptors, receptor tyrosine kinases, as well as various non-receptor tyrosine kinases,
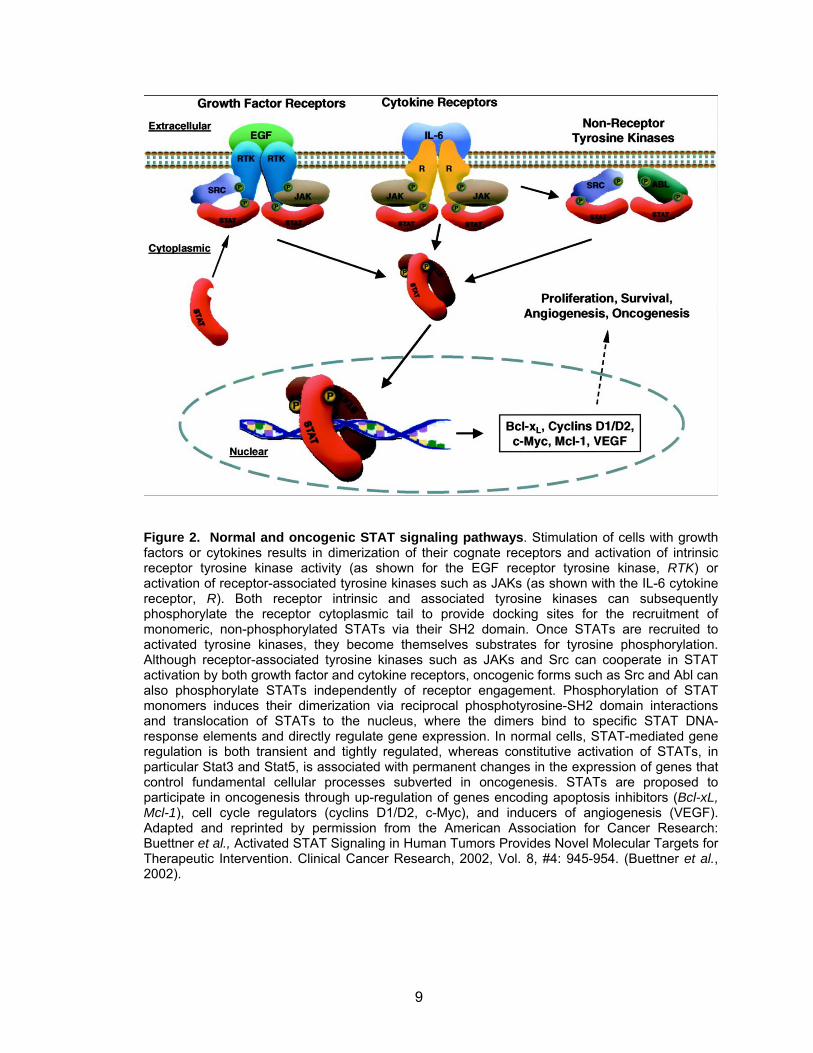
such as c-Src and members of the Janus kinase (JAK) families (Figure 2). Once
phosphorylated (on a single C-terminal tyrosine residue), STATs form homo- or hetero-
dimers by the interaction of the SH2 domain of one monomer with the phosphorylated
tyrosine residue of the other monomer (Figure 1). The dimers then translocate to the cell
nucleus, bind to specific promoter sequences of target genes and activate their
transcription. The STAT proteins are subsequently de-phosphorylated and return to the
cytoplasm, thus terminating the signaling pathway (Haspel et al., 1996).
Various modes of activation have been described for STATs:
Classical JAK-STAT pathway. STATs become activated during cytokine
signaling. Cytokine binding to receptors leads to dimerization of the receptors followed
by activation of the receptor-associated Janus Kinases (JAKs). The JAKs then
phosphorylate tyrosine residues in the intracellular domain of the receptor to provide
docking sites for latent cytoplasmic STATs to bind (e.g. pYXXQ in gp130 receptor for
8
STAT3 binding). STATs then bind the receptor via their SH2 domain allowing JAKs to
phosphorylate the STATs on a specific tyrosine residue in their cytoplasmic tail.
Reciprocal binding of this pTyr in one monomer to the SH2 domain of a partner
monomer allows homo- or hetero-dimerization of the proteins. Once released from the
receptor, the dimers translocate to the cell nucleus and bind to specific DNA sequences
to activate the transcription of cytokine-responsive genes (Akira, 1997).
Growth factor receptors. STATs are also activated directly by receptors with
intrinsic tyrosine kinase activity or indirectly via JAKs. Such receptors include the EGF,
PDGF and FGF receptors (Garcia et al., 1997; Ruff-Jamison et al., 1994; Sahni et al.,
1999)
Non-receptor tyrosine kinases. Non-receptor tyrosine kinases, such as v-Src,
v-abl, v-Sis, v-Fps (Silva, 2004; Turkson et al., 1998) and polyoma virus middle T
antigen can induce constitutive STAT activation (Garcia et al., 1997).
G-protein coupled receptors (GPCR). GPCRs, including chemokine receptors,
can activate STAT1 and STAT3 upon chemokine binding e.g. MCP-1 and RANTES
receptors (Buettner et al., 2007; Ram and Iyengar, 2001).
Adaptor proteins. Activation of STATs can be mediated by other adaptor
proteins which serve to bring JAKs in close proximity to STATs.
9
Figure 2. Normal and oncogenic STAT signaling pathways. Stimulation of cells with growth factors or cytokines results in dimerization of their cognate receptors and activation of intrinsic receptor tyrosine kinase activity (as shown for the EGF receptor tyrosine kinase, RTK) or activation of receptor-associated tyrosine kinases such as JAKs (as shown with the IL-6 cytokine receptor, R). Both receptor intrinsic and associated tyrosine kinases can subsequently phosphorylate the receptor cytoplasmic tail to provide docking sites for the recruitment of monomeric, non-phosphorylated STATs via their SH2 domain. Once STATs are recruited to activated tyrosine kinases, they become themselves substrates for tyrosine phosphorylation. Although receptor-associated tyrosine kinases such as JAKs and Src can cooperate in STAT activation by both growth factor and cytokine receptors, oncogenic forms such as Src and Abl can also phosphorylate STATs independently of receptor engagement. Phosphorylation of STAT monomers induces their dimerization via reciprocal phosphotyrosine-SH2 domain interactions and translocation of STATs to the nucleus, where the dimers bind to specific STAT DNA-response elements and directly regulate gene expression. In normal cells, STAT-mediated gene regulation is both transient and tightly regulated, whereas constitutive activation of STATs, in particular Stat3 and Stat5, is associated with permanent changes in the expression of genes that control fundamental cellular processes subverted in oncogenesis. STATs are proposed to participate in oncogenesis through up-regulation of genes encoding apoptosis inhibitors (Bcl-xL, Mcl-1), cell cycle regulators (cyclins D1/D2, c-Myc), and inducers of angiogenesis (VEGF). Adapted and reprinted by permission from the American Association for Cancer Research: Buettner et al., Activated STAT Signaling in Human Tumors Provides Novel Molecular Targets for Therapeutic Intervention. Clinical Cancer Research, 2002, Vol. 8, #4: 945-954. (Buettner et al., 2002).
10
Serine phosphorylation of STATs
As previously mentioned, STATs are phosphorylated prior to dimerization and
activation, and this is required for DNA-binding activity. Additional modifications to the
STAT proteins, such as phosphorylation of serine residues are required to reach
maximum transcriptional activity. Phosphorylation of a serine residue in the C-terminal
transcriptional activation domain, corresponding to Ser-727 in both STAT1 and STAT3,
enhances the transcriptional activity of these STATs (Wen and Darnell, 1997; Wen et al.,
1995). The mechanism of transcriptional enhancement may not be completely
understood, but may include interactions between STATs and co-activator proteins
(Decker and Kovarik, 1999) which enhance gene transactivation.
There is evidence that serine phosphorylation can occur via members of the
mitogen-activated protein kinases (MAPK) family (Schaeffer and Weber, 1999) including
extracellular signal-regulated kinases (ERKs) (Chung et al., 1997b; David et al., 1995;
Kuroki and O'Flaherty, 1999; Ng and Cantrell, 1997), c-Jun N-terminal kinase (JNK) (Lim
and Cao, 1999; Turkson et al., 1999) and p38mapk (p38) (Gollob et al., 1999; Turkson et
al., 1999). Protein kinase C (PKC) may also play a role (Jain et al., 1999).
The serine phosphorylation site in both STAT1 and STAT3, (-Pro-Met-Ser-Pro-),
conforms to the MAPK consensus sequence, -Pro-X-Ser/(Thr)-Pro- (Schaeffer and
Weber, 1999). Cell-type specific expression of the individual serine kinases along with
their interactions with individual STAT members most likely affects serine
phosphorylation status and is complex
In contrast, repression of STAT signaling by serine phosphorylation has also
been noted, suggesting that the kinases play a dual role, both enhancing and repressing
STAT activity under certain conditions. This may be due to serine phosphorylation
inhibiting STAT tyrosine residue phosphorylation (Chung et al., 1997b); negative
feedback effect of the serine kinase on upstream tyrosine kinases (Sengupta et al.,
11
1998) or even an indirect effect from STAT proteins preferentially interacting with serine
kinases versus tyrosine kinases (Jain et al., 1998; Jain et al., 1999; Lim and Cao, 1999).
However, such repression can occur when the serine kinases are in a ‘superactive’ state
(Jain et al., 1998), as found with ERK: moderate levels of ERKs enhance, yet
overexpression of ERKs inhibit, STAT3 transcriptional activity (Turkson et al., 1999).
Nuclear Import and Export of STAT Proteins
STATs do not exhibit a classical nuclear localization sequence (NLS), despite the
fact that the interferon-induced nuclear importation of STATs is mediated via the
importin/Ran system (McBride et al., 2002). A structural region in the DNA-binding
domain of STAT1 and STAT2, rich in arginine and lysine residues, is required for nuclear
import (Melen et al., 2001). These conserved regions are required to be present in both
STAT monomers for nuclear import to occur, since dimers with one wild-type STAT and
one STAT mutated in the arginine/lysine region fail to translocate to the nucleus upon
stimulation, thus such a dimer acts as a dominant negative. Previous work also
suggests that the adapter protein importin-α3 binds to STAT3 and is required for nuclear
import (Liu et al., 2005), however, the importin-α/importin-β1/Ran mechanism has also
been shown to traffic STAT3 to the nucleus (Cimica et al., 2011)
STAT1 also has a nuclear export signal (NES), located adjacent to the NLS
amino acids 400-409) (Mowen and David, 2000). STAT1 nuclear export is regulated by
the CRM1 export protein and is Leptomycin B (LMB)-sensitive. STAT3 is also exported
from the nucleus in an LMB-sensitive process, allowing STAT3 to accumulate in the
nucleus (Bhattacharya and Schindler, 2003). This accumulation is independent of
tyrosine phosphorylation, suggesting that a “basal” STAT3 signaling pathway exists.
STAT3 contains three NES elements, two of which, STAT3 (306-318) and STAT3 (404-
12
414), correspond to those previously identified in STAT1, as well as a third NES,
STAT3(524-535). STAT3 (306-318) appears to be important in the rapid nuclear export
of STAT3 seen following stimulation, whereas the STAT3 (404-414) and STAT3 (524-
535) have an important role in regulating basal nuclear export. Unphosphorylated, latent
STAT3 shuttles constitutively between cytoplasm and nucleus. Mutation of a putative
NLS or NES sequence did not impair nucleocytoplasmic shuttling of latent STAT3
(Bhattacharya and Schindler, 2003).
The N-terminal domain (amino acids 1-125) was found to be essential for
formation of unphosphorylated STAT3 dimers, but not for assembly of tyrosine-
phosphorylated STAT3 dimers. In resting cells, the monomeric N-terminal deletion
mutant (STAT3-∆NT) shuttles faster between the cytoplasm and nucleus than the wild-
type STAT3, indicating that dimer formation is not required for nucleocytoplasmic
shuttling of latent STAT3 (Vogt et al., 2011).
Negative Regulation of STAT Signal Transduction
Since the JAK/STAT pathway plays such a critical role in cell signaling, there are
multiple fine-tuning mechanisms that control STAT activation both spatially and
temporally. Under normal circumstances STAT activation is transient and is controlled
by several pos-translational mechanisms, not at the level of gene transcription, including
(i) negative feedback proteins (ii) expression of nuclear inhibitors of STAT signaling (iii)
activation of tyrosine and/or serine phosphatases (iv) receptor internalization and (v)
protein degradation (Greenhalgh and Hilton, 2001; Kile et al., 2001; Wormald and Hilton,
2004).
13
Suppressors of Cytokine Signaling (SOCS). Suppressors of cytokine
signaling comprise a family of inhibitors which also act on the JAK-STAT pathway as
negative feedback regulators (Masuhara et al., 1997). Also known as JAK-binding
proteins (JAB) or STAT-induced STAT inhibitors (SSIs), SOCS are induced by cytokine
stimulation and inhibit phosphorylation of receptors by interaction with the kinase domain
of JAKs. For example, IL-6 is capable of inducing transcription of SOCS3, which inhibits
phosphorylation of gp130 by interaction with the kinase domain of JAK 2. (Endo et al.,
1997). The SOCS family consists of seven members, SOCS 1-7, of which SOCS-1 and
SOCS-3 are the most studied. Structurally, the SOCS proteins share several similarities
including a central SH2 domain, a highly homologous C-terminal region (SOCS-box),
and an N-terminal region of varied length and a highly variable amino acid sequence.
SOCS-1 inhibits signaling by a wide range of cytokines including IL-6, IL-4, LIF,
GH, TPO, prolactin, interferons (especially IFN-g) and stem cell factor (kit ligand).
SOCS-1 binds directly to the kinase domain (JH1) of JAKs to inhibit kinase activity, as
well as JAK-mediated phosphorylation of downstream substrates, such as the receptor
and STATs (Endo et al., 1997). Both the SH2 domain and the N-terminal region of
SOCS-1 are required for inhibitory activity, while the SOCS box appeared to be
dispensable [104]. However, the SOCS box is conserved in all SOCS proteins,
suggesting an important physiological role, possibly involving SOCS proteolytic
degradation (Kamura et al., 1998; Zhang et al., 1999a).
SOCS-3 inhibits many of the same cytokine/receptor systems as SOCS-
1, but also downregulates IL-2, IL-3 and leptin signal transduction (Bjorbaek et al., 1999;
Cohney et al., 1999). At high concentrations SOCS-3 interacts with JAKs, however, it
has a much lower affinity for binding JAKs compared to SOCS-1 (Nicola and
Greenhalgh, 2000). Instead, SOCS-3 appears to inhibit cytokine signaling by
associating with the gp130 receptor directly (Nicholson et al., 2000).
14
The N-terminal domains of SOCS-1 and SOCS-3 are interchangeable without
loss of function, suggesting that both proteins may inhibit JAK kinase activity via this
domain, and that the SH2 domain either binds JAKs (SOCS-1) or the gp130- receptor
(SOCS-3) (Nicola and Greenhalgh, 2000).
Protein Inhibitors of Activated STAT (PIAS). Protein inhibitors of activated
STAT3 (PIAS) have been shown to associate with STATs and prevent binding of the
activated nuclear STATs to DNA (Chung et al., 1997a). PIAS1 was cloned using a yeast
two-hybrid assay and shown to specifically inhibit STAT1 binding to DNA. (Liu et al.,
1998). PIAS3 was then identified in a mouse thymus library screened with a human
EST clone related to PIAS1. Both proteins bind in vivo to the N-terminal region of their
target activated STAT dimers and block binding of the transcription factors to their target
gene promoters, thus preventing STAT-mediated gene transcription. However, the PIAS
proteins do not cross-inhibit other STAT proteins e.g. PIAS3 is a specific inhibitor of
STAT3 only and will not inhibit STAT1 activity.
PIAS proteins are constitutively expressed in a variety of tissues (Greenhalgh
and Hilton, 2001; Kile et al., 2001; Wormald and Hilton, 2004). They have conserved
putative zinc-binding motifs [C2-(X)21-C2 (Chung et al., 1997a). PIAS3 was shown to
bind to STAT3 via the conserved proline, isoleucine, asparagine, isoleucine, threonine
(PINIT) domain of PIAS3 (Mautsa et al.), however they may also bind to other proteins,
especially transcription factors. The PIAS proteins function as SUMO (small ubiquitin-
like modifier)-E3 ligases which catalyzes the covalent attachment of a SUMO protein to
their specific target substrates (Rytinki et al., 2009).
Dephosphorylation of STAT3. Tyrosine phosphorylation of proteins is a rapid
and reversible mechanism that is often used in cell signaling to indicate activation of the
15
target protein. STATs are one class of proteins activated by phosphorylation as
previously discussed. Therefore, one of the most obvious mechanisms of STAT
regulation is via phosphatases. For example, SHP-1 has been shown to suppress
cytokine signaling systems and is composed of two SH2 domains following by the
phosphatase domain. SHP-1 is thought to function by direct binding to cytokine
receptors and dephosphorylating signaling components (Ram and Waxman, 1997).
Receptor Internalization. Cytokine signaling begins with activation of plasma
membrane receptors, however, these receptors do not remain permanently at the
membrane. The receptors are removed from the cell membrane via endocytosis, which
has been studied in depth for the gp130 receptor. IL-6 has been shown to downregulate
its own receptor. Following binding of IL-6, the gp130 receptor is quickly internalized
within 60 minutes, leading to a complete depletion of IL-6 surface binding receptors
(Zohlnhofer et al., 1992) Since de novo synthesis of the gp130 receptor is required to re-
populate the membrane, this suggests that following internalization, gp130 is degraded.
Proteolysis. Protein degradation plays a very limited role in controlling STAT
signaling. Proteosome inhibitors had little effect on the turnover rate of STAT1 and
STAT3 (Heinrich et al., 1998) and half-life studies have shown that STAT3 has a long
half-life >8 h, which is not reduced by stimulation with IL-6. However, limited proteolytic
processing of STATs by serine proteases (Azam et al., 1997) or the cysteine protease
calpain (Hendry and John, 2004; Oda et al., 2002) generates C-terminally truncated
STAT proteins that are able to negatively regulate STAT3-, STAT5- and STAT6-
mediated signaling. Designated as STATγ, these molecules function as dominant
negative regulators of transcription.
16
STAT3 is also cleaved by caspases at multiple sites (Darnowski et al., 2006)
forming cleavage fragments. Such cleavage reduces STAT3-DNA binding, STAT3-
driven luciferase reporter activity and represses expression of STAT3-dependent genes
(Darnowski et al., 2006). Caspase cleavage of STAT3 was also demonstrated to
increase sensitivity to apoptotic stimuli. Thus, proteolytic cleavage of STAT3 reduces its
expression and leads to the production of cleavage fragments which can modulate
STAT3 transcriptional activity.
Biological Functions of STAT Proteins
The STAT family protein structure is highly conserved, yet there are distinct
differences both in primary sequence and in function. STATs are ubiquitously expressed,
apart from STAT4, whose expression is restricted to including spleen, heart, brain,
peripheral blood cells, and testis (Yamamoto et al., 1997).
The control of normal physiological processes by STAT family members has
been based on studies using homozygous deletion or tissue-specific, conditional mouse
knockouts of each STAT family member (Akira, 1999). The different family members
have been shown to be involved in mediating a variety of biological functions in diverse
cell types.
STAT1-deficient mice have an impaired ability to respond to interferons and
become susceptible to infections from bacterial and viral pathogens (Durbin et al., 1996;
Meraz et al., 1996), indicating that STAT1 is required for interferon signaling as well as
innate immunity.
Homozygous deletion of the gene encoding either STAT2 (Kimura et al., 1996) or
STAT3 (Takeda et al., 1997), proteins is embryonic lethal, establishing a critical role for
both STATs in normal development. STAT3-null animals exhibit mortality at day 6.5 to 7
during early development, therefore tissue-specific, Cre-Lox systems are more
17
commonly used to generate STAT3-null conditions. Mice lacking STAT3 expression in
keratinocytes suggest a role for STAT3 signaling in control of cell motogenesis, as it
pertains to wound healing (Sano et al., 1999). Furthermore, in contrast to wild-type
littermates, IL-6 fails to prevent apoptosis in T lymphocytes from mice deficient for
STAT3 signaling, demonstrating that STAT3 is required in hematopoietic cells for IL-6
signaling as well as anti-apoptosis (Catlett-Falcone et al., 1999)Takeda et al., 1998).
Targeted disruption of the STAT4 (Kaplan et al., 1996; Thierfelder et al., 1996) or
STAT6 (Shimoda et al., 1996; Takeda et al., 1996; Thierfelder et al., 1996) genes in
mice demonstrates that these STATs are required for IL-12- or IL-4-induced proliferation
of activated T lymphocytes, respectively.
STAT5 has also been shown to be important in lactation and hematopoiesis
(Akira, 1999; Frank, 1999). The STAT5A and STAT5B genes are highly related both at
the genetic and protein levels, however, targeted disruption of either gene exhibits a
tissue-specific phenotype that is also gene-specific. For example, STAT5A knockout
mice exhibit defects in mammary gland development and lactation during pregnancy (Liu
et al., 1997), while STAT5B knockout mice display sexually dimorphic patterns of liver
gene expression (Udy et al., 1997). Additionally, female mice lacking both STAT5A and
STAT5B proteins are infertile and double-knockout mice indicate a role for STAT5
proteins in proper immune function (Teglund et al., 1998).
These studies indicate that STAT proteins are required for regulation of a diverse
array of cellular functions, which are also affected by the spatial and temporal
expression of the respective STAT proteins.
Activation of STATs in Oncogenesis
In oncogenesis, the signal transduction pathways involving STATs are often
disrupted and since STATs play a critical role in a remarkable variety of biological
18
processes, it is of note that the dysregulation of STAT signaling pathways is becoming
more frequently associated with oncogenesis. Mounting evidence suggests that
constitutively active STATs play a role in cellular transformation induced by multiple
oncogenes, as well as progression of human tumors.
Constitutive activation of STATs 1, 3 and 5 have been demonstrated in a variety
of human tumors and cell lines (Turkson and Jove, 2000), (Table 1) including solid
tumors and blood tumors. This persistent signaling of specific STATs, in particular
STAT3 and STAT5, has been shown to stimulate cell proliferation and prevent apoptosis
in various tumor cell lines, through upregulating a number of target genes, such as c-
Myc, cyclins and bcl-x. In contrast, inhibition of constitutively activated STAT3 or STAT5
leads to growth suppression or apoptosis (Buettner et al., 2002).
19
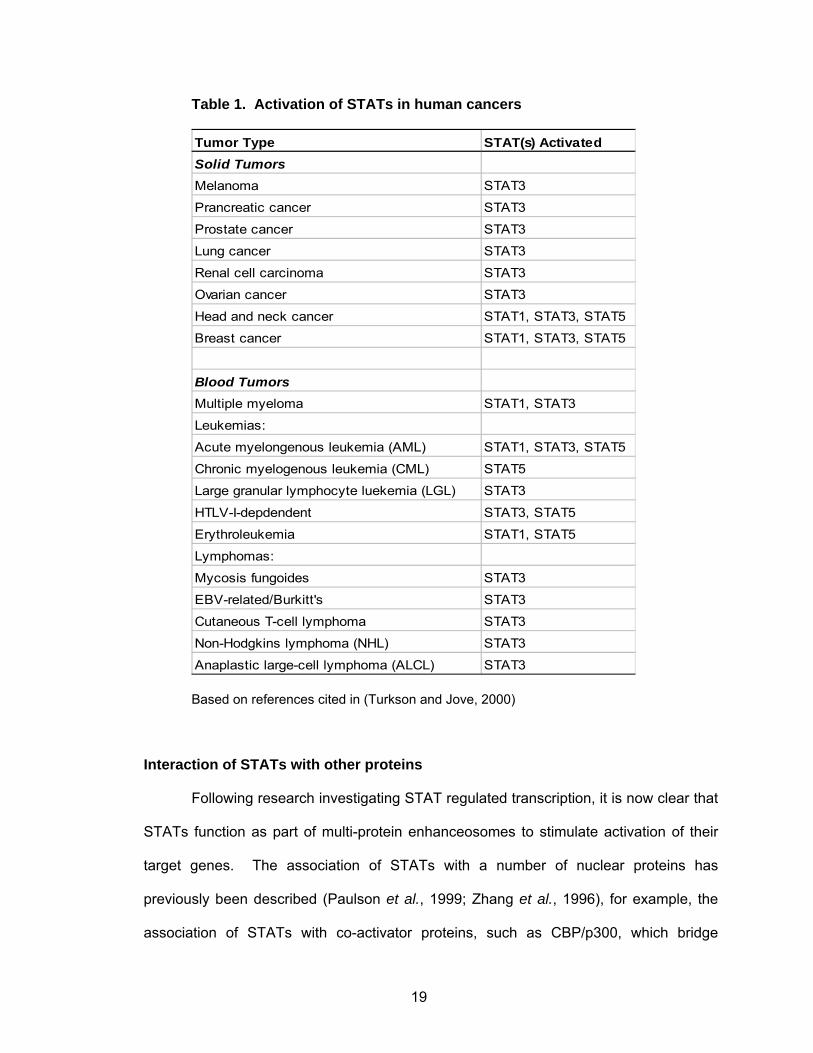
Table 1. Activation of STATs in human cancers
Tumor Type STAT(s) ActivatedSolid TumorsMelanoma STAT3
Prancreatic cancer STAT3
Prostate cancer STAT3
Lung cancer STAT3
Renal cell carcinoma STAT3
Ovarian cancer STAT3
Head and neck cancer STAT1, STAT3, STAT5
Breast cancer STAT1, STAT3, STAT5
Blood TumorsMultiple myeloma STAT1, STAT3
Leukemias:
Acute myelongenous leukemia (AML) STAT1, STAT3, STAT5
Chronic myelogenous leukemia (CML) STAT5
Large granular lymphocyte luekemia (LGL) STAT3
HTLV-I-depdendent STAT3, STAT5
Erythroleukemia STAT1, STAT5
Lymphomas:
Mycosis fungoides STAT3
EBV-related/Burkitt's STAT3
Cutaneous T-cell lymphoma STAT3
Non-Hodgkins lymphoma (NHL) STAT3
Anaplastic large-cell lymphoma (ALCL) STAT3
Based on references cited in (Turkson and Jove, 2000)
Interaction of STATs with other proteins
Following research investigating STAT regulated transcription, it is now clear that
STATs function as part of multi-protein enhanceosomes to stimulate activation of their
target genes. The association of STATs with a number of nuclear proteins has
previously been described (Paulson et al., 1999; Zhang et al., 1996), for example, the
association of STATs with co-activator proteins, such as CBP/p300, which bridge
20
between activated STATs and the basal transcription machinery (Paulson et al., 1999;.
CBP/p300 is an important regulator of chromatin remodeling, since it contains a histone
acetyltransferase (HAT) domain and interacts with a wide range of transcription factors
(Kadonaga, 1998). CBP/p300 has been shown to interact with STAT1, via both N- and
C-terminals of STAT1 (Zhang et al., 1996), as well as STAT5 (Pfitzner et al., 1998)
STATs have also been shown to interact with hormone receptors, mini-
chromosome maintenance proteins and members of the AP-1 and IFN regulatory factor
(IRF) families (Bromberg and Darnell, 2000; Horvath et al., 1995; Zhang et al., 1996)
STAT3-interacting protein (StIP1) has been identified and may serve as a
scaffold protein to facilitate the interaction between JAKs and STAT3 (Collum et al.,
2000).
The interaction of STAT3 in the nucleus with the zinc-finger protein Gfi-1 has also
been reported, leading to enhanced IL-6 induced transcription (Rodel et al., 2000).
Many gene promoters contain binding sites for multiple transcription factors and
STAT3 has been shown to cooperate with multiple transcription factors to regulate
transcription of target genes, including SMAD1, AP-1, Sp-1. In contrast, some
promoters have overlapping binding sites for transcription factors, which cannot be
occupied by both transcription factors at the same time. For example, overlapping
binding sites for STAT3 and NF-ΚB are found on promoters of several acute phase
proteins (APPs). IL-1 and IL-6, two early-response cytokines expressed during an acute
inflammatory response regulate the expression of APPs in the liver. IL-1 stimulates
transcription via NF-ΚB, whereas IL-6 induces its target genes via STAT1 and STAT3.
Since both STAT3 and NF-ΚB are active during the inflammatory response, they could
both potentially bind the overlapping element in the alpha2-macroglobulin promoter and
may regulate each other via competition for the binding site (Zhang and Fuller, 1997).
21
The Role of STAT3 in Cancer
STAT3 activation has been seen at a high frequency in a wide variety of solid
tumors, including those of the breast, head and neck, leukemias, lymphomas,
melanomas, pancreas, prostate, ovary, lung and brain (Bowman et al., 2000; Turkson
and Jove, 2000)
In normal cells, the activation of STAT3 is a highly regulated, transient process
and has a duration of minutes to several hours, at which point the STAT3 homodimers
are inactivated by de-phosphorylation. However, constitutive activation of STAT3 has
been associated with malignant transformation, including transformation by v-Src (Yu et
al., 1995; (Cao et al., 1996), Eyk (Zong et al., 1996) and other oncogenic tyrosine
kinases. Evidence has shown that constitutively active STAT3 is required for v-Src
transformation (Bromberg et al., 1998) and is alone sufficient to induce transformation
and tumor formation in nude mice (Bromberg et al., 1999). Moreover, persistent STAT3
activation is frequently detected in human tumors, both in patient samples and tumor cell
lines. The critical role of constitutively active STAT3 in various human cancers has been
well established for a number of tumor types, including breast (Garcia et al., 2001),
prostate (Mora et al., 2002), and head and neck squamous cell carcinoma (Song and
Grandis, 2000). STAT3 is the family member that most frequently shows unregulated,
persistent activation in human tumors and human cancer cell lines.
STAT3 itself has not been found to be mutated in human tumors, but it is
activated by various upstream oncogenic proteins and is required for their transforming
ability. For example, STAT3 is activated in cells transformed by v-Src (Bromberg et al.,
1998) or v-Abl oncogenes and has been shown to be required for the transforming ability
of v-Src (Danial et al., 1995; Turkson et al., 1998; Yu et al., 1995).
22
STAT3 activation can also be induced by a variety of growth factors and
cytokines which are commonly over-expressed in cancer cells. These include Epidermal
Growth Factor (EGF) (Garcia et al., 1997; Ruff-Jamison et al., 1994), Platelet Derived
Growth Factor (PDGF) (Bowman et al., 2001), as well as the cytokine, IL-6 (Akira, 1997).
As such, STAT3 plays a central role in facilitating many oncogenic signaling pathways.
STAT3 activation has been associated with both chemoresistance and
radioresistance, and mediates these responses via interaction with other transcription
factors, including nuclear factor kappa B, Hypoxia-inducible factor-1 and peroxisome
proliferator activated receptor-gamma (Aggarwal et al., 2009).
STAT3-regulated genes
Following tyrosine phosphorylation and subsequent translocation to the nucleus,
STAT3 binds to promoters containing the consensus sequences TT(N4)AA or TT(N5)AA
(Horvath et al., 1995). To date, STAT3 has been show to regulate a handful of target
genes, including genes which are involved in cell survival, proliferation, inhibition of
apoptosis, angiogenesis, metastasis and immune evasion.
So far genes that have been identified as being directly regulated by STAT3, and
may contribute to oncogenesis, are involved in cell cycle control and proliferation,
inhibition of apoptosis and angiogenesis.
STAT3 Regulation of Cell Growth and Proliferation. Dysregulated cell growth
and proliferation is a hallmark of cancer (Hanahan and Weinberg, 2000) and STAT3
plays a major role in such uncontrolled growth by activating target gene such as Cyclin
D1, p21WAF1/CIP1, as well as the proto-oncogenes c-Myc and c-fos, all of which play a
role in proliferation, particularly in cancer (Kiuchi et al., 1999; Sinibaldi et al., 2000). For
example, Cyclin D1, encoded by the CCND1 gene, is a G1/S specific protein belonging
23
to the cyclin family and capable of forming a complex with CD4 or CD6, whose activity is
required for the cell cycle G1/S transition (Reddy, 1994). Overexpression of this gene is
observed frequently in a variety of human tumors and contributes to oncogenesis
(Motokura and Arnold, 1993).
p21 / WAF1 also known as cyclin-dependent kinase inhibitor 1 or CDK-
interacting protein 1 is a protein that in humans is encoded by the CDKN1A gene located
on chromosome 6 (6p21.2). A potent cyclin-dependent kinase inhibitor, p21 inhibits the
activity of cyclin-CD2 or –CDK4 complexes to regulate cell cycle progression (Reddy,
1994). Transcriptional regulation of p21 was demonstrated in v-Src transformed cells
(Sinibaldi et al., 2000) where coordinate increases in p21, cyclin D1 and cyclin E
resulted in an increase in cyclin/CDK/p21 complexes. Overexpression of p21 and
cyclins D1 and E most likely gives v-Src transformed cells sufficient active cyclin/CDK
complexes to proceed through the cell cycle.
STAT3 Regulation of Cell Survival and Apoptosis. Regulation of cell survival
and apoptosis are also disrupted in cancer cells and STAT3 has previously been shown
to increase expression of the pro-survival proteins Bcl-XL, Bcl-2 (B-cell lymphoma 2)
(Fujio et al., 1997; Grad et al., 2000)and Mcl-1 (Puthier et al., 1999), as well as Survivin
(IAP) (Diaz et al., 2006; Gritsko et al., 2006). Frequently overexpressed in human
tumors, these genes play a critical anti-apoptotic role in a number of cancers, including
in a number of cancers, including melanoma, breast, prostate, and lung carcinomas.
STAT3 Regulation of Angiogenesis and Metastasis. Metastasis is a major
cause of morbidity and mortality in cancer patients. Many of the molecular mechanisms
regulating metastasis have been elucidated and commonly involve various signal
transduction pathways. STAT3 has been identified as a central regulator of tumor
24
metastasis (Devarajan and Huang, 2009) and STAT3 target genes are involved in
multiple steps of metastasis. We have already discussed the role of STAT3 in regulating
genes involved in cell survival and self-renewal, however, STAT3 also controls
transcription of genes involved in invasion, angiogenesis and tumor cell immune
evasion.
Hypoxia is a state of oxygen deprivation and a characteristic of tumors that are
actively growing and occurs as a result of rapid oxygen consumption by the cancer cells,
combined with an insufficient supply of oxygen. Rapidly growing solid tumors outgrow
their blood supply, leaving hypoxic regions where the oxygen concentration is lower than
surrounding, healthy tissue (Vaupel, et al., 2001). As a result, hypoxia triggers specific
pathways associated with homeostasis in order to maintain cellular metabolism and
allow the tumor to continue to grow. The transcription factor HIF1-α is a critical mediator
required for oxygen homeostasis (Semenza et al., 1999) and HIF1-α expression is know
to be elevated under hypoxic conditions (Hockel, 2001). Under normoxia conditions,
HIF1-α activity is regulated by proteasomal degradation (Cockman, 2000; Ohh et al.,
2000), however, under hypoxic conditions, degradation is reduced and stabilized HIF1-α
is targeted to the nucleus and forms a heterodimer with HIF1-β. The complex then binds
specific hypoxia response elements (HRE) in the promoters and enhancers of HIF1
target genes. Among these target genes is vascular endothelial growth factor (VEGF).
STAT3 can also be activated via SRC kinase through a Notch signaling pathway (Lee
MCR 2009) leading to downstream expression of HIF1-alpha.
Degradation and remodeling of the extracellular matrix (ECM) are essential steps
in tumor invasion and metastasis. The role of matrix metalloproteinases (MMPs) in
metastasis is well established (Coussens, 1996; Stetler-Stevenson 2006; Chamber and
Matrisian, 1997; Pollet, 1998; Curran and Murray, 1999). MMPs are key proteolytic
25
enzymes involved in invasion and metastasis, as well as contributing to angiogenesis by
facilitating the migration of endothelial cells through the ECM in response to angiogenic
stimuli (Liotta, 1991; Moses, 1997; Stetler 2001). STAT3 regulates the expression of
MMP-2 and was shown to correlate with their expression, tumor invasiveness and
metastasis (Xiw, 2004).
STAT3 in Inflammation and Immune Evasion. Inflammatory conditions can
increase the risk of cancer (Mantovani et al., 2010) and inflammatory components are
present in the microenvironment of tumors that are not even related epidemiologically to
inflammation. STAT3 has been shown to orchestrate the molecular pathways that link
inflammation and cancer (Kato, 2011).
STAT3 is constitutively expressed in diverse tumor-infiltrating immune cells (Yu
et al., 2007) leading to the inhibition of a pro-inflammatory cytokine response, reduced
cytokine production and also the release of factors that actively down-regulate the
immune response.
However, STAT3 has been shown to repress expression of nitric oxide synthase
(NOS) by direct interaction with NF-KB, to terminate NO production by activated iNOS
following exposure to pro-inflammatory stimuli. NOS enzymes catalyze the reaction
between oxygen and L-arginine substrates to produce L-citrulline and NO, which can
cause unintended injury to host cells during glomerulonephritis and other inflammatory
diseases (Yu et al., 2002).
Identifying Novel STAT3 Target Genes
Cytokine and growth factor signaling pathways involving STAT3 are frequently
constitutively activated in many different human primary tumors, and are best known for
the transcriptional role they play in the controlling cell growth and cell cycle progression.
26
However, the extent of STAT3's reach on transcriptional control of the genome as a
whole remains an important question. We predicted that this persistent STAT3 signaling
affects a wide variety of cellular functions, many of which still remain to be characterized.
STAT3 is a latent cytoplasmic transcription factor, induced by a variety of
upstream signals, including growth factors, cytokines and non-receptor tyrosine kinases.
Upon activation by tyrosine phosphorylation, STAT3 forms dimers, which translocate to
the nucleus and regulate transcription of target genes. Under normal physiological
conditions, STAT3 activity is tightly controlled; however, intracellular signaling pathways
involving STAT3 are frequently constitutively activated in many different human primary
tumors. We and others have shown that constitutive activation of STAT3 provides
cancer cells with growth and survival advantages and enhances tumor angiogenesis and
metastasis. Recent studies have also indicated that STAT3 activation contributes to
tumor immune evasion. These findings indicate that aberrant STAT3 signaling affects a
wide variety of fundamental cellular functions through multiple mechanisms.
To date, up-regulated expression of numerous STAT3 target genes has been
identified, including VEGF (Niu et al., 2002), Bcl-2, Bcl-xL (Zushi et al., 1998), p21,
Cyclin D1 (Sinibaldi et al., 2000) and survivin (Gritsko et al., 2006). These STAT3 target
genes have generally been identified on an individual basis, while few studies have
attempted to identify large numbers of STAT3 regulated genes (Alvarez et al., 2005;
Dauer et al., 2005; Paz et al., 2004; Sekkai et al., 2005; Snyder et al., 2008). Our goal
was to take a broad approach to identify novel STAT3 regulated genes involved in
oncogenesis by examining changes in the genome-wide gene expression profile by
microarray, using cells expressing constitutively-active STAT3.
27
Experimental Activation of STAT3
STAT3 signaling pathways can be induced by many ligands and oncoproteins,
however, these ligands may also induce other STAT family proteins simultaneously e.g.
Epidermal Growth Factor induces both STAT1 and STAT3. In order to identify genes
which are regulated by STAT3 specifically, we chose techniques which preferentially
induced STAT3 only.
Activation of STAT3 by IL-6. IL-6 is a pleiotropic cytokine and mediates
multiple biological functions within the cell including cell survival, growth, growth arrest
and differentiation. Cells stimulated by IL-6 can respond in a variety of different ways as
a result of the activation of various signaling pathways and the induction of specific
target gene expression.
IL-6 signals through the JAK/STAT pathway and also the Ras/MAPK pathway
(Kishimoto, 1994) Kishimoto 1995). STAT3 was originally identified as a signal
transduction molecule that is activated during signaling by IL-6 (Zhong et al., 1994).
Since then IL-6 signaling through the JAK-STAT pathway has been well characterized
(Aaronson and Horvath, 2002).
The JAK/STAT pathway is used by all neuropoietic cytokines, interferons and
other cytokines (Darnell et al., 1994; Lutticken et al., 1994; Stahl and Yancopoulos,
1994). Gp130 is the common subunit for the receptor complexes for the IL-6 cytokine
family (including IL-6, LIF, CNTF, OnM, IL-11 and CT-1) (Hirano et al., 1994). These
cytokines are referred to as ‘IL-6-type cytokines’ since they induce similar and
overlapping physiological responses.
IL-6 signals via a receptor consist of a ligand binding α-chain and a signal
transducing chain, and binding of IL-6 leads to the receptor leads to homodimerization of
gp130 and activation of the receptor-associated Janus Kinases (JAKs). The JAKs then
28
phosphorylate tyrosine residues in the intracellular domain of the receptor to provide
docking sites for latent cytoplasmic STATs to bind (e.g. pYXXQ in gp130 receptor for
STAT3 binding). STATs then bind the receptor via their SH2 domain allowing JAKs to
phosphorylate the STATs on a specific tyrosine residue in their cytoplasmic tail.
Reciprocal binding of this pTyr in one monomer to the SH2 domain of a partner
monomer allows homo- or hetero-dimerization of the proteins. Once released from the
receptor, the dimers translocate to the cell nucleus and bind to specific DNA sequences
to activate the transcription of cytokine-responsive genes.
JAKs are a family of non-receptor tyrosine kinases from the Janus kinase family
(JAK1-3 and Tyk2) with molecular masses of 120-140 kDa. JAK3 is mainly expressed in
hematopoietic cells, whereas JAK1, JAK2 and Tyk2 are widely expressed and
associated with the cytoplasmic domain of gp130. Ligand activation of the receptor
causes receptor homodimerization and reciprocal tyrosine phosphorylation, resulting in
activation of the JAKs. Activated JAKs then phosphorylate the cytoplasmic tail of gp130
on specific tyrosine residues, which then act as docking sites for SH2 domain-containing
proteins, such as the STATs.
IL-6 specifically induces recruitment of STAT1 and STAT3 to these
phosphorylated sites, and the STATs are then phosphorylated by the activated JAKs.
Upon activation, the STATs translocate to the nucleus and directly control target gene
expression. STAT3 is known to upregulate many IL-6 responsive genes, including
immediate early genes (Lord 1991, Nakajima and Wall 1991, Yuan 1994) and also acute
phase response genes (Wegenka 1993).
Activation of STATs following IL-6 stimulation is rapid, usually with a maximum
accumulation of STATs within the nucleus within 30 minutes, followed by rapid
inactivation via dephosphorylation (Haspel et al., 1996). However, in tumor cells IL-6
induction of persistent STAT3 activity is achieved as a result of a positive feedback loop
29
wherein STAT3 causes transcription of the gene S1PR1 (sphingosine-1-phosphate
receptor-1). S1PR1 is upregulated in STAT3-positive tumors and acts as a G-coupled
receptor for the lysophospholipid sphingosine-1-phosphate (S1P). In turn, the S1pr1
protein enhances STAT3 activity and IL-6 expression, thus completing the loop (Lee et
al.)
Activation of STAT3 by v-Src. STAT3 activity is also known to be induced by
cellular transformation by the activated product of the v-src oncogene, v-Src (Yu et al.,
1995). The cellular and viral versions of the gene were shown to differ in the carboxy
terminal region with v-Src having amino acid substitutions and deletions. The absence
of the regulatory Tyr530 residue causes v-Src to be a constitutively active kinase.
Turkson et al (Turkson et al., 1998) demonstrated that v-Src activates STAT3 in
transformed mouse fibroblasts and that this activation is required for cell transformation,
resulting in STAT3-specific gene regulation. NIH3T3 and Balb/c-3T3 cells stably
transfected with a plasmid containing Moloney murine leukemia virus long terminal
repeats and the v-Src gene (pMvSrc) were kindly provided by Dr. D. Shalloway (Cornell
University, New York, USA). pMvSrc was constructed by ligating the Schmidt Ruppin A
v-Src fragment from plasmid pN4 into the BglII site of the pEVX plasmid. The fragment
contains 276 base pairs of pBR322 DNA followed by 2.8 kb of Rous Sarcoma virus
(SRV) (Johnson et al., 1985).
Activation of STAT3 by expression of STAT3-C. STAT3 activity is tightly
regulated under normal conditions and requires upstream stimulation for STAT3
phosphorylation and activation. In order to express STAT3 in a constitutively active
manner within cells, we used the mutant STAT3-C construct. STAT3-C is an artificially-
engineered, constitutively dimerized STAT3 molecule (Bromberg et al., 1999). The
30
STAT3-C expression vector encodes a constitutively active mutant form of the STAT3
protein that was created using site-directed mutagenesis to substitute two cysteine
residues in the C-terminal loop of the SH2 domain of STAT3. The encoded monomers
dimerize spontaneously, independent of tyrosine phosphorylation, forming a permanent
homodimer that is capable of binding to DNA and activating transcription. STAT3-C is
able to cause cellular transformation of immortalized fibroblasts and the formation of
tumors in nude mice (Bromberg et al., 1999). Balb/c-3T3 cells stably transfected with
pRc/CMV-STAT3C-Flag and selected with G418 for stable expression of STAT3-C were
provided by Dr. H. Yu (Cancer Immunotherapeutics Program, City of Hope
Comprehensive Cancer Center, Duarte, California, USA). The STAT3-C transfectants
stably express the STAT3-C protein, which is capable of binding DNA and stimulating
target gene expression.
Identifying Changes in Gene Expression
High-density oligonucleotide expression array technology is a widely used
method to analyze global gene expression levels within cells. The Affymetrix
GeneChip® system is one of the most reliable and commonly used oligonucleotide
microarray systems. The system uses oligonucleotides of 35 base pairs that are used to
probe genes. Typically each gene us represented by 16-20 pairs of oligonucleotides,
referred to as a probe set. Each pair consists of a perfect match (PM) probe and a
mismatch probe (MM). The mismatch probe is created by changing the center (13th)
base, to create a probe which has non-specific binding. The PM and MM are referred to
as a probe pair.
To identify potential novel STAT3-regulated genes, we examined global gene
expression patterns in cell lines harboring persistently active STAT3. Gene expression
profiles in such cells are likely to be representative of the genetic profile of a cancer cell
31
with aberrant STAT3 expression, as compared to inducing STAT3 activity transiently
using exogenous stimulation, such as IL-6 or transient transfection (Paz et al., 2004).
Previous studies have used microarrays to identify STAT3 target genes under
certain conditions, such as those which regulate inflammation and wound healing (Dauer
et al., 2005), differentiation (Snyder et al., 2008), transformation (Paz et al., 2004),
embryonic stem cells (Sekkai et al., 2005) and STAT3 target genes in human tumors
(Alvarez et al., 2005). In this study we aimed to expand on these prior examinations of
STAT3-regulated gene expression to examine global STAT3 target genes, regardless of
cell type or other influencing conditions.
Pathway Analysis of Genes
Microarrays assess simultaneous changes in transcript levels on an individual
basis, resulting in a long list of genes which have significantly changed transcript levels
when compared to control cells. However, these changes in gene expression do not
occur as independent events within the cell, but are controlled in a coordinated manner
and are often interconnected. Pathway Analysis is an unbiased method to determine
whether differentially expressed genes, and the proteins they encode, are enriched in
particular pathways, giving insight into the biological meaning of the changes observed.
Functional Analysis of Genes
The transcriptional profile of a cell expressing constitutively-active STAT3 is
predicted to be very different compared to a cell where STAT3 is under tight regulation.
Our initial hypothesis was that constitutive activation of STAT3 within cells leads to
permanent changes in global gene expression patterns. We predict that STAT3
promotes widespread changes in gene expression, including both direct and indirect
targets, involving multiple signaling pathways and involving a broad range of genes.
32
Analysis of the biological meaning behind the large lists of genes generated by
microarrays can be very difficult. To determine the functional classification of the
differentially expressed genes identified, the “Functional Annotation” tool in the Database
for Annotation, Visualization and Integrated Discovery (DAVID) Bioinformatics Database
(http://david.abcc.ncifcrf.gov/) (Dennis et al., 2003; Huang da et al., 2009) is very useful.
The DAVID Knowledgebase integrates information from multiple databases for a
particular gene and allows the identification of enriched biological themes, especially
Gene Ontology (GO) terms, as well as the discovery of enriched functionally-related
gene groups, leading to meaningful biological interpretations of changes in the gene
expression profile of a cell.
Necdin – A Negative Growth Regulator
Through computational analysis of our microarray data, we identified Necdin, a
negative growth regulator, as a novel potential STAT3 target gene. Necdin is a potent
growth suppressor that is predominantly expressed in post-mitotic neurons (Aizawa et
al., 1992; Hayashi et al., 1995; Maruyama et al., 1991; Uetsuki et al., 1996). Necdin
expression has been shown to be down-regulated both carcinoma cell lines and primary
tumors (Chapman and Knowles, 2009), suggesting that repression of Necdin expression
may have a role in oncogenesis.
We verified that Necdin mRNA expression inversely correlates with STAT3 activity in
cells expressing constitutively-active STAT3 and that STAT3 directly regulates the
expression of Necdin at the promoter level. In addition, Necdin expression in human
tumor cell lines is inversely correlated with activation of endogenous STAT3. Our
findings provide further evidence for a role of Necdin as a physiological target of STAT3,
demonstrating that computational analysis of microarray data can be used to identify
potential STAT3 target genes for further investigation.
33
Necdin Protein family
Necdin was originally identified in 1991 by the Yoshikawa lab in Japan
(Maruyama et al., 1991) as a novel DNA sequence isolated from a subtraction cDNA
library of murine P19 embryonal carcinoma cells treated with retinoic acid to induce
neural differentiation of the stem cells. As a result, the name, Necdin, stands for
“neurally differentiated embryonal carcinoma cell-derived factor)”.
Necdin is a member of the melanoma-associated antigen (MAGE) superfamily of
proteins. The MAGE proteins are expressed in melanoma cells and act as antigens
which are recognized by cytolytic T lymphocytes. They have been shown to have roles
in a number of cellular processes, including cell cycle regulation and cell death (Barker
and Salehi, 2002). Three groups of related MAGE genes have been identified in
clusters on the X chromosome (MAGE-A genes are located at Xq28; MAGE-B genes at
Xq21 and MAGE-C genes at Xp26-27) (reviewed by (Chomez et al., 2001). In humans,
10 genes have been identified which lie outside of the MAGE-A, B or C clusters, which
includes the Necdin gene NDN.
The MAGE family is divided into two groups of phylogenetically distinct branches
(Barker and Salehi, 2002). Type I proteins include MAGE-A, B and C group proteins
and Type II proteins which include the MAGE genes identified outside these clusters and
include the gene Necdin (NDN).
Necdin Protein structure
The Necdin genes encodes a novel protein sequence of 325 amino acids in mice
and 321 amino acids in humans, with an overall homology of 82% between species.
The proteins are highly conserved (91%) in the central-to-carboxyl terminal region
(amino acids 101-325) but less conserved (62%) in the amino-terminal region (residues
34
1-100) (Nakada et al., 1998). It is of interest to note that Necdin contains regions of
extremely acidic and basic residues. Residues 7-65 are proline-rich and highly acidic,
whereas amino acids 117-160 are highly basic.
The MAGE family of proteins is characterized by a large central region termed
the MAGE homology domain (MHD). Necdin has a MAGE Homology Domain (MHD)
located at amino acids 160-170. This region may be involved in protein-protein
interactions. MAGEL2, a MAGE-related sequence, encodes a protein that is
homologous to Necdin and has been found to map closely to the position of the NDN
gene.
Amino acids 191-222 may mediate nuclear localization, but Necdin does not
have a traditional nuclear localization sequence.
In its native state, Necdin seems to assemble with other proteins through multiple
protein-protein crosslinking (Maruyama, 1996). Necdin can also form homo-oligomers,
confirmed by co-immunoprecipitation of differentially tagged Necdin proteins from
transfected COS cells (Tcherpakov et al., 2002).
NDN Gene Structure and Regulation of Expression
Located on human chromosome 15q11.2-q12 and mouse chromosome 7C, the
gene coding for Necdin is unusual in that it does not contain any introns and its
upstream region does not have a classical TATA or CAAT box (Uetsuki et al., 1996).
Necdin is an imprinted gene. The promoter region of Necdin contains a CpG island
which is maternally imprinted, leading to expression only from the paternal allele.
Little is known about the regulation of Necdin expression. A study by Lui et al
(Liu et al., 2009) identified NDN as a target gene of p53, demonstrating that the NDN
promoter contains a p53 binding site and that NDN is a direct transcriptional target of
p53. Furthermore, Necdin is an activator of p53 in the hematopoietic stem cells (HSC)
35
used in the study, thus regulating HSC quiescence. Necdin expression has also been
found to be regulated by NSCL-1 and NSCL-2, however further research is required to
understand the mechanisms behind the regulation of Necdin expression (Kruger et al.,
2004). However, it has been established that Necdin is expressed in a cell-type specific
manner and its expression is finely controlled, both temporally and spatially, as well as
control of allelic expression by imprinting. The maternal allele is genomically imprinted
and so expression from this allele is silenced. Expression of Necdin occurs solely from
the paternal allele (Jay et al., 1997). Disruption of the paternal allele in NDN knock out
mice leads to post-natal lethality, approximately 30 hours after birth (Gerard et al., 1999).
Necdin was shown to be expressed during brain development (Maruyama et al.,
1991) and post-mitotic neurons, but not in other non-neuronal tissues. Necdin is
abundantly expressed in the hypothalamus, midbrain, pons and medulla oblongata but
only in low levels in neocortical neurons. Necdin is also expressed at a high level in
peripheral neurons, such as the sympathetic nervous system and retinal neurons and
abundantly in skeletal myoblasts during myotube formation. During development, Necdin
is constitutively expressed in mouse brain neurons from early embryogenesis
(expressed in forebrain as early as E10) and continues to be expressed until adulthood
(Maruyama et al., 1991).
Necdin Localization
Whilst Necdin has no nuclear localization sequence, amino acids 191-222 may
mediate nuclear localization of the protein (Taniura et al., 2005) Immunohistochemical
studies demonstrated that Necdin was predominantly expressed in the nucleus of
differentiated neurons in the mouse brain (Aizawa et al., 1992; Maruyama et al., 1991)
but not in proliferative neuron-like stem cells that originate from tumors (neuroblastoma
and pheochromocytoma) (Aizawa et al., 1992). Necdin is expressed and localized in the
36
nucleus in differentiated, post-mitotic neurons in the central and peripheral nervous
system of mice. The fact that Necdin is able to interact with p53 and E2F1 also
suggests that Necdin functions within the nucleus (Taniura et al., 1999; Taniura et al.,
1998). However, another study showed that a large amount of Necdin is also in the
cytoplasm of differentiated neurons, with a clear translocation into the nucleus under
specific physiological changes (Niinobe, 2000)
Since Necdin does not have a specific organelle targeting sequence, its
distribution within the cell may be dependent on the localization of its target proteins.
Necdin localization is known to change when Necdin interacts with different proteins.
The subcellular distribution of Necdin alters when it interacts with E2F1 and P75NTR
(Kuwako et al., 2004; Tcherpakov et al., 2002). For example, in cells transfected with
HA-tagged Necdin alone, the majority of the signal was in the cytoplasm, specifically in
the soluble fraction. However, when HA-tagged Necdin was co-expressed with Myc-
tagged EBNA3C, Necdin was predominantly nuclear, with some localization to the
periphery of the cytoplasm/cell membrane component (Kaul et al).
Biological Functions, Mechanisms, and Regulation
Necdin has been shown to have various biological functions within the cell:
Negative growth regulator. The biological functions of Necdin are still being
elucidated. To date Necdin expression has been shown to cause cell cycle arrest in
NIH3T3 and is capable of suppressing the growth of Rb-deficient SAOS-2 osteosarcoma
cells, suggesting that Necdin can act as a substitute for pRb in these cells (Taniura et
al., 2005; Taniura et al., 1998). Necdin, therefore, is functionally similar to pRb but the
two proteins are structurally different.
37
Necdin is a potent growth suppressor that is predominantly expressed in post-
mitotic neurons (Aizawa et al., 1992; Hayashi et al., 1995; Maruyama et al., 1991;
Uetsuki et al., 1996). Expression of FLAG-tagged Necdin in melanoma cells suppressed
growth as demonstrated by a 30% reduction in [3H] thymidine incorporation 4 days after
transfection (Hoek et al., 2004).
Necdin as a transcription factor. Necdin is likely to be a DNA binding protein,
as shown by micrococcal nuclease digestion and may possibly regulate transcriptionally
active genes involved in cellular differentiation and proliferation. This DNA-binding
ability may be coordinated directly by both the amino and acidic regions of the protein
and may be involved in a complex with both histones and DNA or may be modulated
through interaction with other transcription factors, such as p53 and E2F1 (Taniura et al.,
1998).
Necdin may also act as a transcriptional repressor by binding to guanosine-rich
sequences known as GN boxes. GN boxes are recognized by the Sp family of
transcription factors and Necdin was shown, in an in vitro assay, to repress Sp-1
dependent transcriptional activity of a mouse c-myc P1 promoter via the GN box
(Matsumoto, 2001). This suggests that Necdin can bind to these multiple guanosine
clusters present in promoters of target genes, including cell cycle related genes, allowing
Necdin to regulate their expression and, thus, cell proliferation.
The role of Necdin in development. In contrast to highly restricted expression
in mouse, Necdin expression in human cells is much broader. Necdin has been shown
to be expressed in a diverse range of fetal and adult tissue, including brain, lung, liver
and kidney (Jay et al., 1997). This suggests that the multi-functional roles of Necdin
may be relevant in many tissue types.
38
Necdin has been demonstrated to regulate polarization of the cytoskeleton during
development and lack of NDN expression impairs cell migration of murine and human
fibroblasts by impairing polarity initiation via a Cdc42-myosin-dependent pathway (Bush
and Wevrick, 2008).
Necdin as a tumor suppressor gene. Necdin has been postulated to be a
potential tumor suppressor gene (Chapman & Knowles, 2009), functionally similar to
pRb and capable of repressing the cell cycle proteins (see Protein-Protein Interactions
section). In line with this claim, Necdin expression has also been shown to be
downregulated in several tumor types and cell lines. However, further research is
required to validate the function of Necdin as a tumor suppressor gene.
Cell Differentiation. Necdin is expressed during neuronal differentiation in vivo
and in vitro (Kuwako et al., 2004) in which many cells undergo apoptosis and protects
them from apoptosis. Necdin may serve as an intrinsic anti-apoptotic protein to prevent
neuronal precursors and postmitotic neurons from E1F1 induced death. Necdin is also
expressed during terminal differentiation of sensory neurons that are dependent on NGF
(Takazaki et al., 2002).
Necdin Protein-Protein Interactions
Necdin has been shown to interact with various molecules with diverse functions:
p53. Yeast two-hybrid and in vitro binding assays demonstrated that Necdin
binds the transactivation domain of p53 in the amino-terminal region of p53, between the
MDM2-binding site and the proline-rich domain. Amino acids 35-62 of p53 are required
for this binding (Taniura et al., 1998).
39
Necdin binding to p53 appears to modulate the activity of p53. The Necdin/p53
complex is competent for DNA binding and is able to repress transcription of a
p21/WAF1 luciferase reporter but Necdin does not have an inhibitory effect on p53-
regulated growth suppression. Necdin can block p-53 induced apoptosis in U2OS cells,
suggesting that Necdin has a protective effect. Necdin therefore appears to exert a
negative effect on the transactivation domain and apoptosis, via the proline-rich domain.
Acetylation of p53 leads to transcription of pro-apoptotic genes. Necdin is
capable of mediating an interaction between p53 and SRT1 histone deacetylase, leading
to p53 deacetylation and consequent inhibition of p53-regulated apoptosis in cortical
neurons (Hasegawa 2008).
SV40 large T antigen. The Simian Virus 40 large T antigen can bind both p53
and pRb during cellular transformation (Ludlow, 1993) and studies showed that the
SV40 large T antigen could also bind to Necdin (Ohman Forslund and Nordqvist, 2001;
Taniura et al., 1998) . Indeed, Necdin co-immunoprecipitated with the large T antigen in
nuclear extract from SV40-transformed COS-1 monkey kidney cells that were
transfected with Necdin. Necdin binds to the amino-terminal region of the large T
antigen (amino acids 84-708, T), with which both p53 and pRb interact (Taniura et al.,
1998).
Adenoviral E1A. Whilst both pRb and p53 bind to the SV40 large T antigen,
only pRb is known to bind to the adenovirus E1A viral oncoprotein. p53, however,
interacts with the adenoviral E1B protein. Necdin also interacts with the adenovirus E1A
viral oncoprotein at the same location as pRb (amino acids 1-185), whereas p53 was not
able to bind (Taniura et al., 1998).
40
E2F1. Since Necdin and pRb show similar binding characteristics, it is not
surprising that Necdin interacts with the carboxy-terminal of E2F1 (amino acids 55-430).
This domain contains the cyclin A binding site, DNA binding region as well as the
transactivation domain of E2F1. Necdin represses E2F1–dependent transactivation in
vivo (Taniura 1998) by interacting with the transactivation domain of E2F1.
E2F1 has previously been suggested to function as a pro-apoptotic factor in
postmitotic neurons (Azuma-Hara 1999, Hou 2000). Necdin, however, suppressed
E2F1-induced apoptosis in differentiated neuroblastoma cells (Taniura 1998, Kobayashi
2002). Necdin is also expressed during neuronal differentiation in vivo and in vitro
(Kuwako 2004) in which many cells undergo apoptosis. Necdin may serve as an
intrinsic anti-apoptotic protein to prevent neuronal precursors and postmitotic neurons
from E1F1 induced death.
It would appear from deletion mutants, that the central region of Necdin (amino
acids) 83-292) is required for interaction with SV40 large T antigen, E1A oncoprotein
and E2F1 (Taniura 1998).
E2F4. Insulin receptor substrate proteins regulate the interaction of Necdin with
E2F4, which results in repression of the peroxisome-proliferator-activated receptor
gamma (PPARgamma) transcription via a cyclic AMP response element binding protein
(CREB)-dependent pathway (Tseng et al., 2005). This interaction plays a role in
regulating brown preadipocyte differentiation.
HIF-1α. Necdin has been shown to associate with the main transcriptional
regulator involved in hypoxia, HIF-1α and may directly regulate its activity (Moon et al.,
2005). Necdin binds to the oxygen dependent degradation (ODD) domain of HIF-1α
41
reducing the transcriptional activity of HIF-1α under hypoxic conditions. Necdin may
also play a role in HIF-1α degradation. As such, Necdin demonstrates an anti-
angiogenic function.
Role of Necdin in Disease
Prada-Willi Syndrome (PWS). The human Necdin gene, NDN, is located on
chromosome 15q11.2-q12 (Nakada et al., 1998), a region that is involved in the
pathogenesis of the neurodevelopmental disease Prader-Willi syndrome (PWS). PWS is
a complex and progressive disease. PWS symptoms include hypotonia (poor muscle
tone), mental retardation and developmental delay, obesity and respiratory problems.
PWS is caused by either a large de novo deletion on the paternal chromosome 15,
maternal disomy 15 or an imprinting defect, all of which result in lack of expression of
imprinted genes that are active on the paternal chromosome only (Kanber et al., 2009).
Necdin is an imprinted gene, the maternal allele being hypermethylated at the
promoter region CpG islands, resulting in silencing of transcription. As a result,
expression of Necdin occurs solely from transcription of the paternal allele, which
remains hypomethylated, as shown in mice (Hanel and Wevrick, 2001). However,
Necdin is is not expressed at all in PWS (Jay et al., 1997; MacDonald and Wevrick,
1997; Sutcliffe et al., 1997). Necdin lies in a region of the genome that is commonly
deleted in PWS and is likely the candidate gene to play a role in the syndrome.
Human Malignancy. Necdin expression has also previously been show to be
repressed in multiple tumor types. Oncomine analysis (www.oncomine.org)
demonstrated that Necdin has reduced expression in bladder, melanoma, cervical,
42
prostate, lung, breast and ovarian cancer, when compared to normal tissue (Chapman &
Knowles 2009). In agreement with these data, Necdin expression was shown to be
suppressed in a drug-resistant ovarian carcinoma cell line (Varma et al., 2005) and also
in melanoma (Hoek et al., 2004). In the melanoma study, Necdin was shown to be have
reduced expression in six of eight melanoma cell strains tested. This could confer a
growth advantage for tumors. Furthermore, Necdin in melanoma cells is localized to a
different compartment in the cytoplasm compared to normal melanocytes. This indicates
that Necdin may be inactivated by sequestration in these cells.
Together, these results suggest that the multi-functional role of Necdin may be
significant in the development of an array of different tissue types and that repression of
Necdin expression may play a role in tumorigenesis, possibly even acting as a tumor
suppressor gene (Chapman and Knowles, 2009).
Necdin may also play an indirect role in patients with cancer. Late stage cancer
patients often experience cachexia, which presents as progressive wasting of skeletal
muscles, loss of weight, fatigue, weakness and loss of appetite. Necdin has been show
to be expressed in the muscles of cachectic mice and functions to protect the muscle
fibers from tumor-induced wasting by inhibiting the TNFα cachetogenic signaling
pathways at various levels (Sciorati et al., 2009)
43
Summary and Rationale
Hypothesis
Aberrant STAT3 activity is expected to result in permanent genetic alterations
that participate in the development of a malignant phenotype. The genes affected
include regulators of cell cycle progression and cell proliferation, angiogenesis, survival
and apoptosis. We hypothesize that a universal gene expression pattern exists which is
characteristic of aberrant STAT3 activity in malignant cells that may be clinically
relevant.
Rationale
• Aberrant STAT3 activity is expected to result in permanent genetic alterations
that play a role in the development of a malignant phenotype.
• Global gene expression patterns exist that are associated with constitutive
STAT3 activity, as well as tissue specific gene expression profiles e.g. breast vs.
prostate cells.
• The genes regulated by STAT3, when constitutively transcribed, are likely to play
a major role in the development of malignancy through dysregulation of cell cycle
progression, cellular proliferation and survival, angiogenesis and apoptosis.
Objective
The overall objective of this study was to identify global gene expression patterns
associated with activation of STAT3 and to identify candidate STAT3 primary target
genes for further analysis in their role in oncogenesis.
44
Aim 1. To evaluate the efficiency of currently available methods for activating STAT3
activity with the potential for gene expression analysis.
Aim 2. To identify new STAT3 regulated genes in mouse fibroblasts using microarrays.
Aim 3. To directly confirm and further investigate putative STAT3 primary target genes.
45
CHAPTER 2: MATERIALS AND METHODS
Cell Culture and Reagents
NIH3T3 and Balb/c-3T3 mouse fibroblasts were grown in Dulbecco’s modified
Eagle’s medium (DMEM) supplemented with 10% bovine calf serum and 1% penicillin
and streptomycin. NIH3T3 and Balb/c-3T3 v-Src transformed counterparts (Yu et al.,
1995) as well as Balb/c-3T3 cells stably transfected with STAT3-C were grown in DMEM
supplemented with 5% bovine calf serum and 1% penicillin and streptomycin. MDA-MB-
231, MDA-MB-468 and MCF7 cells were obtained from the American Type Culture
Collection (ATCC) and maintained in DMEM/10% fetal bovine serum supplemented with
1% penicillin and streptomycin. PC3 and A375 cells were obtained from ATCC and
maintained in RPMI/10% fetal bovine serum supplemented with 1% penicillin and
streptomycin.
Human recombinant IL-6 was obtained from BD Pharmingen (San Jose, CA,
USA). Cells treated with IL-6 were plated at 1 x 10⁶ cells per 10 cm plate and allowed to
adhere for 24 hours prior to serum-starvation (0.1% bovine calf serum) for 3 hours. The
cells were then treated with either IL-6 (10 ng/ml) or cycloheximide (CHX) alone (10
ug/ml) or pre-treated with CHX for 30 min, followed by the addition of IL-6 (10 ng/ml) for
1 hour.
STAT1 (E23X) and STAT3 (C20X) antibodies were obtained from Santa Cruz
Biotechnology, Inc., Santa Cruz, CA. CPA-7 was a generous gift from Dr. Nick
Lawrence (Turkson et al., 2004).
46
Expression Vectors
pRc/CMV-STAT3C-Flag (constitutively activated STAT3) was a generous gift
from J. Bromberg and J. Darnell (Bromberg et al., 1999). The v-Src plasmid expression
vector, pMvSrc, has been described previously (Johnson et al., 1985). Transient
transfections were performed using Lipofectamine PLUS (Invitrogen, Carlsbad, CA,
USA) according to the manufacturer’s protocol.
siRNA Transfections
siRNA directed specifically against STAT3 and a non-targeting control siRNA
were obtained from Dharmacon RNA Technologies (Chicago, IL, USA). Cells were
transfected using RiboJuice transfection reagent (Novagen, Gibbstown, NJ, USA) as per
the supplier's instructions. At 48 h after initial transfection, non-adherent cells were
washed off and the remaining cells were harvested for Western blot.
Isolation of RNA
At each of 3 passages, cells from the five 10 cm dishes were pooled and total
RNA was extracted using TRIzol (Invitrogen, Carlsbad, CA) according to the
manufacturer’s protocol. The RNA in the aqueous phase of the TRIzol reagent was
further purified using the RNeasy RNA clean-up procedure (Qiagen Inc., Valencia, CA,
USA). The quality of the total RNA was assessed by agarose gel electrophoresis and
RNA concentration analyzed on an Agilent 2100 Bioanalyzer.
Quantitative Real-time PCR
For real-time PCR, total RNA was isolated as detailed above. An aliquot of the
same RNA used for microarray analysis, was used for Real-Time PCR using TaqMan®
Gene Expression Assays (Applied Biosystems, Foster City, CA, USA) according to the
47
manufacturer’s instructions. TaqMan® Gene Expression Assay Mm02524479_s1* was
used to analyze Necdin expression and Eukaryotic 18S rRNA (4319413E, Applied
Biosystems) was used as an endogenous control. Data were analyzed using SDS
software version 2.2.2 and exported into an Excel spreadsheet.
Preparation of labeled RNA for hybridization
Total RNA (1 μg) was then used for microarray analysis using Affymetrix Mouse
Genome 2.0 GeneChips, according to the manufacturer’s protocol. Briefly, the poly(A)
RNA was specifically converted to cDNA, amplified then labeled with biotin following the
procedure initially described by Van Gelder et al. (Van Gelder RN, 1990).
First-strand cDNA synthesis was carried out using the Superscript Choice
System (Invitrogen, Carlsbad, CA) with the T7 promoter/oligo (dT) primer (5’-
GGCCAGTGAATTGTAATACGACTCACTATAGGGAGGCGG-(dT)24-3’) (Genset Corp.,
La Jolla, CA). Following annealing, the rest of the cDNA synthesis reaction was
prepared such that the final reaction contains 5 ug RNA, 100 pmol T7-(T)24 primer, 500
μM each dNTP, 10 mM DTT, 50 mM Tris-HCl, pH 8.3, 75 mM KCl, 3 mM MgCl2, and
200 U of Superscript II reverse transcriptase (Invitrogen Corporation, Carlsbad, CA). The
reaction was incubated for 1 hr at 42°C. A second-strand cDNA synthesis was
performed at 16°C for 2 hr in a total volume of 150 μL, using 10U of E.coli DNA ligase,
40 U of E. coli DNA polymerase I, and 2 U of E. coli RNase H in the presence of 200 μM
of each dNTP, 10 mM (NH4)SO4, 1.3 mM DTT, 26.7 mM Tris-HCl, pH 7.0, 100 mM KCl,
5 mM MgCl2, and 150 μM β-NAD+ (Invitrogen). Following the second-strand DNA
synthesis, 10 U of T4 DNA Polymerase (Invitrogen) was added and the samples
incubated an additional 5 min at 16°C. The reaction was stopped by the addition of 0.5
M EDTA and subsequently extracted with an equal volume of phenol/chloroform/isoamyl
alcohol. The double-stranded DNA (dsDNA) will then be precipitated with the addition of
48
0.5 volumes of 7.5 M NH4 Acetate and 2.5 volumes of ice-cold 100% ethanol. The
dsDNA then serves as a template for a transcription reaction performed with the
GeneChip IVT Labeling kit according to manufacturer's instructions (Affymetrix Corp.,
Santa Clara, CA) which incorporates biotinylated UTP into the transcripts. The Biotin-
labeled RNA was purified using RNeasy columns (Qiagen) and fragmented to a size of
35 to 200 bases by incubating at 940 C for 35 minutes in fragmentation buffer (40 mM
Tris-acetate, pH 8.1/100 mM potassium acetate/30 mM magnesium acetate). The
integrity of the starting material and the products of each reaction were monitored on
agarose gels to assess the size distribution of the products and compare them to the
starting material.
Array Hybridization and Scanning
The hybridization solution consisted of 20 μg of fragmented RNA and 0.1 mg/ml
sonicated herring sperm DNA, in 1x MES buffer (containing 100 mM MES, 1 M Na+, 20
mM EDTA, and 0.01% Tween 20). In addition the hybridization solutions were spiked
with known concentrations of RNA from the bacterial genes, BioB, BioC, and BioD, and
one phage gene, Cre, as hybridization standards. The hybridization mixtures were
heated to 99°C for 5 min followed by incubation at 45°C for 5 min before injection of the
sample into a probe array cartridge. All hybridizations were carried out at 45°C for 16–17
h with mixing on a rotisserie at 60 rpm. Following hybridization, the solutions were
removed and the arrays were rinsed with 1x MES. Subsequent washing and staining of
the arrays was carried out using the GeneChip Fluidics station protocol EukGE_WS2,
which consists of 10 cycles of 2 mixes per cycle with non-stringent wash buffer (6x
SSPE, 0.01% Tween 20) at 25°C followed by 4 cycles of 15 mixes per cycle with
stringent wash buffer (100 mM MES, 0.1 M Na+, and 0.01% Tween 20) at 50°C. The
probe arrays were then stained for 10 min in streptavidin-phycoerythrin solution (SAPE)
49
[1x MES solution, 10 μg/ml SAPE (Molecular Probes, Eugene, OR), and 2 μg/μl
acetylated BSA (Invitrogen) at 25°C. The post-stain wash was 10 cycles of 4 mixes per
cycle at 25°C. The probe arrays were treated for 10 min with an antibody solution [1x
MES solution, 2 μg/μl acetylated BSA, 0.1 μg/μl normal goat IgG (Sigma Chemical, St.
Louis, MO), 3 μg/μl biotinylated goat-anti-streptavidin antibody, (Vector Laboratories,
Burlingame, CA) at 25°C. The final wash consisted of 15 cycles of 4 mixes per cycle at
30°C. Following washing and staining, probe arrays were scanned once at 1.5-μm
resolution using the Affymetrix GeneChip Scanner 3000. Scanned output files were
visually inspected for hybridization artifacts.
Normalization of Microarray Data
When using high density oligonucleotide microarrays, the aim is usually to
determine how RNA populations may differ in expression in response to experimental
conditions. Variations in global gene expression patterns usually result in a change in
cell phenotype and are referred to as “biological variation”. However, the observed
expression of genes can also include variation introduced through non-biological or
“experimental variation”, which includes sample preparation, array production and
processing, including labelling, hybridization and scanning. The raw data from the
scanned chips therefore needs to be appropriately normalized to reduce unwanted
variation between chips and allow data from different arrays to be compared in a
meaningful way.
Microarray analysis using the Affymetrix GeneChip® system yields a CEL file for
each GeneChip run. Each CEL file contains the expression level data for all the
probesets on the chip. The first step in preparing the microarray data for analysis is
referred to as normalization. This process adjusts the individual hybridization intensities
to balance them appropriately, allowing meaningful biological comparisons to be made
50
between chips. Normalization is similar to adjusting expression levels measured by
Northern blot or quantitative Real Time PCR where expression of a particular gene is
adjusted relative to the expression of one or more reference genes whose expression
level us assumed to be constant between experimental samples. Consequently,
normalization takes into account different quantities of starting RNA, differences in
labelling or detection of the fluorescent dyes and any systematic biases in the measured
expression levels for any probe.
Normalization methods usually involve the selection and calibration of data
derived from genes that are known not to be affected by experimental conditions. In this
study, we used the Robust Multichip Average (RMA) method of normalization
established by Irizarry et al. (Irizarry et al., 2003). RMA consists of three steps: a
background adjustment, quantile normalization and finally summarization. Background
correction adjusts for background noise and processing effects; cross-hybridization and
adjusts estimated expression values to fall on a proper scale. Quantile normalization is
a simple and fast algorithm which normalizes the data so that the quantiles of each chip
of equal.
The CEL files were normalized using Robust Multichip Average (RMA) (Irizarry et
al., 2003) using RMAExpress software using background correction, quantile
normalization and Median Polish summarization.
Significance Analysis of Microarrays
In order to identify changes in gene expression caused by v-Src or STAT-3C
expression, CEL files for three Balb/c-3T3 control chips were either normalized with the
CEL files for the three v-Src chips or normalized separately with the CEL files for the
three STAT3-C chips. The expression sets were then exported to a Microsoft Excel
spreadsheet, formatted for analysis by the Significance Analysis of Microarrays (SAM)
51
add-in tool for Excel (Tusher et al., 2001). SAM was performed twice: first to identify
differentially expressed genes between control Balb/c-3T3 cells and Balb/c-3T3 cells
expressing pMvSrc, then again to identify differentially expressed genes between control
Balb/c-3T3 cells and Balb/c-3T3 cells expressing pRcCMV-STAT3-C.
The options selected for SAM analysis were as follows: Response Type: two-
class, unpaired data (Class 1 – Balb/c-3T3, Class 2 – v-Src or STAT3-C); Data logged:
logged (base 2); Weblink Option: Accession number; Number of Permutations: 100;
Imputation engine: N/A – no missing data in experiment; Random number seed:
generate random number seed. This produced a list of Affymetrix probeset IDs
differentially expressed in cells expressing v-Src and also for STAT3-C as compared to
control cells. We accepted all probesets identified by SAM as differentially regulated by
at least 1.5-fold.
Overlap of the Two Microarray Data Sets.
Microarray analysis and subsequent SAM generated two lists of differentially
expressed genes: one list identified genes differentially expressed between control
Balb/c-3T3 cells and cells transfected with v-Src, and the second list contained genes
differentially expressed between control Balb/c-3T3 cells and cells transfected with
STAT3-C. Genes common to both lists are most likely to be directly regulated by
STAT3. Probeset IDs in common between the two lists were identified using the Excel
VLOOKUP function. The probesets identified were then processed by Affymetrix
NetAffx to yield a list of genes. SAM analysis generates a Score (T-statistic) for each
probeset on each list. Probesets common to both lists were ranked using the average of
the two Score values generated from the v-Src and STAT3-C SAM analysis.
The microarray data have been deposited in the Gene Expression Omnibus
(GEO) Database at http://www.ncbi.nlm.nih.gov/geo (GEO accession no. GSE22251).
52
Computational Analysis of Microarray Data
We analyzed and categorized the differentially expressed genes identified by
SAM using the Functional Annotation tool in the DAVID Bioinformatics Database (Dennis
et al., 2003; Huang da et al., 2009). Pathway Analysis was carried out using the
MetaCore Analysis Suite v 5.2 build 17389 GeneGO Maps program (GeneGO, Inc, New
Buffalo, MI) to identify signaling pathways that were enriched in the list of differentially
expressed genes.
Nuclear Extract Preparation and EMSA
For the detection of DNA-binding activity of STAT3 by EMSA, nuclear protein
extracts were prepared using high-salt extraction as described previously (Garcia et al.,
1997). For standard EMSA, nuclear protein (5 µg) was incubated with 32P-radiolabeled
double-stranded DNA oligonucleotides containing a high-affinity variant of the sis-
inducible element (hSIE; sense strand, 5'-AgCTTCATTTCCCTgAAATCCCTA-3') derived
from the c-fos gene promoter, which binds activated STAT3 and STAT1 proteins as a
positive control (Kreis et al., 2007; Wagner et al., 1990).
Supershift assays were performed using anti-STAT3 polyclonal antibodies
(C20X, Santa Cruz Biotechnology) to identify STAT3. 2 µL of the concentrated STAT3
antibody was pre-incubated with 5 µg nuclear protein for 20 min at room temperature
before adding the radiolabeled probe (30 min, 30°C). Samples were then separated by
non-denaturing PAGE and detected by autoradiography.
For competition EMSA, nuclear extract was incubated with a series of unlabeled
NDN oligonucleotides containing putative STAT3 binding sites, added in a molar excess,
prior to adding 32-P-labeled hSIE oligonucleotide. In addition, a wild-type oligonucleotide
probe derived from the Necdin gene promoter (STAT3 consensus DNA-binding
53
sequence italicized) was used as follows: wild-type Necdin/–558 (sense strand, 16-mer),
5'-CTACTTCTAgAA-3'.
Western Blot Analysis
Whole cell lysates were prepared in boiling sodium dodecyl sulphate (SDS)
sample buffer and equal amounts (100 µg) of total protein were run on a 10% SDS-
polyacrylamide gel. The proteins were transferred to nitrocellulose membrane, washed
with PBS/0.2% Tween 20, and incubated in 1x PBS/0.2% Tween 20/5% milk overnight
with anti-phospho-STAT3 antibody (STAT3 Tyr705, Cat. #9131, Cell Signaling, Boston,
MA, USA), or anti-STAT3 antibody to an epitope in the C-terminus of full-length STAT3-
alpha (sc-482, Santa Cruz Biotechnology, Santa Cruz, CA) or anti-Necdin antibody
(ab18554, Abcam, Cambridge, MA, USA). The membrane was then washed with
PBS/0.2% Tween 20, incubated for 1 h at room temperature with alkaline phosphatase–
linked anti-rabbit secondary antibodies, and visualized using ECL Western Blotting
Detection Reagents (Amersham, Pittsburgh, PA, USA). For detection of ß-actin, the blot
was stripped with stripping buffer [2% SDS, 62.5 mmol/L Tris (pH 6.8), 0.7% ß-
mercaptoethanol] and re-blotted with anti-ß-Actin (A5441, Sigma) for 1 h at room
temperature and visualized as described. Bands were detected by autoradiography.
For densitometry, images were digitally scanned and optical density of the bands was
quantified using Scion Image (Scion Corporation, Frederick, MD) and normalized to
control.
Chromatin Immunoprecipitation
Chromatin immunoprecipitation was performed using a kit from Upstate as
described by the supplier. Briefly, 2 million v-Src 3T3 cells were treated with
formaldehyde for 10 minutes at room temperature. Cells were collected by scraping,
54
lysed and the DNA sheared by ultrasonication (Bioruptor XL, Diagenode).
Immunoprecipitations were performed with the following antibodies (4.0 µg): anti-total
STAT3 (sc-482, Santa Cruz Biotechnology), and anti-rabbit Ig G (sc-2027, Santa Cruz
Biotechnology) as a control. Subsequently, cross-links were reversed, and bound DNA
was purified. PCR was performed using NDN/-558 specific primers: Fwd: 5`-
CATgAgAgACTgTTAggTATC-3` and Rev: 5`-CTATAgATTTgggCTCTCCAT-3`. Control
primers were also used as follows: Fwd: 5’- TAg AAC CTA ggA ATg CCA ACA-3’ and
Rev: 5’- gAT ACC TAA CAg TCT CTC ATg-3’.
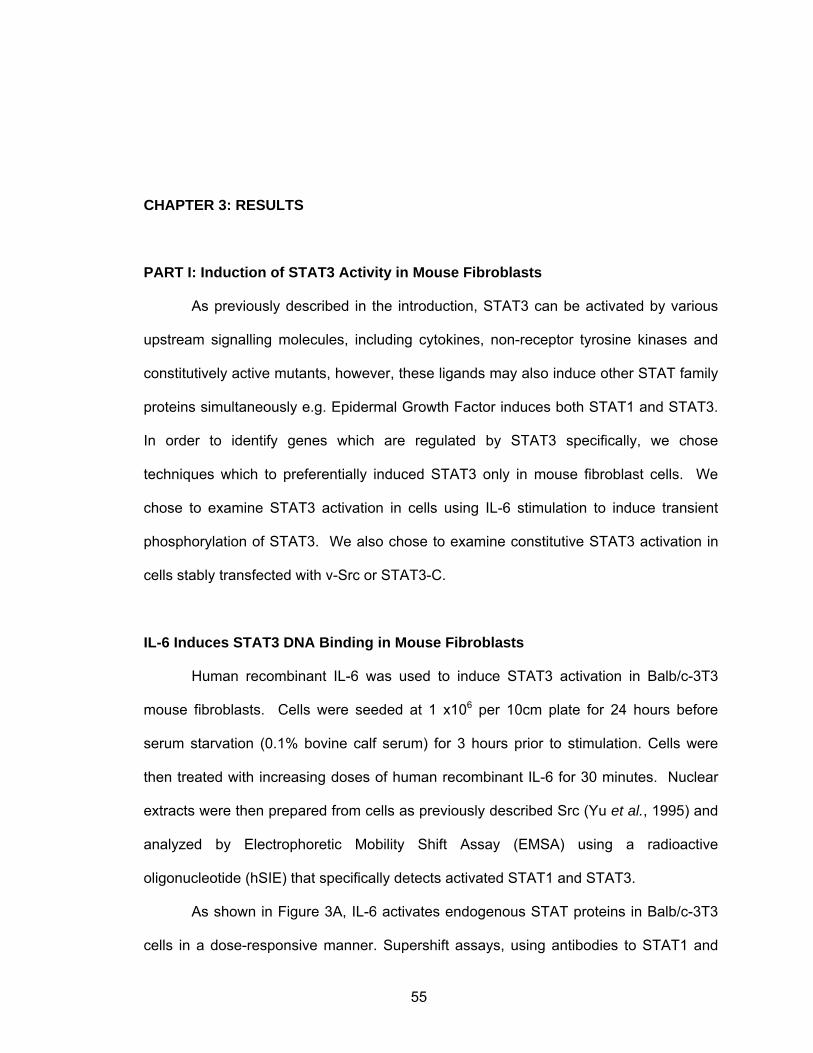
55
CHAPTER 3: RESULTS
PART I: Induction of STAT3 Activity in Mouse Fibroblasts
As previously described in the introduction, STAT3 can be activated by various
upstream signalling molecules, including cytokines, non-receptor tyrosine kinases and
constitutively active mutants, however, these ligands may also induce other STAT family
proteins simultaneously e.g. Epidermal Growth Factor induces both STAT1 and STAT3.
In order to identify genes which are regulated by STAT3 specifically, we chose
techniques which to preferentially induced STAT3 only in mouse fibroblast cells. We
chose to examine STAT3 activation in cells using IL-6 stimulation to induce transient
phosphorylation of STAT3. We also chose to examine constitutive STAT3 activation in
cells stably transfected with v-Src or STAT3-C.
IL-6 Induces STAT3 DNA Binding in Mouse Fibroblasts
Human recombinant IL-6 was used to induce STAT3 activation in Balb/c-3T3
mouse fibroblasts. Cells were seeded at 1 x10⁶ per 10cm plate for 24 hours before
serum starvation (0.1% bovine calf serum) for 3 hours prior to stimulation. Cells were
then treated with increasing doses of human recombinant IL-6 for 30 minutes. Nuclear
extracts were then prepared from cells as previously described Src (Yu et al., 1995) and
analyzed by Electrophoretic Mobility Shift Assay (EMSA) using a radioactive
oligonucleotide (hSIE) that specifically detects activated STAT1 and STAT3.
As shown in Figure 3A, IL-6 activates endogenous STAT proteins in Balb/c-3T3
cells in a dose-responsive manner. Supershift assays, using antibodies to STAT1 and
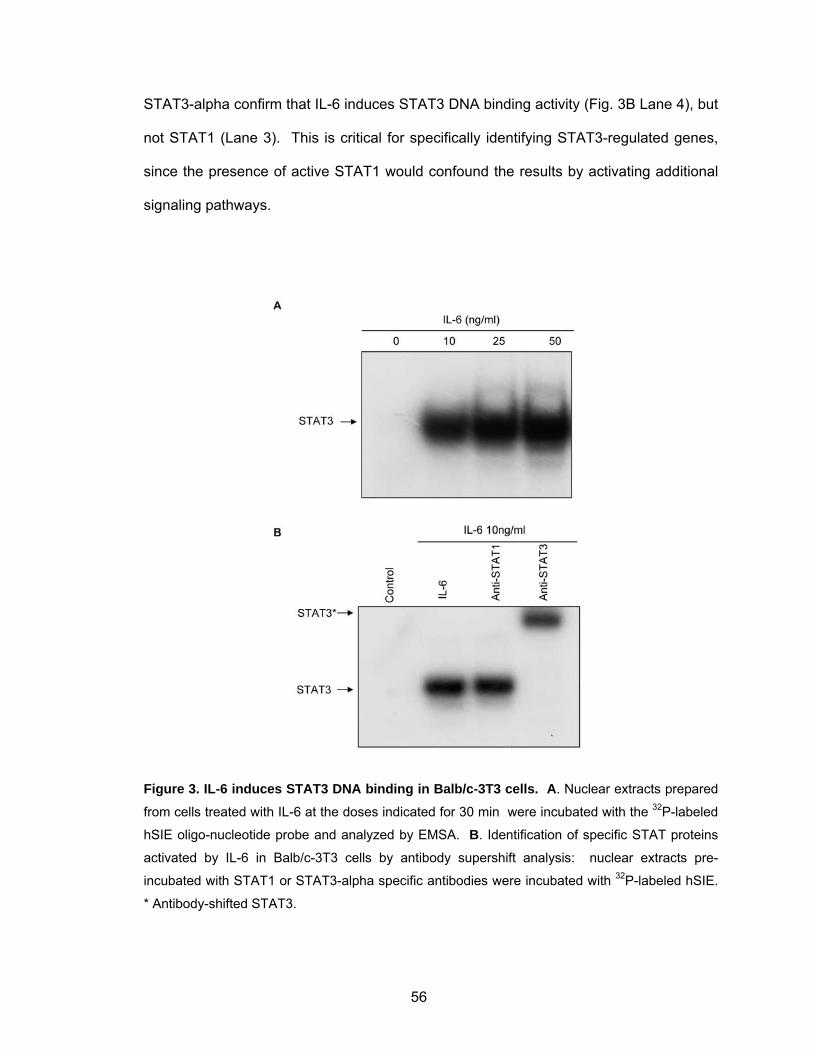
56
STAT3-alpha confirm that IL-6 induces STAT3 DNA binding activity (Fig. 3B Lane 4), but
not STAT1 (Lane 3). This is critical for specifically identifying STAT3-regulated genes,
since the presence of active STAT1 would confound the results by activating additional
signaling pathways.
Figure 3. IL-6 induces STAT3 DNA binding in Balb/c-3T3 cells. A. Nuclear extracts prepared
from cells treated with IL-6 at the doses indicated for 30 min were incubated with the 32P-labeled
hSIE oligo-nucleotide probe and analyzed by EMSA. B. Identification of specific STAT proteins
activated by IL-6 in Balb/c-3T3 cells by antibody supershift analysis: nuclear extracts pre-
incubated with STAT1 or STAT3-alpha specific antibodies were incubated with 32P-labeled hSIE.
* Antibody-shifted STAT3.
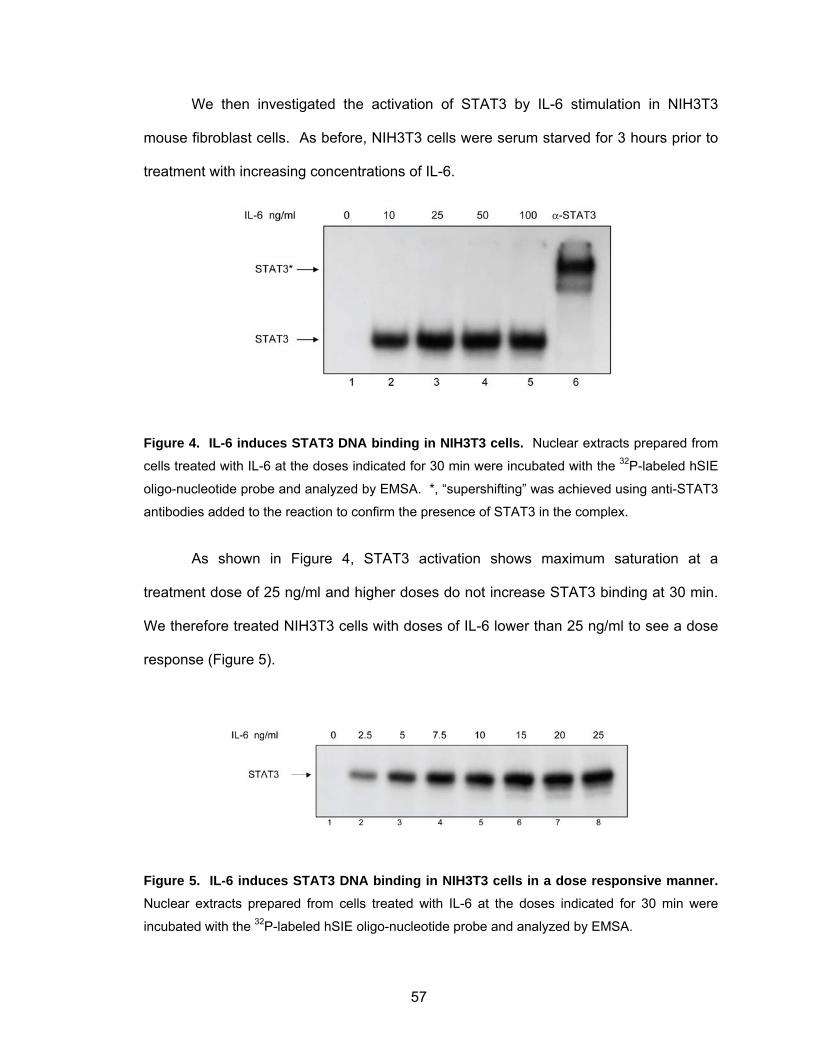
57
We then investigated the activation of STAT3 by IL-6 stimulation in NIH3T3
mouse fibroblast cells. As before, NIH3T3 cells were serum starved for 3 hours prior to
treatment with increasing concentrations of IL-6.
Figure 4. IL-6 induces STAT3 DNA binding in NIH3T3 cells. Nuclear extracts prepared from
cells treated with IL-6 at the doses indicated for 30 min were incubated with the 32P-labeled hSIE
oligo-nucleotide probe and analyzed by EMSA. *, “supershifting” was achieved using anti-STAT3
antibodies added to the reaction to confirm the presence of STAT3 in the complex.
As shown in Figure 4, STAT3 activation shows maximum saturation at a
treatment dose of 25 ng/ml and higher doses do not increase STAT3 binding at 30 min.
We therefore treated NIH3T3 cells with doses of IL-6 lower than 25 ng/ml to see a dose
response (Figure 5).
Figure 5. IL-6 induces STAT3 DNA binding in NIH3T3 cells in a dose responsive manner. Nuclear extracts prepared from cells treated with IL-6 at the doses indicated for 30 min were
incubated with the 32P-labeled hSIE oligo-nucleotide probe and analyzed by EMSA.
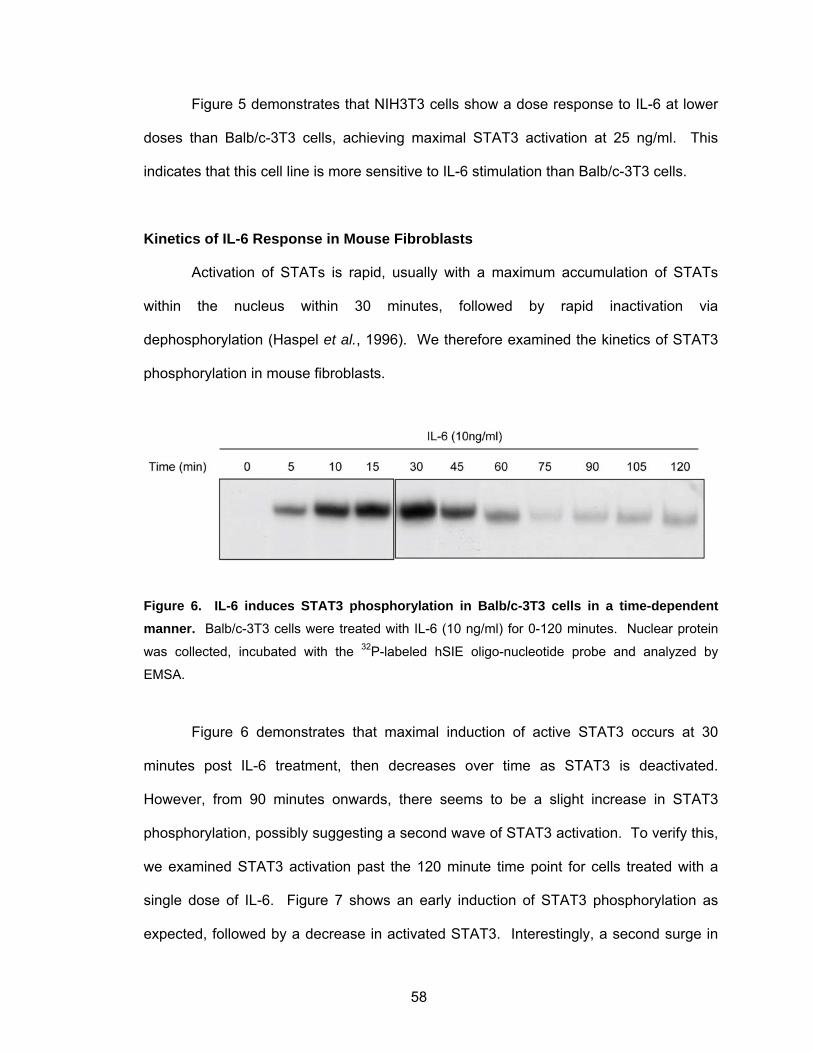
58
Figure 5 demonstrates that NIH3T3 cells show a dose response to IL-6 at lower
doses than Balb/c-3T3 cells, achieving maximal STAT3 activation at 25 ng/ml. This
indicates that this cell line is more sensitive to IL-6 stimulation than Balb/c-3T3 cells.
Kinetics of IL-6 Response in Mouse Fibroblasts
Activation of STATs is rapid, usually with a maximum accumulation of STATs
within the nucleus within 30 minutes, followed by rapid inactivation via
dephosphorylation (Haspel et al., 1996). We therefore examined the kinetics of STAT3
phosphorylation in mouse fibroblasts.
Figure 6. IL-6 induces STAT3 phosphorylation in Balb/c-3T3 cells in a time-dependent manner. Balb/c-3T3 cells were treated with IL-6 (10 ng/ml) for 0-120 minutes. Nuclear protein
was collected, incubated with the 32P-labeled hSIE oligo-nucleotide probe and analyzed by
EMSA.
Figure 6 demonstrates that maximal induction of active STAT3 occurs at 30
minutes post IL-6 treatment, then decreases over time as STAT3 is deactivated.
However, from 90 minutes onwards, there seems to be a slight increase in STAT3
phosphorylation, possibly suggesting a second wave of STAT3 activation. To verify this,
we examined STAT3 activation past the 120 minute time point for cells treated with a
single dose of IL-6. Figure 7 shows an early induction of STAT3 phosphorylation as
expected, followed by a decrease in activated STAT3. Interestingly, a second surge in
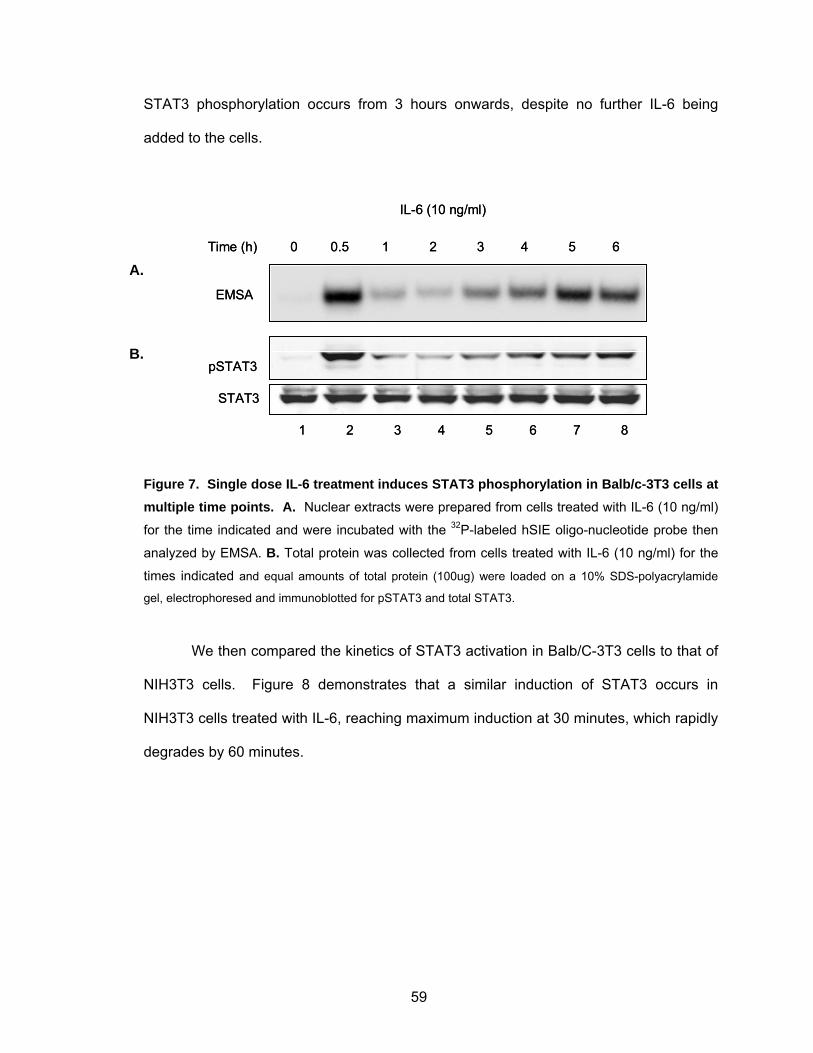
59
STAT3 phosphorylation occurs from 3 hours onwards, despite no further IL-6 being
added to the cells.
pSTAT3
STAT3
IL-6 (10 ng/ml)
Time (h) 0 0.5 1 2 3 4 5 6
1 2 3 4 5 6 7 8
EMSA
pSTAT3
STAT3
IL-6 (10 ng/ml)
Time (h) 0 0.5 1 2 3 4 5 6
1 2 3 4 5 6 7 8
EMSA
Figure 7. Single dose IL-6 treatment induces STAT3 phosphorylation in Balb/c-3T3 cells at multiple time points. A. Nuclear extracts were prepared from cells treated with IL-6 (10 ng/ml)
for the time indicated and were incubated with the 32P-labeled hSIE oligo-nucleotide probe then
analyzed by EMSA. B. Total protein was collected from cells treated with IL-6 (10 ng/ml) for the
times indicated and equal amounts of total protein (100ug) were loaded on a 10% SDS-polyacrylamide
gel, electrophoresed and immunoblotted for pSTAT3 and total STAT3.
We then compared the kinetics of STAT3 activation in Balb/C-3T3 cells to that of
NIH3T3 cells. Figure 8 demonstrates that a similar induction of STAT3 occurs in
NIH3T3 cells treated with IL-6, reaching maximum induction at 30 minutes, which rapidly
degrades by 60 minutes.
A.
B.
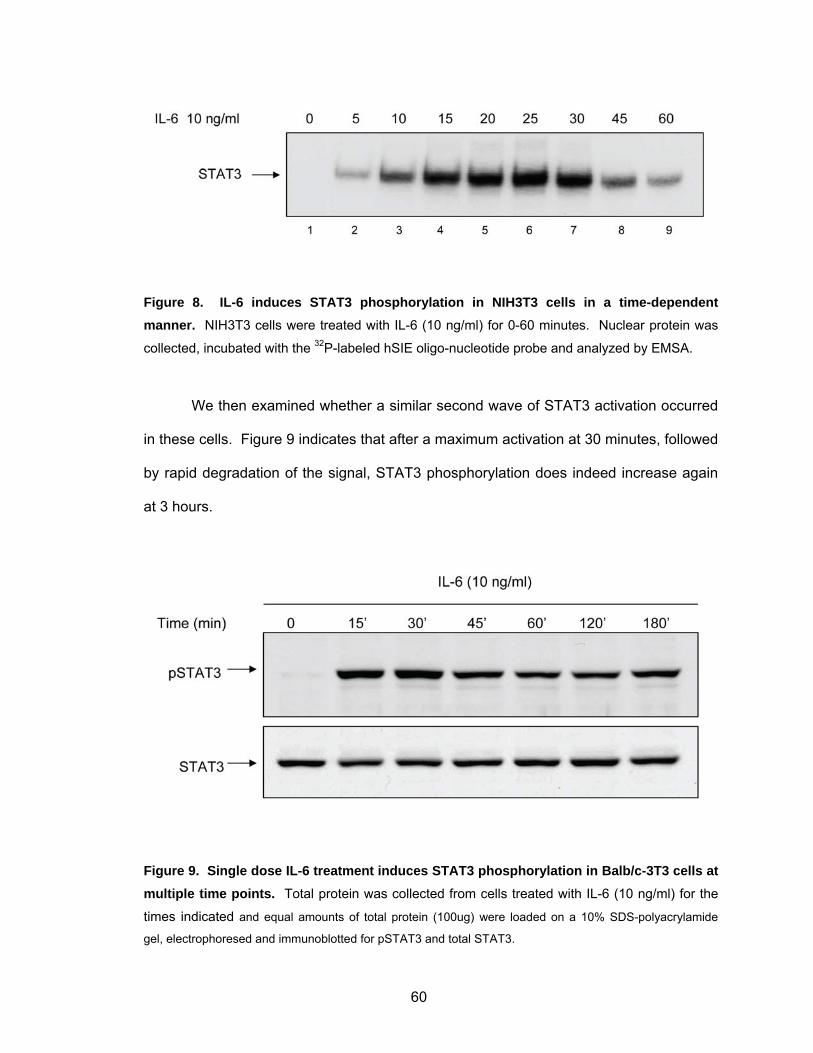
60
Figure 8. IL-6 induces STAT3 phosphorylation in NIH3T3 cells in a time-dependent manner. NIH3T3 cells were treated with IL-6 (10 ng/ml) for 0-60 minutes. Nuclear protein was
collected, incubated with the 32P-labeled hSIE oligo-nucleotide probe and analyzed by EMSA.
We then examined whether a similar second wave of STAT3 activation occurred
in these cells. Figure 9 indicates that after a maximum activation at 30 minutes, followed
by rapid degradation of the signal, STAT3 phosphorylation does indeed increase again
at 3 hours.
Figure 9. Single dose IL-6 treatment induces STAT3 phosphorylation in Balb/c-3T3 cells at multiple time points. Total protein was collected from cells treated with IL-6 (10 ng/ml) for the
times indicated and equal amounts of total protein (100ug) were loaded on a 10% SDS-polyacrylamide
gel, electrophoresed and immunoblotted for pSTAT3 and total STAT3.
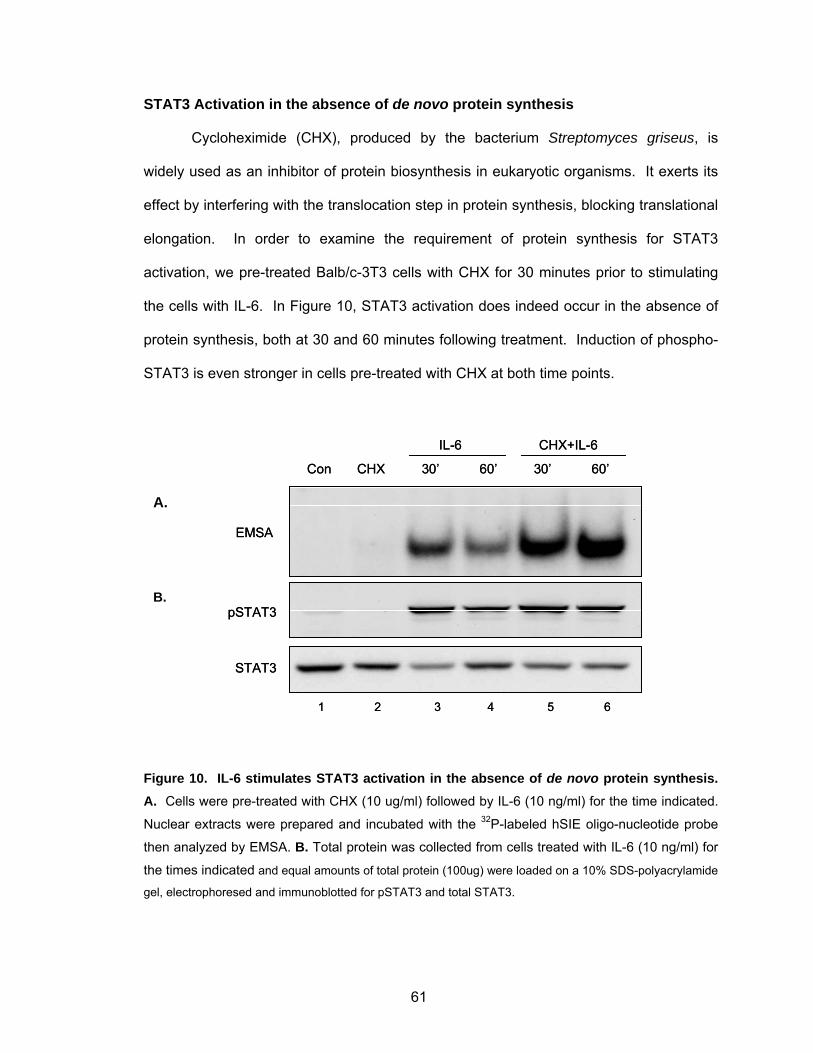
61
STAT3 Activation in the absence of de novo protein synthesis
Cycloheximide (CHX), produced by the bacterium Streptomyces griseus, is
widely used as an inhibitor of protein biosynthesis in eukaryotic organisms. It exerts its
effect by interfering with the translocation step in protein synthesis, blocking translational
elongation. In order to examine the requirement of protein synthesis for STAT3
activation, we pre-treated Balb/c-3T3 cells with CHX for 30 minutes prior to stimulating
the cells with IL-6. In Figure 10, STAT3 activation does indeed occur in the absence of
protein synthesis, both at 30 and 60 minutes following treatment. Induction of phospho-
STAT3 is even stronger in cells pre-treated with CHX at both time points.
pSTAT3
STAT3
Con CHX 30’ 60’ 30’ 60’
1 2 3 4 5 6
IL-6 CHX+IL-6
EMSA
pSTAT3
STAT3
Con CHX 30’ 60’ 30’ 60’
1 2 3 4 5 6
IL-6 CHX+IL-6
EMSA
Figure 10. IL-6 stimulates STAT3 activation in the absence of de novo protein synthesis. A. Cells were pre-treated with CHX (10 ug/ml) followed by IL-6 (10 ng/ml) for the time indicated.
Nuclear extracts were prepared and incubated with the 32P-labeled hSIE oligo-nucleotide probe
then analyzed by EMSA. B. Total protein was collected from cells treated with IL-6 (10 ng/ml) for
the times indicated and equal amounts of total protein (100ug) were loaded on a 10% SDS-polyacrylamide
gel, electrophoresed and immunoblotted for pSTAT3 and total STAT3.
A.
B.
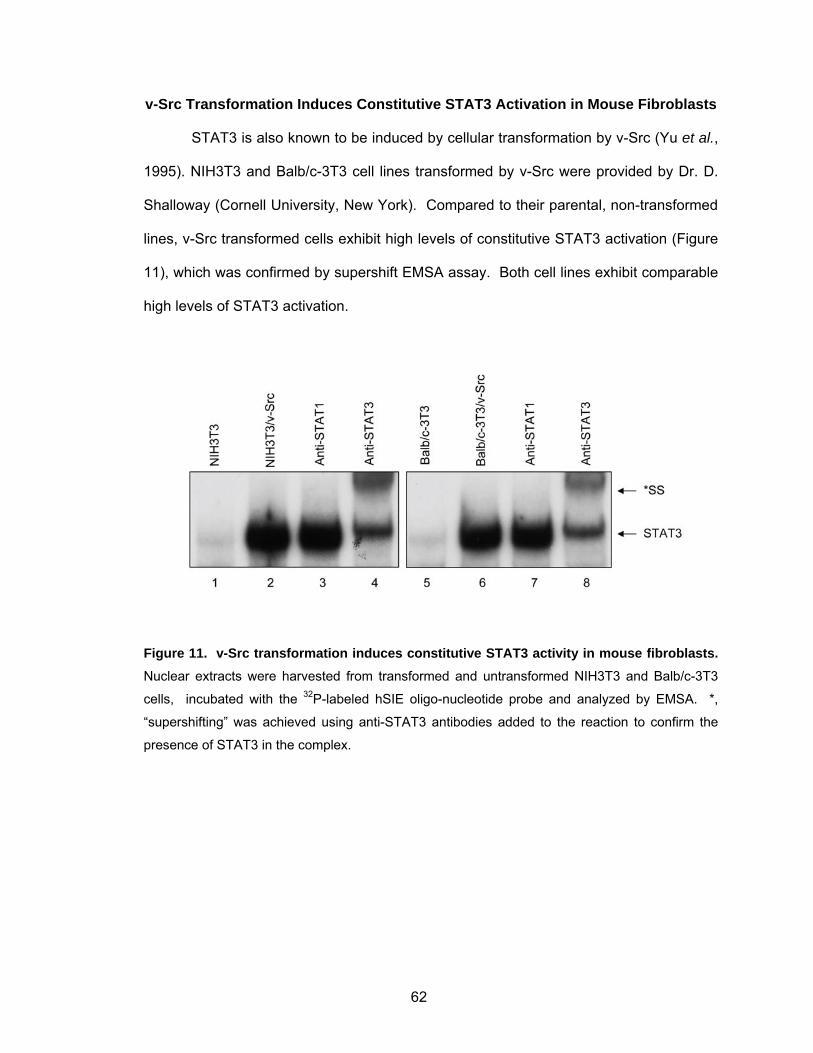
62
v-Src Transformation Induces Constitutive STAT3 Activation in Mouse Fibroblasts
STAT3 is also known to be induced by cellular transformation by v-Src (Yu et al.,
1995). NIH3T3 and Balb/c-3T3 cell lines transformed by v-Src were provided by Dr. D.
Shalloway (Cornell University, New York). Compared to their parental, non-transformed
lines, v-Src transformed cells exhibit high levels of constitutive STAT3 activation (Figure
11), which was confirmed by supershift EMSA assay. Both cell lines exhibit comparable
high levels of STAT3 activation.
Figure 11. v-Src transformation induces constitutive STAT3 activity in mouse fibroblasts. Nuclear extracts were harvested from transformed and untransformed NIH3T3 and Balb/c-3T3
cells, incubated with the 32P-labeled hSIE oligo-nucleotide probe and analyzed by EMSA. *,
“supershifting” was achieved using anti-STAT3 antibodies added to the reaction to confirm the
presence of STAT3 in the complex.
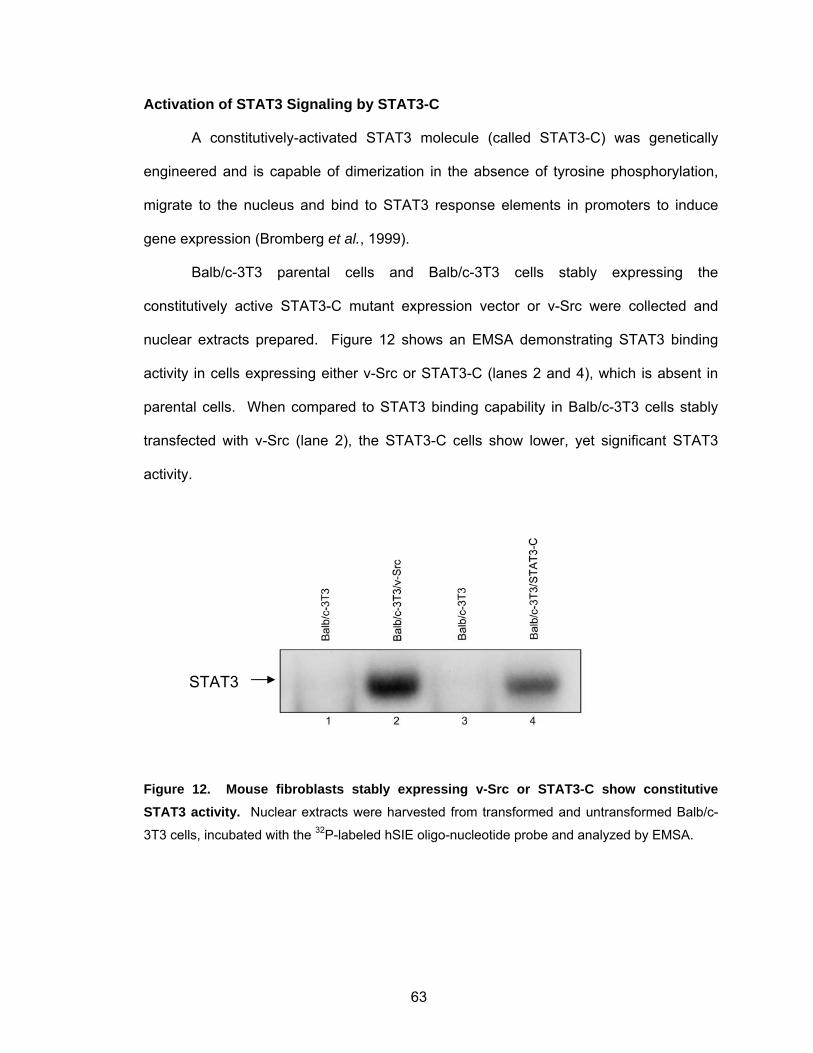
63
Activation of STAT3 Signaling by STAT3-C
A constitutively-activated STAT3 molecule (called STAT3-C) was genetically
engineered and is capable of dimerization in the absence of tyrosine phosphorylation,
migrate to the nucleus and bind to STAT3 response elements in promoters to induce
gene expression (Bromberg et al., 1999).
Balb/c-3T3 parental cells and Balb/c-3T3 cells stably expressing the
constitutively active STAT3-C mutant expression vector or v-Src were collected and
nuclear extracts prepared. Figure 12 shows an EMSA demonstrating STAT3 binding
activity in cells expressing either v-Src or STAT3-C (lanes 2 and 4), which is absent in
parental cells. When compared to STAT3 binding capability in Balb/c-3T3 cells stably
transfected with v-Src (lane 2), the STAT3-C cells show lower, yet significant STAT3
activity.
Figure 12. Mouse fibroblasts stably expressing v-Src or STAT3-C show constitutive STAT3 activity. Nuclear extracts were harvested from transformed and untransformed Balb/c-
3T3 cells, incubated with the 32P-labeled hSIE oligo-nucleotide probe and analyzed by EMSA.
STAT3
64
Summary
STAT3 activation can be induced by multiple mechanisms, including cytokines,
growth factor receptors, non-receptor tyrosine kinases and constitutively active mutants.
We chose to examine activation of STAT3 in mouse fibroblasts using transient
stimulation with IL-6 and constitutive activation of STAT3 via v-Src and STAT3-C stable
transfection.
IL-6 induces STAT3 activation in a dose- and time-dependent manner in mouse
fibroblasts. IL-6 does not induce STAT1 activity in these cells, making them useful to
study gene expression profiles regulated by STAT3. The experiments revealed
differences in the sensitivity of the two cell lines to IL-6 treatment, with NIH3T3 cells
being more sensitive to IL-6. Stimulation of NIH3T3 cells with IL-6 resulted in maximal
STAT3 activation at lower doses than seen in Balb/c-3T3 cells.
Both cell lines, however, exhibited similar kinetics in response to IL-6 treatment.
IL-6 induced a maximal STAT3 activation at 30 minutes, followed by a rapid degradation
of the signal with a surge in STAT3 activation at a later time point, despite no further IL-6
treatment. The rapid degradation of the STAT3 signal post-stimulation is most likely due
to the activation of negative regulators of STAT3, such as SOCS3. Once SOCS3 has
down-regulated the STAT3 activation, it is likely to be degraded itself, thus resulting in a
later surge of STAT3 activity as IL-6 continues to signal via the gp130 receptor.
Pre-treating the cells with CHX prior to IL-6 stimulation blocked de novo protein
synthesis. This ensured that IL-6 was stimulating direct activation of latent STAT3
monomers present in the cytoplasm, but also prevented any other proteins not already
present from being translated. In cells pre-treated with CHX, we saw an induction of
STAT3 activity as expected, which was higher than IL-6-only treated cells at both 30 and
60 minutes. This higher level of STAT3 induction is most likely due to the inhibition of
protein synthesis, particularly in relation to negative feedback proteins such as SOCS3.
65
v-Src and STAT3-C have both been previously characterized in constitutively
activating STAT3 (Bromberg et al., 1999; Yu et al., 1995). We confirmed this in the
mouse fibroblasts we used for these experiments, however, STAT3-C did not appear to
induce constitutive STAT3 activity to the same level as v-Src.
In summary, we examined three well characterized methods for activating STAT3
using mouse fibroblast cells. These cell lines were used for subsequent experiments to
study gene expression patterns in the presence of active STAT3.
66
Part II: Analysis of STAT3-Regulated Gene Expression
Cytokine and growth factor signaling pathways involving STAT3 are frequently
constitutively activated in many different human primary tumors, and are best known for
the transcriptional role they play in the controlling cell growth and cell cycle progression.
However, the extent of STAT3's reach on transcriptional control of the genome as a
whole remains an important question. We predicted that this persistent STAT3 signaling
affects a wide variety of cellular functions, many of which still remain to be characterized.
To date, up-regulated expression of numerous STAT3 target genes has been
identified, including VEGF (Niu et al., 2002), Bcl-2, Bcl-xL (Zushi et al., 1998), p21,
Cyclin D1 (Sinibaldi et al., 2000) and survivin (Gritsko et al., 2006). These STAT3 target
genes have generally been identified on an individual basis, while few studies have
attempted to identify large numbers of STAT3 regulated genes (Alvarez et al., 2005;
Dauer et al., 2005; Paz et al., 2004; Sekkai et al., 2005; Snyder et al., 2008). Our goal
was to take a broad approach to identify novel STAT3 regulated genes involved in
oncogenesis by examining changes in the genome-wide gene expression profile by
microarray, using Balb/c-3T3 cells expressing active STAT3.
Identification of Potential STAT3 Target Genes Expressed Upon IL-6 Stimulation
Balb/c-3T3 cells were treated with IL-6 for 1 h, with or without CHX pre-
treatment. RNA was collected from control cells (no treatment or CHX only) and treated
cells (IL-6 only or CHX+IL-6) from 3 consecutive passages. At each passage, cells from
five 10cm plates were pooled and RNA collected and purified. The RNA was hybridized
to Affymetrix Mouse Genome 430 2.0 GeneChip microarrays and the data analyzed to
identify differentially expressed genes under the different conditions.
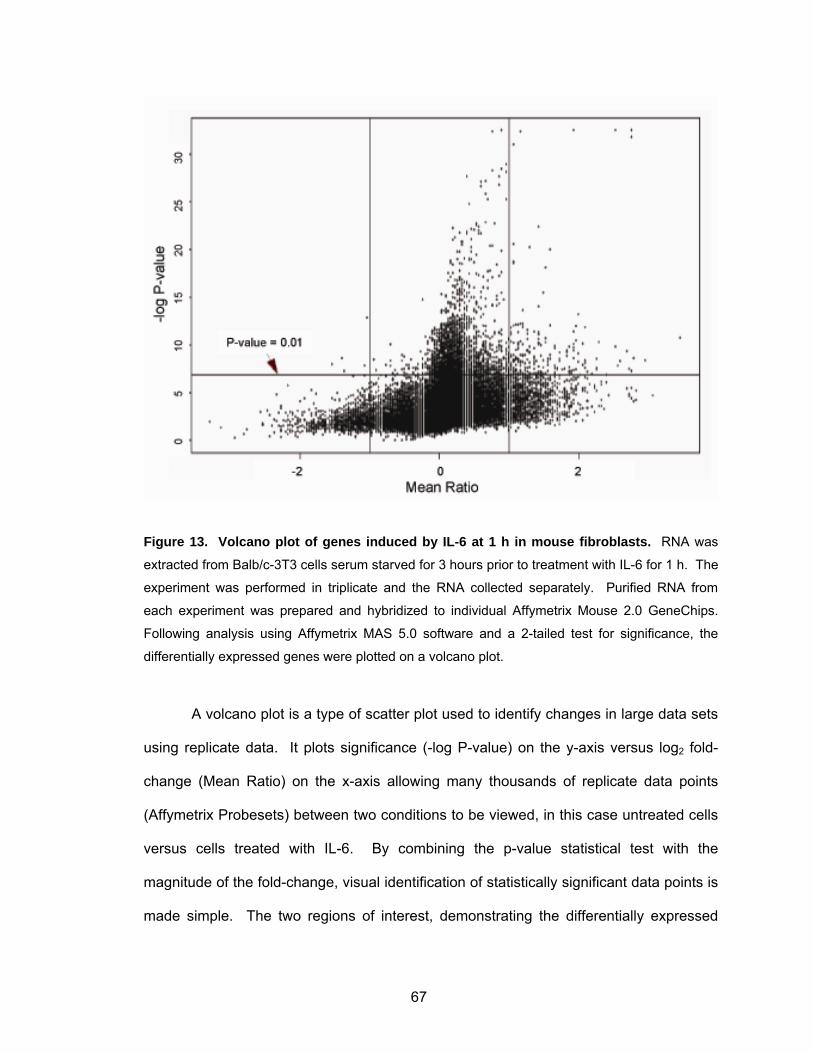
67
Figure 13. Volcano plot of genes induced by IL-6 at 1 h in mouse fibroblasts. RNA was
extracted from Balb/c-3T3 cells serum starved for 3 hours prior to treatment with IL-6 for 1 h. The
experiment was performed in triplicate and the RNA collected separately. Purified RNA from
each experiment was prepared and hybridized to individual Affymetrix Mouse 2.0 GeneChips.
Following analysis using Affymetrix MAS 5.0 software and a 2-tailed test for significance, the
differentially expressed genes were plotted on a volcano plot.
A volcano plot is a type of scatter plot used to identify changes in large data sets
using replicate data. It plots significance (-log P-value) on the y-axis versus log2 fold-
change (Mean Ratio) on the x-axis allowing many thousands of replicate data points
(Affymetrix Probesets) between two conditions to be viewed, in this case untreated cells
versus cells treated with IL-6. By combining the p-value statistical test with the
magnitude of the fold-change, visual identification of statistically significant data points is
made simple. The two regions of interest, demonstrating the differentially expressed
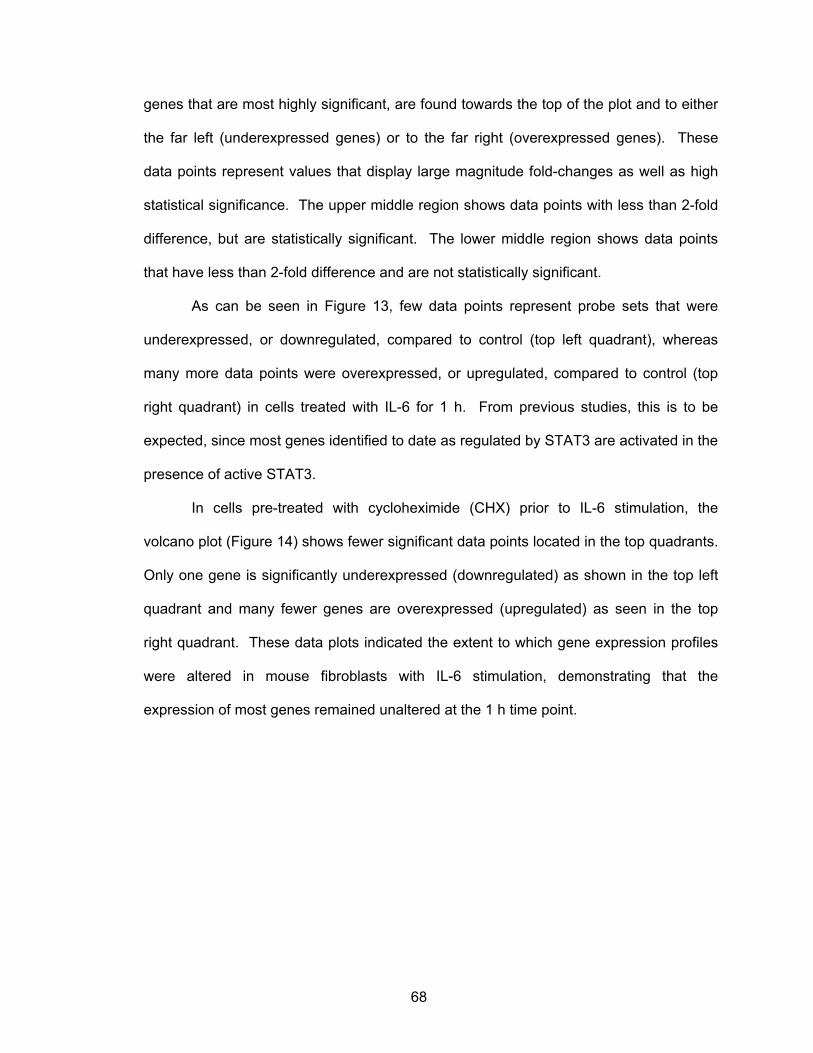
68
genes that are most highly significant, are found towards the top of the plot and to either
the far left (underexpressed genes) or to the far right (overexpressed genes). These
data points represent values that display large magnitude fold-changes as well as high
statistical significance. The upper middle region shows data points with less than 2-fold
difference, but are statistically significant. The lower middle region shows data points
that have less than 2-fold difference and are not statistically significant.
As can be seen in Figure 13, few data points represent probe sets that were
underexpressed, or downregulated, compared to control (top left quadrant), whereas
many more data points were overexpressed, or upregulated, compared to control (top
right quadrant) in cells treated with IL-6 for 1 h. From previous studies, this is to be
expected, since most genes identified to date as regulated by STAT3 are activated in the
presence of active STAT3.
In cells pre-treated with cycloheximide (CHX) prior to IL-6 stimulation, the
volcano plot (Figure 14) shows fewer significant data points located in the top quadrants.
Only one gene is significantly underexpressed (downregulated) as shown in the top left
quadrant and many fewer genes are overexpressed (upregulated) as seen in the top
right quadrant. These data plots indicated the extent to which gene expression profiles
were altered in mouse fibroblasts with IL-6 stimulation, demonstrating that the
expression of most genes remained unaltered at the 1 h time point.
69
Figure 14. Volcano plot of genes induced in mouse fibroblasts by IL-6 at 1 h in the presence of cycloheximide. RNA was extracted from Balb/c-3T3 cells serum starved for 3
hours prior to treatment with CHX for 30 min then IL-6 for 1 h. The experiment was performed in
triplicate and the RNA collected separately. Purified RNA from each experiment was prepared
and hybridized to individual Affymetrix Mouse 2.0 GeneChips. Following analysis using
Affymetrix MAS 5.0 software and a 2-tailed test for significance, the differentially expressed
genes were plotted on a volcano plot.
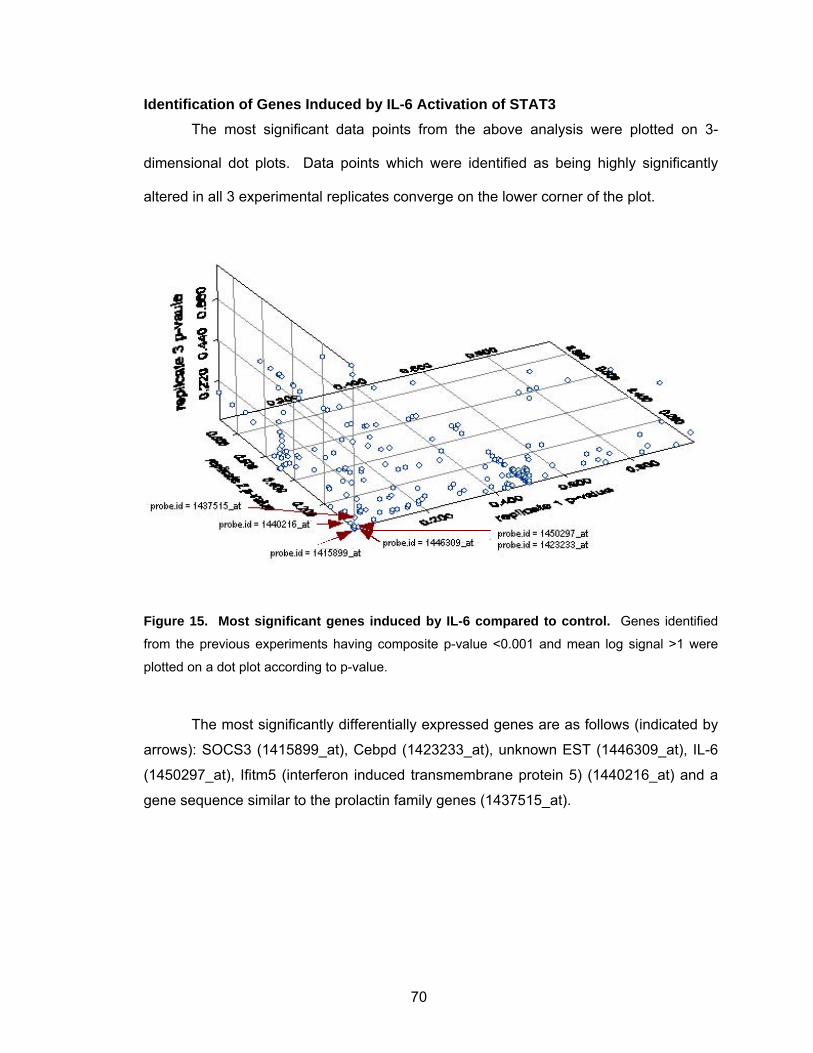
70
Identification of Genes Induced by IL-6 Activation of STAT3 The most significant data points from the above analysis were plotted on 3-
dimensional dot plots. Data points which were identified as being highly significantly
altered in all 3 experimental replicates converge on the lower corner of the plot.
Figure 15. Most significant genes induced by IL-6 compared to control. Genes identified
from the previous experiments having composite p-value <0.001 and mean log signal >1 were
plotted on a dot plot according to p-value.
The most significantly differentially expressed genes are as follows (indicated by
arrows): SOCS3 (1415899_at), Cebpd (1423233_at), unknown EST (1446309_at), IL-6
(1450297_at), Ifitm5 (interferon induced transmembrane protein 5) (1440216_at) and a
gene sequence similar to the prolactin family genes (1437515_at).
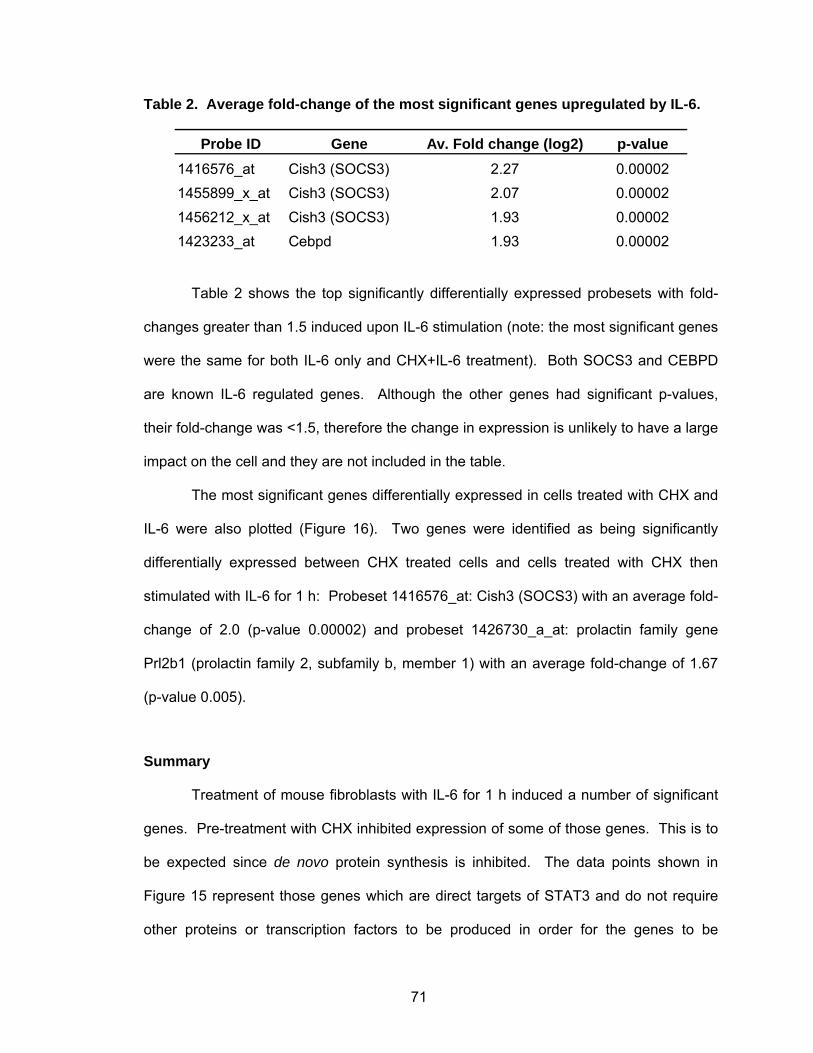
71
Table 2. Average fold-change of the most significant genes upregulated by IL-6.
Probe ID Gene Av. Fold change (log2) p-value1416576_at Cish3 (SOCS3) 2.27 0.000021455899_x_at Cish3 (SOCS3) 2.07 0.000021456212_x_at Cish3 (SOCS3) 1.93 0.000021423233_at Cebpd 1.93 0.00002
Table 2 shows the top significantly differentially expressed probesets with fold-
changes greater than 1.5 induced upon IL-6 stimulation (note: the most significant genes
were the same for both IL-6 only and CHX+IL-6 treatment). Both SOCS3 and CEBPD
are known IL-6 regulated genes. Although the other genes had significant p-values,
their fold-change was <1.5, therefore the change in expression is unlikely to have a large
impact on the cell and they are not included in the table.
The most significant genes differentially expressed in cells treated with CHX and
IL-6 were also plotted (Figure 16). Two genes were identified as being significantly
differentially expressed between CHX treated cells and cells treated with CHX then
stimulated with IL-6 for 1 h: Probeset 1416576_at: Cish3 (SOCS3) with an average fold-
change of 2.0 (p-value 0.00002) and probeset 1426730_a_at: prolactin family gene
Prl2b1 (prolactin family 2, subfamily b, member 1) with an average fold-change of 1.67
(p-value 0.005).
Summary
Treatment of mouse fibroblasts with IL-6 for 1 h induced a number of significant
genes. Pre-treatment with CHX inhibited expression of some of those genes. This is to
be expected since de novo protein synthesis is inhibited. The data points shown in
Figure 15 represent those genes which are direct targets of STAT3 and do not require
other proteins or transcription factors to be produced in order for the genes to be
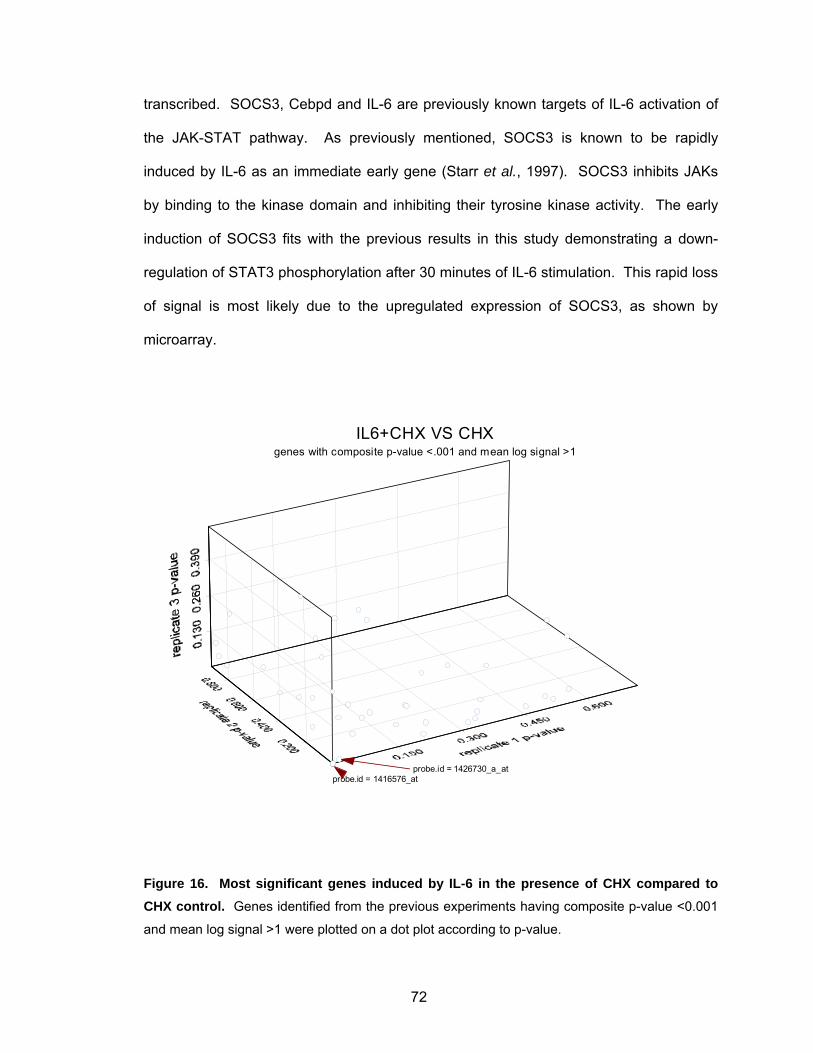
72
transcribed. SOCS3, Cebpd and IL-6 are previously known targets of IL-6 activation of
the JAK-STAT pathway. As previously mentioned, SOCS3 is known to be rapidly
induced by IL-6 as an immediate early gene (Starr et al., 1997). SOCS3 inhibits JAKs
by binding to the kinase domain and inhibiting their tyrosine kinase activity. The early
induction of SOCS3 fits with the previous results in this study demonstrating a down-
regulation of STAT3 phosphorylation after 30 minutes of IL-6 stimulation. This rapid loss
of signal is most likely due to the upregulated expression of SOCS3, as shown by
microarray.
IL6+CHX VS CHXgenes with composite p-value <.001 and mean log signal >1
probe.id = 1416576_atprobe.id = 1426730_a_at
Figure 16. Most significant genes induced by IL-6 in the presence of CHX compared to CHX control. Genes identified from the previous experiments having composite p-value <0.001
and mean log signal >1 were plotted on a dot plot according to p-value.
73
Cebpd (CCAAT/enhancer binding protein (C/EBP), delta) is a bZIP transcription
factor which can bind as a homodimer to certain DNA regulatory regions. It can also
form heterodimers with the related protein CEBP-alpha. A known target of IL-6 signaling
via the JAK-STAT pathway (Yamada et al., 1997), CEBPD is important in regulating
genes involved in immune and inflammatory responses.
In conclusion, microarray analysis of IL-6 induced genes in the presence or
absence of CHX demonstrated the proof of concept that STAT3-regulated genes can be
identified using microarrays, however the genes identified were already known to be
regulated by IL-6 via the JAK-STAT pathway. Using an early time points such as 1 h,
we were unable to identify any novel STAT3-regulated genes that were differentially
expressed.
74
Identification of STAT3 Target Genes in Cells Expressing v-Src and STAT3-C
To identify potential novel STAT3-regulated genes, we examined global gene
expression patterns in cell lines harboring persistently active STAT3. Gene expression
profiles in such cells are likely to be representative of the genetic profile of a cancer cell
with aberrant STAT3 expression, as compared to inducing STAT3 activity transiently
using exogenous stimulation, such as IL-6 or transient transfection (Paz et al., 2004).
Balb/c-3T3 cells were chosen for this study, since parental cells and cells stably
expressing both v-Src and STAT3-C were available. RNA was harvested from normal
Balb/c-3T3 cells with low levels of endogenous STAT3 activity, to serve as a control.
RNA was also extracted from Balb/c-3T3 cells stably transfected with either v-Src,
known to induce persistent activation of STAT3 (Garcia et al., 1997; Zhang et al.,
2000b), or the constitutively active mutant, STAT3-C (Bromberg et al., 1999). Triplicate
samples were collected, one each from three consecutive passages. At each passage,
cells from five 10cm plates were pooled and RNA collected and purified. Each RNA
sample was hybridized to a single Affymetrix Mouse Genome 430 2.0 GeneChip.
Significance Analysis of Microarrays (SAM) (Tusher et al., 2001) was used to
identify differentially expressed genes between parental Balb/c-3T3 cells and cells stably
transfected with either v-Src or STAT3-C. We accepted all genes identified by SAM as
differentially regulated by at least 1.5-fold (Yan et al., 2002).
Overlap of the Two Microarray Data Sets
Microarray analysis and subsequent SAM generated two lists of differentially
expressed genes: one list identified genes differentially expressed between control
Balb/c-3T3 cells and cells transfected with v-Src, and the second list contained genes
differentially expressed between control Balb/c-3T3 cells and cells transfected with
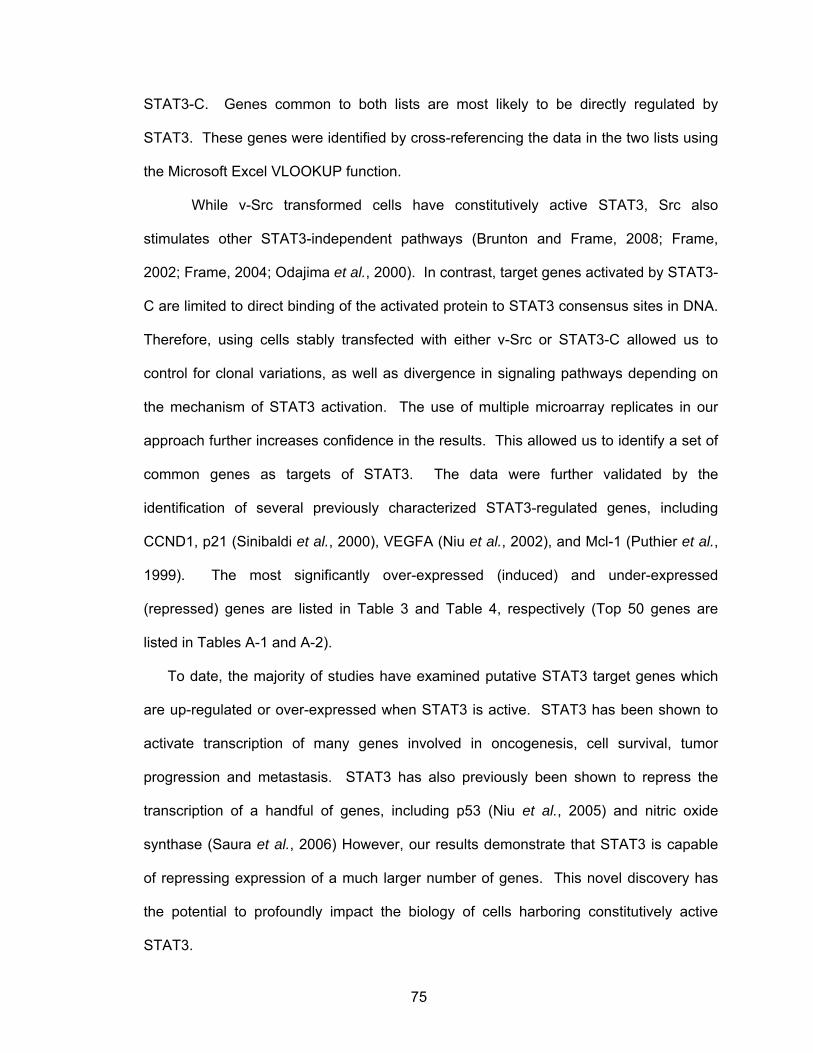
75
STAT3-C. Genes common to both lists are most likely to be directly regulated by
STAT3. These genes were identified by cross-referencing the data in the two lists using
the Microsoft Excel VLOOKUP function.
While v-Src transformed cells have constitutively active STAT3, Src also
stimulates other STAT3-independent pathways (Brunton and Frame, 2008; Frame,
2002; Frame, 2004; Odajima et al., 2000). In contrast, target genes activated by STAT3-
C are limited to direct binding of the activated protein to STAT3 consensus sites in DNA.
Therefore, using cells stably transfected with either v-Src or STAT3-C allowed us to
control for clonal variations, as well as divergence in signaling pathways depending on
the mechanism of STAT3 activation. The use of multiple microarray replicates in our
approach further increases confidence in the results. This allowed us to identify a set of
common genes as targets of STAT3. The data were further validated by the
identification of several previously characterized STAT3-regulated genes, including
CCND1, p21 (Sinibaldi et al., 2000), VEGFA (Niu et al., 2002), and Mcl-1 (Puthier et al.,
1999). The most significantly over-expressed (induced) and under-expressed
(repressed) genes are listed in Table 3 and Table 4, respectively (Top 50 genes are
listed in Tables A-1 and A-2).
To date, the majority of studies have examined putative STAT3 target genes which
are up-regulated or over-expressed when STAT3 is active. STAT3 has been shown to
activate transcription of many genes involved in oncogenesis, cell survival, tumor
progression and metastasis. STAT3 has also previously been shown to repress the
transcription of a handful of genes, including p53 (Niu et al., 2005) and nitric oxide
synthase (Saura et al., 2006) However, our results demonstrate that STAT3 is capable
of repressing expression of a much larger number of genes. This novel discovery has
the potential to profoundly impact the biology of cells harboring constitutively active
STAT3.
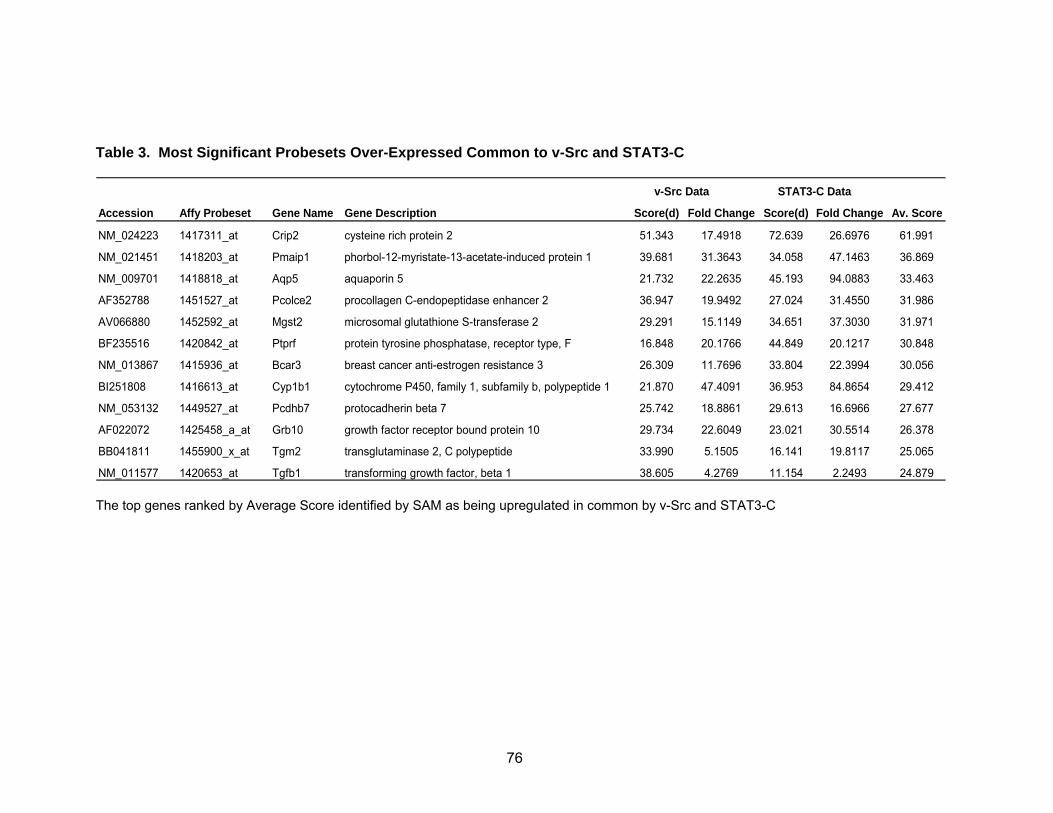
76
Table 3. Most Significant Probesets Over-Expressed Common to v-Src and STAT3-C
v-Src Data STAT3-C Data
Accession Affy Probeset Gene Name Gene Description Score(d) Fold Change Score(d) Fold Change Av. Score
NM_024223 1417311_at Crip2 cysteine rich protein 2 51.343 17.4918 72.639 26.6976 61.991
NM_021451 1418203_at Pmaip1 phorbol-12-myristate-13-acetate-induced protein 1 39.681 31.3643 34.058 47.1463 36.869
NM_009701 1418818_at Aqp5 aquaporin 5 21.732 22.2635 45.193 94.0883 33.463
AF352788 1451527_at Pcolce2 procollagen C-endopeptidase enhancer 2 36.947 19.9492 27.024 31.4550 31.986
AV066880 1452592_at Mgst2 microsomal glutathione S-transferase 2 29.291 15.1149 34.651 37.3030 31.971
BF235516 1420842_at Ptprf protein tyrosine phosphatase, receptor type, F 16.848 20.1766 44.849 20.1217 30.848
NM_013867 1415936_at Bcar3 breast cancer anti-estrogen resistance 3 26.309 11.7696 33.804 22.3994 30.056
BI251808 1416613_at Cyp1b1 cytochrome P450, family 1, subfamily b, polypeptide 1 21.870 47.4091 36.953 84.8654 29.412
NM_053132 1449527_at Pcdhb7 protocadherin beta 7 25.742 18.8861 29.613 16.6966 27.677
AF022072 1425458_a_at Grb10 growth factor receptor bound protein 10 29.734 22.6049 23.021 30.5514 26.378
BB041811 1455900_x_at Tgm2 transglutaminase 2, C polypeptide 33.990 5.1505 16.141 19.8117 25.065
NM_011577 1420653_at Tgfb1 transforming growth factor, beta 1 38.605 4.2769 11.154 2.2493 24.879
The top genes ranked by Average Score identified by SAM as being upregulated in common by v-Src and STAT3-C
77
Table 4. Most Significant Probesets Under-Expressed Common to v-Src and STAT3-C
v-Src Data STAT3-C Data
Accession Affy Probeset Gene Name Gene Description Score(d) Fold Change Score(d) Fold Change Av. Score
AF081260 1418070_at Cdyl chromodomain protein, Y chromosome-like -72.232 0.0548 -47.865 0.0832 -60.049
NM_010882 1415923_at Ndn necdin -58.571 0.0081 -54.087 0.0102 -56.329
AW743020 1435382_at Ndn necdin -30.525 0.0135 -73.974 0.0122 -52.249
NM_009866 1450757_at Cdh11 cadherin 11 -32.836 0.0055 -52.719 0.0048 -42.778
BB074430 1437853_x_at Ndn necdin -16.328 0.1440 -67.114 0.1065 -41.721
AV228782 1434261_at Sipa1l2 signal-induced proliferation-associated 1 like 2 -43.072 0.0715 -38.883 0.1002 -40.978
BB259670 1437284_at Fzd1 frizzled homolog 1 (Drosophila) -16.598 0.0997 -61.622 0.0879 -39.110
AW743020 1435383_x_at Ndn necdin -40.515 0.0120 -29.383 0.0141 -34.949
BB125261 1448293_at Ebf1 early B-cell factor 1 -46.495 0.0688 -19.975 0.0796 -33.235
NM_007993 1460208_at Fbn1 fibrillin 1 -38.299 0.0180 -26.476 0.0200 -32.388
AV124445 1455792_x_at Ndn necdin -30.296 0.0151 -32.708 0.0189 -31.502
NM_011581 1422571_at Thbs2 thrombospondin 2 -33.293 0.0148 -26.721 0.0124 -30.007
The top genes ranked by Average Score identified by SAM as being down-regulated in common by v-Src and STAT3C.
78
One such gene which appears to be repressed by STAT3 is the negative growth
regulator Necdin. Necdin was one of the most significantly repressed genes identified
(Table 4) and five Affymetrix probesets corresponding to NDN were ranked in the list of
the top 12 most significantly repressed probesets, suggesting that Necdin is significantly
repressed when STAT is constitutively active. This demonstrates that computational
analysis of microarray data can be used to identify potential STAT3 target genes for
further investigation.
Pathway Analysis Reveals Known and Novel Functions of STAT3
Pathway Analysis is an unbiased method to determine whether differentially
expressed genes, and the proteins they encode, are enriched in particular pathways,
giving insight into the biological meaning of the changes observed.
We subjected the list of differentially expressed genes in common between v-Src
and STAT3-C expressing cells to the MetaCoreTM Analysis Suite (GeneGO) and
compared them to known biological pathways in the MetaBaseTM database. Using this
analysis we were able to identify known STAT3 pathways, including the JAK/STAT
pathway and Angiotensin/STAT pathway. This provides support for the use of such
analyses to identify novel pathways that may also be regulated by STAT3.
Cell adhesion and cytoskeletal remodeling were among the most significantly
enriched pathways identified from the differentially expressed genes (Table 5). The role
of STAT3 in cytoskeletal remodeling has previously been reported (Gao and Bromberg,
2006). Functional analysis of the genes we identified in cytoskeletal remodeling
processes, indicates that STAT3 regulates genes involved in protein phosphorylation,
signaling (MAPKK and Ras pathways), as well as response to hypoxia and cell
migration.
79
We also examined the genes regulated by STAT3 in cell adhesion and
demonstrated that proteins involved in cell-matrix adhesion and cell-cell adhesion,
particularly focal adhesion formation, were particularly enriched when STAT3 is
constitutively active, as well as several genes in the integrin cell adhesion pathway. As
such, we show that computational analysis of microarray data can identify both known
and novel pathways regulated by STAT3.
80
Table 5. Enriched Pathways in Genes Differentially Expressed by STAT3-C and v-Src
Cell process Count % p-Value
Cell adhesion - Integrin-mediated cell adhesion and migration 19 42.22 5.56E-05
Cytoskeleton remodeling 32 33.33 6.09E-05
Development - Angiotensin signaling via STATs 13 52.00 6.25E-05
Cell adhesion, cytokine and chemokine mediated signaling pathway 31 33.33 7.93E-05
Transcription - Ligand-dependent Transcription of Retinoid Target Genes 15 46.88 8.03E-05
Proteolysis 12 50.00 1.97E-04
Cytoskeletal remodeling and cell adhesion - Integrin outside in signaling 18 39.13 2.79E-04
Development - WNT signaling, degradation of beta-catenin 10 50.00 6.83E-04
G-protein signaling - RhoA regulation pathway 14 41.18 7.26E-04
Immune response - IFN alpha/beta signaling pathway 11 45.83 9.32E-04
Over-represented pathways identified using the MetaCore Analysis Suite (GeneGO Inc.)
81
Functions of Induced Genes.
To determine the functional classification of the differentially expressed genes
identified by SAM, we performed Functional Annotation using the tool in the DAVID
Bioinformatics Database (http://david.abcc.ncifcrf.gov/) (Dennis et al., 2003; Huang da et
al., 2009). A wide range of target genes were altered by STAT3 activation, including
genes involved in multiple pathways regulating biological and cellular processes,
metabolism, protein localization and transport, as well as organ and system
development (Table 6, Figure 17). Genes within these categories include many involved
in cell growth and maintenance, such as lipid, nucleotide and protein synthesis,
metabolism and/or localization (including VLDLR, APOL6, AK5, MTAP, UPP1, POP5,
NUPL1, SEC61B, VDP) as well as signal transduction, all of which are required to
promote cell growth and proliferation.
STAT3 has a well characterized role in regulating gene transcription, however,
we also show through Functional Analysis, that STAT3 controls the expression of genes
involved in cellular processes required to transport the proteins and regulate their
subcellular localization. This supports our hypothesis that STAT3 coordinates multiple
pathways within the cell and reveals that STAT3 has wide-ranging effects, controlling
multiple cellular pathways involved in fundamental biological processes. Our results
suggest that STAT3 orchestrates transcription, translation, transport and localization
leading to wide reaching effects on cell growth, proliferation and survival. In contrast to
previous studies of STAT3 target genes, we demonstrated that STAT3 regulates a
diverse array of genes in both a positive and negative manner. Most genes regulated by
STAT3 that have been identified to date demonstrate increased expression in cells
where STAT3 is activated. However, our results also show that STAT3 signaling causes
repression of many genes, including Necdin, which could profoundly impact the biology
of cells harboring constitutively active STAT3.
82
Table 6. Functional Enrichment (based on GO Biological Process) in Genes Differentially Expressed in Common
by STAT3-C and v-Src using DAVID.
GO Category Level GO Term GO Category* Count p Value
GOTERM_BP_3 GO:0050794 Regulation of cellular process 535 1.64E-14
GOTERM_BP_3 GO:0043283 Biopolymer metabolic process 627 5.89E-12
GOTERM_BP_3 GO:0048519 Negative regulation of biological process 170 3.05E-09
GOTERM_BP_3 GO:0008104 Protein localization 140 5.76E-09
GOTERM_BP_3 GO:0045184 Establishment of protein localization 131 9.26E-09
GOTERM_BP_3 GO:0048523 Negative regulation of cellular process 158 1.96E-08
GOTERM_BP_3 GO:0009653 Anatomical structure morphogenesis 187 2.40E-08
GOTERM_BP_3 GO:0015031 Protein transport 123 3.79E-08
GOTERM_BP_3 GO:0048513 Organ development 213 7.26E-08
GOTERM_BP_3 GO:0048731 System development 248 7.76E-07
The top 10 functionally enriched categories ranked by p-Value for GOTERM_BP_3 identified by DAVID
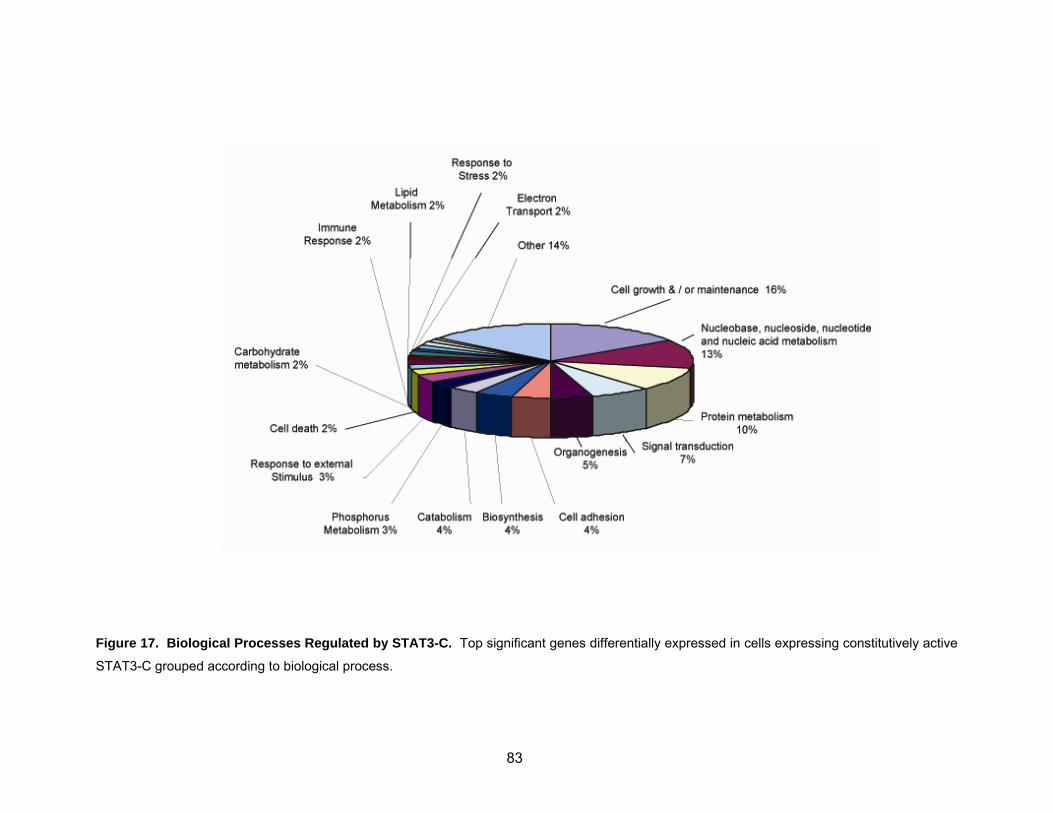
83
Figure 17. Biological Processes Regulated by STAT3-C. Top significant genes differentially expressed in cells expressing constitutively active
STAT3-C grouped according to biological process.
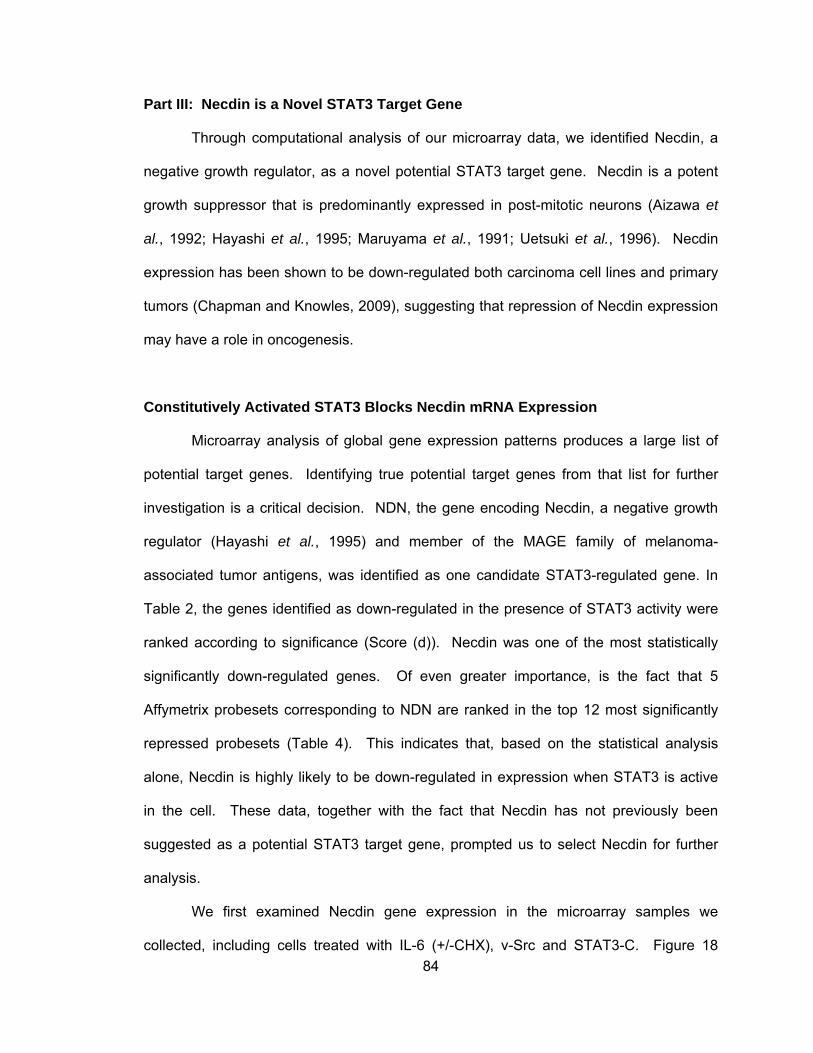
84
Part III: Necdin is a Novel STAT3 Target Gene
Through computational analysis of our microarray data, we identified Necdin, a
negative growth regulator, as a novel potential STAT3 target gene. Necdin is a potent
growth suppressor that is predominantly expressed in post-mitotic neurons (Aizawa et
al., 1992; Hayashi et al., 1995; Maruyama et al., 1991; Uetsuki et al., 1996). Necdin
expression has been shown to be down-regulated both carcinoma cell lines and primary
tumors (Chapman and Knowles, 2009), suggesting that repression of Necdin expression
may have a role in oncogenesis.
Constitutively Activated STAT3 Blocks Necdin mRNA Expression
Microarray analysis of global gene expression patterns produces a large list of
potential target genes. Identifying true potential target genes from that list for further
investigation is a critical decision. NDN, the gene encoding Necdin, a negative growth
regulator (Hayashi et al., 1995) and member of the MAGE family of melanoma-
associated tumor antigens, was identified as one candidate STAT3-regulated gene. In
Table 2, the genes identified as down-regulated in the presence of STAT3 activity were
ranked according to significance (Score (d)). Necdin was one of the most statistically
significantly down-regulated genes. Of even greater importance, is the fact that 5
Affymetrix probesets corresponding to NDN are ranked in the top 12 most significantly
repressed probesets (Table 4). This indicates that, based on the statistical analysis
alone, Necdin is highly likely to be down-regulated in expression when STAT3 is active
in the cell. These data, together with the fact that Necdin has not previously been
suggested as a potential STAT3 target gene, prompted us to select Necdin for further
analysis.
We first examined Necdin gene expression in the microarray samples we
collected, including cells treated with IL-6 (+/-CHX), v-Src and STAT3-C. Figure 18
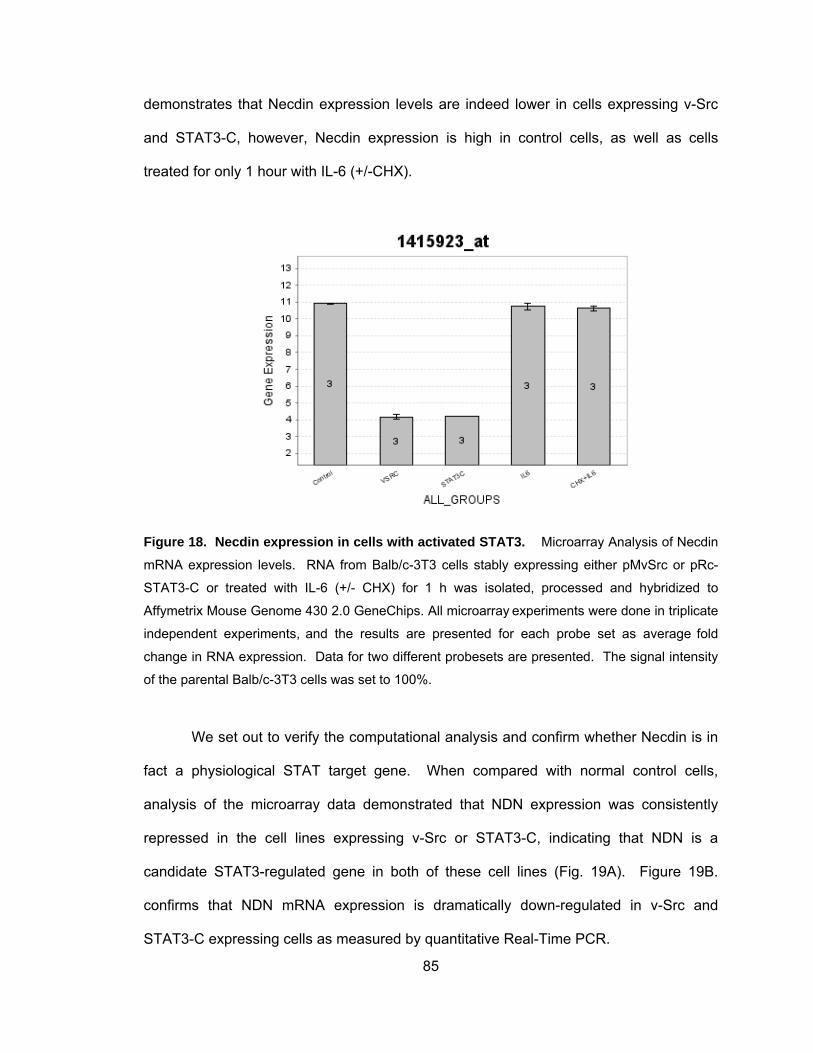
85
demonstrates that Necdin expression levels are indeed lower in cells expressing v-Src
and STAT3-C, however, Necdin expression is high in control cells, as well as cells
treated for only 1 hour with IL-6 (+/-CHX).
Figure 18. Necdin expression in cells with activated STAT3. Microarray Analysis of Necdin
mRNA expression levels. RNA from Balb/c-3T3 cells stably expressing either pMvSrc or pRc-
STAT3-C or treated with IL-6 (+/- CHX) for 1 h was isolated, processed and hybridized to
Affymetrix Mouse Genome 430 2.0 GeneChips. All microarray experiments were done in triplicate
independent experiments, and the results are presented for each probe set as average fold
change in RNA expression. Data for two different probesets are presented. The signal intensity
of the parental Balb/c-3T3 cells was set to 100%.
We set out to verify the computational analysis and confirm whether Necdin is in
fact a physiological STAT target gene. When compared with normal control cells,
analysis of the microarray data demonstrated that NDN expression was consistently
repressed in the cell lines expressing v-Src or STAT3-C, indicating that NDN is a
candidate STAT3-regulated gene in both of these cell lines (Fig. 19A). Figure 19B.
confirms that NDN mRNA expression is dramatically down-regulated in v-Src and
STAT3-C expressing cells as measured by quantitative Real-Time PCR.
86
Figure 19. Analysis of Necdin expression in cell lines stably expressing v-Src or STAT3-C.
A. Microarray Analysis of Necdin mRNA expression levels. RNA from Balb/c-3T3 cells stably
expressing either pMvSrc or pRc-STAT3-C was isolated, processed and hybridized to Affymetrix
Mouse Genome 430 2.0 GeneChips. All microarray experiments were done in triplicate
independent experiments, and the results are presented for each probe set as average fold
change in RNA expression. Data for two different probesets are presented. The signal intensity
of the parental Balb/c-3T3 cells was set to 100%. B. Real-time PCR analysis. RNA samples
used for microarray analysis were measured for Necdin mRNA expression using Real-time PCR
with gene-specific primers and fluorescent-labeled probe (Taqman® Gene Expression Assays,
Applied Biosystems). RNA expression was normalized to 18S rRNA. n = 3 independent
experiments.
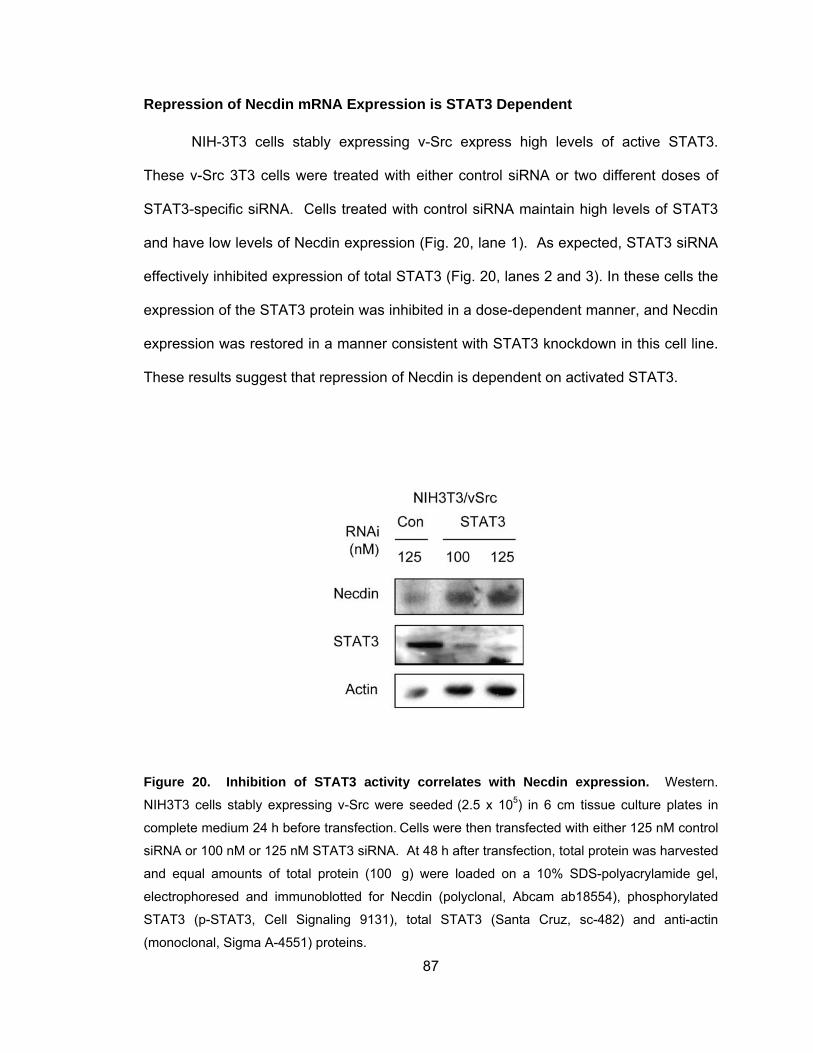
87
Repression of Necdin mRNA Expression is STAT3 Dependent
NIH-3T3 cells stably expressing v-Src express high levels of active STAT3.
These v-Src 3T3 cells were treated with either control siRNA or two different doses of
STAT3-specific siRNA. Cells treated with control siRNA maintain high levels of STAT3
and have low levels of Necdin expression (Fig. 20, lane 1). As expected, STAT3 siRNA
effectively inhibited expression of total STAT3 (Fig. 20, lanes 2 and 3). In these cells the
expression of the STAT3 protein was inhibited in a dose-dependent manner, and Necdin
expression was restored in a manner consistent with STAT3 knockdown in this cell line.
These results suggest that repression of Necdin is dependent on activated STAT3.
Figure 20. Inhibition of STAT3 activity correlates with Necdin expression. Western.
NIH3T3 cells stably expressing v-Src were seeded (2.5 x 10⁵) in 6 cm tissue culture plates in
complete medium 24 h before transfection. Cells were then transfected with either 125 nM control
siRNA or 100 nM or 125 nM STAT3 siRNA. At 48 h after transfection, total protein was harvested
and equal amounts of total protein (100�g) were loaded on a 10% SDS-polyacrylamide gel,
electrophoresed and immunoblotted for Necdin (polyclonal, Abcam ab18554), phosphorylated
STAT3 (p-STAT3, Cell Signaling 9131), total STAT3 (Santa Cruz, sc-482) and anti-actin
(monoclonal, Sigma A-4551) proteins.
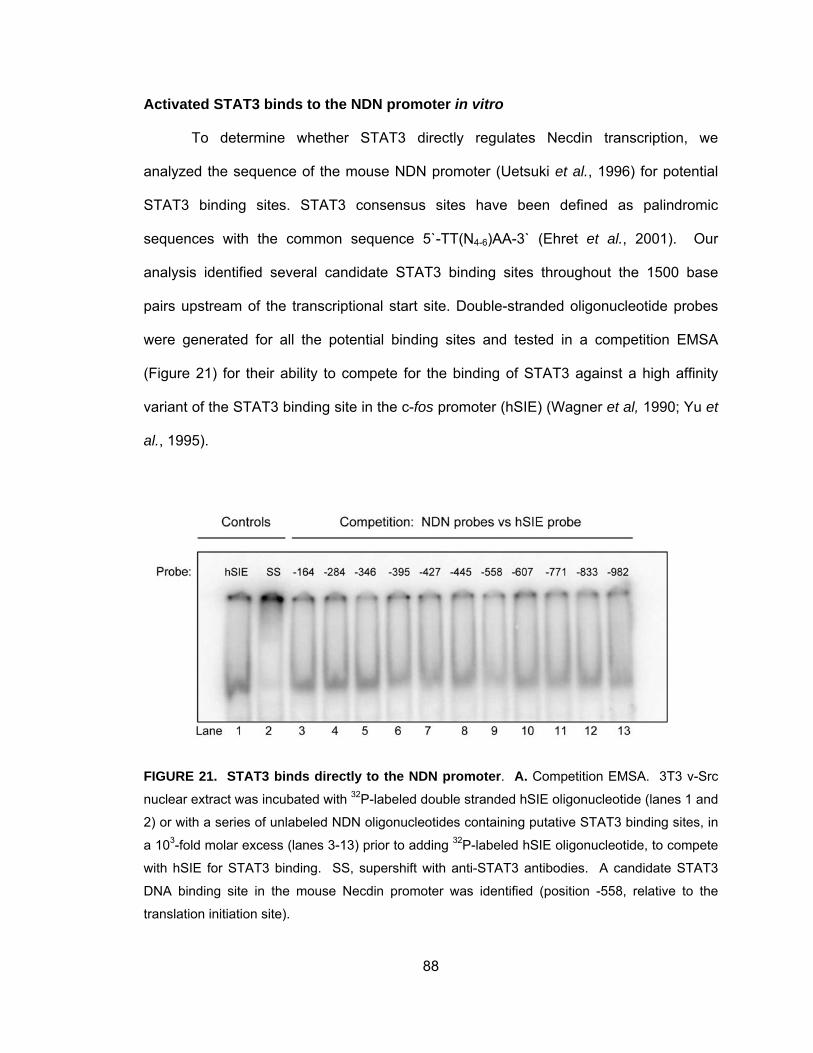
88
Activated STAT3 binds to the NDN promoter in vitro
To determine whether STAT3 directly regulates Necdin transcription, we
analyzed the sequence of the mouse NDN promoter (Uetsuki et al., 1996) for potential
STAT3 binding sites. STAT3 consensus sites have been defined as palindromic
sequences with the common sequence 5`-TT(N4-6)AA-3` (Ehret et al., 2001). Our
analysis identified several candidate STAT3 binding sites throughout the 1500 base
pairs upstream of the transcriptional start site. Double-stranded oligonucleotide probes
were generated for all the potential binding sites and tested in a competition EMSA
(Figure 21) for their ability to compete for the binding of STAT3 against a high affinity
variant of the STAT3 binding site in the c-fos promoter (hSIE) (Wagner et al, 1990; Yu et
al., 1995).
FIGURE 21. STAT3 binds directly to the NDN promoter. A. Competition EMSA. 3T3 v-Src
nuclear extract was incubated with 32P-labeled double stranded hSIE oligonucleotide (lanes 1 and
2) or with a series of unlabeled NDN oligonucleotides containing putative STAT3 binding sites, in
a 103-fold molar excess (lanes 3-13) prior to adding 32P-labeled hSIE oligonucleotide, to compete
with hSIE for STAT3 binding. SS, supershift with anti-STAT3 antibodies. A candidate STAT3
DNA binding site in the mouse Necdin promoter was identified (position -558, relative to the
translation initiation site).
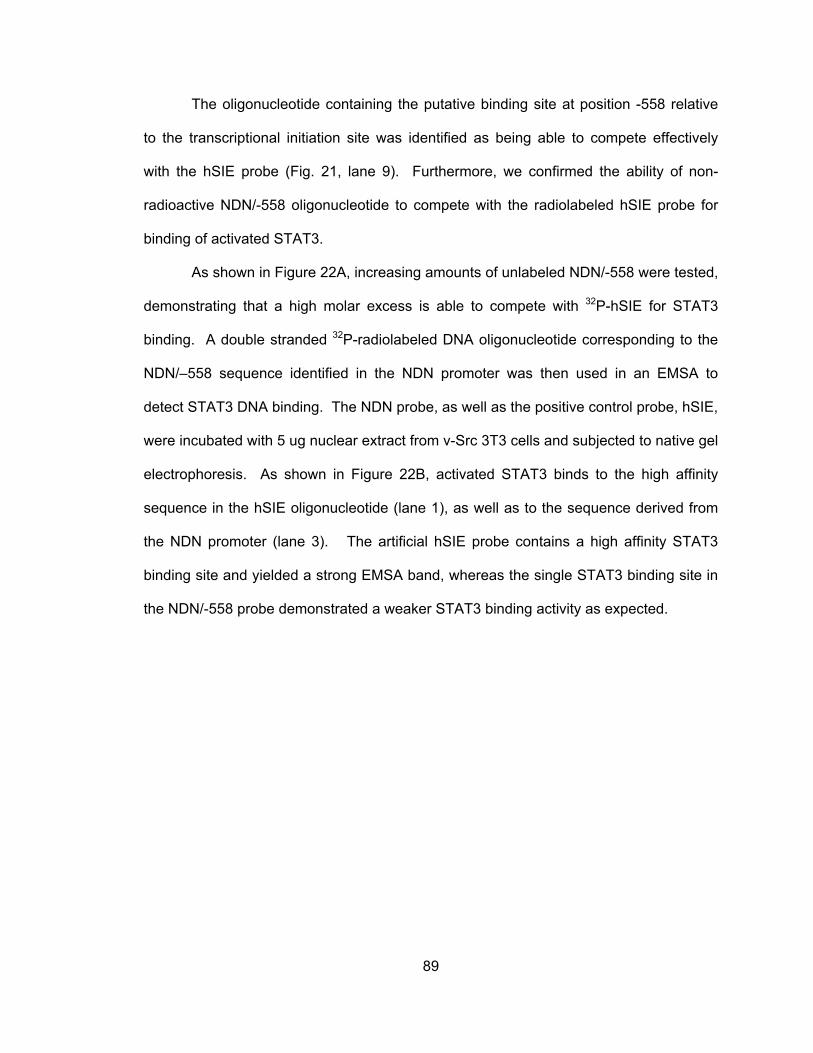
89
The oligonucleotide containing the putative binding site at position -558 relative
to the transcriptional initiation site was identified as being able to compete effectively
with the hSIE probe (Fig. 21, lane 9). Furthermore, we confirmed the ability of non-
radioactive NDN/-558 oligonucleotide to compete with the radiolabeled hSIE probe for
binding of activated STAT3.
As shown in Figure 22A, increasing amounts of unlabeled NDN/-558 were tested,
demonstrating that a high molar excess is able to compete with 32P-hSIE for STAT3
binding. A double stranded 32P-radiolabeled DNA oligonucleotide corresponding to the
NDN/–558 sequence identified in the NDN promoter was then used in an EMSA to
detect STAT3 DNA binding. The NDN probe, as well as the positive control probe, hSIE,
were incubated with 5 ug nuclear extract from v-Src 3T3 cells and subjected to native gel
electrophoresis. As shown in Figure 22B, activated STAT3 binds to the high affinity
sequence in the hSIE oligonucleotide (lane 1), as well as to the sequence derived from
the NDN promoter (lane 3). The artificial hSIE probe contains a high affinity STAT3
binding site and yielded a strong EMSA band, whereas the single STAT3 binding site in
the NDN/-558 probe demonstrated a weaker STAT3 binding activity as expected.
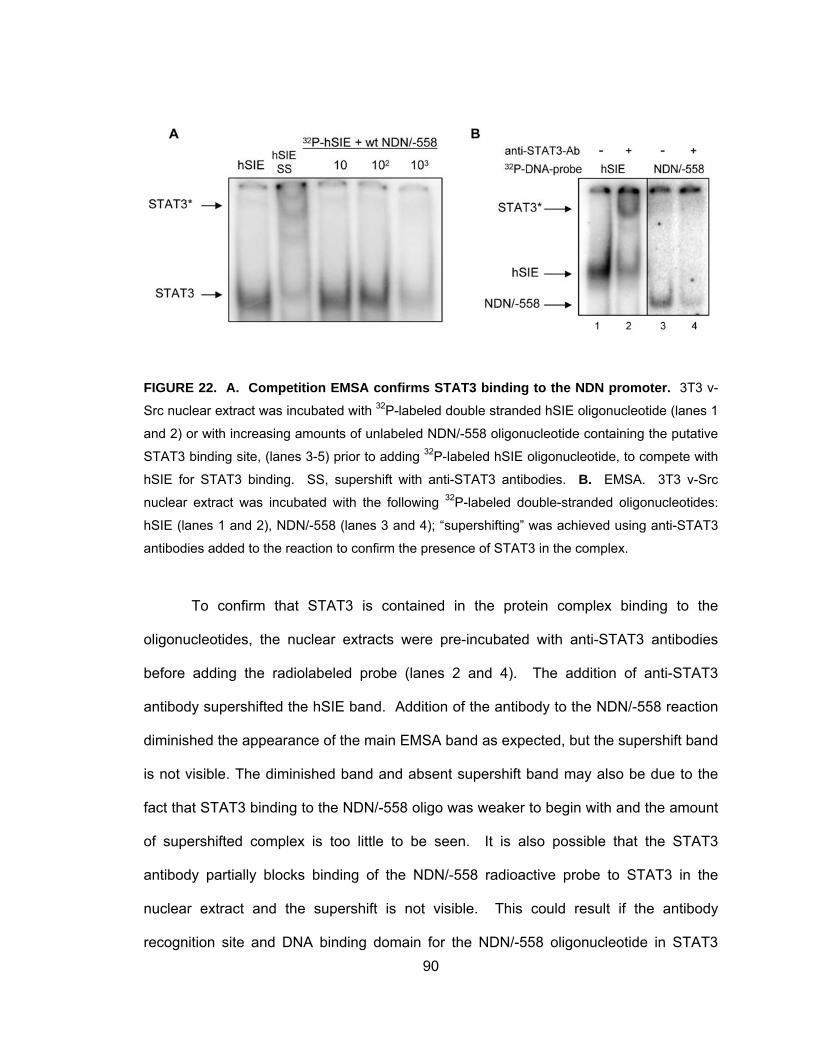
90
FIGURE 22. A. Competition EMSA confirms STAT3 binding to the NDN promoter. 3T3 v-
Src nuclear extract was incubated with 32P-labeled double stranded hSIE oligonucleotide (lanes 1
and 2) or with increasing amounts of unlabeled NDN/-558 oligonucleotide containing the putative
STAT3 binding site, (lanes 3-5) prior to adding 32P-labeled hSIE oligonucleotide, to compete with
hSIE for STAT3 binding. SS, supershift with anti-STAT3 antibodies. B. EMSA. 3T3 v-Src
nuclear extract was incubated with the following 32P-labeled double-stranded oligonucleotides:
hSIE (lanes 1 and 2), NDN/-558 (lanes 3 and 4); “supershifting” was achieved using anti-STAT3
antibodies added to the reaction to confirm the presence of STAT3 in the complex.
To confirm that STAT3 is contained in the protein complex binding to the
oligonucleotides, the nuclear extracts were pre-incubated with anti-STAT3 antibodies
before adding the radiolabeled probe (lanes 2 and 4). The addition of anti-STAT3
antibody supershifted the hSIE band. Addition of the antibody to the NDN/-558 reaction
diminished the appearance of the main EMSA band as expected, but the supershift band
is not visible. The diminished band and absent supershift band may also be due to the
fact that STAT3 binding to the NDN/-558 oligo was weaker to begin with and the amount
of supershifted complex is too little to be seen. It is also possible that the STAT3
antibody partially blocks binding of the NDN/-558 radioactive probe to STAT3 in the
nuclear extract and the supershift is not visible. This could result if the antibody
recognition site and DNA binding domain for the NDN/-558 oligonucleotide in STAT3
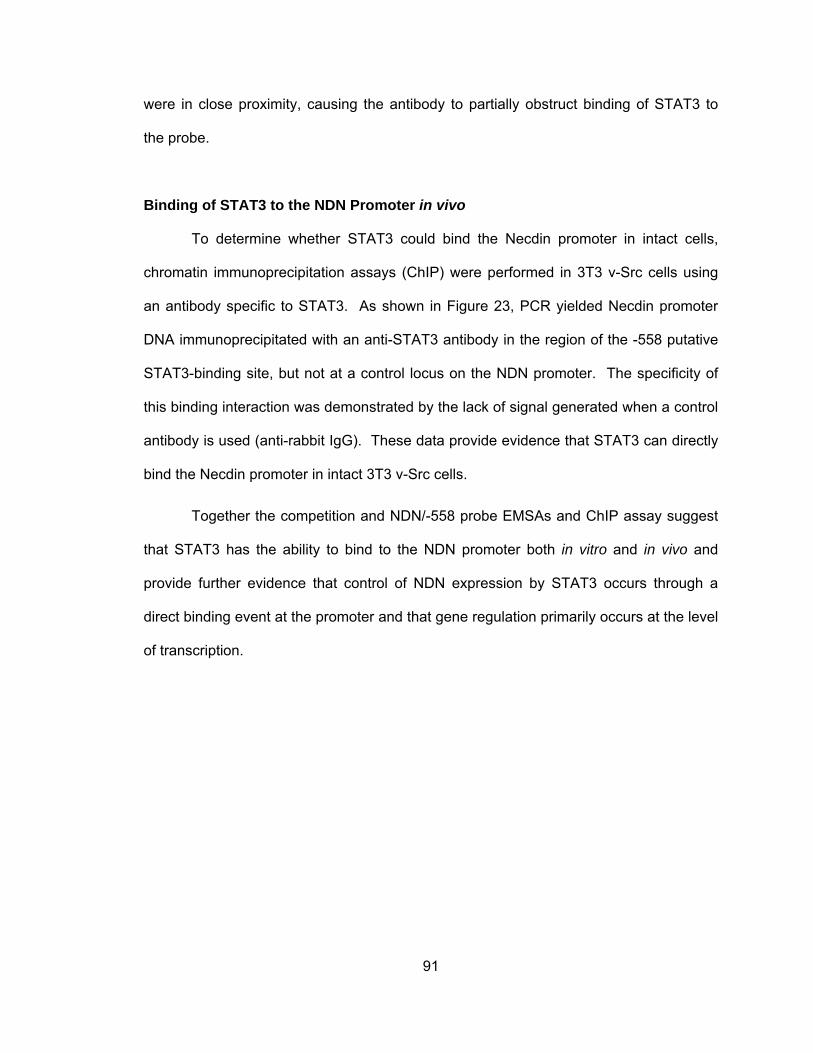
91
were in close proximity, causing the antibody to partially obstruct binding of STAT3 to
the probe.
Binding of STAT3 to the NDN Promoter in vivo
To determine whether STAT3 could bind the Necdin promoter in intact cells,
chromatin immunoprecipitation assays (ChIP) were performed in 3T3 v-Src cells using
an antibody specific to STAT3. As shown in Figure 23, PCR yielded Necdin promoter
DNA immunoprecipitated with an anti-STAT3 antibody in the region of the -558 putative
STAT3-binding site, but not at a control locus on the NDN promoter. The specificity of
this binding interaction was demonstrated by the lack of signal generated when a control
antibody is used (anti-rabbit IgG). These data provide evidence that STAT3 can directly
bind the Necdin promoter in intact 3T3 v-Src cells.
Together the competition and NDN/-558 probe EMSAs and ChIP assay suggest
that STAT3 has the ability to bind to the NDN promoter both in vitro and in vivo and
provide further evidence that control of NDN expression by STAT3 occurs through a
direct binding event at the promoter and that gene regulation primarily occurs at the level
of transcription.
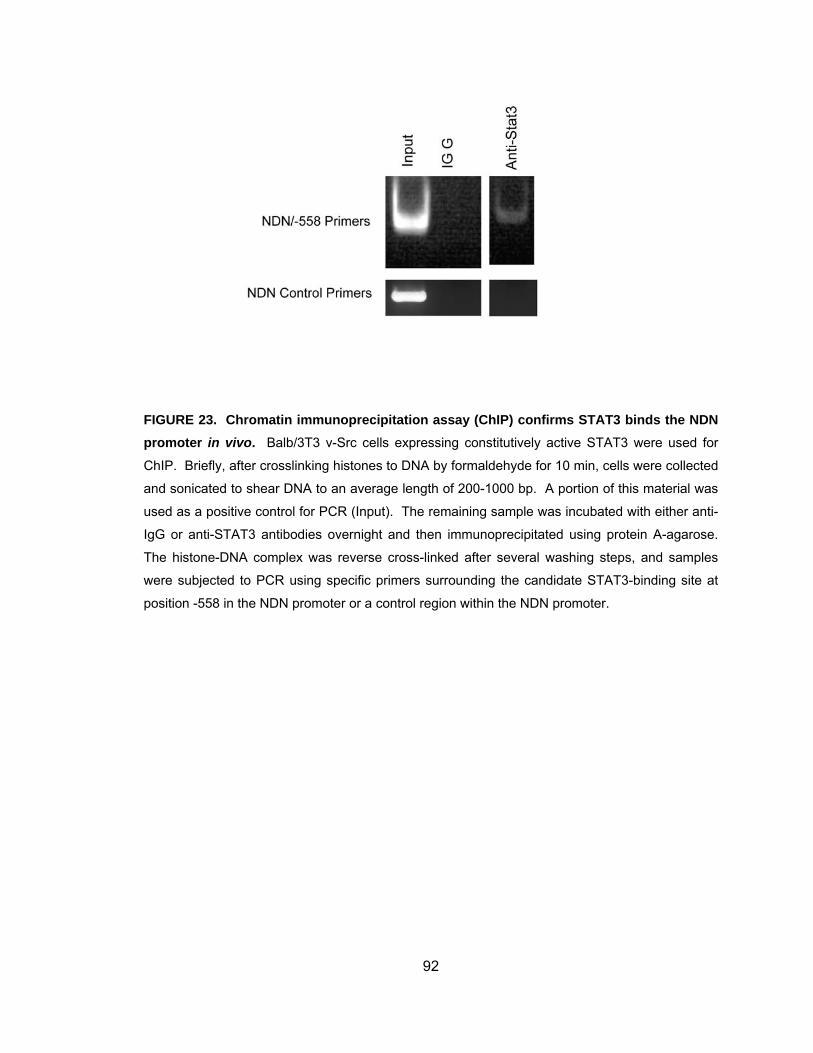
92
FIGURE 23. Chromatin immunoprecipitation assay (ChIP) confirms STAT3 binds the NDN promoter in vivo. Balb/3T3 v-Src cells expressing constitutively active STAT3 were used for
ChIP. Briefly, after crosslinking histones to DNA by formaldehyde for 10 min, cells were collected
and sonicated to shear DNA to an average length of 200-1000 bp. A portion of this material was
used as a positive control for PCR (Input). The remaining sample was incubated with either anti-
IgG or anti-STAT3 antibodies overnight and then immunoprecipitated using protein A-agarose.
The histone-DNA complex was reverse cross-linked after several washing steps, and samples
were subjected to PCR using specific primers surrounding the candidate STAT3-binding site at
position -558 in the NDN promoter or a control region within the NDN promoter.
93
Necdin Expression Is Repressed in Human Melanoma Cells
We next examined whether down-regulation of Necdin occurred in human tumor
cells expressing activated STAT3. Expression of Necdin has been previously shown to
be repressed in melanoma cells (Hoek et al., 2004) so we examined whether this had a
correlation with STAT3 activity.
STAT3 phosphorylation and DNA-binding activity have been shown to increase
in A375 melanoma cells in a density-dependent manner in the absence of ligand (Kreis
et al., 2007). A375 cells were plated at increasing density and allowed to grow for 72 h.
Nuclear extracts were prepared and analyzed by EMSA. Figure 24A shows that DNA-
binding of STAT3 increased with cell density as expected. We then analyzed total
protein by Western blot for Necdin expression. Figure 24B shows that expression of
total STAT3 and STAT3 phosphorylation was up-regulated in a density-dependent
manner. Conversely, as STAT3 activation increases, Necdin expression was down-
regulated at the protein level.
To confirm that the repression of Necdin expression is STAT3-dependent, A375
cells were plated at high density, and allowed to adhere overnight before being treated
with either DMSO or the STAT3-inhibitor CPA-7 (20 uMol/L) for 24 h (Turkson et al.,
2004). Western blot analysis shows that when A375 cells are plated at low density (105
cells), Necdin expression was high, whereas activated STAT3 levels were low (Fig. 25,
lane 1). Cells plated at high density (106 cells), (Fig. 25, lane 3) showed higher levels of
p-STAT3 and decreased expression of Necdin. Treatment of high density A375 cells
with CPA-7 for 24 h inhibited STAT3 activation (Fig. 25, lane 2), and Necdin levels in
these cells were restored to high levels, comparable to cells plated at low density. This
demonstrates that Necdin repression in these cells is indeed STAT3 dependent.
94
FIGURE 24. STAT3 downregulates Necdin expression in A375 human melanoma cells. A375 cells were plated at different densities (Fig. 3A and 3B: 1, 2.5, 5 or 7.5 x 10⁵ cells; Fig. 3C:
105 and 106 cells) in 10 cm plates and grown for 72 h. Nuclear extracts and total protein were
collected. A. EMSA. Nuclear extracts from A375 cells were incubated with STAT-specific hSIE 32P-labeled double stranded oligonucleotide. B. Western blot. Total protein extracts were
harvested from A375 cells plated at different densities and equal amounts of total protein (100�g)
were loaded on a 10% SDS-polyacrylamide gel, electrophoresed and immunoblotted for Necdin,
phosphorylated STAT3 (p-STAT3) and total STAT3 proteins.
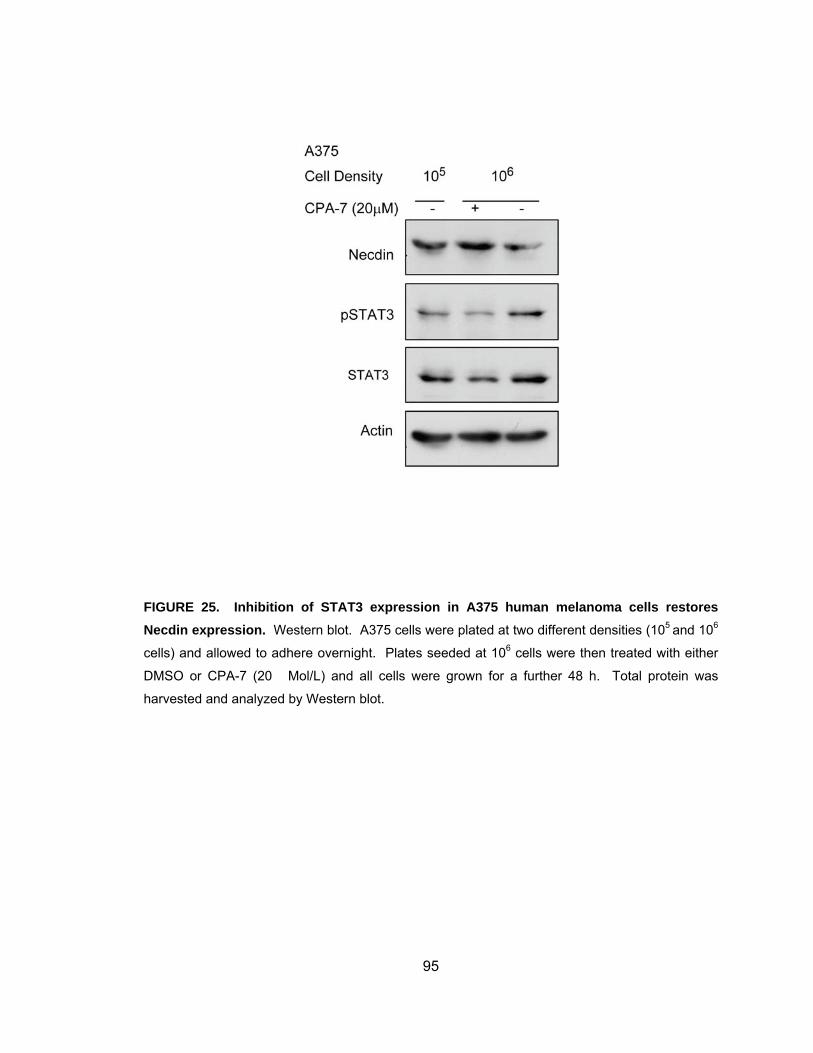
95
FIGURE 25. Inhibition of STAT3 expression in A375 human melanoma cells restores Necdin expression. Western blot. A375 cells were plated at two different densities (105 and 106
cells) and allowed to adhere overnight. Plates seeded at 106 cells were then treated with either
DMSO or CPA-7 (20 �Mol/L) and all cells were grown for a further 48 h. Total protein was
harvested and analyzed by Western blot.
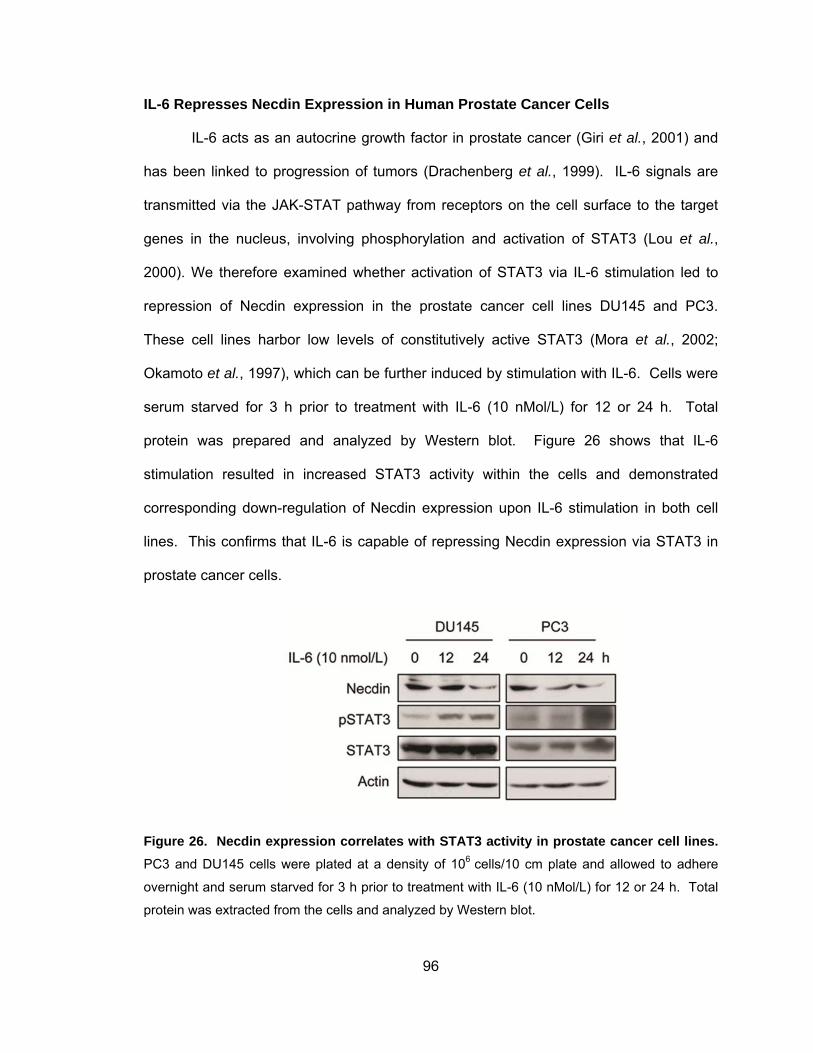
96
IL-6 Represses Necdin Expression in Human Prostate Cancer Cells
IL-6 acts as an autocrine growth factor in prostate cancer (Giri et al., 2001) and
has been linked to progression of tumors (Drachenberg et al., 1999). IL-6 signals are
transmitted via the JAK-STAT pathway from receptors on the cell surface to the target
genes in the nucleus, involving phosphorylation and activation of STAT3 (Lou et al.,
2000). We therefore examined whether activation of STAT3 via IL-6 stimulation led to
repression of Necdin expression in the prostate cancer cell lines DU145 and PC3.
These cell lines harbor low levels of constitutively active STAT3 (Mora et al., 2002;
Okamoto et al., 1997), which can be further induced by stimulation with IL-6. Cells were
serum starved for 3 h prior to treatment with IL-6 (10 nMol/L) for 12 or 24 h. Total
protein was prepared and analyzed by Western blot. Figure 26 shows that IL-6
stimulation resulted in increased STAT3 activity within the cells and demonstrated
corresponding down-regulation of Necdin expression upon IL-6 stimulation in both cell
lines. This confirms that IL-6 is capable of repressing Necdin expression via STAT3 in
prostate cancer cells.
Figure 26. Necdin expression correlates with STAT3 activity in prostate cancer cell lines. PC3 and DU145 cells were plated at a density of 106 cells/10 cm plate and allowed to adhere
overnight and serum starved for 3 h prior to treatment with IL-6 (10 nMol/L) for 12 or 24 h. Total
protein was extracted from the cells and analyzed by Western blot.
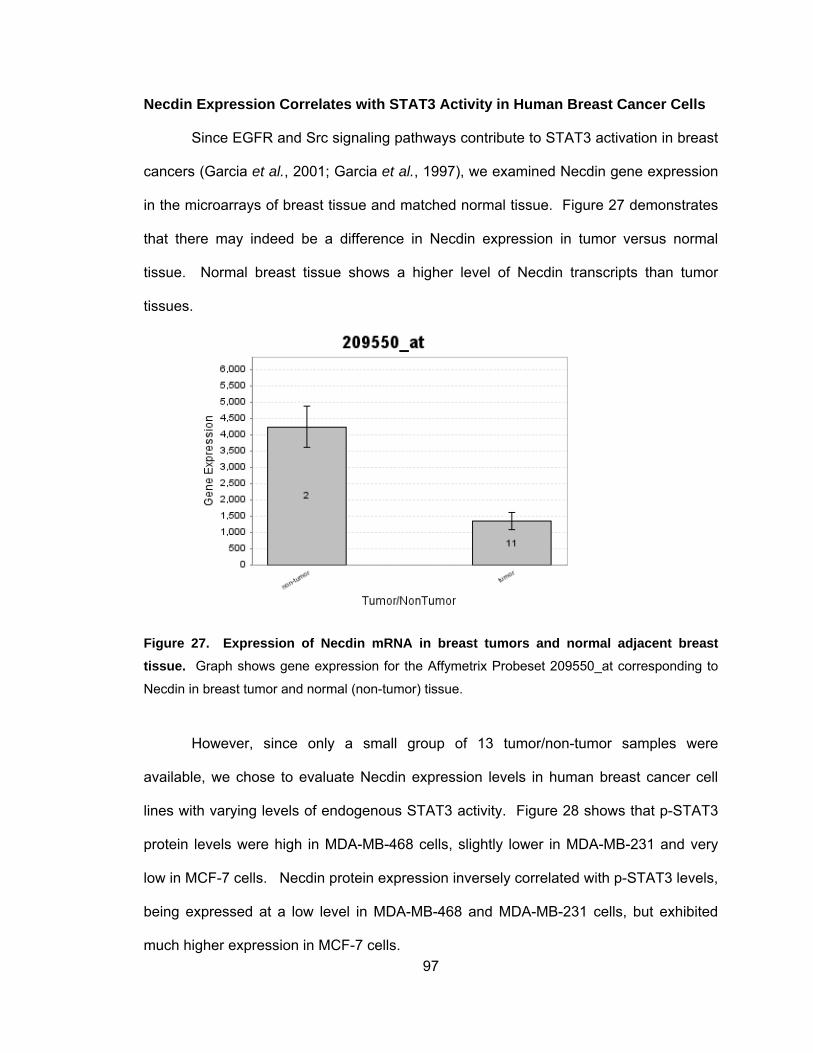
97
Necdin Expression Correlates with STAT3 Activity in Human Breast Cancer Cells
Since EGFR and Src signaling pathways contribute to STAT3 activation in breast
cancers (Garcia et al., 2001; Garcia et al., 1997), we examined Necdin gene expression
in the microarrays of breast tissue and matched normal tissue. Figure 27 demonstrates
that there may indeed be a difference in Necdin expression in tumor versus normal
tissue. Normal breast tissue shows a higher level of Necdin transcripts than tumor
tissues.
Figure 27. Expression of Necdin mRNA in breast tumors and normal adjacent breast tissue. Graph shows gene expression for the Affymetrix Probeset 209550_at corresponding to
Necdin in breast tumor and normal (non-tumor) tissue.
However, since only a small group of 13 tumor/non-tumor samples were
available, we chose to evaluate Necdin expression levels in human breast cancer cell
lines with varying levels of endogenous STAT3 activity. Figure 28 shows that p-STAT3
protein levels were high in MDA-MB-468 cells, slightly lower in MDA-MB-231 and very
low in MCF-7 cells. Necdin protein expression inversely correlated with p-STAT3 levels,
being expressed at a low level in MDA-MB-468 and MDA-MB-231 cells, but exhibited
much higher expression in MCF-7 cells.
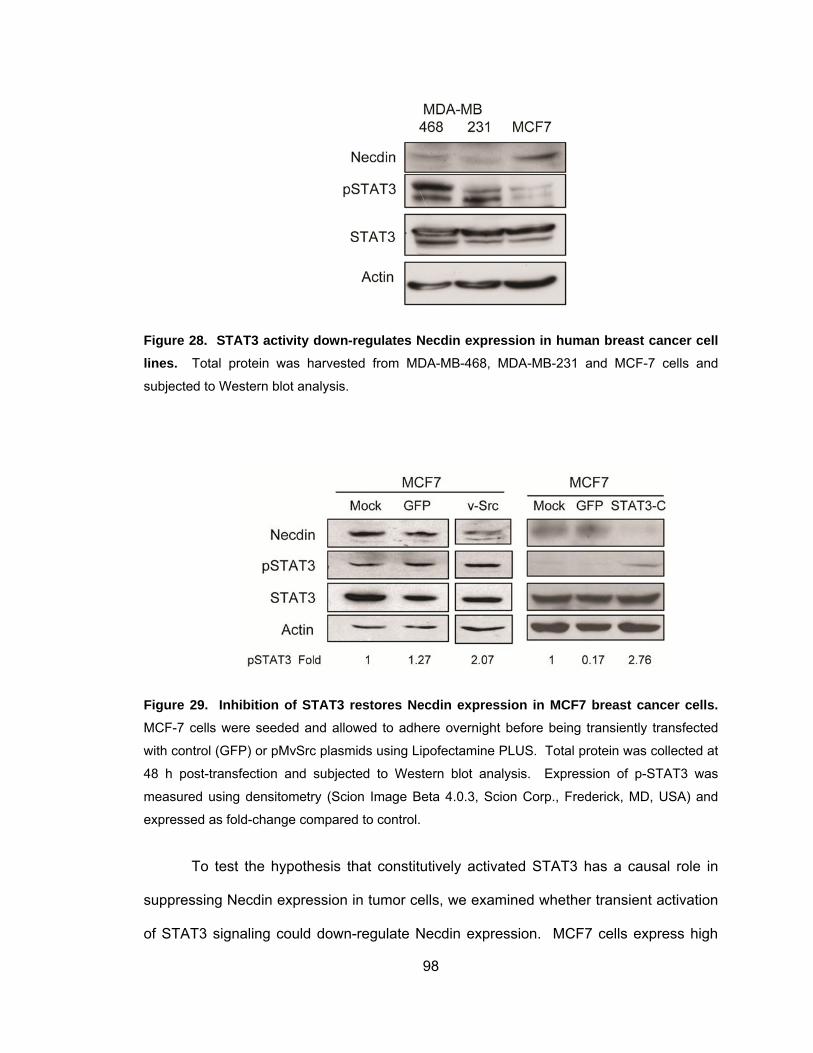
98
Figure 28. STAT3 activity down-regulates Necdin expression in human breast cancer cell lines. Total protein was harvested from MDA-MB-468, MDA-MB-231 and MCF-7 cells and
subjected to Western blot analysis.
Figure 29. Inhibition of STAT3 restores Necdin expression in MCF7 breast cancer cells. MCF-7 cells were seeded and allowed to adhere overnight before being transiently transfected
with control (GFP) or pMvSrc plasmids using Lipofectamine PLUS. Total protein was collected at
48 h post-transfection and subjected to Western blot analysis. Expression of p-STAT3 was
measured using densitometry (Scion Image Beta 4.0.3, Scion Corp., Frederick, MD, USA) and
expressed as fold-change compared to control.
To test the hypothesis that constitutively activated STAT3 has a causal role in
suppressing Necdin expression in tumor cells, we examined whether transient activation
of STAT3 signaling could down-regulate Necdin expression. MCF7 cells express high
99
levels of Necdin (Figure 29, lanes 1 and 4), however when transiently transfected with v-
Src for 48 h, Necdin protein expression is inhibited. This demonstrates that even a
transient 2-fold increase in STAT3 activation in these cells is sufficient to effectively
repress the expression of Necdin (Figure 29, lanes 3 and 6).
Summary
In this study, we show that Necdin mRNA expression inversely correlates with
STAT3 activity in cells expressing constitutively-active STAT3. Inhibition of STAT3 using
siRNA restores expression of Necdin protein. Chromatin immunoprecipitation and
EMSA assays indicate that the Necdin gene is directly regulated by the STAT3 protein.
In addition, Necdin expression in human tumour cell lines is correlated with activation of
endogenous STAT3.
Recently a paper published by Chapman and Knowles (Chapman and Knowles,
2009) stated that down-regulation of Necdin occurs in both carcinoma cell lines and
primary tumors, suggesting that Necdin has a tumor suppressor role. Our results are
similar to the data reviewed in this paper and also demonstrate that Necdin is a
physiological target of STAT3 and indicate that Necdin is a candidate for further study in
this role. Our findings provide evidence for a role of Necdin in STAT3-dependent
oncogenesis, suggesting that repression of Necdin expression may be a mechanism by
which tumour cells gain a growth advantage in response to STAT3 activation.
100
CHAPTER 4: DISCUSSION The Role of STAT3 in Oncogenesis
The mechanisms that activate STAT3 in human tumors may differ, but in all
cases cells with constitutively active STAT3 exhibit dysregulated cell cycle progression
and/or apoptosis. In this study, our hypothesis was that aberrant STAT3 activity, as
present in many human tumors, is predicted to cause permanent alterations in the global
gene expression patterns, including dysregulated expression of genes involved in cell
cycle progression and proliferation, survival, apoptosis and angiogenesis, thereby
contributing to oncogenesis. A handful of STAT3-regulated genes have been identified
to date, however, we predicted that there are other STAT3-regulated genes that play a
role in malignant transformation and oncogenesis that, as yet, remained unidentified.
To identify potential novel STAT3-regulated genes, we examined global gene
expression patterns in cell lines harboring active STAT3. Our initial experiments used
IL-6 to stimulate STAT3 activation in a time-dependent manner in mouse fibroblasts.
Since active STAT3 induces a signal transduction cascade, including the expression of
multiple downstream transcription factors and their own target genes, we chose to
analyze gene expression at an early time point (one hour) after stimulation with IL-6, in
the presence or absence of cycloheximide. This allowed us to study the gene(s) which
were directly activated by STAT3 and not by a downstream signaling cascade initiated
by STAT3. We were able to SOCS3, CEBPD and prolactin genes as a direct STAT3
target gene, induced by IL-6 at this time point. However, these experiments gave us
limited results, demonstrating that at one hour post IL-6 stimulation, in the absence of
translation, STAT3 has few direct targets.
101
Inducing STAT3 activity transiently using exogenous stimulation, such as IL-6 or
transient transfection (Paz et al., 2004) is likely to result in induction of some, but not all,
STAT3 target genes and which genes are expressed may be influenced by the
conditions in which the cells are maintained. However, gene expression profiles in cells
with constitutively active STAT3 are more likely to be representative of the genetic profile
of a cancer cell with aberrant STAT3 expression. Further microarray studies were
therefore carried out using cells which stably expressed either v-Src or the constitutively
active mutant, STAT3-C. Constitutive expression of active STAT3 in these cells is
predicted to result in stable gene expression and global changes in gene expression
profiles, many of which are likely to play a role in oncogenesis.
Our experiments also took into consideration the fact that clonal variation is likely
to exist between cells of the same cell type where STAT3 is induced by different
mechanisms. For this reason, we studied gene expression in a mouse fibroblast cell line
stably transfected with v-Src and compared the results to genes expressed in cells
stably expressing the constitutively active mutant, STAT3-C. While v-Src transformed
cells have constitutively active STAT3, v-Src also stimulates other STAT3-independent
pathways (Brunton and Frame, 2008; Frame, 2002; Frame, 2004; Odajima et al., 2000).
In contrast, target genes activated by STAT3-C are limited to direct binding of the
activated protein to STAT3 consensus sites in DNA. Therefore, using cells stably
transfected with either v-Src or STAT3-C allowed us to control for clonal variations, as
well as divergence in signaling pathways depending on the mechanism of STAT3
activation. Genes identified as regulated by STAT3 but not in common between the two
cell lines are likely to be due to clonal variation. However, the subset of genes that are
regulated in common in both cell lines are likely to represent true global STAT3 targets.
102
Identifying Novel STAT3 Regulated Genes
The transcriptional profile of a cell expressing constitutively active STAT3 is
predicted to be very different compared to a cell where STAT3 is under tight regulation.
Our initial hypothesis was that STAT3 promotes widespread changes in global gene
expression patterns, including both direct and indirect targets. We took a broad
approach by studying global gene expression changes using microarray analysis in
fibroblast cells expressing constitutively-activated STAT3. With this approach we were
able to identify differential expression of several previously identified STAT3 target
genes, with a wide range of biological functions and roles in multiple cellular pathways,
including genes involved in cell cycle progression and proliferation, survival, apoptosis
and angiogenesis, thereby contributing to oncogenesis.
The use of multiple microarray replicates in our approach further increases
confidence in the results. This allowed us to identify a set of common genes as targets
of STAT3. The data were further validated by the identification of several previously
characterized STAT3-regulated genes, including CCND1, p21 (Sinibaldi et al., 2000),
VEGFA (Niu et al., 2002), and Mcl-1 (Puthier et al., 1999).
In the cells used for the microarray experiments, where STAT3 is constitutively
active and mRNA transcription has reached equilibrium, some mRNA species
transcribed will be direct targets of STAT3 and some will be indirect targets. Direct
targets are those where STAT3 itself binds directly to the gene promoter to induce
transcription, perhaps in cooperation with other co-activator proteins. Indirect targets of
STAT3 are transcribed via binding of a secondary transcription factor. In this case, the
secondary transcription factor is directly regulated by STAT3. STAT3 has been shown
to regulate the expression of other transcription factors, as well as itself, and is thus
capable of generating a cascade of gene activation both directly and indirectly. Since
microarray technology is based on the interpretation of mRNA levels in control compared
103
to treated cells, we are unable to distinguish direct versus indirect targets of STAT3 gene
transcription from the data obtained. Further analysis of the differentially expressed
genes is required to further validate whether or not the expression of the genes is
directly regulated by STAT3.
Pathway and Functional Analysis of STAT3 Regulated Genes
Microarrays assess simultaneous changes in transcript levels on an individual
basis, resulting in a long list of genes which have significantly changed transcript levels
when compared to control cells. However, these changes in gene expression do not
occur as independent events within the cell, but are controlled in a coordinated manner
and are often interconnected. Pathway Analysis is an unbiased method to determine
whether differentially expressed genes, and the proteins they encode, are enriched in
particular pathways, giving insight into the biological meaning of the changes observed.
We predicted that STAT3 controls genes involved in cell cycle progression and
proliferation, survival, apoptosis and angiogenesis, some of which had not been
identified before, however, we also predicted that STAT3 would have an effect on other
signaling pathways which are critical to oncogenesis, progression and metastasis.
Using pathway and functional analysis of the differentially expressed genes
identified in our experiments, we were able to identify known STAT3 pathways, including
the JAK/STAT pathway and Angiotensin/STAT pathway. This provides support for the
use of such analyses to identify novel pathways that may also be regulated by STAT3.
The Pathway Analysis and Functional Annotation indicate STAT3 regulation of
genes in cell growth and metabolism, including nucleotide, lipid and protein metabolism,
as well as protein transport and localization. This analysis also points to a strong link
between STAT3 and regulation of genes involved in cell adhesion and cytoskeletal
remodeling. These results suggest that STAT3 has a wider impact on cellular processes
104
than demonstrated to date and that STAT3 also acts as a central coordinator of its own
cellular signaling pathways. In particular, not only does STAT3 promote gene
transcription, it may also have a role in production of the appropriate proteins for
transcription to take place and ensure that they are localized correctly within the cell.
Combining this approach with computational analysis of the microarray results,
we were able to define the gene expression profile of cells expressing activated STAT3
and examine the role of STAT3 in both positive and negative regulation of gene
expression.
Pathway and functional analysis demonstrate that STAT3 has an important role
in regulating, both positively and negatively, a diverse array of cellular processes in
addition to transcription. STAT3 coordinates expression of genes involved in multiple
metabolic and biosynthetic pathways, integrating signals that lead to global
transcriptional changes and oncogenesis. These include genes involved in cell
adhesion, cytoskeletal remodeling, nucleotide, lipid and protein metabolism, as well as
signal transduction.
Constitutive activation of STAT3 provides cancer cells with growth and survival
advantages by activating multiple pathways within the cell, involving a broad range of
genes. It has also been shown to repress the transcription of a handful of genes,
including p53 (Niu et al., 2005) and nitric oxide synthase (Saura et al., 2006). Few other
genes have been identified to date that are negatively regulated by STAT3. However,
computational analysis of our data, suggest that STAT3 is capable of repressing
expression of a much larger number of genes. This novel discovery indicates that these
pathways collaborate to profoundly impact the biology of cells and produce the
proliferative advantage seen in cells harboring constitutively active STAT3.
In summary, STAT3 has been shown to up-regulate expression of multiple genes
involved in cell growth and metabolism, as well as protein transport, localization, cell
105
adhesion and cytoskeletal remodeling. This study also suggests that STAT3 may exert
its oncogenic effect not only by directly or indirectly up-regulating transcription of genes
involved in promoting growth and proliferation, but also by down-regulating expression of
negative regulators of the same cellular processes.
Necdin, a Novel STAT3 Target Gene
From the microarray data, we identified Necdin as a novel STAT3-regulated gene
whose expression is repressed when STAT3 is constitutively activated. Our studies
indicate that constitutively active STAT3 may directly cause down-regulation of Necdin at
the transcriptional level. We also demonstrated that Necdin expression is repressed in
several tumor cell types, including melanoma, prostate and breast cancer cell lines, and
is inversely correlated with STAT3 activity. This suggests that Necdin is a physiological
target gene of STAT3.
The mechanism by which STAT3 represses Necdin expression remains to be
elucidated. STAT3 has previously been shown to form a complex with DNA
methyltransferase 1 and histone deacetylase 1 to mediate epigenetic silencing of the
tyrosine phosphatase, SHP-1 (Zhang et al., 2005) indicating that this is a possible
mechanism by which STAT3 could downregulate Necdin expression. Exploration of the
potential epigenetic silencing of Necdin would further knowledge regarding STAT3
repression of gene expression.
A recent study published by Chapman and Knowles (Chapman and Knowles,
2009) stated that down-regulation of Necdin occurs in both carcinoma cell lines and
primary tumors. Our results are similar to the data reviewed in this paper and indicate
that Necdin is a candidate for further study in this role and could represent a novel
cancer therapeutic target. Repression of Necdin expression by STAT3 may play an
important role in regulating the cell cycle and proliferation in human cancer cells, which
106
has the potential to give tumor cells a growth advantage. Necdin is a negative growth
regulator, capable of interacting with E2F1, resulting in inhibition of E2F1 target gene
expression and consequent growth inhibitory effects (Taniura et al., 1998). Two reports
have previously demonstrated that Necdin expression is down-regulated in melanoma
(Hoek et al., 2004) and a drug-resistant ovarian cancer cell line (Varma et al., 2005).
Thus far, no role for Necdin in oncogenesis has been confirmed; but, our results suggest
that repression of Necdin expression by STAT3 may be one mechanism which could
potentially contribute to a growth advantage of tumor cells and is of interest for further
analysis. The repression of Necdin observed in cell lines need to be confirmed in human
tumors compared to normal tissues, for example via microarray, Real Time PCR and
immunohistochemistry, and the effect of Necdin silencing examined with regard to cell
cycle and proliferation to identify any possible growth advantage that it may provide.
The reversal of such gene repression represents a target for novel anticancer therapies.
107
CHAPTER 5: CLINICAL SIGNIFICANCE
Our initial hypothesis was that constitutive activation of STAT3 within cells leads
to permanent changes in global gene expression patterns that play a role in the
development of a malignant phenotype. We predicted that STAT3 promotes widespread
changes in gene expression, including both direct and indirect targets, involving multiple
signaling pathways and involving a broad range of genes affecting cell cycle
progression, cellular proliferation and survival, angiogenesis and apoptosis. Having
identified a set of differentially expressed genes in cell lines expressing constitutively
active STAT3, it would be of clinical relevance to use the data to determine a STAT3
molecular signature in human tumors.
A molecular signature is defined as a group of STAT3 regulated genes that are
co-expressed simultaneously. Cell lines do not accurately represent the physiology and
biology of human tumors, lacking the microenvironment and interactions found in vivo.
Analysis of untreated tumor samples by microarray and comparison of the differential
gene expression between normal and tumor tissue would allow for validation of the
expression of the cell line signature in primary human tumors. The molecular signature
may vary by tissue type, thus may show differences between breast cancer and prostate
cancer, however, there may also be a subset of genes which define a general STAT3
molecular signature in human cancer. Given the biological and physiological effects of
STAT3 target genes, such a signature may predict response to chemotherapy and
prognosis in cancer patients.
Transcription factors involved in oncogenesis are chief targets for cancer
therapy, especially since multiple signaling pathways converge on signaling molecules
108
such as STAT3 (Turkson and Jove, 2000). STAT3 gene ablation results in inhibited
tumor growth in various tumor models, therefore targeting a drug to inhibit STAT3 is
under active pursuit. The use of pharmacological agents to inhibit STAT3 activity may
lead to a rebalancing of the signaling pathways regulating cell growth and lead to
inhibition of tumor progression (Buettner et al., 2002; Darnell, 2002; Turkson, 2004;
Turkson and Jove, 2000; Yu and Jove, 2004). Whilst targeting STAT3 is not easy, due
to a lack of enzyme activity, various approaches are producing results, including
disrupting dimer formation via the SH2 interaction (Turkson et al., 2001), blocking
protein-DNA binding or platinum-based drugs (Turkson et al., 2004).
Computational analysis of global changes in gene expression regulated by
STAT3 gives further insight into the mechanisms by which STAT3 contributes to
oncogenesis. Such gene expression profiles, controlled by STAT3, may be useful in
identifying potential targets for drug treatment, as well as in tailoring cancer treatment to
the patient by use of gene expression analysis of tumors. In this study we identified
Necdin as a novel STAT3 regulated gene. Necdin is a negative growth regulator shown
to be silenced in several tumor types. Whilst the mechanism of silencing has not yet
been elucidated, reactivation of NDN expression also represents a novel therapeutic
target.
109
REFERENCES
Aaronson DS, Horvath CM (2002). A road map for those who don't know JAK-STAT. Science 296: 1653-5. Aggarwal BB, Kunnumakkara AB, Harikumar KB, Gupta SR, Tharakan ST, Koca C et al (2009). Signal transducer and activator of transcription-3, inflammation, and cancer: how intimate is the relationship? Ann N Y Acad Sci 1171: 59-76. Aizawa T, Maruyama K, Kondo H, Yoshikawa K (1992). Expression of necdin, an embryonal carcinoma-derived nuclear protein, in developing mouse brain. Brain Res Dev Brain Res 68: 265-74. Akira S (1997). IL-6-regulated transcription factors. Int J Biochem Cell Biol 29: 1401-18. Akira S (1999). Functional roles of STAT family proteins: lessons from knockout mice. Stem Cells 17: 138-46. Alvarez JV, Febbo PG, Ramaswamy S, Loda M, Richardson A, Frank DA (2005). Identification of a genetic signature of activated signal transducer and activator of transcription 3 in human tumors. Cancer Res 65: 5054-62. Azam M, Lee C, Strehlow I, Schindler C (1997). Functionally distinct isoforms of STAT5 are generated by protein processing. Immunity 6: 691-701. Barker PA, Salehi A (2002). The MAGE proteins: emerging roles in cell cycle progression, apoptosis, and neurogenetic disease. J Neurosci Res 67: 705-12. Bhattacharya S, Schindler C (2003). Regulation of Stat3 nuclear export. J Clin Invest 111: 553-9. Bjorbaek C, El-Haschimi K, Frantz JD, Flier JS (1999). The role of SOCS-3 in leptin signaling and leptin resistance. J Biol Chem 274: 30059-65. Bowman T, Broome MA, Sinibaldi D, Wharton W, Pledger WJ, Sedivy JM et al (2001). Stat3-mediated Myc expression is required for Src transformation and PDGF-induced mitogenesis. Proc Natl Acad Sci U S A 98: 7319-24. Bowman T, Garcia R, Turkson J, Jove R (2000). STATs in oncogenesis. Oncogene 19: 2474-88. Bromberg J, Darnell JE, Jr. (2000). The role of STATs in transcriptional control and their impact on cellular function. Oncogene 19: 2468-73.
110
Bromberg JF, Horvath CM, Besser D, Lathem WW, Darnell JE, Jr. (1998). Stat3 activation is required for cellular transformation by v-src. Mol Cell Biol 18: 2553-8. Bromberg JF, Wrzeszczynska MH, Devgan G, Zhao Y, Pestell RG, Albanese C et al (1999). Stat3 as an oncogene. Cell 98: 295-303. Brunton VG, Frame MC (2008). Src and focal adhesion kinase as therapeutic targets in cancer. Curr Opin Pharmacol 8: 427-32. Buettner M, Meyer B, Schreck S, Niedobitek G (2007). Expression of RANTES and MCP-1 in epithelial cells is regulated via LMP1 and CD40. Int J Cancer 121: 2703-10. Buettner R, Mora LB, Jove R (2002). Activated STAT signaling in human tumors provides novel molecular targets for therapeutic intervention. Clin Cancer Res 8: 945-54. Bush JR, Wevrick R (2008). The Prader-Willi syndrome protein necdin interacts with the E1A-like inhibitor of differentiation EID-1 and promotes myoblast differentiation. Differentiation 76: 994-1005. Caldenhoven E, van Dijk TB, Solari R, Armstrong J, Raaijmakers JA, Lammers JW et al (1996). STAT3beta, a splice variant of transcription factor STAT3, is a dominant negative regulator of transcription. J Biol Chem 271: 13221-7. Cao X, Tay A, Guy GR, Tan YH (1996). Activation and association of Stat3 with Src in v-Src-transformed cell lines. Mol Cell Biol 16: 1595-603. Catlett-Falcone R, Landowski TH, Oshiro MM, Turkson J, Levitzki A, Savino R et al (1999). Constitutive activation of Stat3 signaling confers resistance to apoptosis in human U266 myeloma cells. Immunity 10: 105-15. Chakraborty A, White SM, Schaefer TS, Ball ED, Dyer KF, Tweardy DJ (1996). Granulocyte colony-stimulating factor activation of Stat3 alpha and Stat3 beta in immature normal and leukemic human myeloid cells. Blood 88: 2442-9. Chapman EJ, Knowles MA (2009). Necdin: a multi functional protein with potential tumor suppressor role? Mol Carcinog 48: 975-81. Chomez P, De Backer O, Bertrand M, De Plaen E, Boon T, Lucas S (2001). An overview of the MAGE gene family with the identification of all human members of the family. Cancer Res 61: 5544-51. Chung CD, Liao J, Liu B, Rao X, Jay P, Berta P et al (1997a). Specific inhibition of Stat3 signal transduction by PIAS3. Science 278: 1803-5. Chung J, Uchida E, Grammer TC, Blenis J (1997b). STAT3 serine phosphorylation by ERK-dependent and -independent pathways negatively modulates its tyrosine phosphorylation. Mol Cell Biol 17: 6508-16. Cohney SJ, Sanden D, Cacalano NA, Yoshimura A, Mui A, Migone TS et al (1999). SOCS-3 is tyrosine phosphorylated in response to interleukin-2 and suppresses STAT5 phosphorylation and lymphocyte proliferation. Mol Cell Biol 19: 4980-8.
111
Collum RG, Brutsaert S, Lee G, Schindler C (2000). A Stat3-interacting protein (StIP1) regulates cytokine signal transduction. Proc Natl Acad Sci U S A 97: 10120-5. Danial NN, Pernis A, Rothman PB (1995). Jak-STAT signaling induced by the v-abl oncogene. Science 269: 1875-7. Darnell JE, Jr. (1996). The JAK-STAT pathway: summary of initial studies and recent advances. Recent Prog Horm Res 51: 391-403; discussion 403-4. Darnell JE, Jr. (1997). STATs and gene regulation. Science 277: 1630-5. Darnell JE, Jr. (2002). Transcription factors as targets for cancer therapy. Nat Rev Cancer 2: 740-9. Darnell JE, Jr., Kerr IM, Stark GR (1994). Jak-STAT pathways and transcriptional activation in response to IFNs and other extracellular signaling proteins. Science 264: 1415-21. Darnowski JW, Goulette FA, Guan YJ, Chatterjee D, Yang ZF, Cousens LP et al (2006). Stat3 cleavage by caspases: impact on full-length Stat3 expression, fragment formation, and transcriptional activity. J Biol Chem 281: 17707-17. Dauer DJ, Ferraro B, Song L, Yu B, Mora L, Buettner R et al (2005). Stat3 regulates genes common to both wound healing and cancer. Oncogene 24: 3397-408. David M, Petricoin E, 3rd, Benjamin C, Pine R, Weber MJ, Larner AC (1995). Requirement for MAP kinase (ERK2) activity in interferon alpha- and interferon beta-stimulated gene expression through STAT proteins. Science 269: 1721-3. de Koning JP, Ward AC, Caldenhoven E, de Groot RP, Lowenberg B, Touw IP (2000). STAT3beta does not interfere with granulocyte colony-stimulating factor-induced neutrophilic differentiation. Hematol J 1: 220-5. Decker T, Kovarik P (1999). Transcription factor activity of STAT proteins: structural requirements and regulation by phosphorylation and interacting proteins. Cell Mol Life Sci 55: 1535-46. Dennis G, Jr., Sherman BT, Hosack DA, Yang J, Gao W, Lane HC et al (2003). DAVID: Database for Annotation, Visualization, and Integrated Discovery. Genome Biol 4: P3. Dewilde S, Vercelli A, Chiarle R, Poli V (2008). Of alphas and betas: distinct and overlapping functions of STAT3 isoforms. Front Biosci 13: 6501-14. Diaz N, Minton S, Cox C, Bowman T, Gritsko T, Garcia R et al (2006). Activation of stat3 in primary tumors from high-risk breast cancer patients is associated with elevated levels of activated SRC and survivin expression. Clin Cancer Res 12: 20-8. Drachenberg DE, Elgamal AA, Rowbotham R, Peterson M, Murphy GP (1999). Circulating levels of interleukin-6 in patients with hormone refractory prostate cancer. Prostate 41: 127-33.
112
Ehret GB, Reichenbach P, Schindler U, Horvath CM, Fritz S, Nabholz M et al (2001). DNA binding specificity of different STAT proteins. Comparison of in vitro specificity with natural target sites. J Biol Chem 276: 6675-88. Endo TA, Masuhara M, Yokouchi M, Suzuki R, Sakamoto H, Mitsui K et al (1997). A new protein containing an SH2 domain that inhibits JAK kinases. Nature 387: 921-4. Frame MC (2002). Src in cancer: deregulation and consequences for cell behaviour. Biochim Biophys Acta 1602: 114-30. Frame MC (2004). Newest findings on the oldest oncogene; how activated src does it. J Cell Sci 117: 989-98. Frank DA (1999). STAT signaling in the pathogenesis and treatment of cancer. Mol Med 5: 432-56. Fujio Y, Kunisada K, Hirota H, Yamauchi-Takihara K, Kishimoto T (1997). Signals through gp130 upregulate bcl-x gene expression via STAT1-binding cis-element in cardiac myocytes. J Clin Invest 99: 2898-905. Gao SP, Bromberg JF (2006). Touched and moved by STAT3. Sci STKE 2006: pe30. Garcia R, Bowman TL, Niu G, Yu H, Minton S, Muro-Cacho CA et al (2001). Constitutive activation of Stat3 by the Src and JAK tyrosine kinases participates in growth regulation of human breast carcinoma cells. Oncogene 20: 2499-513. Garcia R, Yu CL, Hudnall A, Catlett R, Nelson KL, Smithgall T et al (1997). Constitutive activation of Stat3 in fibroblasts transformed by diverse oncoproteins and in breast carcinoma cells. Cell Growth Differ 8: 1267-76. Gerard M, Hernandez L, Wevrick R, Stewart CL (1999). Disruption of the mouse necdin gene results in early post-natal lethality. Nat Genet 23: 199-202. Giri D, Ozen M, Ittmann M (2001). Interleukin-6 is an autocrine growth factor in human prostate cancer. Am J Pathol 159: 2159-65. Gollob JA, Schnipper CP, Murphy EA, Ritz J, Frank DA (1999). The functional synergy between IL-12 and IL-2 involves p38 mitogen-activated protein kinase and is associated with the augmentation of STAT serine phosphorylation. J Immunol 162: 4472-81. Grad JM, Zeng XR, Boise LH (2000). Regulation of Bcl-xL: a little bit of this and a little bit of STAT. Curr Opin Oncol 12: 543-9. Greenhalgh CJ, Hilton DJ (2001). Negative regulation of cytokine signaling. J Leukoc Biol 70: 348-56. Gritsko T, Williams A, Turkson J, Kaneko S, Bowman T, Huang M et al (2006). Persistent activation of stat3 signaling induces survivin gene expression and confers resistance to apoptosis in human breast cancer cells. Clin Cancer Res 12: 11-9.
113
Hanahan D, Weinberg RA Hallmarks of cancer: the next generation. Cell 144: 646-74. Hanahan D, Weinberg RA (2000). The hallmarks of cancer. Cell 100: 57-70. Hanel ML, Wevrick R (2001). Establishment and maintenance of DNA methylation patterns in mouse Ndn: implications for maintenance of imprinting in target genes of the imprinting center. Mol Cell Biol 21: 2384-92. Haspel RL, Salditt-Georgieff M, Darnell JE, Jr. (1996). The rapid inactivation of nuclear tyrosine phosphorylated Stat1 depends upon a protein tyrosine phosphatase. Embo J 15: 6262-8. Hayashi Y, Matsuyama K, Takagi K, Sugiura H, Yoshikawa K (1995). Arrest of cell growth by necdin, a nuclear protein expressed in postmitotic neurons. Biochem Biophys Res Commun 213: 317-24. Heinrich PC, Behrmann I, Muller-Newen G, Schaper F, Graeve L (1998). Interleukin-6-type cytokine signalling through the gp130/Jak/STAT pathway. Biochem J 334 ( Pt 2): 297-314. Hendry L, John S (2004). Regulation of STAT signalling by proteolytic processing. Eur J Biochem 271: 4613-20. Hirano T, Matsuda T, Nakajima K (1994). Signal transduction through gp130 that is shared among the receptors for the interleukin 6 related cytokine subfamily. Stem Cells 12: 262-77. Hoek K, Rimm DL, Williams KR, Zhao H, Ariyan S, Lin A et al (2004). Expression profiling reveals novel pathways in the transformation of melanocytes to melanomas. Cancer Res 64: 5270-82. Hoey T, Zhang S, Schmidt N, Yu Q, Ramchandani S, Xu X et al (2003). Distinct requirements for the naturally occurring splice forms Stat4alpha and Stat4beta in IL-12 responses. Embo J 22: 4237-48. Horvath CM, Wen Z, Darnell JE, Jr. (1995). A STAT protein domain that determines DNA sequence recognition suggests a novel DNA-binding domain. Genes Dev 9: 984-94. Huang da W, Sherman BT, Lempicki RA (2009). Systematic and integrative analysis of large gene lists using DAVID bioinformatics resources. Nat Protoc 4: 44-57. Ihle JN (1996). STATs: signal transducers and activators of transcription. Cell 84: 331-4. Ihle JN, Kerr IM (1995). Jaks and Stats in signaling by the cytokine receptor superfamily. Trends Genet 11: 69-74. Irizarry RA, Hobbs B, Collin F, Beazer-Barclay YD, Antonellis KJ, Scherf U et al (2003). Exploration, normalization, and summaries of high density oligonucleotide array probe level data. Biostatistics 4: 249-64.
114
Jain N, Zhang T, Fong SL, Lim CP, Cao X (1998). Repression of Stat3 activity by activation of mitogen-activated protein kinase (MAPK). Oncogene 17: 3157-67. Jain N, Zhang T, Kee WH, Li W, Cao X (1999). Protein kinase C delta associates with and phosphorylates Stat3 in an interleukin-6-dependent manner. J Biol Chem 274: 24392-400. Jay P, Rougeulle C, Massacrier A, Moncla A, Mattei MG, Malzac P et al (1997). The human necdin gene, NDN, is maternally imprinted and located in the Prader-Willi syndrome chromosomal region. Nat Genet 17: 357-61. John S, Vinkemeier U, Soldaini E, Darnell JE, Jr., Leonard WJ (1999). The significance of tetramerization in promoter recruitment by Stat5. Mol Cell Biol 19: 1910-8. Johnson PJ, Coussens PM, Danko AV, Shalloway D (1985). Overexpressed pp60c-src can induce focus formation without complete transformation of NIH 3T3 cells. Mol Cell Biol 5: 1073-83. Kadonaga JT (1998). Eukaryotic transcription: an interlaced network of transcription factors and chromatin-modifying machines. Cell 92: 307-13. Kamura T, Sato S, Haque D, Liu L, Kaelin WG, Jr., Conaway RC et al (1998). The Elongin BC complex interacts with the conserved SOCS-box motif present in members of the SOCS, ras, WD-40 repeat, and ankyrin repeat families. Genes Dev 12: 3872-81. Kanber D, Giltay J, Wieczorek D, Zogel C, Hochstenbach R, Caliebe A et al (2009). A paternal deletion of MKRN3, MAGEL2 and NDN does not result in Prader-Willi syndrome. Eur J Hum Genet 17: 582-90. Kato T (2011). Stat3-driven cancer-related inflammation as a key therapeutic target for cancer immunotherapy. Immunotherapy 3: 587-90. Kile BT, Nicola NA, Alexander WS (2001). Negative regulators of cytokine signaling. Int J Hematol 73: 292-8. Kishimoto T (1994). Signal transduction through homo- or heterodimers of gp130. Stem Cells 12 Suppl 1: 37-44; discussion 44-5. Kiuchi N, Nakajima K, Ichiba M, Fukada T, Narimatsu M, Mizuno K et al (1999). STAT3 is required for the gp130-mediated full activation of the c-myc gene. J Exp Med 189: 63-73. Knudson AG (2002). Cancer genetics. Am J Med Genet 111: 96-102. Knudson AG, Jr. (1971). Mutation and cancer: statistical study of retinoblastoma. Proc Natl Acad Sci U S A 68: 820-3. Kovarik P, Mangold M, Ramsauer K, Heidari H, Steinborn R, Zotter A et al (2001). Specificity of signaling by STAT1 depends on SH2 and C-terminal domains that regulate Ser727 phosphorylation, differentially affecting specific target gene expression. Embo J 20: 91-100.
115
Kreis S, Munz GA, Haan S, Heinrich PC, Behrmann I (2007). Cell density dependent increase of constitutive signal transducers and activators of transcription 3 activity in melanoma cells is mediated by Janus kinases. Mol Cancer Res 5: 1331-41. Kruger M, Ruschke K, Braun T (2004). NSCL-1 and NSCL-2 synergistically determine the fate of GnRH-1 neurons and control necdin gene expression. Embo J 23: 4353-64. Kuroki M, O'Flaherty JT (1999). Extracellular signal-regulated protein kinase (ERK)-dependent and ERK-independent pathways target STAT3 on serine-727 in human neutrophils stimulated by chemotactic factors and cytokines. Biochem J 341 ( Pt 3): 691-6. Kuwako K, Taniura H, Yoshikawa K (2004). Necdin-related MAGE proteins differentially interact with the E2F1 transcription factor and the p75 neurotrophin receptor. J Biol Chem 279: 1703-12. Lee H, Deng J, Kujawski M, Yang C, Liu Y, Herrmann A et al STAT3-induced S1PR1 expression is crucial for persistent STAT3 activation in tumors. Nat Med 16: 1421-8. Lim CP, Cao X (1999). Serine phosphorylation and negative regulation of Stat3 by JNK. J Biol Chem 274: 31055-61. Liu B, Liao J, Rao X, Kushner SA, Chung CD, Chang DD et al (1998). Inhibition of Stat1-mediated gene activation by PIAS1. Proc Natl Acad Sci U S A 95: 10626-31. Liu L, McBride KM, Reich NC (2005). STAT3 nuclear import is independent of tyrosine phosphorylation and mediated by importin-alpha3. Proc Natl Acad Sci U S A 102: 8150-5. Liu Y, Elf SE, Miyata Y, Sashida G, Liu Y, Huang G et al (2009). p53 regulates hematopoietic stem cell quiescence. Cell Stem Cell 4: 37-48. Lou W, Ni Z, Dyer K, Tweardy DJ, Gao AC (2000). Interleukin-6 induces prostate cancer cell growth accompanied by activation of stat3 signaling pathway. Prostate 42: 239-42. Ludlow JW (1993). Interactions between SV40 large-tumor antigen and the growth suppressor proteins pRB and p53. Faseb J 7: 866-71. Lutticken C, Wegenka UM, Yuan J, Buschmann J, Schindler C, Ziemiecki A et al (1994). Association of transcription factor APRF and protein kinase Jak1 with the interleukin-6 signal transducer gp130. Science 263: 89-92. MacDonald HR, Wevrick R (1997). The necdin gene is deleted in Prader-Willi syndrome and is imprinted in human and mouse. Hum Mol Genet 6: 1873-8. Maritano D, Sugrue ML, Tininini S, Dewilde S, Strobl B, Fu X et al (2004). The STAT3 isoforms alpha and beta have unique and specific functions. Nat Immunol 5: 401-9. Maruyama E (1996). Biochemical characterization of mouse brain necdin. Biochem J 314 ( Pt 3): 895-901.
116
Maruyama K, Usami M, Aizawa T, Yoshikawa K (1991). A novel brain-specific mRNA encoding nuclear protein (necdin) expressed in neurally differentiated embryonal carcinoma cells. Biochem Biophys Res Commun 178: 291-6. Masuhara M, Sakamoto H, Matsumoto A, Suzuki R, Yasukawa H, Mitsui K et al (1997). Cloning and characterization of novel CIS family genes. Biochem Biophys Res Commun 239: 439-46. Mautsa N, Prinsloo E, Bishop OT, Blatch GL The PINIT domain of PIAS3: structure-function analysis of its interaction with STAT3. J Mol Recognit 24: 795-803. McBride KM, Banninger G, McDonald C, Reich NC (2002). Regulated nuclear import of the STAT1 transcription factor by direct binding of importin-alpha. Embo J 21: 1754-63. Melen K, Kinnunen L, Julkunen I (2001). Arginine/lysine-rich structural element is involved in interferon-induced nuclear import of STATs. J Biol Chem 276: 16447-55. Moon HE, Ahn MY, Park JA, Min KJ, Kwon YW, Kim KW (2005). Negative regulation of hypoxia inducible factor-1alpha by necdin. FEBS Lett 579: 3797-801. Mora LB, Buettner R, Seigne J, Diaz J, Ahmad N, Garcia R et al (2002). Constitutive activation of Stat3 in human prostate tumors and cell lines: direct inhibition of Stat3 signaling induces apoptosis of prostate cancer cells. Cancer Res 62: 6659-66. Motokura T, Arnold A (1993). Cyclin D and oncogenesis. Curr Opin Genet Dev 3: 5-10. Nakada Y, Taniura H, Uetsuki T, Inazawa J, Yoshikawa K (1998). The human chromosomal gene for necdin, a neuronal growth suppressor, in the Prader-Willi syndrome deletion region. Gene 213: 65-72. Ng J, Cantrell D (1997). STAT3 is a serine kinase target in T lymphocytes. Interleukin 2 and T cell antigen receptor signals converge upon serine 727. J Biol Chem 272: 24542-9. Nicholson SE, De Souza D, Fabri LJ, Corbin J, Willson TA, Zhang JG et al (2000). Suppressor of cytokine signaling-3 preferentially binds to the SHP-2-binding site on the shared cytokine receptor subunit gp130. Proc Natl Acad Sci U S A 97: 6493-8. Nicola NA, Greenhalgh CJ (2000). The suppressors of cytokine signaling (SOCS) proteins: important feedback inhibitors of cytokine action. Exp Hematol 28: 1105-12. Niu G, Wright KL, Huang M, Song L, Haura E, Turkson J et al (2002). Constitutive Stat3 activity up-regulates VEGF expression and tumor angiogenesis. Oncogene 21: 2000-8. Niu G, Wright KL, Ma Y, Wright GM, Huang M, Irby R et al (2005). Role of Stat3 in regulating p53 expression and function. Mol Cell Biol 25: 7432-40. Oda A, Wakao H, Fujita H (2002). Calpain is a signal transducer and activator of transcription (STAT) 3 and STAT5 protease. Blood 99: 1850-2.
117
Odajima J, Matsumura I, Sonoyama J, Daino H, Kawasaki A, Tanaka H et al (2000). Full oncogenic activities of v-Src are mediated by multiple signaling pathways. Ras as an essential mediator for cell survival. J Biol Chem 275: 24096-105. Ohman Forslund K, Nordqvist K (2001). The melanoma antigen genes--any clues to their functions in normal tissues? Exp Cell Res 265: 185-94. Okamoto M, Lee C, Oyasu R (1997). Interleukin-6 as a paracrine and autocrine growth factor in human prostatic carcinoma cells in vitro. Cancer Res 57: 141-6. Paulson M, Pisharody S, Pan L, Guadagno S, Mui AL, Levy DE (1999). Stat protein transactivation domains recruit p300/CBP through widely divergent sequences. J Biol Chem 274: 25343-9. Paz K, Socci ND, van Nimwegen E, Viale A, Darnell JE (2004). Transformation fingerprint: induced STAT3-C, v-Src and Ha-Ras cause small initial changes but similar established profiles in mRNA. Oncogene 23: 8455-63. Pfitzner E, Jahne R, Wissler M, Stoecklin E, Groner B (1998). p300/CREB-binding protein enhances the prolactin-mediated transcriptional induction through direct interaction with the transactivation domain of Stat5, but does not participate in the Stat5-mediated suppression of the glucocorticoid response. Mol Endocrinol 12: 1582-93. Puthier D, Bataille R, Amiot M (1999). IL-6 up-regulates mcl-1 in human myeloma cells through JAK / STAT rather than ras / MAP kinase pathway. Eur J Immunol 29: 3945-50. Ram PA, Waxman DJ (1997). Interaction of growth hormone-activated STATs with SH2-containing phosphotyrosine phosphatase SHP-1 and nuclear JAK2 tyrosine kinase. J Biol Chem 272: 17694-702. Ram PT, Iyengar R (2001). G protein coupled receptor signaling through the Src and Stat3 pathway: role in proliferation and transformation. Oncogene 20: 1601-6. Reddy GP (1994). Cell cycle: regulatory events in G1-->S transition of mammalian cells. J Cell Biochem 54: 379-86. Rodel B, Tavassoli K, Karsunky H, Schmidt T, Bachmann M, Schaper F et al (2000). The zinc finger protein Gfi-1 can enhance STAT3 signaling by interacting with the STAT3 inhibitor PIAS3. Embo J 19: 5845-55. Ruff-Jamison S, Zhong Z, Wen Z, Chen K, Darnell JE, Jr., Cohen S (1994). Epidermal growth factor and lipopolysaccharide activate Stat3 transcription factor in mouse liver. J Biol Chem 269: 21933-5. Rytinki MM, Kaikkonen S, Pehkonen P, Jaaskelainen T, Palvimo JJ (2009). PIAS proteins: pleiotropic interactors associated with SUMO. Cell Mol Life Sci 66: 3029-41. Sahni M, Ambrosetti DC, Mansukhani A, Gertner R, Levy D, Basilico C (1999). FGF signaling inhibits chondrocyte proliferation and regulates bone development through the STAT-1 pathway. Genes Dev 13: 1361-6.
118
Saura M, Zaragoza C, Bao C, Herranz B, Rodriguez-Puyol M, Lowenstein CJ (2006). Stat3 mediates interleukin-6 [correction of interelukin-6] inhibition of human endothelial nitric-oxide synthase expression. J Biol Chem 281: 30057-62. Schaeffer HJ, Weber MJ (1999). Mitogen-activated protein kinases: specific messages from ubiquitous messengers. Mol Cell Biol 19: 2435-44. Sciorati C, Touvier T, Buono R, Pessina P, Francois S, Perrotta C et al (2009). Necdin is expressed in cachectic skeletal muscle to protect fibers from tumor-induced wasting. J Cell Sci 122: 1119-25. Sekkai D, Gruel G, Herry M, Moucadel V, Constantinescu SN, Albagli O et al (2005). Microarray analysis of LIF/Stat3 transcriptional targets in embryonic stem cells. Stem Cells 23: 1634-42. Sengupta TK, Talbot ES, Scherle PA, Ivashkiv LB (1998). Rapid inhibition of interleukin-6 signaling and Stat3 activation mediated by mitogen-activated protein kinases. Proc Natl Acad Sci U S A 95: 11107-12. Silva CM (2004). Role of STATs as downstream signal transducers in Src family kinase-mediated tumorigenesis. Oncogene 23: 8017-23. Sinibaldi D, Wharton W, Turkson J, Bowman T, Pledger WJ, Jove R (2000). Induction of p21WAF1/CIP1 and cyclin D1 expression by the Src oncoprotein in mouse fibroblasts: role of activated STAT3 signaling. Oncogene 19: 5419-27. Snyder M, Huang XY, Zhang JJ (2008). Identification of novel direct Stat3 target genes for control of growth and differentiation. J Biol Chem 283: 3791-8. Song JI, Grandis JR (2000). STAT signaling in head and neck cancer. Oncogene 19: 2489-95. Stahl N, Yancopoulos GD (1994). The tripartite CNTF receptor complex: activation and signaling involves components shared with other cytokines. J Neurobiol 25: 1454-66. Starr R, Willson TA, Viney EM, Murray LJ, Rayner JR, Jenkins BJ et al (1997). A family of cytokine-inducible inhibitors of signalling. Nature 387: 917-21. Sun W, Snyder M, Levy DE, Zhang JJ (2006). Regulation of Stat3 transcriptional activity by the conserved LPMSP motif for OSM and IL-6 signaling. FEBS Lett 580: 5880-4. Sutcliffe JS, Han M, Christian SL, Ledbetter DH (1997). Neuronally-expressed necdin gene: an imprinted candidate gene in Prader-Willi syndrome. Lancet 350: 1520-1. Taga T, Kishimoto T (1997). Gp130 and the interleukin-6 family of cytokines. Annu Rev Immunol 15: 797-819. Takazaki R, Nishimura I, Yoshikawa K (2002). Necdin is required for terminal differentiation and survival of primary dorsal root ganglion neurons. Exp Cell Res 277: 220-32.
119
Taniura H, Kobayashi M, Yoshikawa K (2005). Functional domains of necdin for protein-protein interaction, nuclear matrix targeting, and cell growth suppression. J Cell Biochem 94: 804-15. Taniura H, Matsumoto K, Yoshikawa K (1999). Physical and functional interactions of neuronal growth suppressor necdin with p53. J Biol Chem 274: 16242-8. Taniura H, Taniguchi N, Hara M, Yoshikawa K (1998). Necdin, a postmitotic neuron-specific growth suppressor, interacts with viral transforming proteins and cellular transcription factor E2F1. J Biol Chem 273: 720-8. Tcherpakov M, Bronfman FC, Conticello SG, Vaskovsky A, Levy Z, Niinobe M et al (2002). The p75 neurotrophin receptor interacts with multiple MAGE proteins. J Biol Chem 277: 49101-4. Tseng YH, Butte AJ, Kokkotou E, Yechoor VK, Taniguchi CM, Kriauciunas KM et al (2005). Prediction of preadipocyte differentiation by gene expression reveals role of insulin receptor substrates and necdin. Nat Cell Biol 7: 601-11. Turkson J (2004). STAT proteins as novel targets for cancer drug discovery. Expert Opin Ther Targets 8: 409-22. Turkson J, Bowman T, Adnane J, Zhang Y, Djeu JY, Sekharam M et al (1999). Requirement for Ras/Rac1-mediated p38 and c-Jun N-terminal kinase signaling in Stat3 transcriptional activity induced by the Src oncoprotein. Mol Cell Biol 19: 7519-28. Turkson J, Bowman T, Garcia R, Caldenhoven E, De Groot RP, Jove R (1998). Stat3 activation by Src induces specific gene regulation and is required for cell transformation. Mol Cell Biol 18: 2545-52. Turkson J, Jove R (2000). STAT proteins: novel molecular targets for cancer drug discovery. Oncogene 19: 6613-26. Turkson J, Ryan D, Kim JS, Zhang Y, Chen Z, Haura E et al (2001). Phosphotyrosyl peptides block Stat3-mediated DNA binding activity, gene regulation, and cell transformation. J Biol Chem 276: 45443-55. Turkson J, Zhang S, Palmer J, Kay H, Stanko J, Mora LB et al (2004). Inhibition of constitutive signal transducer and activator of transcription 3 activation by novel platinum complexes with potent antitumor activity. Mol Cancer Ther 3: 1533-42. Tusher VG, Tibshirani R, Chu G (2001). Significance analysis of microarrays applied to the ionizing radiation response. Proc Natl Acad Sci U S A 98: 5116-21. Uetsuki T, Takagi K, Sugiura H, Yoshikawa K (1996). Structure and expression of the mouse necdin gene. Identification of a postmitotic neuron-restrictive core promoter. J Biol Chem 271: 918-24. Van Gelder RN vZM, Yool A, Dement WC, Barchas JD, Eberwine JH. (1990). Amplified RNA synthesized from limited quantities of heterogeneous cDNA. Proc Natl Acad Sci U S A. 87: 1663-7.
120
Varma RR, Hector SM, Clark K, Greco WR, Hawthorn L, Pendyala L (2005). Gene expression profiling of a clonal isolate of oxaliplatin-resistant ovarian carcinoma cell line A2780/C10. Oncol Rep 14: 925-32. Vinkemeier U, Cohen SL, Moarefi I, Chait BT, Kuriyan J, Darnell JE, Jr. (1996). DNA binding of in vitro activated Stat1 alpha, Stat1 beta and truncated Stat1: interaction between NH2-terminal domains stabilizes binding of two dimers to tandem DNA sites. Embo J 15: 5616-26. Vogelstein B, Lane D, Levine AJ (2000). Surfing the p53 network. Nature 408: 307-10. Wagner BJ, Hayes TE, Hoban CJ, Cochran BH (1990). The SIF binding element confers sis/PDGF inducibility onto the c-fos promoter. Embo J 9: 4477-84. Wang D, Stravopodis D, Teglund S, Kitazawa J, Ihle JN (1996). Naturally occurring dominant negative variants of Stat5. Mol Cell Biol 16: 6141-8. Weinstein IB (1987). Growth factors, oncogenes, and multistage carcinogenesis. J Cell Biochem 33: 213-24. Wen Z, Darnell JE, Jr. (1997). Mapping of Stat3 serine phosphorylation to a single residue (727) and evidence that serine phosphorylation has no influence on DNA binding of Stat1 and Stat3. Nucleic Acids Res 25: 2062-7. Wen Z, Zhong Z, Darnell JE, Jr. (1995). Maximal activation of transcription by Stat1 and Stat3 requires both tyrosine and serine phosphorylation. Cell 82: 241-50. Wormald S, Hilton DJ (2004). Inhibitors of cytokine signal transduction. J Biol Chem 279: 821-4. Xu X, Sun YL, Hoey T (1996). Cooperative DNA binding and sequence-selective recognition conferred by the STAT amino-terminal domain. Science 273: 794-7. Yamada T, Tobita K, Osada S, Nishihara T, Imagawa M (1997). CCAAT/enhancer-binding protein delta gene expression is mediated by APRF/STAT3. J Biochem 121: 731-8. Yamamoto K, Kobayashi H, Arai A, Miura O, Hirosawa S, Miyasaka N (1997). cDNA cloning, expression and chromosome mapping of the human STAT4 gene: both STAT4 and STAT1 genes are mapped to 2q32.2-->q32.3. Cytogenet Cell Genet 77: 207-10. Yan H, Dobbie Z, Gruber SB, Markowitz S, Romans K, Giardiello FM et al (2002). Small changes in expression affect predisposition to tumorigenesis. Nat Genet 30: 25-6. Yang E, Henriksen MA, Schaefer O, Zakharova N, Darnell JE, Jr. (2002). Dissociation time from DNA determines transcriptional function in a STAT1 linker mutant. J Biol Chem 277: 13455-62.
121
Yu CL, Meyer DJ, Campbell GS, Larner AC, Carter-Su C, Schwartz J et al (1995). Enhanced DNA-binding activity of a Stat3-related protein in cells transformed by the Src oncoprotein. Science 269: 81-3. Yu H, Jove R (2004). The STATs of cancer--new molecular targets come of age. Nat Rev Cancer 4: 97-105. Yu Z, Zhang W, Kone BC (2002). Signal transducers and activators of transcription 3 (STAT3) inhibits transcription of the inducible nitric oxide synthase gene by interacting with nuclear factor kappaB. Biochem J 367: 97-105. Yuan ZL, Guan YJ, Chatterjee D, Chin YE (2005). Stat3 dimerization regulated by reversible acetylation of a single lysine residue. Science 307: 269-73. Zhang JG, Farley A, Nicholson SE, Willson TA, Zugaro LM, Simpson RJ et al (1999a). The conserved SOCS box motif in suppressors of cytokine signaling binds to elongins B and C and may couple bound proteins to proteasomal degradation. Proc Natl Acad Sci U S A 96: 2071-6. Zhang JJ, Vinkemeier U, Gu W, Chakravarti D, Horvath CM, Darnell JE, Jr. (1996). Two contact regions between Stat1 and CBP/p300 in interferon gamma signaling. Proc Natl Acad Sci USA 93: 15092-6. Zhang Q, Wang HY, Marzec M, Raghunath PN, Nagasawa T, Wasik MA. (2005). STAT3- and DNA methyltransferase 1-mediated epigenetic silencing of SHP-1 tyrosine phosphatase tumor suppressor gene in malignant T lymphocytes. Proc Natl Acad Sci USA 102: 6948-53. Zhang T, Kee WH, Seow KT, Fung W, Cao X (2000a). The coiled-coil domain of Stat3 is essential for its SH2 domain-mediated receptor binding and subsequent activation induced by epidermal growth factor and interleukin-6. Mol Cell Biol 20: 7132-9. Zhang X, Blenis J, Li HC, Schindler C, Chen-Kiang S (1995). Requirement of serine phosphorylation for formation of STAT-promoter complexes. Science 267: 1990-4. Zhang X, Wrzeszczynska MH, Horvath CM, Darnell JE, Jr. (1999b). Interacting regions in Stat3 and c-Jun that participate in cooperative transcriptional activation. Mol Cell Biol 19: 7138-46. Zhang Y, Turkson J, Carter-Su C, Smithgall T, Levitzki A, Kraker A et al (2000b). Activation of Stat3 in v-Src-transformed fibroblasts requires cooperation of Jak1 kinase activity. J Biol Chem 275: 24935-44. Zhang Z, Fuller GM (1997). The competitive binding of STAT3 and NF-kappaB on an overlapping DNA binding site. Biochem Biophys Res Commun 237: 90-4. Zohlnhofer D, Graeve L, Rose-John S, Schooltink H, Dittrich E, Heinrich PC (1992). The hepatic interleukin-6 receptor. Down-regulation of the interleukin-6 binding subunit (gp80) by its ligand. FEBS Lett 306: 219-22.
122
Zong C, Yan R, August A, Darnell JE, Jr., Hanafusa H (1996). Unique signal transduction of Eyk: constitutive stimulation of the JAK-STAT pathway by an oncogenic receptor-type tyrosine kinase. Embo J 15: 4515-25. Zushi S, Shinomura Y, Kiyohara T, Miyazaki Y, Kondo S, Sugimachi M et al (1998). STAT3 mediates the survival signal in oncogenic ras-transfected intestinal epithelial cells. Int J Cancer 78: 326-30.

123
APPENDIX
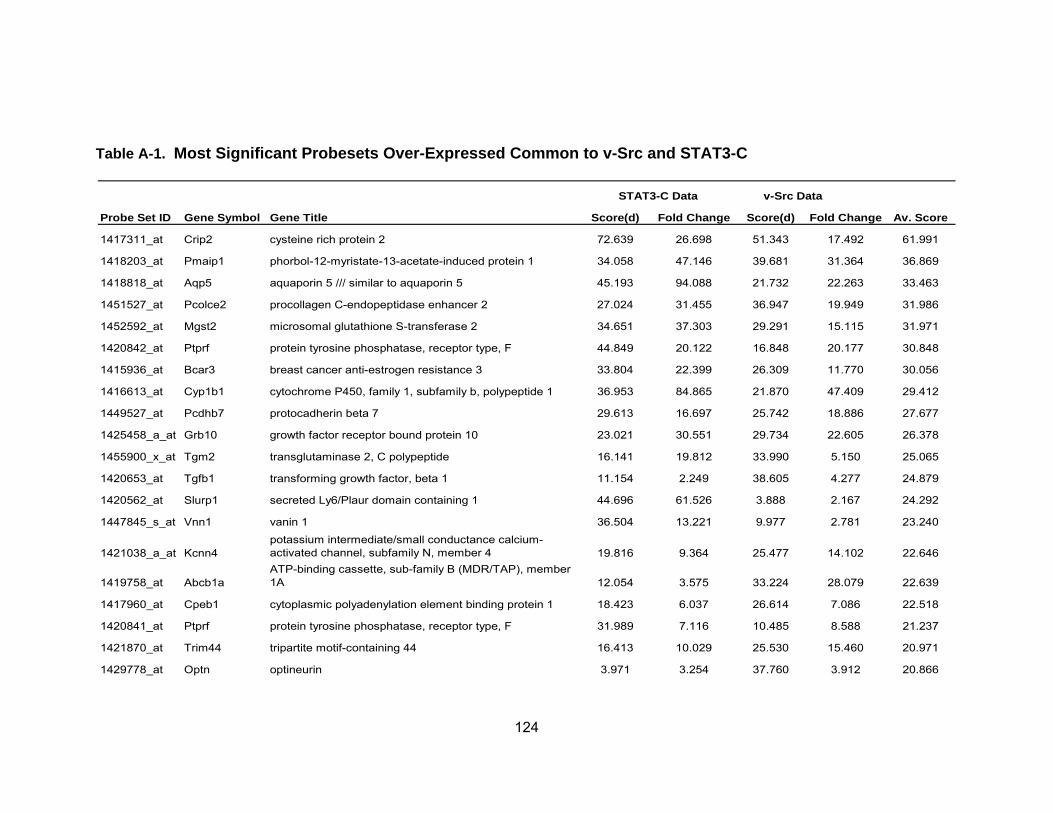
124
Table A-1. Most Significant Probesets Over-Expressed Common to v-Src and STAT3-C
STAT3-C Data v-Src Data
Probe Set ID Gene Symbol Gene Title Score(d) Fold Change Score(d) Fold Change Av. Score
1417311_at Crip2 cysteine rich protein 2 72.639 26.698 51.343 17.492 61.991
1418203_at Pmaip1 phorbol-12-myristate-13-acetate-induced protein 1 34.058 47.146 39.681 31.364 36.869
1418818_at Aqp5 aquaporin 5 /// similar to aquaporin 5 45.193 94.088 21.732 22.263 33.463
1451527_at Pcolce2 procollagen C-endopeptidase enhancer 2 27.024 31.455 36.947 19.949 31.986
1452592_at Mgst2 microsomal glutathione S-transferase 2 34.651 37.303 29.291 15.115 31.971
1420842_at Ptprf protein tyrosine phosphatase, receptor type, F 44.849 20.122 16.848 20.177 30.848
1415936_at Bcar3 breast cancer anti-estrogen resistance 3 33.804 22.399 26.309 11.770 30.056
1416613_at Cyp1b1 cytochrome P450, family 1, subfamily b, polypeptide 1 36.953 84.865 21.870 47.409 29.412
1449527_at Pcdhb7 protocadherin beta 7 29.613 16.697 25.742 18.886 27.677
1425458_a_at Grb10 growth factor receptor bound protein 10 23.021 30.551 29.734 22.605 26.378
1455900_x_at Tgm2 transglutaminase 2, C polypeptide 16.141 19.812 33.990 5.150 25.065
1420653_at Tgfb1 transforming growth factor, beta 1 11.154 2.249 38.605 4.277 24.879
1420562_at Slurp1 secreted Ly6/Plaur domain containing 1 44.696 61.526 3.888 2.167 24.292
1447845_s_at Vnn1 vanin 1 36.504 13.221 9.977 2.781 23.240
1421038_a_at Kcnn4potassium intermediate/small conductance calcium-activated channel, subfamily N, member 4 19.816 9.364 25.477 14.102 22.646
1419758_at Abcb1aATP-binding cassette, sub-family B (MDR/TAP), member 1A 12.054 3.575 33.224 28.079 22.639
1417960_at Cpeb1 cytoplasmic polyadenylation element binding protein 1 18.423 6.037 26.614 7.086 22.518
1420841_at Ptprf protein tyrosine phosphatase, receptor type, F 31.989 7.116 10.485 8.588 21.237
1421870_at Trim44 tripartite motif-containing 44 16.413 10.029 25.530 15.460 20.971
1429778_at Optn optineurin 3.971 3.254 37.760 3.912 20.866
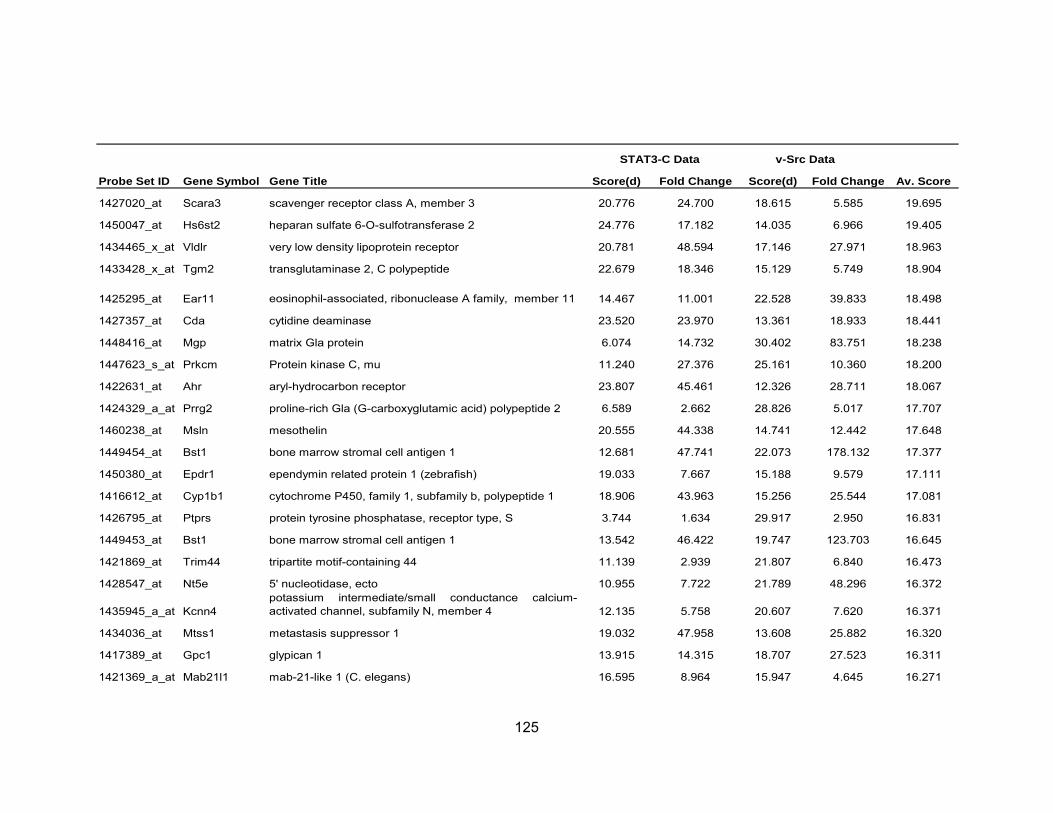
125
STAT3-C Data v-Src Data
Probe Set ID Gene Symbol Gene Title Score(d) Fold Change Score(d) Fold Change Av. Score
1427020_at Scara3 scavenger receptor class A, member 3 20.776 24.700 18.615 5.585 19.695
1450047_at Hs6st2 heparan sulfate 6-O-sulfotransferase 2 24.776 17.182 14.035 6.966 19.405
1434465_x_at Vldlr very low density lipoprotein receptor 20.781 48.594 17.146 27.971 18.963
1433428_x_at Tgm2 transglutaminase 2, C polypeptide 22.679 18.346 15.129 5.749 18.904
1425295_at Ear11 eosinophil-associated, ribonuclease A family, member 11 14.467 11.001 22.528 39.833 18.498
1427357_at Cda cytidine deaminase 23.520 23.970 13.361 18.933 18.441
1448416_at Mgp matrix Gla protein 6.074 14.732 30.402 83.751 18.238
1447623_s_at Prkcm Protein kinase C, mu 11.240 27.376 25.161 10.360 18.200
1422631_at Ahr aryl-hydrocarbon receptor 23.807 45.461 12.326 28.711 18.067
1424329_a_at Prrg2 proline-rich Gla (G-carboxyglutamic acid) polypeptide 2 6.589 2.662 28.826 5.017 17.707
1460238_at Msln mesothelin 20.555 44.338 14.741 12.442 17.648
1449454_at Bst1 bone marrow stromal cell antigen 1 12.681 47.741 22.073 178.132 17.377
1450380_at Epdr1 ependymin related protein 1 (zebrafish) 19.033 7.667 15.188 9.579 17.111
1416612_at Cyp1b1 cytochrome P450, family 1, subfamily b, polypeptide 1 18.906 43.963 15.256 25.544 17.081
1426795_at Ptprs protein tyrosine phosphatase, receptor type, S 3.744 1.634 29.917 2.950 16.831
1449453_at Bst1 bone marrow stromal cell antigen 1 13.542 46.422 19.747 123.703 16.645
1421869_at Trim44 tripartite motif-containing 44 11.139 2.939 21.807 6.840 16.473
1428547_at Nt5e 5' nucleotidase, ecto 10.955 7.722 21.789 48.296 16.372
1435945_a_at Kcnn4potassium intermediate/small conductance calcium-activated channel, subfamily N, member 4 12.135 5.758 20.607 7.620 16.371
1434036_at Mtss1 metastasis suppressor 1 19.032 47.958 13.608 25.882 16.320
1417389_at Gpc1 glypican 1 13.915 14.315 18.707 27.523 16.311
1421369_a_at Mab21l1 mab-21-like 1 (C. elegans) 16.595 8.964 15.947 4.645 16.271
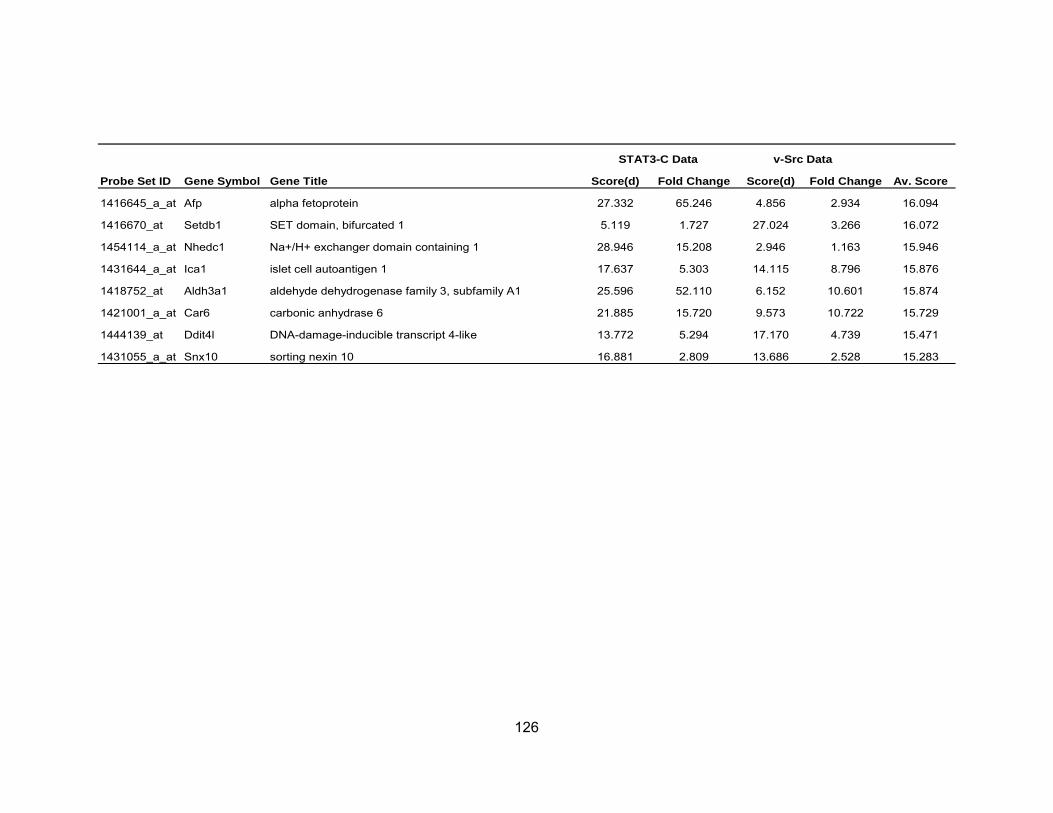
126
STAT3-C Data v-Src Data
Probe Set ID Gene Symbol Gene Title Score(d) Fold Change Score(d) Fold Change Av. Score
1416645_a_at Afp alpha fetoprotein 27.332 65.246 4.856 2.934 16.094
1416670_at Setdb1 SET domain, bifurcated 1 5.119 1.727 27.024 3.266 16.072
1454114_a_at Nhedc1 Na+/H+ exchanger domain containing 1 28.946 15.208 2.946 1.163 15.946
1431644_a_at Ica1 islet cell autoantigen 1 17.637 5.303 14.115 8.796 15.876
1418752_at Aldh3a1 aldehyde dehydrogenase family 3, subfamily A1 25.596 52.110 6.152 10.601 15.874
1421001_a_at Car6 carbonic anhydrase 6 21.885 15.720 9.573 10.722 15.729
1444139_at Ddit4l DNA-damage-inducible transcript 4-like 13.772 5.294 17.170 4.739 15.471
1431055_a_at Snx10 sorting nexin 10 16.881 2.809 13.686 2.528 15.283
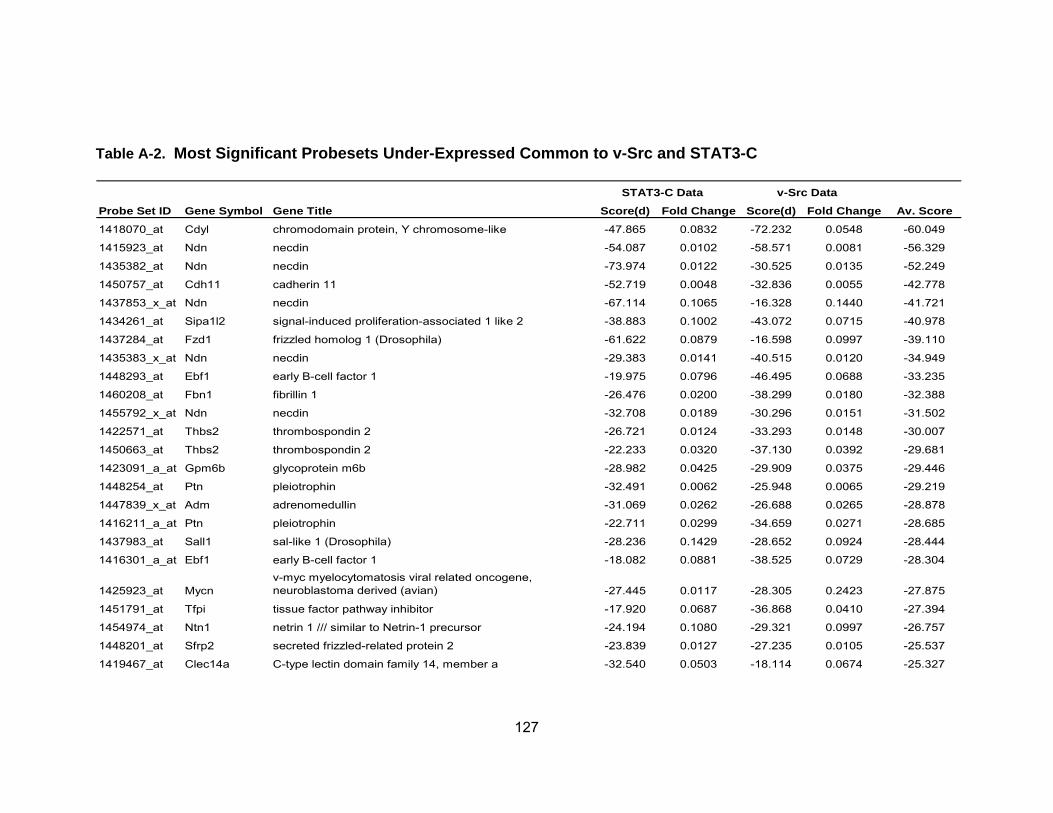
127
Table A-2. Most Significant Probesets Under-Expressed Common to v-Src and STAT3-C
STAT3-C Data v-Src Data
Probe Set ID Gene Symbol Gene Title Score(d) Fold Change Score(d) Fold Change Av. Score
1418070_at Cdyl chromodomain protein, Y chromosome-like -47.865 0.0832 -72.232 0.0548 -60.049
1415923_at Ndn necdin -54.087 0.0102 -58.571 0.0081 -56.329
1435382_at Ndn necdin -73.974 0.0122 -30.525 0.0135 -52.249
1450757_at Cdh11 cadherin 11 -52.719 0.0048 -32.836 0.0055 -42.778
1437853_x_at Ndn necdin -67.114 0.1065 -16.328 0.1440 -41.721
1434261_at Sipa1l2 signal-induced proliferation-associated 1 like 2 -38.883 0.1002 -43.072 0.0715 -40.978
1437284_at Fzd1 frizzled homolog 1 (Drosophila) -61.622 0.0879 -16.598 0.0997 -39.110
1435383_x_at Ndn necdin -29.383 0.0141 -40.515 0.0120 -34.949
1448293_at Ebf1 early B-cell factor 1 -19.975 0.0796 -46.495 0.0688 -33.235
1460208_at Fbn1 fibrillin 1 -26.476 0.0200 -38.299 0.0180 -32.388
1455792_x_at Ndn necdin -32.708 0.0189 -30.296 0.0151 -31.502
1422571_at Thbs2 thrombospondin 2 -26.721 0.0124 -33.293 0.0148 -30.007
1450663_at Thbs2 thrombospondin 2 -22.233 0.0320 -37.130 0.0392 -29.681
1423091_a_at Gpm6b glycoprotein m6b -28.982 0.0425 -29.909 0.0375 -29.446
1448254_at Ptn pleiotrophin -32.491 0.0062 -25.948 0.0065 -29.219
1447839_x_at Adm adrenomedullin -31.069 0.0262 -26.688 0.0265 -28.878
1416211_a_at Ptn pleiotrophin -22.711 0.0299 -34.659 0.0271 -28.685
1437983_at Sall1 sal-like 1 (Drosophila) -28.236 0.1429 -28.652 0.0924 -28.444
1416301_a_at Ebf1 early B-cell factor 1 -18.082 0.0881 -38.525 0.0729 -28.304
1425923_at Mycnv-myc myelocytomatosis viral related oncogene, neuroblastoma derived (avian) -27.445 0.0117 -28.305 0.2423 -27.875
1451791_at Tfpi tissue factor pathway inhibitor -17.920 0.0687 -36.868 0.0410 -27.394
1454974_at Ntn1 netrin 1 /// similar to Netrin-1 precursor -24.194 0.1080 -29.321 0.0997 -26.757
1448201_at Sfrp2 secreted frizzled-related protein 2 -23.839 0.0127 -27.235 0.0105 -25.537
1419467_at Clec14a C-type lectin domain family 14, member a -32.540 0.0503 -18.114 0.0674 -25.327
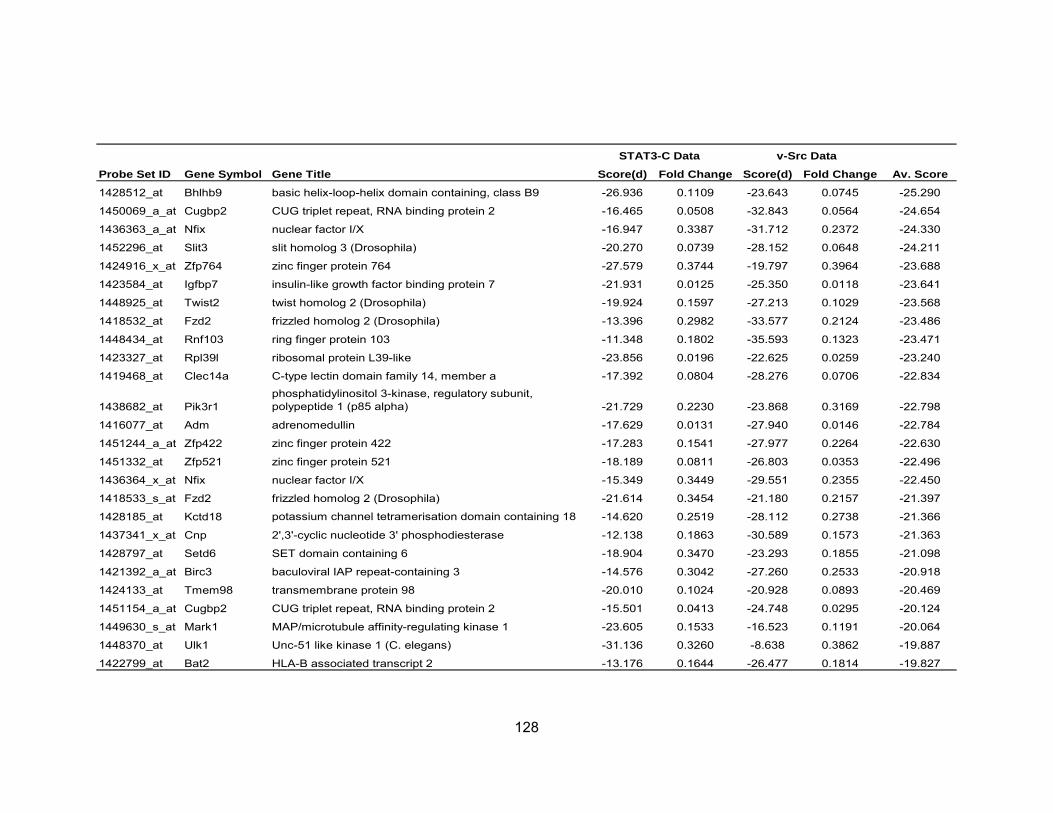
128
STAT3-C Data v-Src Data
Probe Set ID Gene Symbol Gene Title Score(d) Fold Change Score(d) Fold Change Av. Score
1428512_at Bhlhb9 basic helix-loop-helix domain containing, class B9 -26.936 0.1109 -23.643 0.0745 -25.290
1450069_a_at Cugbp2 CUG triplet repeat, RNA binding protein 2 -16.465 0.0508 -32.843 0.0564 -24.654
1436363_a_at Nfix nuclear factor I/X -16.947 0.3387 -31.712 0.2372 -24.330
1452296_at Slit3 slit homolog 3 (Drosophila) -20.270 0.0739 -28.152 0.0648 -24.211
1424916_x_at Zfp764 zinc finger protein 764 -27.579 0.3744 -19.797 0.3964 -23.688
1423584_at Igfbp7 insulin-like growth factor binding protein 7 -21.931 0.0125 -25.350 0.0118 -23.641
1448925_at Twist2 twist homolog 2 (Drosophila) -19.924 0.1597 -27.213 0.1029 -23.568
1418532_at Fzd2 frizzled homolog 2 (Drosophila) -13.396 0.2982 -33.577 0.2124 -23.486
1448434_at Rnf103 ring finger protein 103 -11.348 0.1802 -35.593 0.1323 -23.471
1423327_at Rpl39l ribosomal protein L39-like -23.856 0.0196 -22.625 0.0259 -23.240
1419468_at Clec14a C-type lectin domain family 14, member a -17.392 0.0804 -28.276 0.0706 -22.834
1438682_at Pik3r1phosphatidylinositol 3-kinase, regulatory subunit, polypeptide 1 (p85 alpha) -21.729 0.2230 -23.868 0.3169 -22.798
1416077_at Adm adrenomedullin -17.629 0.0131 -27.940 0.0146 -22.784
1451244_a_at Zfp422 zinc finger protein 422 -17.283 0.1541 -27.977 0.2264 -22.630
1451332_at Zfp521 zinc finger protein 521 -18.189 0.0811 -26.803 0.0353 -22.496
1436364_x_at Nfix nuclear factor I/X -15.349 0.3449 -29.551 0.2355 -22.450
1418533_s_at Fzd2 frizzled homolog 2 (Drosophila) -21.614 0.3454 -21.180 0.2157 -21.397
1428185_at Kctd18 potassium channel tetramerisation domain containing 18 -14.620 0.2519 -28.112 0.2738 -21.366
1437341_x_at Cnp 2',3'-cyclic nucleotide 3' phosphodiesterase -12.138 0.1863 -30.589 0.1573 -21.363
1428797_at Setd6 SET domain containing 6 -18.904 0.3470 -23.293 0.1855 -21.098
1421392_a_at Birc3 baculoviral IAP repeat-containing 3 -14.576 0.3042 -27.260 0.2533 -20.918
1424133_at Tmem98 transmembrane protein 98 -20.010 0.1024 -20.928 0.0893 -20.469
1451154_a_at Cugbp2 CUG triplet repeat, RNA binding protein 2 -15.501 0.0413 -24.748 0.0295 -20.124
1449630_s_at Mark1 MAP/microtubule affinity-regulating kinase 1 -23.605 0.1533 -16.523 0.1191 -20.064
1448370_at Ulk1 Unc-51 like kinase 1 (C. elegans) -31.136 0.3260 -8.638 0.3862 -19.887
1422799_at Bat2 HLA-B associated transcript 2 -13.176 0.1644 -26.477 0.1814 -19.827
End Page
ABOUT THE AUTHOR
Rachel Haviland was born in England and graduated summa cum laude from
Brunel University, West London, UK with a Bachelor of Science degree with Honours in
Medical Biology. During her degree she qualified for one of only two research exchange
student positions and spent 6 months at Rutgers University, New Jersey, U.S. Upon
graduating, she was the sole recipient in her class to be awarded the Brunel University
medal for academic excellence. Following several years in research in London,
England, Rachel immigrated to the U.S. in August 2001 and entered the Cancer Biology
Doctoral Program at H. Lee Moffitt Cancer Center & Research Institute, Tampa, Florida.
She completed her doctoral research under the guidance of doctors Richard Jove and
W. Douglas Cress. This research was published in PLoSOne in October 2011. During
this time, Rachel also led the Association of Medical Science Graduate Students
(AMSGS) at the College of Medicine, University of South Florida elected as Secretary,
Vice President and, subsequently, President.