identification of physical transportation infrastructure
TRANSCRIPT

Journal of Sustainable Development; Vol. 5, No. 12; 2012 ISSN 1913-9063 E-ISSN 1913-9071
Published by Canadian Center of Science and Education
40
Identification of Physical Transportation Infrastructure Vulnerable to Sea Level Rise
Frederick Bloetscher1, Thomas Romah1, Leonard Berry2, Nicole Hernandez Hammer3 & Maria Abadal Cahill4 1 Florida Atlantic University, Department of Civil, Environmental and Geomatics Engineering, FL, USA 2 Florida Center for Environmental Studies Co Director FAU Climate Change Initiative Florida Atlantic University, FL, USA 3 Climate Change Initiative, Florida Atlantic University, Florida Center for Environmental Studies, FL, USA 4 Florida Department of Transportation, Office of Policy Planning, FL, USA
Correspondence: Frederick Bloetscher, Florida Atlantic University, Department of Civil, Environmental and Geomatics Engineering, 777 Glades Rd. Boca Raton, FL 33431, USA. Tel: 1-239-250-2423. E-mail: [email protected]
Received: October 25, 2012 Accepted: November 15, 2012 Online Published: November 27, 2012
doi:10.5539/jsd.v5n12p40 URL: http://dx.doi.org/10.5539/jsd.v5n12p40
Abstract
The objective of this research was developing a methodology for assessing the potential impacts of sea level rise (SLR) on Florida’s state transportation infrastructure to assist the state with transportation planning. The proposed approach integrates the Florida Department of Transportation (FDOT) information system, satellite imagery, local roadway and hydrologic data with existing topographical and geographical data to generate SLR projections to facilitate i) the evaluation of current and projected SLR impacts on transportation infrastructure located along Florida’s coastline and low-lying terrain areas, and ii) the identification of the physical transportation infrastructure components that are vulnerable given the United States Army Corps of Engineers’ scenario-based methodology to project the timing of future low, intermediate and high rates of sea level change. A detailed case study in Dania Beach, Florida and a comparative example in Punta Gorda, Florida were used to evaluate the soundness of the methodology. Further research was performed to develop a preliminary evaluation of the impact of groundwater levels as an exacerbating factor with respect to sea level rise. Storm surge with SLR is a future, more difficult area of investigation.
Keywords: sustainable infrastructure, transportation, sea level rise
1. Introduction
Over the past 100 years, worldwide surface temperatures have increased at an unprecedented rate, contributing to warming of the oceans, melting ice fields and glaciers, altered precipitation patterns and other climatic effects (International Panel on Climate Change (IPCC), 2007). Rising temperatures lead to thermal expansion of the ocean and melting ice caps, both of which result in increased ocean levels (Vermeer & Rahmsdorf, 2009; Jevrejeva et al., 2010), making Florida among the most vulnerable areas in the world for climate change due its coastal proximity and low elevation, especially southeast Florida (Organisation for Economic Co-Operation and Development (OECD), 2008). While the 2007 IPCC report on global scientific consensus regarding climate change stated that the “warming of the climate system is unequivocal, as is now evident from observations of increases in global average air and ocean temperatures, widespread melting of snow and ice, and rising global average sea level” (IPCC, 2007), Florida has more immediate needs for adaptation and mitigation strategies for low lying areas (Murley et al., 2009).
This project included a comprehensive literature review and analysis of SLR projections, studies, models and methodologies. Twelve different projections of SLR and its timing were reviewed, as was the Southeast Florida Regional Climate Compact (SFRCC, 2011) consensus projection recommended by its scientific working group. From the literature review and analysis, it was concluded that approximately 3 ft. of sea level rise by 2100 would a suitable scenario and time frame to illustrate the vulnerability assessment methodology presented in this article. Figure 1 was proposed by Heimlich et al. (2009) as a means to project sea level rise, given the needs for both planning ahead and reluctance to spend money too early. The results of Figure 1 match the US Army Corps of

www.ccsenet.org/jsd Journal of Sustainable Development Vol. 5, No. 12; 2012
41
Engineer’s methodology to derive scenarios of sea level change, which the SFRCC adopted the intermediate to high rates of SLR for years 2030 (3” to 7”) and 2060 (9” to 24”) as the consensus projection to guide future planning in Southeast Florida. As a result, these projections were used as a basis for SLR projections. It was noted that the mid-range level of 3 feet is critical for low-lying coastal areas like southeast Florida where over half the urban areas has elevations below 5 feet National Geodetic Vertical Datum of 1929 (NGVD), making it highly vulnerable to inundation since mean high tide is approximately 2 feet above mean tide (Bloetscher et al., 2010, 2012). As a result, water, sewer, stormwater and transportation infrastructure in low-lying areas could be compromised.
Figure 1. Graphic of sea level rise projections from the Army Corps of Engineers
(http://www.corpsclimate.us/ccaceslcurves.cfm)
As sea level rises, access to roads, bridges, rail and rail transit could be at risk of flooding, causing the effects of SLR to spread indirectly throughout the entire transportation system, affecting the overall system performance. For example, the flooding of a critical road or facility access can cause a shifting of traffic flow causing congested conditions in other roadways. Since the roadway network would be unable to carry the traffic demand, the system would experience operational failure; as a result causing high travel times and delays. Moreover, the inundation of a critical access could cause transportation connectivity problems by blocking access to critical areas like ports or airports. Higher groundwater levels in low-lying areas compounds problem as stormwater management strategies may also become compromised.
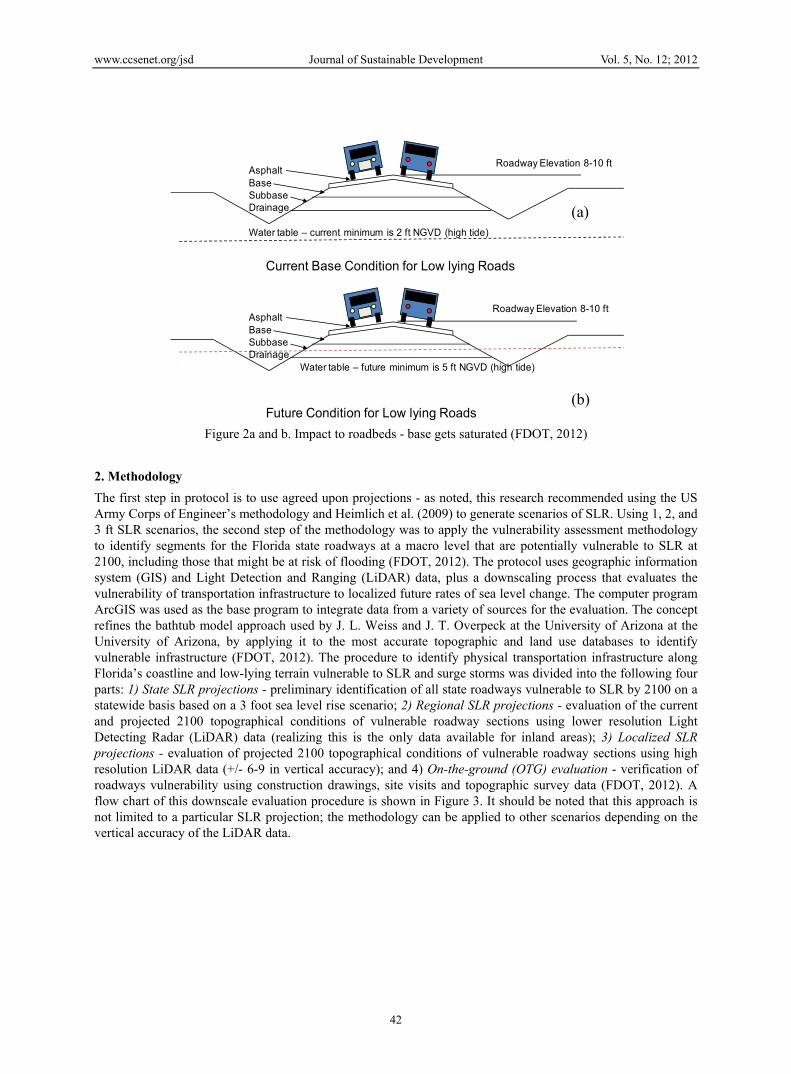
Related to the transportation infrastructure is the related effectiveness of flood control and stormwater drainage systems for the transportation corridors. Road integrity relies on adequate drainage. The increased risk of severe flooding in Florida’s low-lying terrain can adversely affect transportation infrastructures along the coastline; roads can be inundated and roadway beds can be damaged. Sea level rise will cause increased water table levels (Florida Department of Transportation (FDOT), 2012), as regional groundwater tables cannot exist naturally below mean high tide (2 feet in Florida). Adding 3 feet of SLR on top of groundwater would compound the risk of flooding in low-lying areas. Road bases below 5 feet NVGD would become saturated under this scenario, likely causing premature base failure. As soil storage capacity is diminished due to rising groundwater elevations associates with SLR, the potential for more frequently flooded roadways would likely damage pavements (FDOT, 2012). Figure 2 is the typical representation of the problem before and after sea level rise.
Figure 2a illustrates properly constructed FDOT roadways (note that many local roads do not meet these standards FDOT roadways are the main arteries for transportation as well as emergency evacuation routes a result, FDOT needed to identify vulnerable infrastructure and design engineering solutions to attenuate the risk. FDOT funded this research to develop a methodology for projecting future rates of SLR and to identify at-risk roadway sections throughout the state, using existing data sources and based on the development of case studies in southeast and southwest Florida. The results identified a protocol to identify vulnerable infrastructure and identified solutions that might be warranted depending on the situation (FDOT, 2012).
www.ccsenet.org/jsd Journal of Sustainable Development Vol. 5, No. 12; 2012
42
Figure 2a and b. Impact to roadbeds - base gets saturated (FDOT, 2012)
2. Methodology
The first step in protocol is to use agreed upon projections - as noted, this research recommended using the US Army Corps of Engineer’s methodology and Heimlich et al. (2009) to generate scenarios of SLR. Using 1, 2, and 3 ft SLR scenarios, the second step of the methodology was to apply the vulnerability assessment methodology to identify segments for the Florida state roadways at a macro level that are potentially vulnerable to SLR at 2100, including those that might be at risk of flooding (FDOT, 2012). The protocol uses geographic information system (GIS) and Light Detection and Ranging (LiDAR) data, plus a downscaling process that evaluates the vulnerability of transportation infrastructure to localized future rates of sea level change. The computer program ArcGIS was used as the base program to integrate data from a variety of sources for the evaluation. The concept refines the bathtub model approach used by J. L. Weiss and J. T. Overpeck at the University of Arizona at the University of Arizona, by applying it to the most accurate topographic and land use databases to identify vulnerable infrastructure (FDOT, 2012). The procedure to identify physical transportation infrastructure along Florida’s coastline and low-lying terrain vulnerable to SLR and surge storms was divided into the following four parts: 1) State SLR projections - preliminary identification of all state roadways vulnerable to SLR by 2100 on a statewide basis based on a 3 foot sea level rise scenario; 2) Regional SLR projections - evaluation of the current and projected 2100 topographical conditions of vulnerable roadway sections using lower resolution Light Detecting Radar (LiDAR) data (realizing this is the only data available for inland areas); 3) Localized SLR projections - evaluation of projected 2100 topographical conditions of vulnerable roadway sections using high resolution LiDAR data (+/- 6-9 in vertical accuracy); and 4) On-the-ground (OTG) evaluation - verification of roadways vulnerability using construction drawings, site visits and topographic survey data (FDOT, 2012). A flow chart of this downscale evaluation procedure is shown in Figure 3. It should be noted that this approach is not limited to a particular SLR projection; the methodology can be applied to other scenarios depending on the vertical accuracy of the LiDAR data.
AsphaltBaseSubbaseDrainage
Water table – current minimum is 2 ft NGVD (high tide)
Current Base Condition for Low lying Roads
AsphaltBaseSubbaseDrainage
Water table – future minimum is 5 ft NGVD (high tide)
Future Condition for Low lying Roads
Roadway Elevation 8-10 ft
Roadway Elevation 8-10 ft
(a)
(b)

www.ccsenet.org/jsd Journal of Sustainable Development Vol. 5, No. 12; 2012
43
Figure 3. Flow chart of the procedure developed for the identification of vulnerable
state road sections (FDOT, 2012)
YES
1.1.1. EN
NO
PART 1
State SLR Projections
Step 1: Integration of FDOT state roadways data and W&O 1 m SLR
projection map.
Step 2: Identification of all State roadways vulnerable to 1 m SLR by
2100.
Step 3: Develop inventory of vulnerable state roadways.
Is the subject state roadway(s) vulnerable?
YES
PART 2
Regional SLR Projections
Step 4: Integration of regional FDOT state roadways data and low
resolution LiDAR data.
Step 5: Evaluation of current and 2100 topographical conditions.
Step 6: Identification of roadway sections vulnerable to SLR.
Is the subject state roadway section(s)
vulnerable?
NO
YES
YES
NO
Step 10: Verification of vulnerability using construction drawings, survey
data & site visits.
Roadway section is VULNERABLE to SLR
Is the subject state roadway section(s)
vulnerable?
PART 4
OTG Evaluation
Is the subject state roadway section(s)
vulnerable?
PART 3
1.1. Localized SLR Projections
Step 7: Integration of regional FDOT state roadways data and high
resolution LiDAR data.
Step 8: Evaluation of 2100 topographical conditions of specific
roadway links.
Step 9: Identification of specific roadway sections vulnerable to SLR.
www.ccsenet.org/jsd Journal of Sustainable Development Vol. 5, No. 12; 2012
44
The next step was integration of the FDOT Unified Base Map Repository (UBR) and the Strategic Intermodal System (SIS) database and the 1 m (3.28 ft) SLR projection map from Weiss Overpeck to identify areas where the two mapping systems overlapped (the Weiss and Overpeck layer was provided by Dr. Weiss). Two areas were noted - those identified as being below 3 feet, and the location of FDOT infrastructure. As noted previously, the 5 foot elevation would indicate potential coastal inundation resulting from groundwater and sea level rising concurrently, so every roadway falling in the zone where the two layers coincided, were considered potentially vulnerable (FDOT, 2012). From this map, state-wide spreadsheets of all vulnerable roads were developed from GIS mapping of each segment of road. However, this is a preliminary identification and does not enough detail to determine which roadways actually are vulnerable.
The potentially vulnerable state road sections were extracted (clipped) as a new shape file in ArcGIS. Using the clipped state roads shape file, a new map is created and magnified for sections that fall within the area of interest using low resolution and high resolution LiDAR maps (step 2). If a section of a road previously identified as potentially vulnerable is within the hazard zone, it is considered vulnerable, and the inventory matrix is updated. Otherwise the section is marked as a conflicting segment.
Once roadway segments that are potentially vulnerable to SLR are identified, step 3 was to evaluate the roadways with more detailed topographic information. Multiple sources of elevation data for the state of Florida were identified and are listed in Table 1. The topographical data repository sources are organized by the following categories: national, state, and other (FDOT, 2012).
In general, three main data types, Topographic Contour Maps (USGS and others), Digital Elevation Maps (DEM), and Light Detection and Ranging (LiDAR), were used in the next evaluation steps. After evaluating the different types of topographic data available for Florida, LiDAR data was found to be the most appropriate format for this methodology. LiDAR was selected primarily because of its high vertical accuracy and the availability of significant areas of coverage. Although 2 foot contour information is available for most parts of the state, it does not compare with the level of accuracy provided by LiDAR information. However the accuracy of LiDAR data can also vary (FDOT, 2012):
• Low resolution LiDAR is 1 arc, which has a vertical accuracy of +/- 7 to 15 meters, which is not satisfactory for Climate Change modeling. Low resolution LiDAR data was not used in this study.
• Medium Resolution LiDAR is 1/3 and 1/9 arc. The 1/3 arc has 7 meter vertical accuracy, which is not sufficient. The 1/9 arc data is the same 1 meter vertical accuracy as that in Weiss and Overpeck maps and is potentially useful in shape files.
• High Resolution LiDAR has a vertical accuracy of 7 inches, which is very useful. The disadvantage is large file size. For the case of Dania Beach, a small area of 4 x 4 miles (3-4 files) required 2 hours to process the data. The Florida Keys (>200 files) required 24 computing hours.
The LiDAR data format used was the American Standard Code for Information Interchange (ASCII). This data format is easily handled by ArcGIS software. The ASCII format is comprised of the raw Laser (LAS) LiDAR data type format, translated into a geographically referenced X, Y, Z global coordinate plane system (FDOT, 2012). Of the different topographical data repository sources, the National Oceanic and Atmospheric Administration (NOAA) offered the data natively in ASCII format.
The LiDAR data needs to be corrected for datum. Once completed the geographically referenced roadway system was imported into ArcGIS and different incremental elevation heights and colors can be selected by the user. Shades of blue were used to inundation areas (deeper color = deeper water). Although ArcGIS allows the breakdown of elevation heights into fractional inch increments, it is important to recognize the limitations of the source data and how it is collected (FDOT, 2012).

www.ccsenet.org/jsd Journal of Sustainable Development Vol. 5, No. 12; 2012
45
Table 1. Inventory of topographical data repository sources (FDOT, 2012)
Data Source MEANING OF ACRONYM (Organization) Relevant Data
Available NATIONAL
USACE United States Army Corps of Engineers *
USGS United States Geological Survey YES
USFWS United States Fish and Wildlife Services YES
NOAA National Oceanographic and Atmospheric Administration YES
FAA Federal Aviation Administration YES
USDA United States Department of Agriculture YES
FEMA Federal Emergency Management Agency NO
NPS National Park Service NO
NRCS National Resource Conservation Service NO
USEPA United States Environmental Protection Agency NO
USFS United States Forest Service NO
STATE
FWRI Fish and Wildlife Research Institute YES
FDEP Florida Department of Environmental Protection YES
FDOT Florida Department Of Transportation YES
FREAC Florida Resources and Environmental Analysis Center (FSU) YES
SWFRPC Southwest Florida Regional Planning Council YES
NWFWMD Northwest Florida Water Management District YES
FDEM Florida Department of Emergency Management **
SFWMD South Florida Water Management District YES
SJRWMD St. Johns River Water Management District YES
SWFWMD Southwest Florida Water Management District YES
FDOF Florida Division Of Forestry NO
FCFWRU Florida Cooperative Fish and Wildlife Research Unit NO
FNAI Florida Natural Areas Inventory NO
FDHSMV Florida Department of Highway Safety and Motor Vehicles NO
OTHER
GEOPLAN FGDL Geoplan Center YES
BTS Bureau of Transportation Statistics YES
Counties Individual County government GIS departments YES
Universities State Universities ( FSU and FIU) YES
National Research Council NO
Metropolitan Planning Organization NO
*Have not been able to contact to source to access available information.
** FDEM administers topography information but does not act as a publisher or repository location. Updated
10/21/2010.
2.1 Limitations of LiDAR
LiDAR reconnaissance planes bounce signals off points called posts that are coordinated in a grid pattern. Because the information is collected in a non-consecutive point system, assumptions and interpretation of the elevation between posts are made by software (FDOT, 2012; NOAA, 2010). Additionally raw LiDAR has to be converted into bare earth elevations to account for posts that reflect off objects such as vegetation that do not indicate the actual ground elevation. Different datums may be used so interpretation of data is involved that affects the vertical accuracy of the collected data, limiting the reliability of the data’s use for small increments (NOAA, 2010; 2010a). It should also be noted that the groundwater table was assumed to be flat.
2.2 Method Illustration
The protocol seems complicated, but it is mostly a data integration exercise. The eastern portion of Dania Beach, a low-lying area of southeast Florida adjourning the coast, is used to illustrate this methodology. Most of this

www.ccsenet.org/jsd Journal of Sustainable Development Vol. 5, No. 12; 2012
46
area of Dania Beach area is below 5 feet above mean sea level. As shown in Figure 4, visual inspection of the Weiss and Overpeck map identifies vulnerable state roads: US A1A, Griffin Road., US 1 (Federal Highway), Stirling Road and Sheridan Street (cross-hatched).
Figure 5 shows the high resolution LiDAR data result for Dania Beach. Vulnerable roads below the elevation of the projected SLR were identified visually. Various shades of blue are used for elevations under 5 feet. Any area that is vulnerable appears in a shade of blue. Green is used for areas between 5 and 10 feet above sea level. Road bases in these areas may become vulnerable to saturation as sea level rise progresses, as explained previously. After using high resolution LiDAR, more detailed on-the-ground (OTG) evaluations can be conducted. OTG verification may identify borderline areas that might be subject to inundation. In this case FDOT roadway plans were used to verify the LiDAR results.
Figure 4. Most of the Dania Beach area has elevations of less than 5 feet above sea level - Weiss and Overpeck
overlay in hatching (FDOT, 2012)

www.ccsen
Figure 5
To confirmwas evaluaof FloridasignificantI-75 or US
Table 2. Su
US 1 (Feder
US A1A (Da
Griffin Road
Stirling Roa
Sheridan Str
net.org/jsd
. Dania beach
m the methodoated: Punta Go
a with that of tly more detailS 41.
ummary of Da
State Road
ral Highway)
ania Beach Blvd
d
ad
reet
overlay map u
ology, anotherorda. Figure 6FSU (FDOT, l on the vulne
ania Beach roa
Wm
d.)
Journal of Su
using high reso
r, area of the compares our2012). The Lrable roadway
ads based on m
Step
W&O map 1 m SLR Map
x
x
x
x
x
ustainable Devel
47
olution LiDAR
state extensiver methodology
LiDAR methody infrastructure
methodology (b
Roadwa
p 1
Localized W&O Map (Blow Up)
x
x
x
x
lopment
R Data (7” in v
ely studied byy for downtowd confirms thee. It is the loca
by step) (FDOT
ay Vulnerability
Step 2
MediumResoluti
LiDAR
x
x
partial
partial
ertical accurac
y Florida Statewn Punta Gordae FSU findingal streets that
T, 2012)
y Evaluation
2 Ste
m on
R
HiResol
LiD
x
x
l par
l par
Vol. 5, No. 12;
cy) (FDOT, 20
e University (Fa on the westgs, while provare vulnerable
ep 3 Step
igh lution
DAR O
x
x
rtial pa
rtial pa
2012
12)
FSU) coast iding e, not
p 4
TG
x
rtial
rtial
www.ccsen
Figure 6.more elev
downtow
2.3 Effect
The LiDAnecessarilyonly consifactor howhydraulic bbuildup ofreduced anoccur undeCounty waSLR inund
The first sinto the mwell site rgroundwatevaluated
The determshowed thbased on tGIS by subvalues shosurface ansurface grisea level rnetwork asfor the stuFlorida.
net.org/jsd
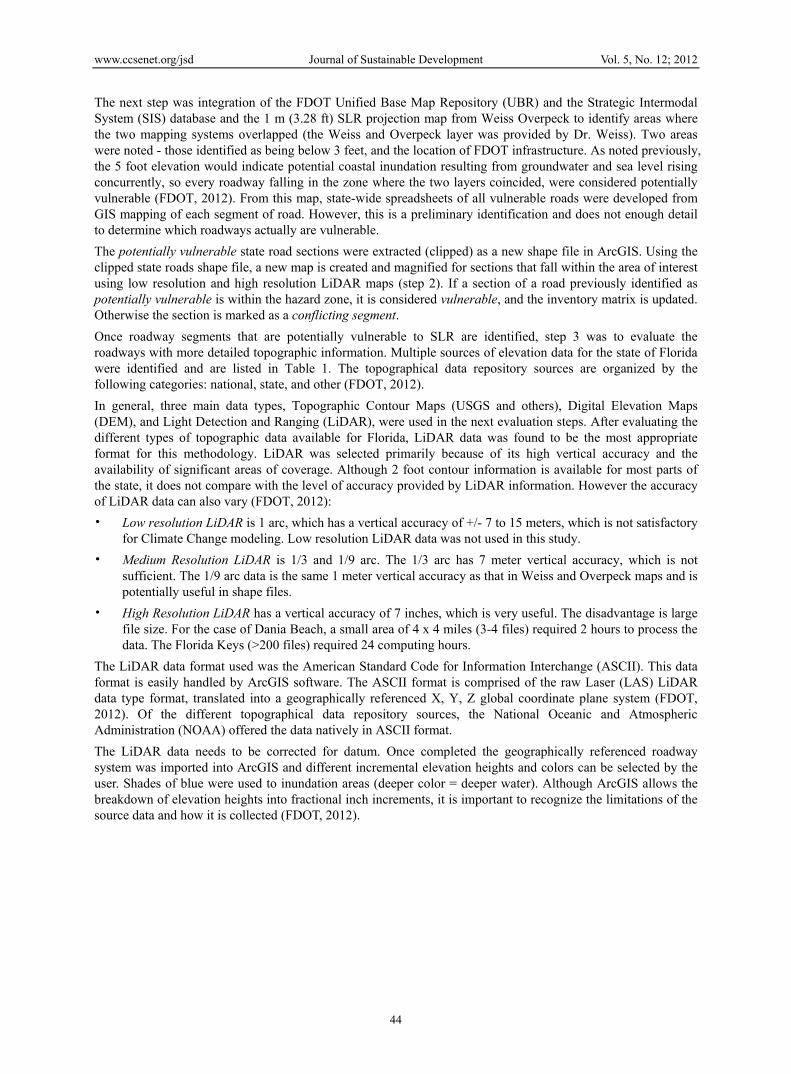
. Downtown Pvation informawn. However,
of Groundwat
AR project crey conform witiders the elevawever, is that base (to the sef water createsnd in some caer a typical baas designed todation in low e
step for updatinmodel. Data poi
records for grter table levelgiven differen
mined levels che low level athe highest mebtracting the g
own as negativnd ground surfids that represrise values cons SLR values udy region in
Punta Gorda areation than in Chmaps created i
potential
er
eates what is cth sea level ris
ation of the groinland groun
ea). Hence the s a scenario thases permanenathtub model. Ao take into accelevation areas
ng the model wints for determroundwater les as shown in
nt groundwater
consisted of thand high leveldian monthly v
ground water sve indicate inunface elevation. ented the diffe
nsidered. The rincrease. The that the inund
Journal of Su
ea comparing hapin’s map. Bin this researchlly vulnerable
commonly refse where grouound above a rndwater builds
groundwater that is not captunt inundation wAs a result, thcount the posss, especially in
with sea level mining the grouevels. The resn Figure 8, whr conditions.
he fiftieth percl extremes resvalue for the m
surface modelsndation and poDifferent SLR
erent combinatresults show a results furtherdation is show
ustainable Devel
48
the FSU and FBoth maps shoh show that thealong the cana
ferred to as aundwater mayreference levels up due to ftable increasesured in the batwill occur in rhe sea level rissible effects th
inland areas.
rise was incorund water surfults of the dahich necessitat
centile monthlpectively. Themonth of Octos from the digiositive values iR scenarios wetions of initial continuous in
r illustrate thatwn to move fr
lopment
FAU LiDAR mow roughly theere are areas sals (FDOT, 20
bathtub scenabe a potentia
l for determinifriction whiles going away fthtub model inregions prior tse (SLR) modehe groundwate
rporating a groface was creatatabase showeted three sepa
ly average vale final model
ober. The final tal elevation mindicate the diere created byground water
crease in the vt SLR vulnerabrom inland are
maps. The LiDA same areas inouth of downt12)
ario, but bathtl issue. A typing SLR vulnetraveling tow
from the coast n that the soil to when it woel for Miami-Der table can ha
oundwater surted by using thed large seasoarate SLR mod
ues for June avariant was ainundation mo
model as showistance betweey creating mod
surfaces with vulnerability obility is not jueas towards th
Vol. 5, No. 12;
AR map provinundated with Sown that are a
tub models doical bathtub m
erability. A miward the low
(it is not flat)storage capaculd be expect
Dade, and Broave on determ
rface elevationhe historical Uonal swings indel scenarios t
and October wan extremes model was creat
wn in Figure 8. en the ground wdified ground w added incremf the transport
ust a coastal fehe eastern coa
2012
ides SLR lso
o not model ssing lying . The ity is ed to ward ining
map USGS n the to be
which model ted in Here
water water
mental tation ature
ast of

www.ccsenet.org/jsd Journal of Sustainable Development Vol. 5, No. 12; 2012
49
Figure 7. Groundwater levels at USGS station G970 (www.usgs.com)
Figure 8. Miami-Dade and Broward County inundation results
3. Discussion
Based on the results of Figure 8, up to 10% of southeast Florida’s roadways as being potentially vulnerable to sea level rise from a bathtub model perspective and nearly 5 percent of the whole state may be vulnerable. However, much larger areas may be inundated in low lying areas where the groundwater table may concurrently rise. As a result, in southeast Florida for example, a much larger percent of roadways, especially inland, may be subject to flooding groundwater that results from sea level rise.
In either case, there is a need to prioritize where funds are spent on transportation infrastructure and other major investments. The vulnerability of transportation infrastructure will require the design of more resistant and adaptive infrastructure and network systems, which in turn, would involve the development of new performance measures for assessing the ability of transportation infrastructure (e.g., roadways, bridges, rail, sea ports, airports)

www.ccsenet.org/jsd Journal of Sustainable Development Vol. 5, No. 12; 2012
50
to adapt to sea level rise; enhanced design standards and guidelines for design and construction of resilient transportation facilities, retrofitting, material protective measures, rehabilitation, and in some cases, relocation of the facility will be necessary to accommodate SLR impacts. Groundwater is expected to have a significant impact on flooding in these low-lying areas as a result of the loss of soil storage capacity, which has not been the focus of many planning efforts. Catastrophic flooding would be expected during heavy rain events because there is nowhere for the runoff to go.
Because it is critical to protect the roadway base, all efforts should begin with providing the base with adequate drainage systems to meet future conditions. At present, most base courses are installed above the water table. As long as the base stays dry, the roadway surface will remain stable. As soon as the base is saturated, the roadway can deteriorate. As water levels rise, wellpoint systems may need to be installed for more permanent drainage. However, wellpoint water is usually turbid containing sand, other particles, and contaminants from runoff, which requires an offsite discharge zone. Treatment areas for removal of particulates and sand will also be required, requiring additional area for discharge purposes. Wellpoint pump stations need to be regularly spaced along the affected roadway. As a result a series of pump stations might be needed for every mile of roadway since typical dewatering systems are generally confined to areas less than 500 feet in length. Since wellpoints do not function in flood conditions, additional drainage measures must be taken to address wellpoint failure during heavy rainfall events. The costs for such systems could exceed $1 million per lane mile based on data gathered by the project team.
FDOT and most Florida municipalities rely heavily on exfiltration trenches or French drains. These systems work because the perforated piping is located above the water table. They cease to function if they are located below the water table. Exfiltration systems in low-lying areas will cease to work as they become submerged. Future storm water systems should be designed like sanitary sewers with tight piping, minimal allowances for infiltration and adequately sized pumping stations with permitted discharge points and means for associated treatment. Stormwater gravity wells are a useful option where saltwater underlies the surface. Drainage wells along the southeast Florida coast can drain 1 MGD under certain conditions. However as sea level rises, the potential for pumping will be altered. Wells of this type generally cost about $150, 000 each for a 24 inch diameter well, based on recent bid reviews. They also require splitter boxes and filters to remove solids, regular inspections and regular maintenance increasing transportation system budgets.
For low-lying areas, elevating roads may be an option. However, this option comes with two significant issues: roadway elevations and impacts on adjacent properties. Roadways are designed for 50 to 100-years service life. As a result, transportation agencies should design roadway bases to be above the mean high water table of 5 ft NGVD. Such roads would likely have surface elevations at or above 8 ft NGVD, well above many of today’s low lying roads and in many cases above the finished floors of adjacent properties, and they will act as dams unless provisions, such as culverts or pumps, are made for horizontal movement of water, creating a potential storm water runoff concern. Raising roadways is expected to exceed the cost of new roads. The authors estimate $1 million per lane mile, plus the additional right-of-way costs, based on a review of recent FDOT bids. In addition, sanitary sewers, water mains and other utilities underlie these pavements, and will also required relocation at additional costs. Elevating the roads would require manholes to be reconstructed, water lines replaced and most other underground utilities replaced. The costs for these improvements are estimated at roughly $4 million per mile of roadway.
A final option is abandonment of roadways, which may be appropriate for a number of situations. The roadways would be abandoned to underlying local governments, who would be responsible for the infrastructure. However this would only be done where the roadway no longer serves its purpose or the adjacent properties are being abandoned. Where these displaced residents go is uncertain although migration and displacement of residents could be a domino.
4. Conclusions
The US Army Corps of Engineers has specified that any coast or near-coast projects must include consideration of sea level rise. Therefore, transportation agencies should include the impact of sea level rise into all long-range planning. The methodology developed herein recommends use of US Army Corps of Engineers scenarios for sea level rise, extrapolated to 2100 by Heimlich et al. (2009), integrated with LiDAR, topographic, groundwater level and aerial photographic maps to identify potentially vulnerable roadway infrastructure across the state. Overlaying high resolution LiDAR data onto a base map enabled creation of mapping tools to evaluate potentially vulnerable infrastructure. This methodology is shown to be effective and generally accurate, once correction factors were applied. Testing the protocol on several low-lying areas of the state to determine the

www.ccsenet.org/jsd Journal of Sustainable Development Vol. 5, No. 12; 2012
51
extent of roadway infrastructure that might be vulnerable was successful. Drilldown efforts were used to identify “potentially vulnerable”, and thereafter “vulnerable” infrastructure. LiDAR and ground-truthing was used to verify the accuracy of the protocol.
Vulnerability is highly dependent on local conditions in different parts of the Florida coast; vulnerability analysis can be achieved by the drilldown methodology employed in this study. Once results are understood, it is important to incorporate adaptive management processes into the planning as more information becomes available. Estimates of what these adaptive processes may cost was included for planning purposes. Priorities and sequence are local issues that need local input.
References
Bloetscher, F., Heimlich, B. N., & Romah, T. (2011). Counteracting the Effects of Sea Level Rise in Southeast Florida. Journal of Environmental Science and Engineering, 5(11), 1507-1525.
Bloetscher, F., Meeroff, D. E., Heimlich, B. N., Brown, B., & Loucraft, M. (2010). Improving the Resilience against the Impacts of Climate Change. Journal American Water Works Association, 102(11), 36-46.
Bloetscher, F., Meeroff, D. E., & Heimlich, B. N. (2009). Improving the Resilience of a Municipal Water Utility against the Likely Impacts of Climate Change. A Case Study: City of Pompano Beach Water Utility, Florida Atlantic University, November 2009. Retrieved from http://www.ces.fau.edu/files/projects/climate_change/PompanoBeachWater_CaseStudy.pdf
FDOT. (2012). BDK79 977-01 Development of a Methodology for the Assessment of Sea Level Rise Impacts on Florida’s Transportation Modes and Infrastructure, Summary [PDF - 470 KB], Final Report [PDF - 13,326 KB]. Retrieved from http://www.dot.state.fl.us/research-center/Completed_Planning.shtm
Heimlich, B. N., Bloetscher, F., Meeroff, D. E., & Murley, J. (2009). Southeast Florida's Resilient Water Resources: Adaptation to Sea Level Rise and Other Impacts of Climate Change. Boca Raton(FL): Florida Atlantic University: Center for Urban and Environmental Solutions, Department of Civil Engineering, Environmental, and Geomatics Engineering. Retrieved from http://www.ces.fau.edu/files/projects/climate_change/SE_Florida_Resilient_Water_Resources.pdf
IPCC. (2007). Climate Change 2007: The Physical Science Basis. Contribution of Working Group I to the Fourth Assessment Report of the Intergovernmental Panel on Climate Change. In S. D. Solomon, M. Qin, Z. Manning, M. Chen, K. B. Marquis, M. T. Averyt, & H. L. Miller (eds.). Cambridge, United Kingdom: Cambridge University Press & New York, NY, USA.
Jevrejeva, S., Moore, J. C., & Grinsted, A. (2010). How will sea level respond to changes in natural and anthropogenic forcings by 2100? Geophysical Research Letters, 37, L07703. http://dx.doi.org/10.1029/2010GL042947
Murley, H., & Bollman. (2008). Florida’s Resilient Coasts: a State Policy Framework for Adaptation to Climate Change. Florida Atlantic University, May 2008. Retrieved from http://www.ces.fau.edu/files/projects/climate_change/Fl_ResilientCoast.pdf
National Oceanic and Atmospheric Administration (NOAA) Coastal Service Center. (2010). Mapping Inundation Uncertainty. Retrieved January from http://www.csc.noaa.gov/slr/viewer/assets/pdfs/Elevation_Mapping_Confidence_Methods.pdf
National Oceanic and Atmospheric Administration (NOAA) National Ocean Service (NOS). (2010a). Technical Considerations for the Use of Geospatial Data in Sea Level Change Mapping and Assessment. NOAA NOS Technical Report. Silver Springs, M.
OECD. (2008). Ranking Port Cities with High Exposure and Vulnerability to Climate Extremes: Exposure Estimates. Organisation for Economic Co-Operation and Development, OECD Publishing.
Southeast Florida Regional Climate Change Compact (SFRCC) Inundation Mapping and Vulnerability Assessment Work Group. (2011). Analysis of the Vulnerability of Southeast Florida to Sea Level Rise.
Vermeer, M., & Rahmstorf, S. (2009). Global sea level linked to global temperature. PNAS, 106(51), 21527-21532. http://dx.doi.org/10.1073/pnas.0907765106