identification of qtl involved in resistance of barley
TRANSCRIPT
49
Hebron University Research Journal (A). Vol.(5), pp.(49 – 62), 2011
H.U.R.J. is available online athttp://www.hebron.edu/journal
Identification of QTL Involved in Resistance of Barley Seedling to Scald (Rhynchosporium secalis)
AbstrAct:
A population of 103 recombinant inbred lines (RILs) of barley, that were developed from the cross L94x’Vada’ was evaluated at seedling stage for resistance against scald (Rhynchosporium secalis) in a sporeproof air-conditioned glasshouse. Two isolates of R. secalis were used: B9 and 13-13. Both isolates were collected in fields at SCRI (Scot-tish Crop Research Institute) near Dundee, Scotland, UK. Under glasshouse conditions, two quantitative trait loci (QTLs) for partial resistance (PR) to scald were identified. One QTL (Rrsq1) was detected on chromosome 3 (3H) for latency period and lesion length only against B9 isolate, whereas the other QTL (Rrsq2, on chromosome 7H) was identified for lesion length of both isolates. Rrsq1 was mapped at a region where a QTL was detected, using the same population, for partial resistance to scald under field conditions whereas Rrsq2 was mapped at a similar position as the locus Rrs2 for scald resistance. These cases of co-location of QTL with major genes, not very common, may suggest that some QTL are actually alleles of known major resistance genes.
Key words: Barley, partial resistance, QTL mapping, Rhynchosporium secalis.
* Corresponding author: [email protected]
Munqez J. Y. Shtaya1 Fernando Martínez
1-Department of Plant Production and Protection, Faculty of Agriculture,
An-Najah National University,
2-Universidad de Sevilla, Dpto, Ciencias Agroforestales, Spain
50
الملخ�ص:تحديد و لدرا�سة RIL من ال�سعير والتي تم الح�سول عليها من تلقيح L94x’Vada’ وذلك اأجريت درا�سة على 103 ا�ستخدام تم مثالية. ظروف في النباتية الحا�سنة داخل في وذلك Rhynchosporium secalis لمر�ض مقاومتها �سلالتين من المر�ض والتي تم الح�سول عليها من معهد اأبحاث المحا�سيل الا�سكتلندي، دندي، المملكة المتحدة. تم تحديد H3 تم تحديدها على الكرومو�سوم رقم Rrsq1 لمقاومة المر�ض. الاأولى وهي )QTL( جينتين توؤثر على ال�سفات الكمية)Rrsq2( الثانية B2 فقط بينما كانت الجينة لل�سلالة اإطالة فترة الح�سانة وتقليل طول بثرة المر�ض والم�سئولة عن Rrsq1 الجينة الم�ستخدمتين. تم تحديد لل�سلالتين المر�ض بثرة تقليل طول عن م�سئولة H7 رقم الكرومو�سوم على لنف�ض المر�سوفي نف�ض المجتمع وتحت ظروف المقاومة الجزئية الذي حددت به جينة م�سئولة عن زيادة في نف�ض الموقع الحقل المفتوح بينما تم تحديد األجين الثانية Rrsq2 في موقع م�سابه لموقع األجين Rrs2. اإن تحديد الجينات الكمية في نف�ض مواقع الجينات النوعية، والذي لا يعتبر بالاأمر ال�سائع، يمكن اأن يدل على اأن هذه الجينات الكمية عبارة عن األيلات
للجينات الكبرى.
Scald, caused by the fungus Rhynchos-porium secalis [Oudem.] J.J. Davis, is one of the major leaf-spotting dis-eases of barley, especially in areas of the world where the climate is temper-ate and humid. Average annual yield losses to scald have been estimated to range from 5 to 10% (Turkington et al., 1998), but can be as high as 20 to 36% in experimental plots (Orr and Turk-ington, 1997). Scald can be controlled by the use of fungicides, but the use of genetic resistance is the most effective, economic and environmentally-friend-ly way to control this disease. Sixteen major gene alleles across nine loci for resistance against scald have been re-ported so far (Zhan et al., 2008). How-ever, nearly all the R-genes deployed in commercially grown cultivars have had a short effective life (Xi et al., 2002). This ephemeral effectiveness of resist-ance has caused breeders to look for other types of resistance such as partial
IntroductIon:resistance which appears to be quanti-tative, race-non-specific, more durable (Parlevliet, 1975) and is often inherited polygenically (Kari and Griffith, 1997; Zhan et al., 2008). Such resistance is expressed as prolonged incubation pe-riod (Xue and Hall, 1991) of the fungus and a reduced diseased leaf area (Rob-inson et al., 1997).The use of molecular markers has fa-cilitated the construction of extensive linkage maps in barley (Graner et al., 1991; Qi et al., 1998a). These maps be-came denser by the integration of new marker types (Marcel et al., 2008). By the availability of such dense linkage maps. Quantitative Trait Loci (QTL) for scald resistance have been identified and mapped in different genetic back-grounds (Shtaya et al., 2006), many of which cluster around the major gene loci (Zhan et al., 2008). QTL mapping is an effective mean for studying genet-ically complex characters such as quan-titatively inherited resistance. Not only we can determine and compare the loci involved in resistance expression, but
Munqez Shtaya and Fernando Martínez,Identification of QTL...,H.U.R.J.,Vol.(5), , 49-62 ,2011
51
also the relative size of their effect on the epidemic, the parent contributing the allele for resistance, and the effec-tiveness of each locus at various plant development stages or against various pathogen isolates (Qi et al., 1998b, 1999).In a previous work, Shtaya et al., (2006) found four QTL (Rrsq1, Rrsq2, Rrsq3 and Rrsq4) for resistance against scald in a population of 103 recombinant in-bred lines (RILs) derived from a cross between L94 x ‘Vada’ in field trials. The objective of this study was to map QTL for seedling resistance to scald under glasshouse conditions with two pure isolates using the same population used by Shtaya et al., (2006), and to compare the results with those obtained by Shtaya et al., (2006).
MAterIAls And Methods
PlAnt MAterIAlThe resistance tests were performed on a population of 103 recombinant inbred lines (RILs, F9-derived lines) devel-oped from the two-row spring barley cross L94 × Vada. L94 is an Ethiopian landrace with black and naked seeds which, is very susceptible to leaf rust and resistant to scald (Shtaya et al., 2006). ‘Vada’ is an old Dutch variety with white and covered seeds which, carries a high level of partial resistance to leaf rust (Parlevliet, 1975), and ap-pears to be quite susceptible to scald (Rowling and Jones, 1976).
FungAl MAterIAl
Two isolates of R. secalis were used: B9 and 13-13. Both were collected in fields at SCRI (Scottish Crop Research Institute) near Dundee, Scotland, UK in 2005. Isolate B9 was virulent on the United Kingdom Cereal Pathogen Vir-ulence Survey (UKCPVS) differential cultivars (Jones and Newton, 2005): Pirate (BRR7), la Mesita (BRR5), Igri (BRR4) and Athene (BRR3) (octal race 134), and isolate 13-13 was virulent on Pirate (BRR7), Igri (BRR4), Athene (BRR3), Astrix (BRR2) (octal race 116) (Gilmour, 1973; Goodwin et. al, 1990).
Sporulating cultures were obtained by inoculating Petri dishes of CzV8CM medium (Newton et al., 2001) and incu-bated at 17 ºC in the dark. Spores were harvested by scraping conidia from CzV8CM dishes with a spatula, dilut-ing them in distilled water and macer-ating the solution for 1 minute at high speed to separate mycelial debris from conidiospores. These were washed by diluting them in sterile distilled water (to remove germination inhibitors), centrifuged at 3,000 g for 2 minutes, re-suspended in sterile distilled water and the spore concentration adjusted to 105 spores/ml using a haemocytometer.
Munqez Shtaya and Fernando Martínez,Identification of QTL...,H.U.R.J.,Vol.(5), , 49-62 ,2011
52
A dense morphological and molecular markers map (709 AFLPs and 139 mi-crosatellites) of L94 x Vada was con-structed with JoinMap 3.0 by Marcel et al., (2007) was used to identify QTL in the present study. A skeletal map with uniformly distributed markers (approx-imately 5 cM per marker interval) was extracted (Fig. 1). This skeletal map was used for QTL analyses in a previ-ous study by Shtaya et al. (2006b) and in the present study.A computer software package, MAPQTL version 5.0 modified from version 3.0 (Van Ooijen and Ma-liepaard, 1996), was used for interval mapping. In the region of the putative QTL, the markers with the highest LOD values (peak markers) were used as co-factors for running a multiple-QTL mapping programme, the MQM method (Jansen and Stam, 1994). The restricted MQM method (rMQM) was used to determine the values of the LOD, phenotypic variation, additive ef-fect and the confidence interval for the detected QTL. A LOD value of 3 was chosen as threshold value for declar-ing a QTL. The non-parametric option of MAPQTL was used to test which markers contributed significantly to the severities observed.
InoculAtIon on detAched leAves
The mapping population were sown in a sporeproof, air-conditioned glass-house in individual 50 ml pots filled with John Innes no. 2 peat-based com-post. The temperature in the glasshouse ranged between 15 ºC and 20 ºC. Natu-ral lighting was supplemented with sodium lamps to extend daylength to 16 hours. Two inoculations were per-formed: one 14 days after sowing, on the primary leaf with isolate B9 and the other 21 days after sowing on the third leaf with the isolate 13-13.The inoculation was performed on 30 mm detached leaves placed on 1% (w/v) water-agar containing 120 ppm benzimidazole, with seven randomised leaves per sealed Perspex box (Stew-art Plastics, Croydon, UK 80x45x20 mm). Three leaves per RIL, including the parental lines L94 and Vada, were inoculated per isolate. Prior to inocula-tion, the centre of leaves were gently abraded by brushing with a sable hair paintbrush with the bristles cut to 3 mm long. Then, aliquots of 10 µl spore suspension were placed in the centre of each leaf segment. The sealed boxes were randomised and placed in an incu-bator at 17 °C under continuous light. After eight days, inoculated leaves were observed daily and the time to ap-pearance of a lesion (latency period), and the lesion length, measured when all lesions showed up, were recorded. Leaves displaying no symptoms were given a lesion length zero.
stAtIstIcAl AnAlysIs And MAPPIng
Munqez Shtaya and Fernando Martínez,Identification of QTL...,H.U.R.J.,Vol.(5), , 49-62 ,2011
53
results
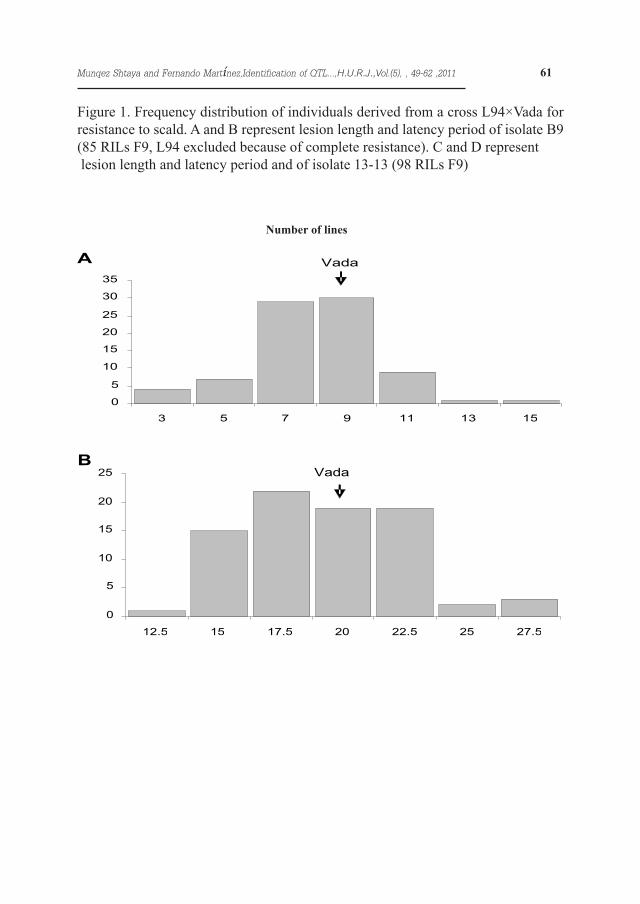
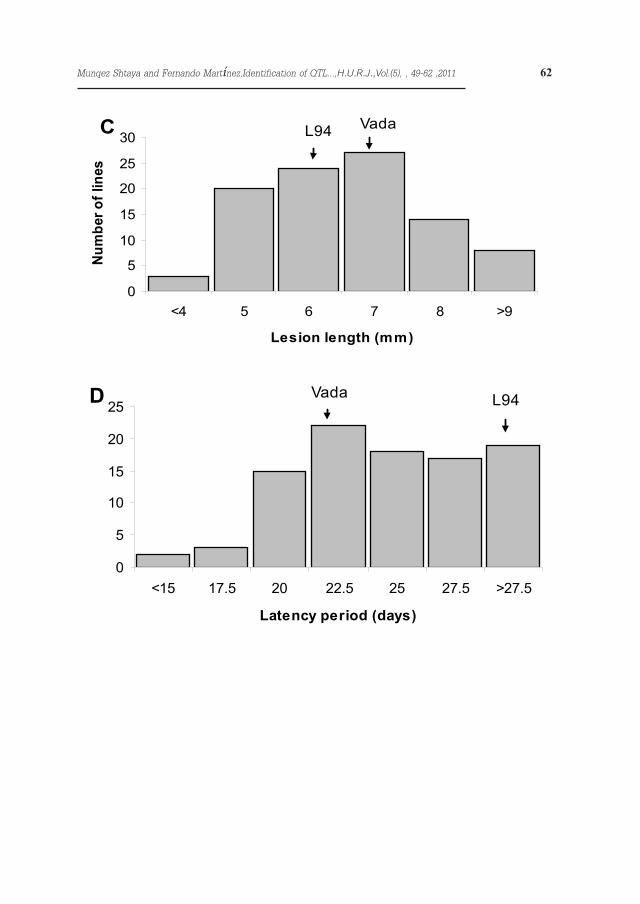
Eighteen out of 103 RILs, including the parental line L94, showed immunity with isolate B9 (Figure 1 A & B). With isolate 13-13 only five RILs showed immunity and both parental lines, L94 and Vada displayed scald lesions. For both isolates the segregation for latency period and lesion size was continuous and quantitative, suggesting polygenic inheritance. The lesion size with iso-late B9 ranged between 3.1 and 15.4 mm, the lesion size on Vada being 8.7 mm. The latency period of this isolate ranged between 11.8 and 27 days on the RILs and was 15.4 days on Vada.The lesion size for isolate 13-13 ranged from 2.9 to 9.4 mm, L94 and Vada be-ing 6.1 and 6.8 mm respectively (Figure 1 C & D), and the latency period ranged from 14.7 to 34 days, L94 and Vada be-ing 31.5 and 19 days respectively.The correlations between latency peri-od and lesion size with the field assess-ments reported by Shtaya et al. (2006) are shown in Table 1. Lesion size and latency period with isolate 13-13 were negatively correlated (-0.21), but no correlation was found between these parameters with isolate B9. The cor-relation between the latency period of the two isolates was significant (0.38), but the correlation among lesion sizes was not significant (0.20). Field and seedling traits showed several correla-tions: disease severity and lesion size for isolate 13-13 (0.31), and disease severity and latency period for isolate B9 (-0.26). The heritability of the lesion length was
0.52 and 0.18 with isolate B9 and 13-13 respectively, whereas the heritability of the latency period was 0.56 and 0.51. 100 RILs were used with isolate B9 and 101 with 13-13.In total, two QTL for PR to scald were identified. They were tentatively named as Rrsq (quantitative genes for Resist-ance to Rhynchosporium secalis) (Ta-ble 2 and Fig. 1). One QTL (Rrsq1) was detected on chromosome 3 (3H) for latency period and lesion length only against isolate B9, whereas the other QTL (Rrsq2, on chromosome 7H) was identified for lesion length to both iso-lates. All alleles were contributed by L94. The total phenotypic variation ex-plained by the QTL detected for lesion length was 34.5% and 14% for isolate B9 and 13-13 respectively and the total phenotypic variation explained by the QTL detected for latency period was 22.9% (to B9 isolate). The total addi-tive effect explained by the QTL de-tected for lesion length was 39.6% and 12.2% for isolate B9 and 13-13 respec-tively and the total additive effect ex-plained by the QTL detected for latency period was 2.7% to B9 isolate.
dIscussIon
In the present work two QTL for par-tial resistance against Rhynchosporium secalis were detected, one on chromo-some 3H and one on 7H. These two QTL act differently and may corre-spond to different families of genes.Rrsq1 is a QTL that prolongs latency period and reduces lesion size, com-ponents of infection that, in this case,
Munqez Shtaya and Fernando Martínez,Identification of QTL...,H.U.R.J.,Vol.(5), , 49-62 ,2011
54
are not correlated. This suggests a pleiotropic effect of this QTL or, what seems also likely, the presence of two closely linked genes (Wagner et al., 2008). But the most remarkable fact is that Rrsq1 is only effective to isolate B9, which is inconsistent with the race nonspecific nature of the horizontal resistance (Van der Plank, 1968) and, hence, of the QTL. However, cases of isolate specificity of QTL for resistance have been found (Qi et al., 1999; Mar-cel et al., 2008). This fact may lead to a minor-gene-for-minor-gene interac-tion between the QTL of the plant and a gene factor conditioning aggressivity or “partial virulence” on the pathogen. Rrsq1, on chromosome 3H, was mapped at a region where a QTL was detected in the same population for par-tial resistance to scald under field con-dition (Shtaya et al., 2006) and in three other mapping populations (Thomas et al., 1995; Spaner et al., 1998; Grøn-nerød et al., 2002, Hayes et al., 2001). Rrsq1 may be the same as the QTL re-ported by Shtaya et al., (2006) and the one by Grønnerød et al., (2002) since both Abyssinian and L94, also known as Abyssinian 1102, are of Ethiopian origin (Jørgensen, 1992).Rrsq2 behaves quite differently. It was effective only for one component of infection, lesion length, but, interest-ingly, again both isolates. Rrsq2 may correspond to the QTL for scald resist-ance, at seedling stage, detected in the ‘Ingrid’ x ‘Steudelli’ cross (Bjørnstad et al., 2004).Rrsq1 was mapped at a similar posi-tion as the complex locus, Rh(Rrs1)-Rrs3-Rrs4, for scald resistance (Graner
and Tekauz, 1996) whereas Rrsq2 was mapped at a similar position as the locus Rrs2 for scald resistance (Chelkowski et al., 2003). These cases of co-location with major genes, not very common, may suggest that some QTL are actu-ally alleles of known major R genes (Bjørnstad et al., 2004), although a complex locus where R genes and QTL cluster may be feasible as well.The present study demonstrated that this population segregated for at least two QTL for scald resistance under controlled glasshouse conditions. It would be interesting to determine their mode of action of the pathogen in order to decide whether they may constitute a separate class of genes for partial re-sistance.
The authors acknowledge financial sup-port of the COST 860 (SUSVAR) from the EU through the STSM (Short Term Scientific Mission) programme to carry out this work.
AcKnowledgeMents
Munqez Shtaya and Fernando Martínez,Identification of QTL...,H.U.R.J.,Vol.(5), , 49-62 ,2011
55
reFerences
1. Bjørnstad, Å., Grønnerød, S., Mac Key, J., Tekauz, A., Crossa J., and Mar-tens, H. (2004) Resistance to barley scald (Rhynchosporium secalis) in the Ethiopian donor lines ‘Steudelli’ and ‘Jet’, analyzed by partial least squares regression and interval mapping. he-reditas, 141, 166-179. 2. Chelkowski, J., Tyrka, M. and Sob-kiewicz, A. (2003) Resistance genes in barley (Hordeum vulgare L.) and their identification with molecular markers. Journal of Applied genetics, 44, 291-309.3. Gilmour, J. (1973) Octal notation for designating physiologic races of plant pathogens. Nature, 242, 620-620. 4. Goodwin, S. B., Allard, R. W. and Webster, R. K. (1990) A nomenclature for Rhynchosporium secalis patho-types. Phytopathology, 80, 1330-1336.5. Graner, A., Jahoor, A., Schondel-maier, J., Siedler, H., Pillen, K., Fis-chbeck, G., Wenzel, G. and Herrmann, R. G. (1991) Construction of an RFLP map of barley. theoretical and Ap-plied genetics, 83, 250–256.6. Graner, A., and Tekauz, A. (1996) RFLP mapping in barley of a domi-nant gene conferring resistance to scald (Rhynchosporium secalis). theoretical and Applied genetics, 93, 421–4257. Grønnerød, S., Marøy, A. G., MacK-ey, J., Takauz, A., Penner G. and Bjørn-stad, A. (2002) Genetic analysis of resistance to barley scald (Rhynchos-porium secalis) in the Ethiopian line ‘Abyssinian’ (CI668). euphytica, 126, 235–250.
8. Hayes, P. M., Castro, A., Marquez-Cedillo, L., Corey, A., Henson , C., Jones, B., Kling, J., Mather, D., Ma-tus, I., Rossi, C., and Sato, K. (2001) A summary of published barley QTL reports. http://barleyworld.org/north-americanbarley/qtlsummary.php.9. Jansen, R. C. and Stam, P. (1994) High resolution of quantitative traits into multiple loci via interval mapping. genetics, 136, 1447–145. 10. Jones, E. R. L. and Newton, A. C. (2005) Rhynchosporium of barley. United Kingdom Cereal Pathogen Vir-ulence Survey Annual Report for 2004. www.hgca.com 11. Jørgensen, J. H. (1992) Discovery, characterization and exploitation of Mlo powdery mildew resistance in bar-ley. euphytica, 63, 141–152.12. Kari, A. G. and Griffiths, E. (1997) Inheritance of components of partial re-sistance of barley to Rhynchosporium secalis with particular reference to race specificity. Annals of Applied biology, 131, 43-62.13. Marcel, T. C., Varshney, R. K., Bar-bieri, M., Jafary, .H, de Kock, M. J. D., Graner, A. and Niks, R. E. (2007) A high-density consensus map of barley to compare the distribution of QTLs for partial resistance to Puccinia hordei and of defence gene homologues. Theoreti-cal and Applied genetics, 114, 487–500.14. Marcel, T.C., Gorguet, B., Ta, T., Kohutova, Z., Vels A. and Niks, R.E. (2008) Isolate specificity of quantita-tive trait loci for partial resistance of barley to Puccinia hordei confirmed in mapping populations and near-isogenic lines. new Phytologist, 177, 743-755.
Munqez Shtaya and Fernando Martínez,Identification of QTL...,H.U.R.J.,Vol.(5), , 49-62 ,2011
56
15. Newton, A. C., Searle, J., Hackett, C. A., Cooke, D. E. L. (2001) Variabil-ity in pathotype, aggressiveness, RAPD profile, and rDNA ITS1 sequences of UK isolates of Rhynchosporium seca-lis. Journal of Plant disease and Pro-tection, 108, 446-458.16. Orr, D. D., and Turkington, T. K. (1997) Foliar disease development on Harrington barley, Lacombe 1997. Pest management research report-1997 growing season. Compiled for the Ex-pert Committee on Integrated Pest Management by Agriculture and Agri-Food Canada, Southern Crop Protec-tion and Food Research Centre, Lon-don ON N5V 4T3, Canada.17. Parlevliet, J. E. (1975) Partial re-sistance of barley to leaf rust, Puccinia hordei. I. Effect of cultivar and devel-opment stage on latent period. euphyt-ica, 24, 21–27.18. Qi, X., Stam, P. and Lindhout, P. (1998a) Use of locus specific AFLP markers to construct a high density mo-lecular map in barley. theoretical and Applied genetics, 96, 376–384.19. Qi, X., Niks, R. E., Stam, P. and Lindhout, P. (1998b.) Identification of QTLs for partial resistance to leaf rust (Puccinia hordei) in barley. theoretical and Applied genetics, 96, 1205–1215.20. Qi, X., Jiang, G., Chen, W., Niks, R. E., Stam, P. and Lindhout, P. (1999) Isolate-specific QTLs for partial resist-ance to Puccinia hordei in barley. the-oretical and Applied genetics, 99, 877-884.21. Robinson, J., Jalli, M. and Lindqvist, H. (1997) Resistance to Rhynchospori-um secalis in six Nordic barley geno-types. Plant breeding, 116, 101-103.
22. Rowling, R. H. D., and Jones, D. G. (1976) The reaction of three spring barley varieties exposed to epidemics of Rhynchosporium secalis of varying intensity and duration. Journal of Ag-riculture science, 87, 643–647.23. Spaner, D., Shugar, L. P., Choo, T. M., Falak, I., Briggs. K. G., Legge, W. G., Falk, D. E., Ullrich, S. E., Tinker, N. A., Steffenson, B. J. and Mather, D. E. (1998) Mapping of disease resistance loci in barley on the basis of visual as-sessment of naturally occurring symp-toms. crop science, 38, 843–850.24. Shtaya, M. J. Y., Marcel, T. C., Sil-lero, J. C., Niks R. E. and Rubiales, D. (2006) Identification of QTLs for pow-dery mildew and scald resistance in barley. euphytica, 151, 421–429.25. Thomas, W. T. B., Powell, W., Waugh, R., Chalmers, K. J., Barua, U. M, Jack, P., Lea, V., Forster, B. P., Swanston, J. S., Ellis, R. P., Hanson P. R. and Lance, R. C. M. (1995) Detec-tion of quantitative trait loci for agro-nomic, yield, grain and disease charac-ters in spring barley (Hordeum vulgare L.). theoretical and Applied genet-ics, 91, 1037–1047.26. Turkington, T.K., Burnett, P. A., Briggs K. G. and Xi, K. (1998) Screen-ing for scald resistance for future Al-berta barley varieties. Alberta Barley Commission. Project No. 60-058, Final report.27. Van der Plank, J.E. (1968) disease resistance in plants. New York, USA. Academic Press.28. Van Ooijen, J. W. & C. Maliepaard, 1996. MAPQTL(™) version 3.0: soft-ware for the calculation of QTL posi-tions on genetic maps. CPRO-DLO,
Munqez Shtaya and Fernando Martínez,Identification of QTL...,H.U.R.J.,Vol.(5), , 49-62 ,2011
57
Wageningen. 29. Wagner, C., Schweizer, G. Krämer, M. Dehmer-Badani, A. G. Ordon F and Friedt W.(2008) The complex quantita-tive barley–Rhynchosporium secalis-interaction: newly identified QTL may represent already known resistance genes. Theoretical and Applied ge-netics, 118,113–12230. Xi, K., Turkington, T. K. Helm J. H. and Bos, C. (2002) Pathogenic vari-ation of Rhynchosporium secalis in Alberta. canadian Journal of Plant Pathology, 24, 176-163.31. Xue, G. and Hall, R. (1991) Com-ponents of parasitic fitness in Rhyn-chosporium secalis and quantitative resistance to scald in barley as deter-mined with a dome inoculation cham-ber. canadian Journal of Plant Pa-thology, 13, 19-25.32. Zhan, J., Fitt, B. D. L., Pinnschmidt, H. O., Oxley, S. J. P., Newton, A. C. (2008) Resistance, epidemiology and sustainable management of Rhynchos-porium secalis populations on barley. Plant Pathology, 57, 1-14.
Munqez Shtaya and Fernando Martínez,Identification of QTL...,H.U.R.J.,Vol.(5), , 49-62 ,2011
58
FIgure 2.
E35M54-222 E37M38-373 E33M55-410 E42M48-308 E37M32-288 GBM1121 P15M52-408 P14M56-80 E41M32-83 E42M51-85 E32M61-226 E41M40-118 E35M61-228 E42M32-324 E33M54-187 E33M55-109 E42M48-356 E41M32-492 E35M55-117 E38M54-390 Bmag0125 E37M33-162
mPau E33M58-224 P16M50-329 E33M61-227 E33M54-307 E42M51-101 P16M50-160 E38M54-134 E40M32-590 E38M54-176 E42M40-644 E37M33-501 E37M32-325 E33M55-297 E38M54-294 E42M48-376 P17M47-88
2(2H)
0 5 10 15 20 25 30 35 40 45 50 55 60 65 70 75 80 85 90 95 100 105 110 115 120 125 130 135 140 145 150 155 160 165 170 175 180 185 190
cM
E45M55-572 E41M32-149 E35M48-250 E37M33-583 E42M32-116 E45M55-167 E41M40-358 E38M54-315 P15M51-255 P15M51-342 E33M61-131 E37M32-471 E35M48-410 GBM1163 E42M40-445 E42M32-83 E37M32-145 P16M51-168 E33M58-81 E35M55-442 GBM1118 E33M55-398 E42M48-148 E38M55-262 E35M55-625 E33M61-200 HVM62 E42M32-146
3(3H)
P17M47-303 E33M55-508 P14M54-282 E35M54-93 E41M40-112 E42M51-267 E33M61-120 P17M47-226 E37M32-99 E35M61-432 P16M51-355 E42M32-195 P17M47-67 E35M55-458 E40M40-105 E39M61-372 E35M54-224 E35M55-450 P15M52-136 E40M38-363 GBM5225 E40M32-123 E33M61-173 E33M58-375 GBM1362 E40M32-168 E45M55-345 Bmac0156 E35M54-180 WBS107
1(7H)
Rrs2
Rrs1 5
Rrsq2
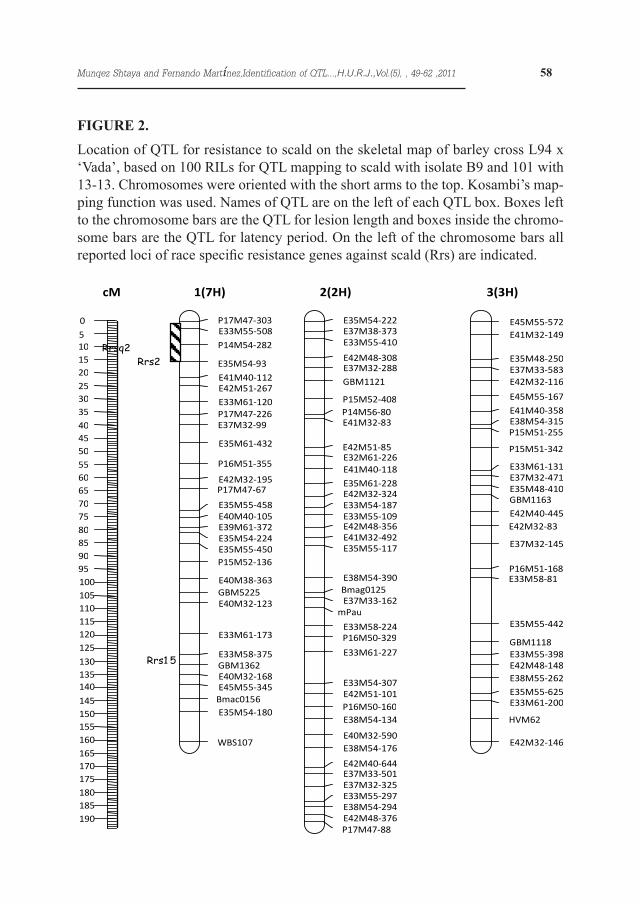
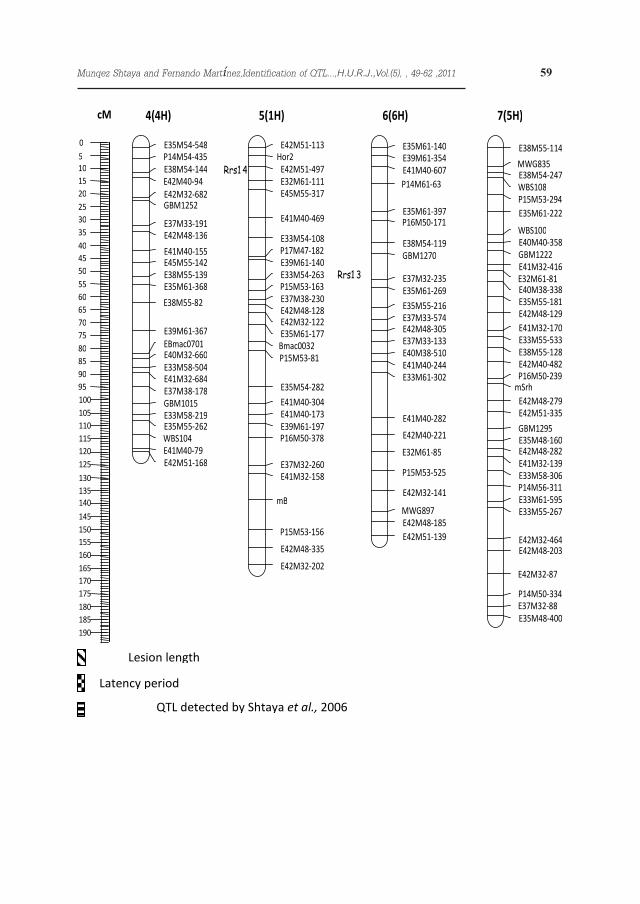
Location of QTL for resistance to scald on the skeletal map of barley cross L94 x ‘Vada’, based on 100 RILs for QTL mapping to scald with isolate B9 and 101 with 13-13. Chromosomes were oriented with the short arms to the top. Kosambi’s map-ping function was used. Names of QTL are on the left of each QTL box. Boxes left to the chromosome bars are the QTL for lesion length and boxes inside the chromo-some bars are the QTL for latency period. On the left of the chromosome bars all reported loci of race specific resistance genes against scald (Rrs) are indicated.
Munqez Shtaya and Fernando Martínez,Identification of QTL...,H.U.R.J.,Vol.(5), , 49-62 ,2011
59
7(5H)
E38M55-114 MWG835 E38M54-247 WBS108 P15M53-294 E35M61-222 WBS100 E40M40-358 GBM1222 E41M32-416 E32M61-81 E40M38-338 E35M55-181 E42M48-129 E41M32-170 E33M55-533 E38M55-128 E42M40-482 P16M50-239
mSrh E42M48-279 E42M51-335 GBM1295 E35M48-160 E42M48-282 E41M32-139 E33M58-306 P14M56-311 E33M61-595 E33M55-267 E42M32-464 E42M48-203 E42M32-87 P14M50-334 E37M32-88 E35M48-400
E42M51-113 Hor2
E42M51-497 E32M61-111 E45M55-317 E41M40-469 E33M54-108 P17M47-182 E39M61-140 E33M54-263 P15M53-163 E37M38-230 E42M48-128 E42M32-122 E35M61-177 Bmac0032 P15M53-81 E35M54-282 E41M40-304 E41M40-173 E39M61-197 P16M50-378 E37M32-260 E41M32-158
mB P15M53-156 E42M48-335 E42M32-202
5(1H)
Rrs1 4
E35M54-548 P14M54-435 E38M54-144 E42M40-94 E42M32-682 GBM1252 E37M33-191 E42M48-136 E41M40-155 E45M55-142 E38M55-139 E35M61-368 E38M55-82 E39M61-367 EBmac0701 E40M32-660 E33M58-504 E41M32-684 E37M38-178 GBM1015 E33M58-219 E35M55-262 WBS104 E41M40-79 E42M51-168
4(4H)
E35M61-140 E39M61-354 E41M40-607 P14M61-63 E35M61-397 P16M50-171 E38M54-119 GBM1270 E37M32-235 E35M61-269 E35M55-216 E37M33-574 E42M48-305 E37M33-133 E40M38-510 E41M40-244 E33M61-302 E41M40-282 E42M40-221 E32M61-85 P15M53-525 E42M32-141 MWG897 E42M48-185 E42M51-139
6(6H)
Rrs1 3
Lesion length
Latency period
QTL detected by Shtaya et al., 2006
0 5 10 15 20 25 30 35 40 45 50 55 60 65 70 75 80 85 90 95 100 105 110 115 120 125 130 135 140 145 150 155 160 165 170 175 180 185 190
cM
Munqez Shtaya and Fernando Martínez,Identification of QTL...,H.U.R.J.,Vol.(5), , 49-62 ,2011
60
Latency Period
13-13Latency
Period B9 Lesion size
13-13 Lieson size
B8DS021
1DS02110.02Lieson Size B9
10.200.31**Lesion size 13-131-0.130.04-0.26**Latency Period B9
10.38***-0.21*0.03-0.06 Latency Period13-3
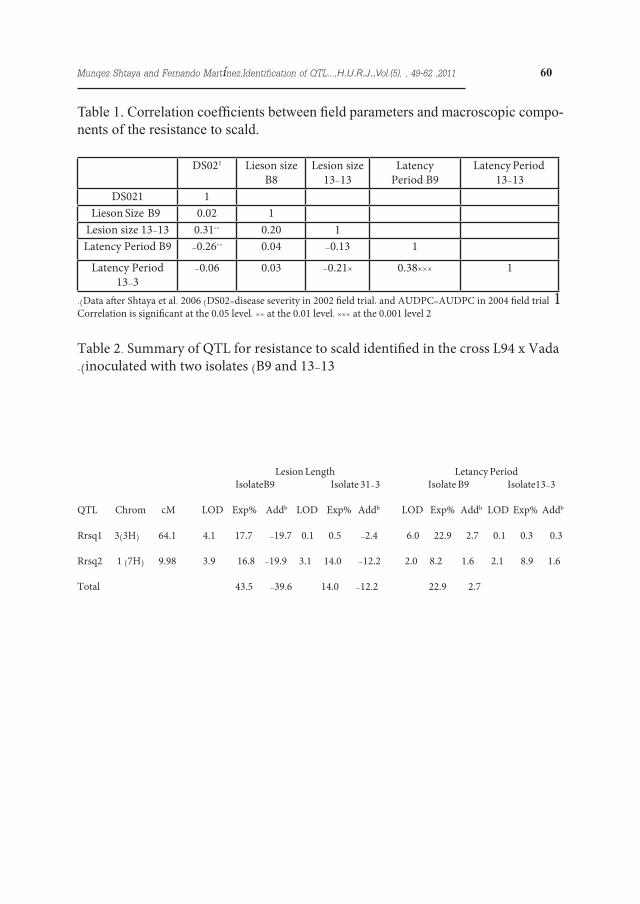
.)Data after Shtaya et al. 2006 )DS02=disease severity in 2002 field trial، and AUDPC=AUDPC in 2004 field trial 1Correlation is significant at the 0.05 level، ** at the 0.01 level، *** at the 0.001 level 2
Lesion Length Letancy Period IsolateB9 Isolate 31-3 Isolate B9 Isolate13-3 QTL Chrom cM LOD Exp% Addb LOD Exp% Addb LOD Exp% Addb LOD Exp% Addb
Rrsq1 3)3H( 64.1 4.1 17.7 -19.7 0.1 0.5 -2.4 6.0 22.9 2.7 0.1 0.3 0.3
Rrsq2 1 )7H( 9.98 3.9 16.8 -19.9 3.1 14.0 -12.2 2.0 8.2 1.6 2.1 8.9 1.6
Total 43.5 -39.6 14.0 -12.2 22.9 2.7
Table 2. Summary of QTL for resistance to scald identified in the cross L94 x Vada .)inoculated with two isolates )B9 and 13-13
Table 1. Correlation coefficients between field parameters and macroscopic compo-nents of the resistance to scald.
Munqez Shtaya and Fernando Martínez,Identification of QTL...,H.U.R.J.,Vol.(5), , 49-62 ,2011
61
Figure 1. Frequency distribution of individuals derived from a cross L94×Vada for resistance to scald. A and B represent lesion length and latency period of isolate B9 (85 RILs F9, L94 excluded because of complete resistance). C and D represent lesion length and latency period and of isolate 13-13 (98 RILs F9)
0 5
10 15 20 25 30 35
3 5 7 9 11 13 15
Vada A
number of lines
0 5
10 15 20 25
12.5 15 17.5 20 22.5 25 27.5
Vada B
Munqez Shtaya and Fernando Martínez,Identification of QTL...,H.U.R.J.,Vol.(5), , 49-62 ,2011
62
0
5
10
15
20
25
30
<4 5 6 7 8 >9
Lesion length (mm)
Num
ber o
f lin
es
L94 VadaC
0
5
10
15
20
25
<15 17.5 20 22.5 25 27.5 >27.5
Latency period (days)
Vada L94D
Munqez Shtaya and Fernando Martínez,Identification of QTL...,H.U.R.J.,Vol.(5), , 49-62 ,2011